 Xuwei Zhou
 Jie Cheng
 Luchao She
 Guangming Fan
- Fundamental Science on Nuclear Safety and Simulation Technology Laboratory, Harbin Engineering University, Harbin, China
In this paper, RELAP5 code was selected to study the measuring characteristics of the double reference tube level gauge, which is commonly used in high temperature and high pressure vessels on marine nuclear power platforms, under steady and transient depressurization conditions. The response characteristics of water-level gauge, influenced by the reference cup supply water flow rate under the condition of rapid depressurization, is discussed. Measurement error and accuracy of the water-level measuring device are analyzed under both steady and transient conditions. The simulation results indicate that the relative error of the double reference tube level gauge is about 0.79% in steady state, while the measurement error is too large to accurately obtain the level in the vessel under the transient depressurization condition. However, the relative measurement error can reach about 10% under the condition of a small depressurization rate.
Introduction
The water-level is crucial for some high temperature and high-pressure equipment of the PWR primary system, such as the steam generator and pressurizer. The water-level control is accomplished by the water-level control system, and the output signal of the water-level measurement system is frequently the input signal of the water-level control system (Zhang and Hu, 2012; Zhang et al., 2012; Salehi et al., 2018). It has been found that the accuracy and dynamic characteristics of the water-level measurement system directly affect the control effect of the water-level control system.
Generally, there are many kinds of water-level measuring devices, including waveguide acoustic water-level meter, ultrasonic water-level meter, capacitance water-level meter, differential pressure water-level gauge, etc. The sound pressure wave generated by water boiling is decomposed by the waveguide acoustic wave water-level meter to obtain the level, but it is limited to the measurement of the boiling water-level (Singh and Mohanty, 2018). The time interval and energy loss between the transmitted sound wave and the reflected sound wave are used by the ultrasonic water-level meter to obtain the level, but there may be a measurement blind zone in a vessel with a complex shape, and it is greatly affected by temperature and water mist (Soltz, 1984; Melnikov and Khokhlov, 1997; Lee et al., 2005; Mel’nikov et al., 2016). The capacitance of the capacitive water-level meter vary with the change of the water-level. This feature is used to obtain the water-level, but its load capacity is weak. The measurement accuracy is not high enough, because it will be disturbed by parasitic capacitance. The dielectric constant will change with temperature, and it is necessary to perform temperature compensation or reduce the distance between two electrodes (Zhang and Liu, 2013; Jin et al., 2015; Paczesny et al., 2015; Rizi and Abadi, 2017). The difference in heat exchange capacity between liquid and gas can also be used to obtain the level, but this measurement method has a long response time and is still immature (Petrie and Mcduffee, 2018). In addition, the dynamic tube pressure method is mainly used to measure the liquid level of molten salt (Kim et al., 2017).
In view of the limitations of the above liquid level measuring methods in application scenarios and some shortcomings in measurement, the differential pressure measurement system is still applied in nuclear power equipment for water-level measurement. The differential pressure measuring method can be divided into the external water-level measuring method and the internal water-level measuring method according to location of reference tube. The internal water-level measuring method requires two reference tubes; hence it is also called the double reference tube level gauge. When the external water-level measurement method is used for level measurement of marine high temperature and high pressure vessels, there are four influencing factors (1) the distance of the reference tube from the central axis of the vessel; (2) the radius of the vessel; (3) the density of the liquid; and (4) the inclination. The measurement error is very large (Lin, 1986). In order to improve the measurement accuracy of the differential pressure water-level gauge, some scholars have improved the structure of the level measurement device and developed the double reference tube level gauge (CGN Research Institute Co. Ltd., 2018a,b). The new type of water-level gauge can eliminate the influence of inclination angle, radius of vessel, and reduce the influence of density on the measurement results. In recent years, some researchers have found that the existence of gas in the measurement system will cause the fluctuation of the measuring value (Xiong and Zhou, 2016). For a marine steam generator, the load changes frequently and the amplitude is large. The liquid water in the level measuring device may flash evaporation to generate bubbles, which greatly affects the measurement accuracy and requires correction of the water-level measurement value (Li and Sun, 1997; Li and Jiao, 1999; Li et al., 2005).
Obviously, the accuracy of the measurement results will be affected by the existence of bubbles in the water-level measuring device. However, currently, there is no public literature focus on the measurement characteristics of the double reference tube level gauge under transient depressurization. The only related literature, mentioned that the relative error of its steady state measurement is approximately 2.0% (Lin, 1986).
The RELAP5 code has been developed for best-estimate transient simulation of light water reactor coolant systems during postulated accidents. A generic modeling approach is used that permits simulating a variety of thermal hydraulic systems. Nuclear power equipment such as a pressurizer and steam generator are allowed to be modeled using the RELAP5 code. In addition, the flow and heat transfer model in the RELAP5 code is suitable for analyzing the complicated single-phase flow, two-phase flow, and heat transfer process in this study (Wang et al., 2016). Moreover, the RELAP5 code has been used by some researchers to simulate the transient water-level of the AP1000 steam generator, and the results show that it is consistent with the actual situation (Jiang et al., 2013).
Therefore, in this paper, the RELAP5 code was selected to study the measuring characteristics of the double reference tube level gauge under steady state and transient depressurization conditions, and the code was used to explore the influence of changing the supply water flow on the measurement results under transient depressurization conditions as well.
Nomenclature
h Real water-level [m].
h∗ The water-level measured by double reference tube level gauge [m].
P Pressure of gas space in vessel [MPa].
A Valve flow area [m2].
AF Reynolds number independent forward flow energy loss coefficient.
AR Reynolds number independent reverse flow energy loss coefficient.
ΔP1 Pressure difference between pressure points A and B [MPa].
ΔP2 Pressure difference between pressure points B and C [MPa].
Density of water in the reference tube [kg/m3].
Density of water in measured vessel [kg/m3].
Density of steam in measured vessel [kg/m3].
g Gravity acceleration [m/s2].
H1 Total length of high reference cup and high reference tube [m].
H2 Total length of low reference cup and low reference tube [m].
H Height of liquid water in vessel [m].
Greek symbols
α Void fraction.
θ Inclination angle [rad].
Measurement Principle and Model
Measuring Principle
The structure of the double reference tube level gauge is shown in Figure 1. The lower part of the vessel is filled with water and the upper one is full of steam. The upper ends of the high and low reference tubes communicate with the high and low reference liquid cups, respectively, and the lower ends are closed. The high reference cup and low reference cup are continuously filled with water by the water injection pipeline to ensure that both the reference cup and the reference tube are full of water. There are two differential pressure transmitters (not shown); the press-leading tube of the first differential pressure transmitter is connected with the pressure tapping point A of the high reference tube and the pressure tapping point B of the low reference tube, respectively, and the press-leading tube of the second differential pressure transmitter is connected with the pressure tapping point B of the low reference tube and the pressure tapping point C of the vessel, respectively. The output signals of the two differential pressure transmitters are calculated by the divider to obtain the corresponding water-level value.
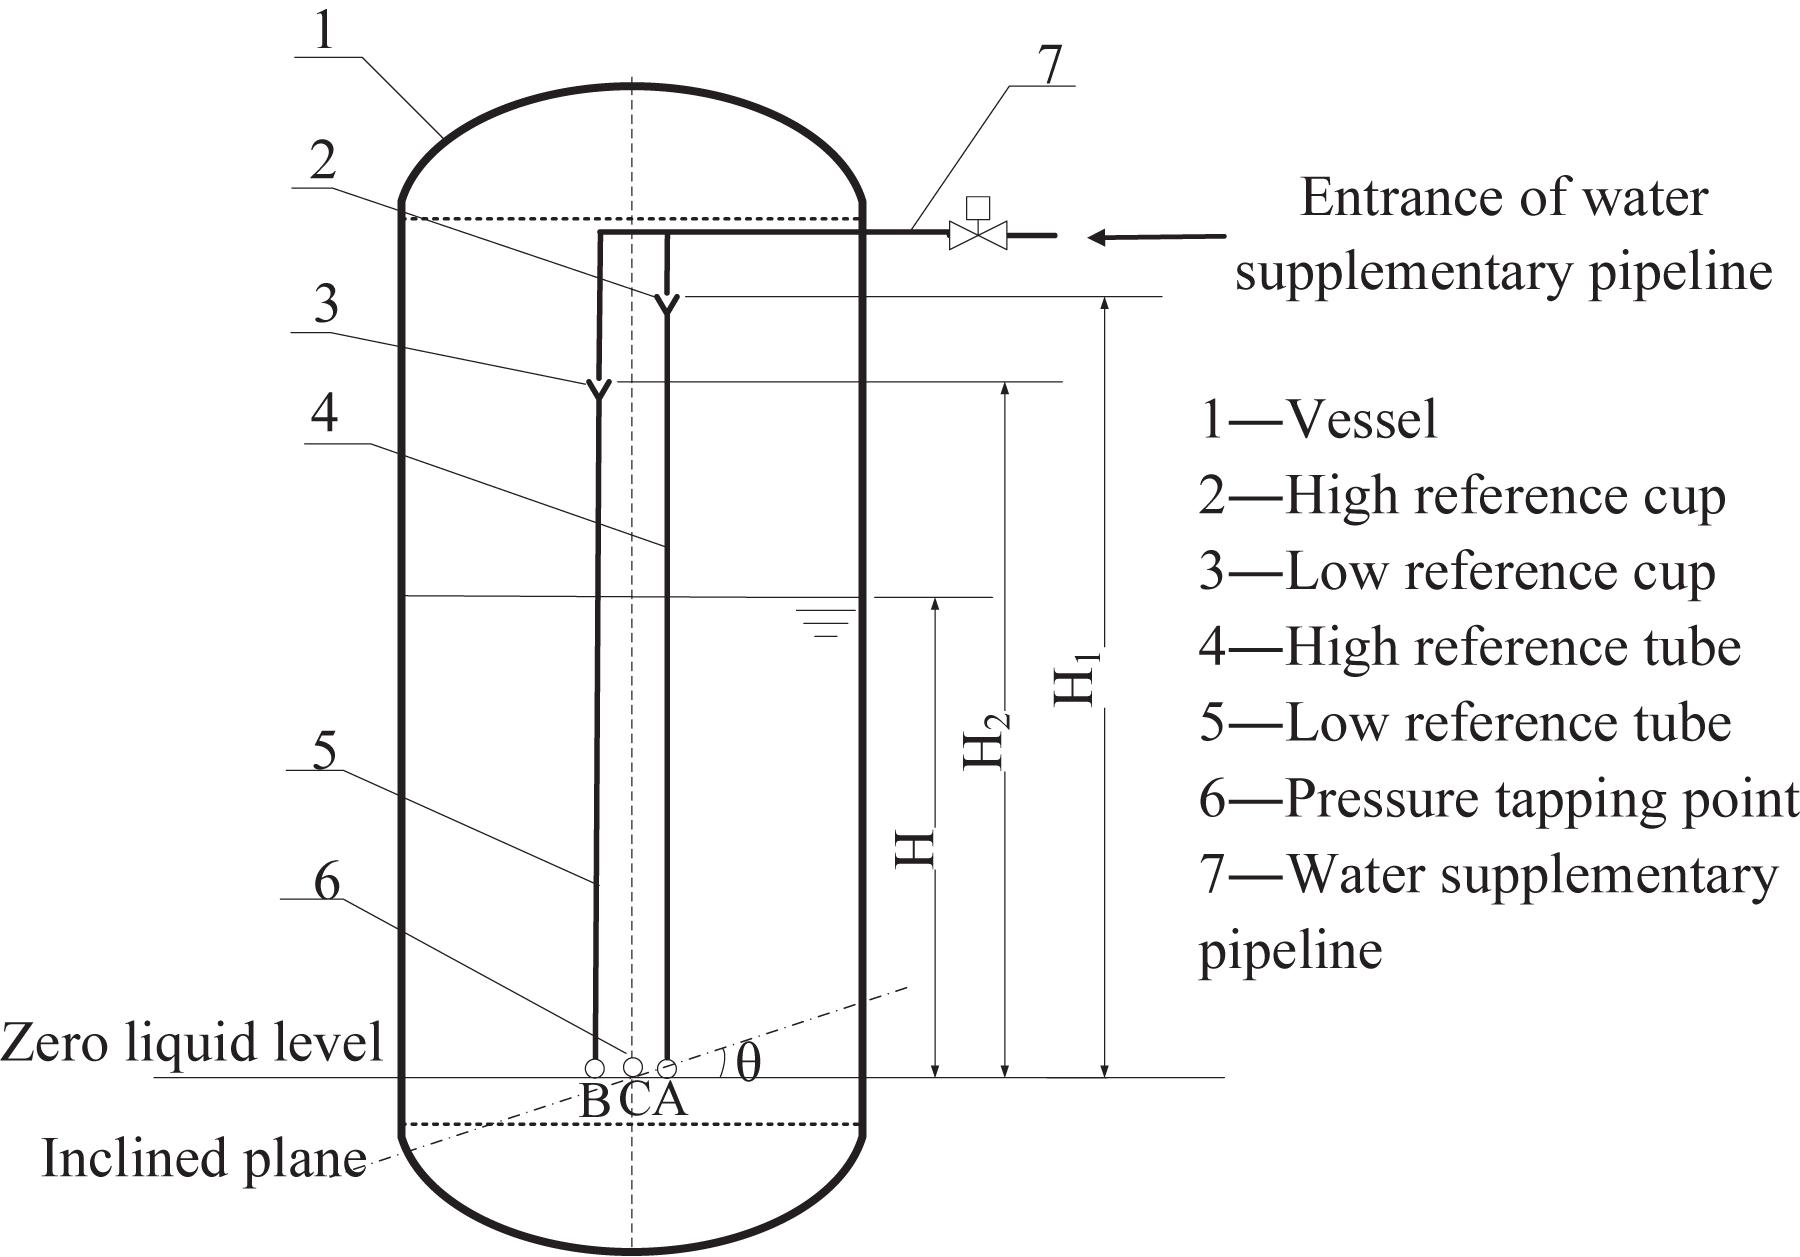
Figure 1. Structure diagram of level measurement system.
The following assumptions are adopted to derive the relationship between water-level and pressure difference:
(1) The density of steam and liquid water in the vessel remains the same everywhere;
(2) The density of liquid water in the reference tube remains the same everywhere;
(3) The device is inclined;
(4) The height difference between the pressure outlet of the reference tube and the differential pressure transmitter is ignored.
The density difference of liquid water inside and outside the reference tube is very small, which can be approximately regarded as equal, that is,
where and is the density of water in the reference tube and the density of water in the vessel, respectively. Then, the differential pressure of the differential pressure transmitter is ΔP1 and ΔP2, respectively.
where is the density of steam in the vessel. This g is the gravity acceleration. Here, H1, H2, and H are the total length of the high reference cup and high reference tube, total length of the low reference cup and low reference tube, and the height of liquid water in the vessel, respectively.
From the above two formulas, the formula of water-level height H in the vessel can be deduced as follows:
According to Eq. (4), the factors affecting the measurement results of the device include the differential pressure ΔP1 andΔP2, and the total height H1 and H2 of the reference cup and the reference tube.
Simulation Model and Parameters
In order to study the measuring characteristics of the double reference tube level gauge, the structure of the device is divided into nodes according to the RELAP5 modeling requirement.
The external supply water flows into the reference cups (nodes 220 and 320) through channels (nodes 594, 510, and 610). The reference cups (nodes 220 and 320) have a certain water storage capacity and can replenish water to the reference tubes (nodes 210 and 310) in time. The outer wall surface of the reference tubes (nodes 210 and 310, numbers 1–26 or 1–23 mean that the node is divided into 26 or 23 control volumes for more accurate calculation of flow and heat transfer) is provided with “heat structures” to simulate the convective heat transfer process with water and steam in the vessel. The heating area (node 110) in the vessel is provided with “heat structures” for simulating electric heating elements. The liquid water area (node 120) in the vessel can adjust the initial water-level by changing the parameters of the control volume. The steam space (node 130) communicates with the reference cups (nodes 220 and 320). The vessel upper head (node 140) is in communication with the pressure relief valve. The detailed RELAP5 node model of the water-level measurement device is shown in Figure 2. The detailed parameters of the water-level measurement system are shown in Table 1.
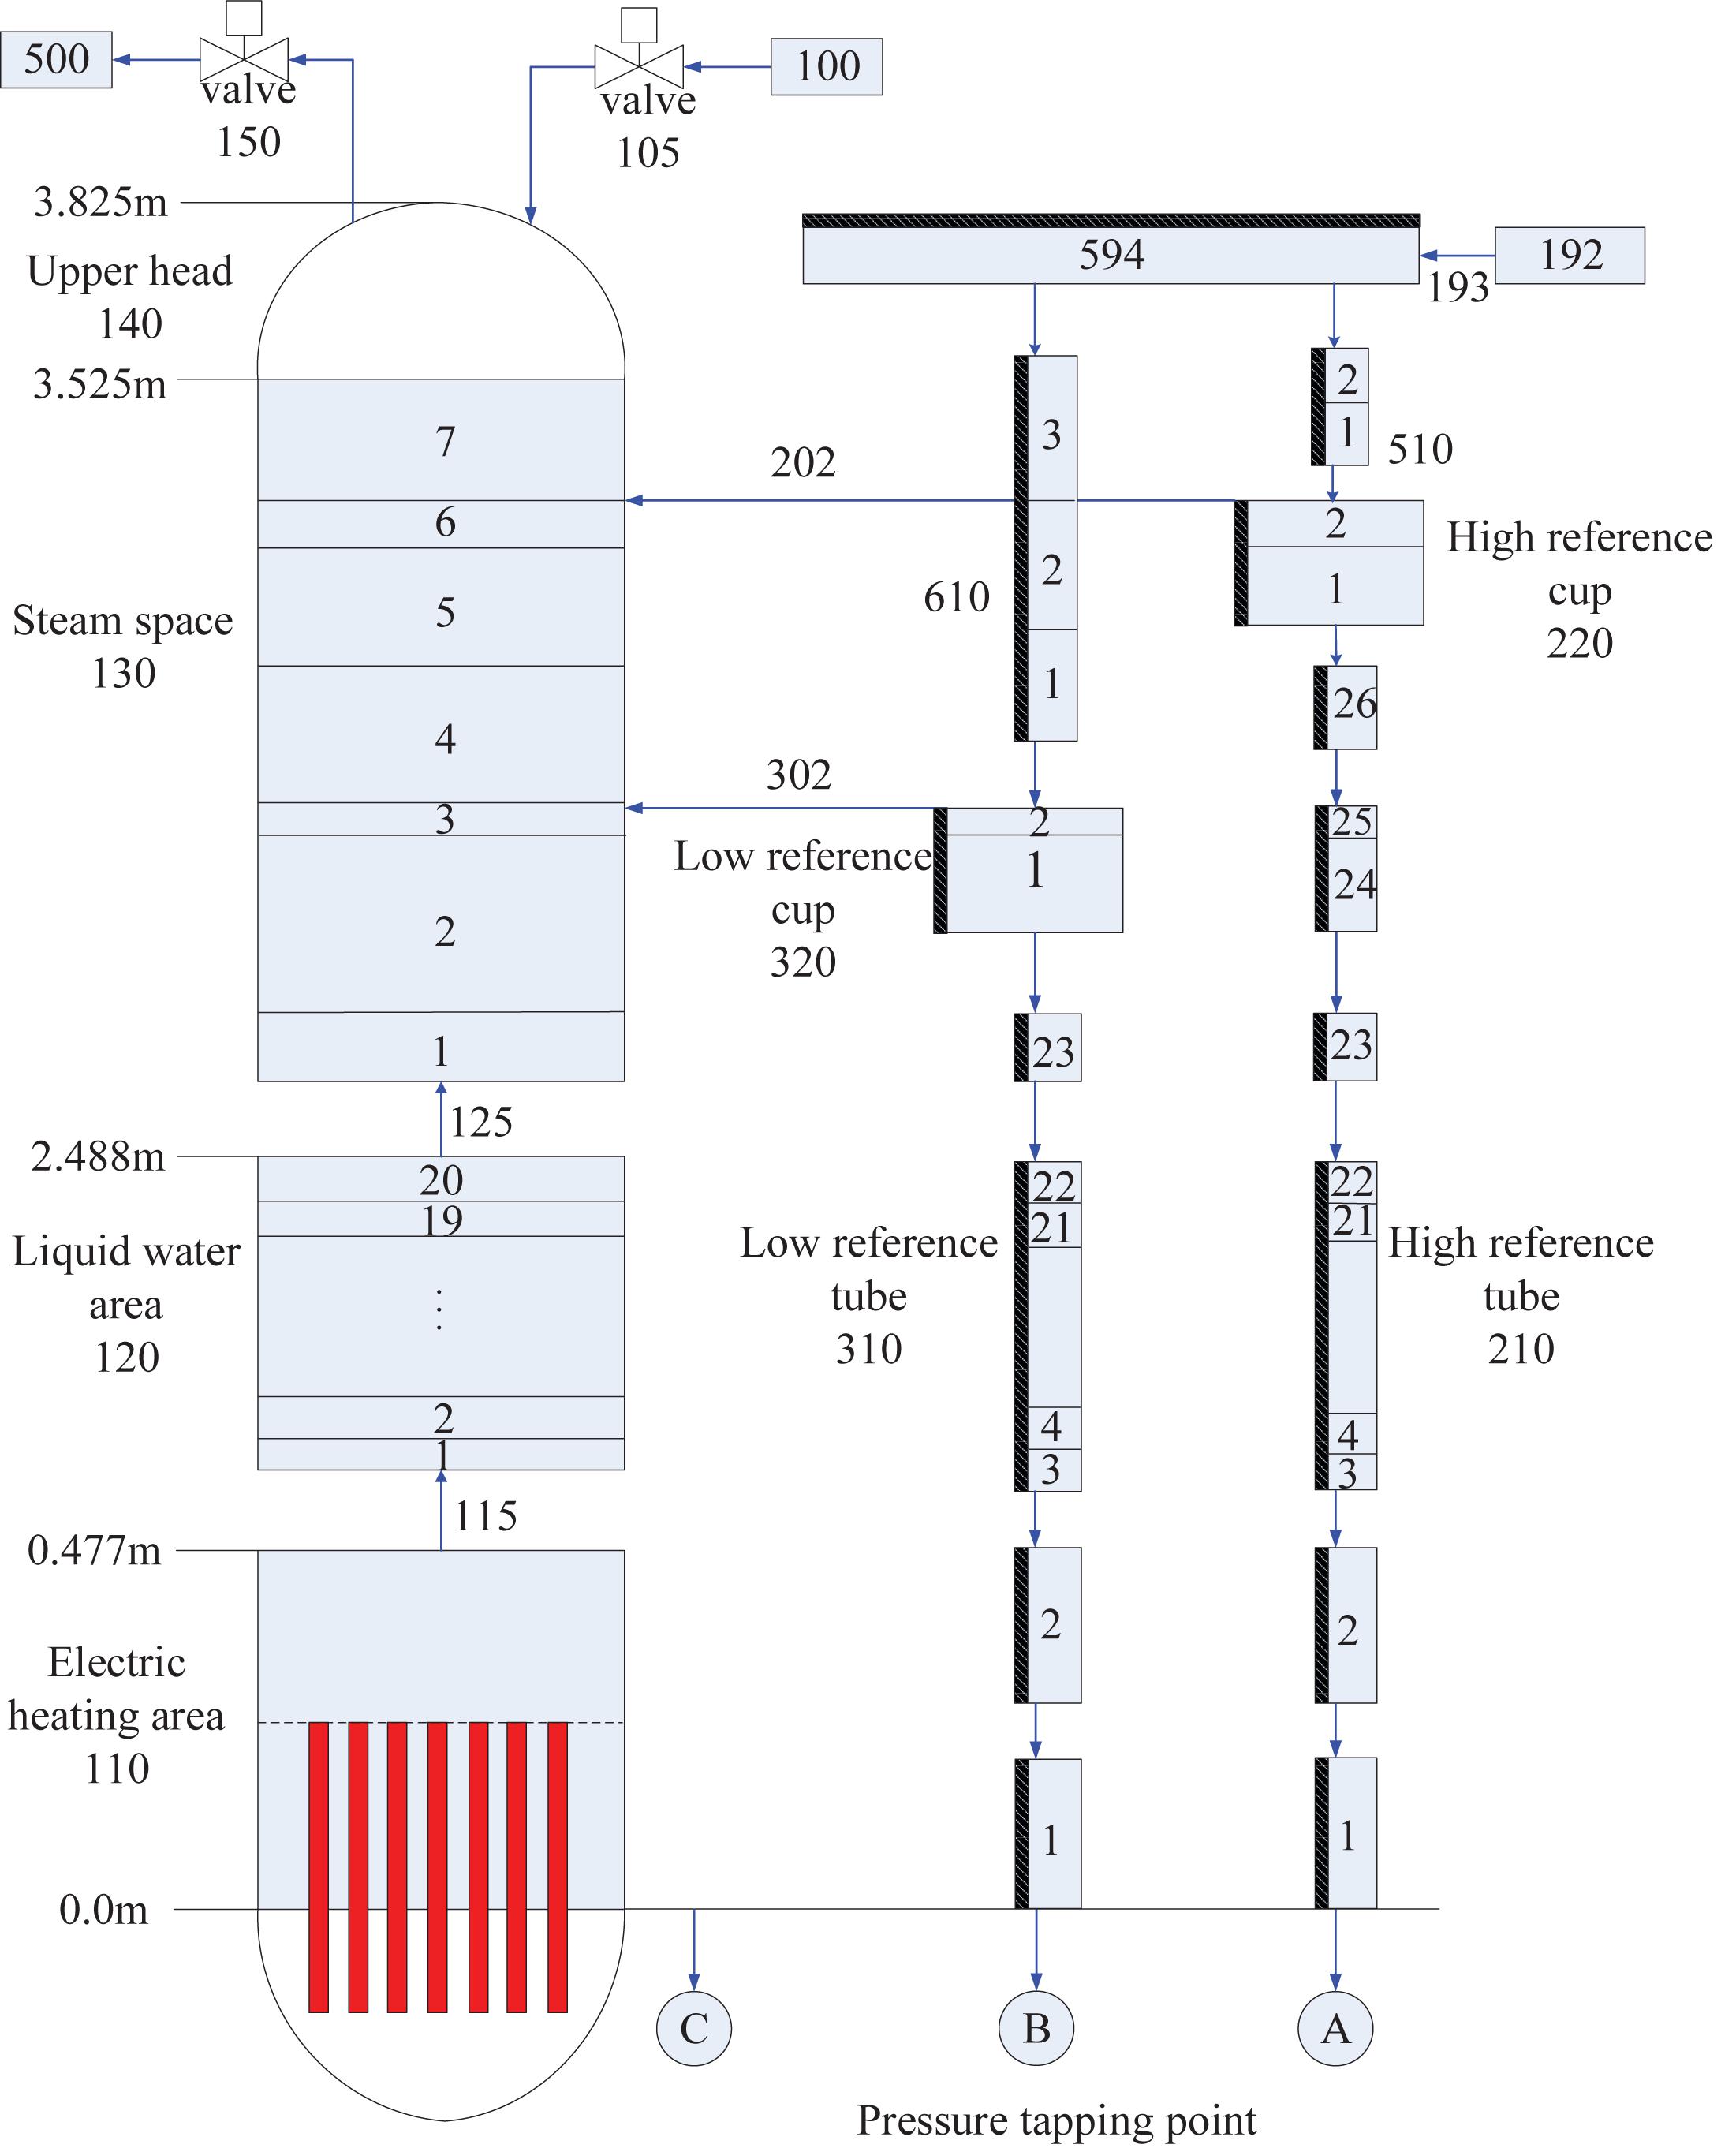
Figure 2. RELAP5 nodal model of the double reference tube level gauge.
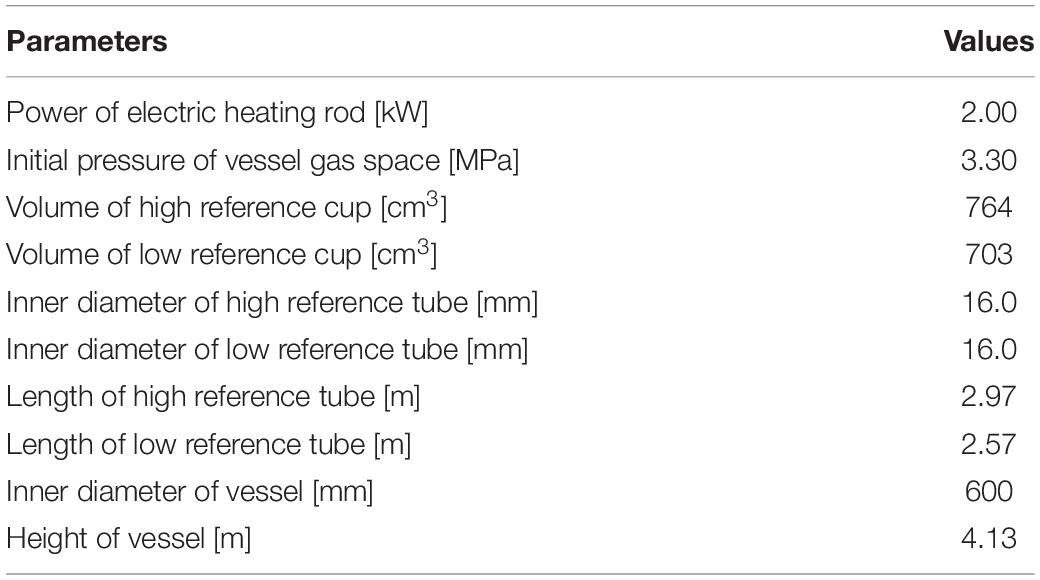
Table 1. Design parameters of the double reference tube level gauge.
Simulation Conditions
The depressurization rate is determined by adjusting the parameters of the pressure relief valve to study the change of the water-level measuring characteristics under transient conditions. The calculation conditions are shown in Table 2. For the double reference tube level gauge, 13 simulation conditions are set, including 1 steady state condition and 12 transient conditions.
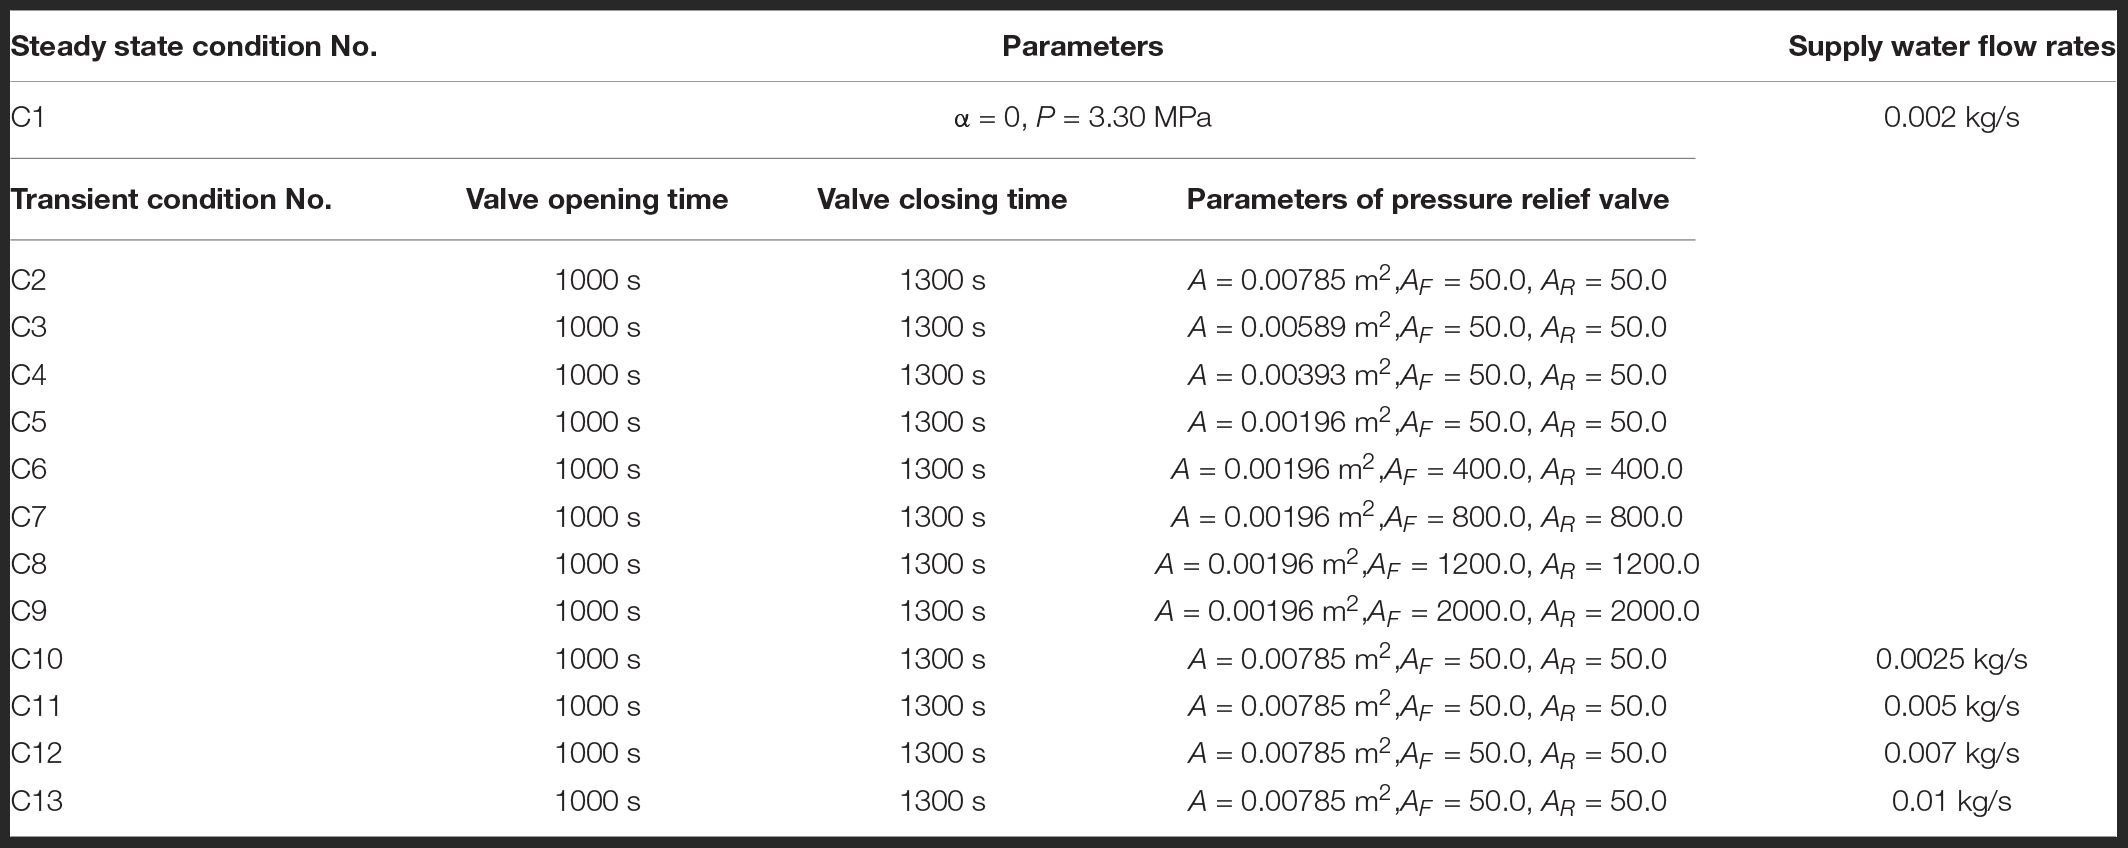
Table 2. Calculation condition parameters.
Analysis of Simulation Results
Measuring Characteristics Under Steady State Condition
During the steady state simulation, the reference cup and its reference tube are in a state of full water, and the time last for 1000–1300 s, as shown in Figure 3. Under steady state condition C1, the real water-level value is stable at 2.49 m, the measured value of the water-level meter is stable at 2.47 m, the measured value is always smaller than the real level, and the relative error is basically stable at 0.79%. In deriving formula (4), assuming that the water density in the reference tube is the same as the water density in the vessel, that is, , an error will be introduced. The density at the pressure tapping point of the differential pressure transmitter is shown in Figure 4. The density of the pressure tapping point C is slightly smaller than the pressure tapping points A and B since the static pressure of the pressure tapping point C is smaller than the pressure tapping points A and B.
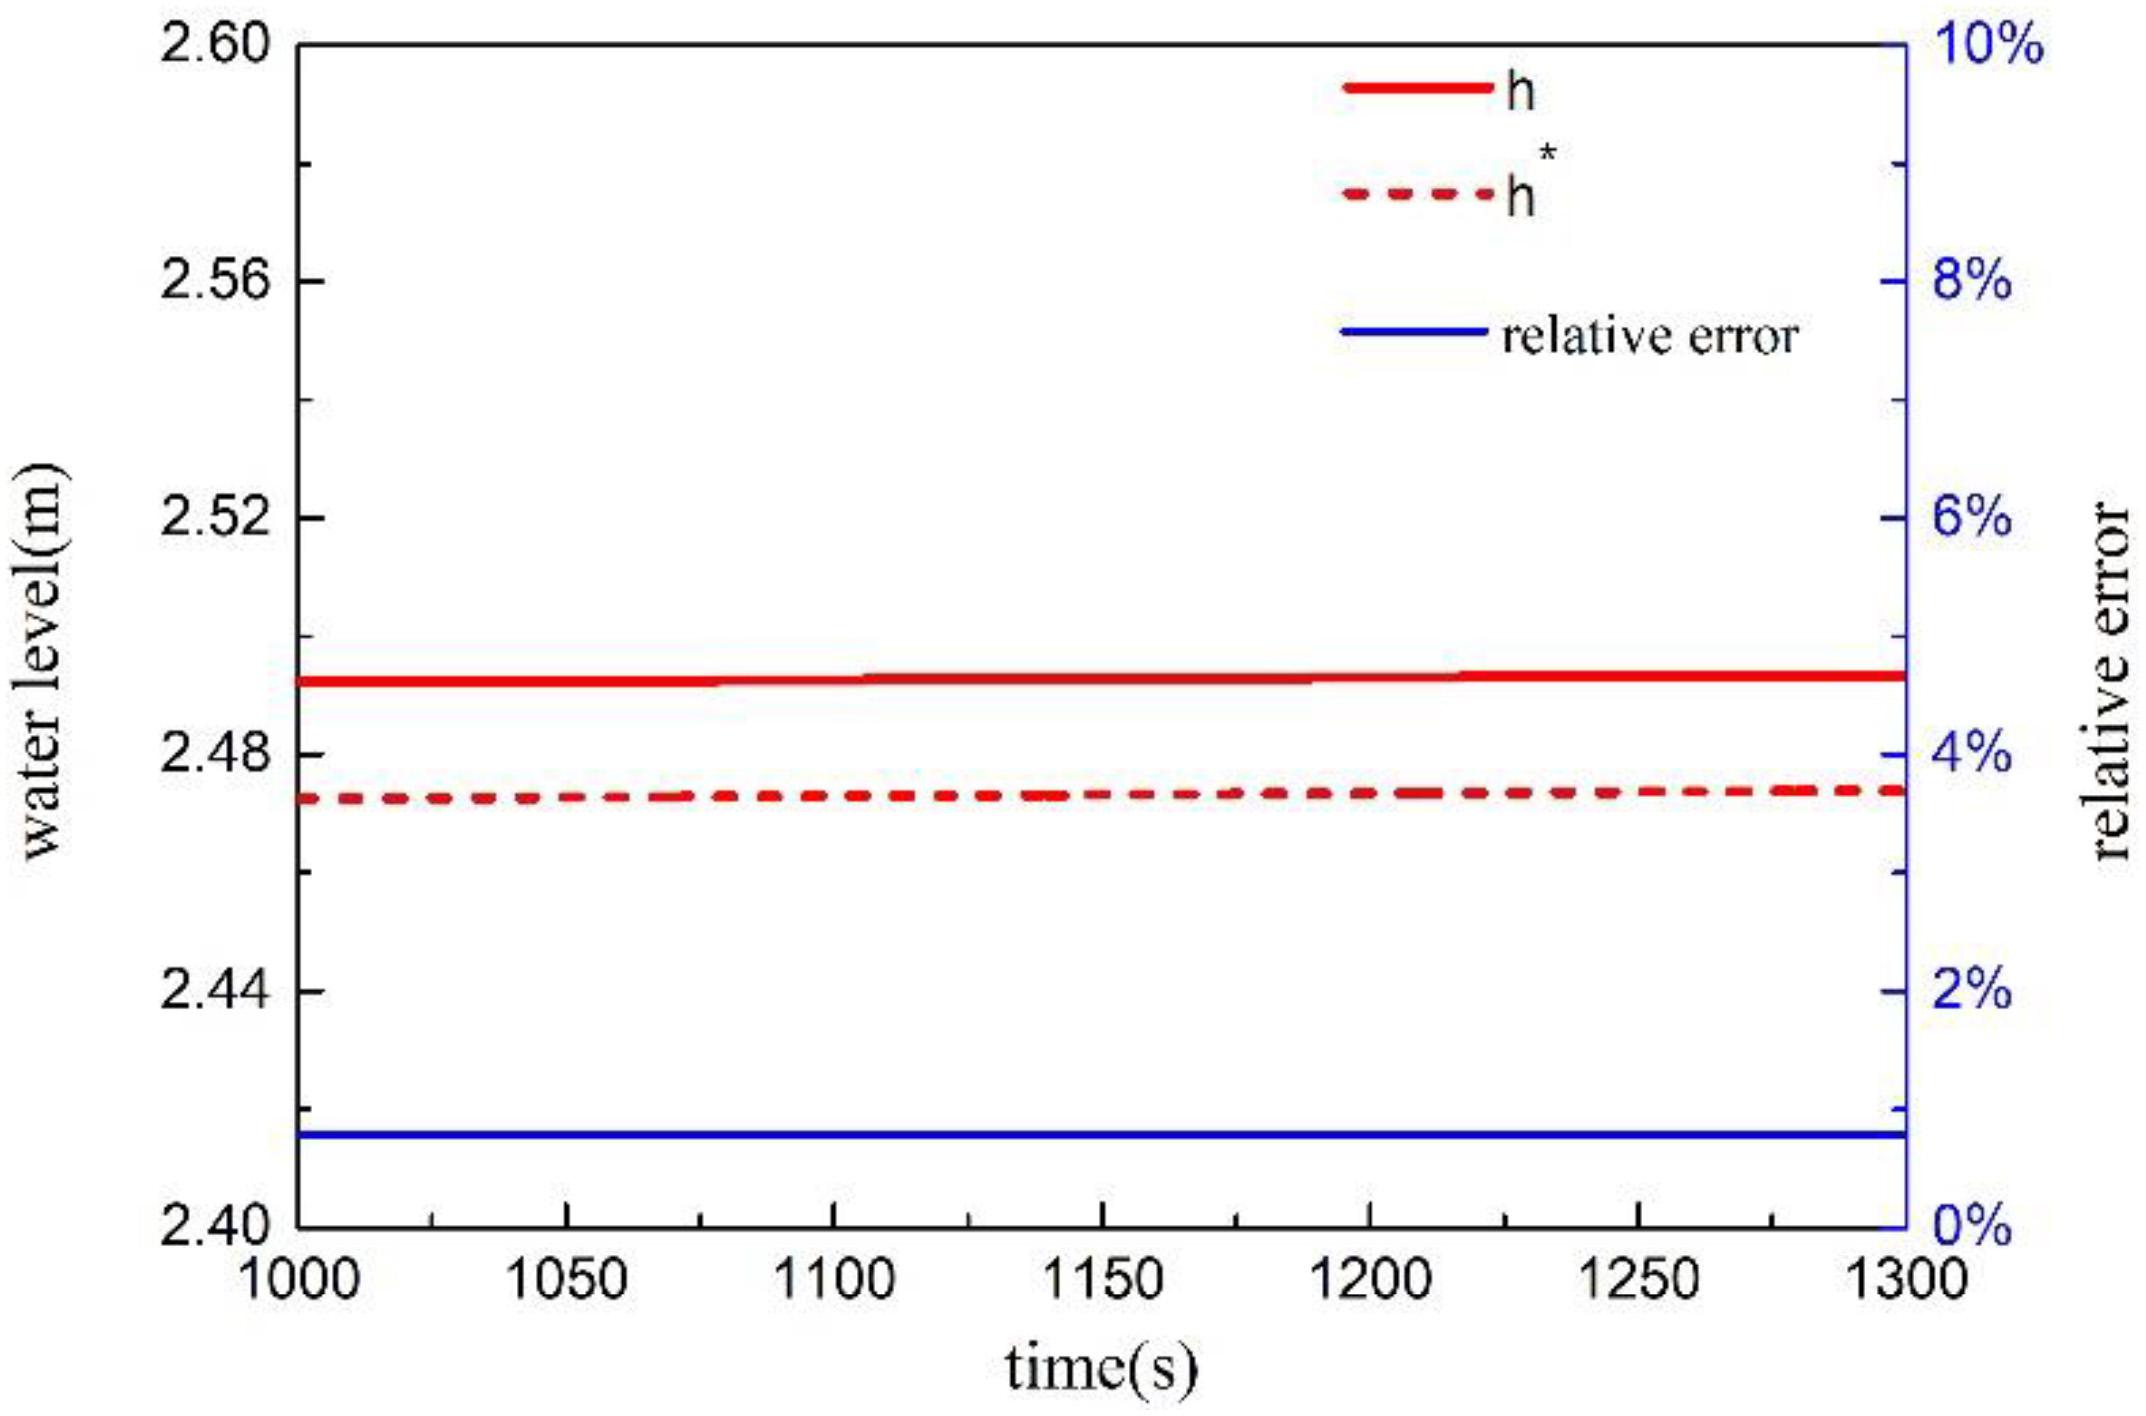
Figure 3. The relative measurement error under steady state conditions.
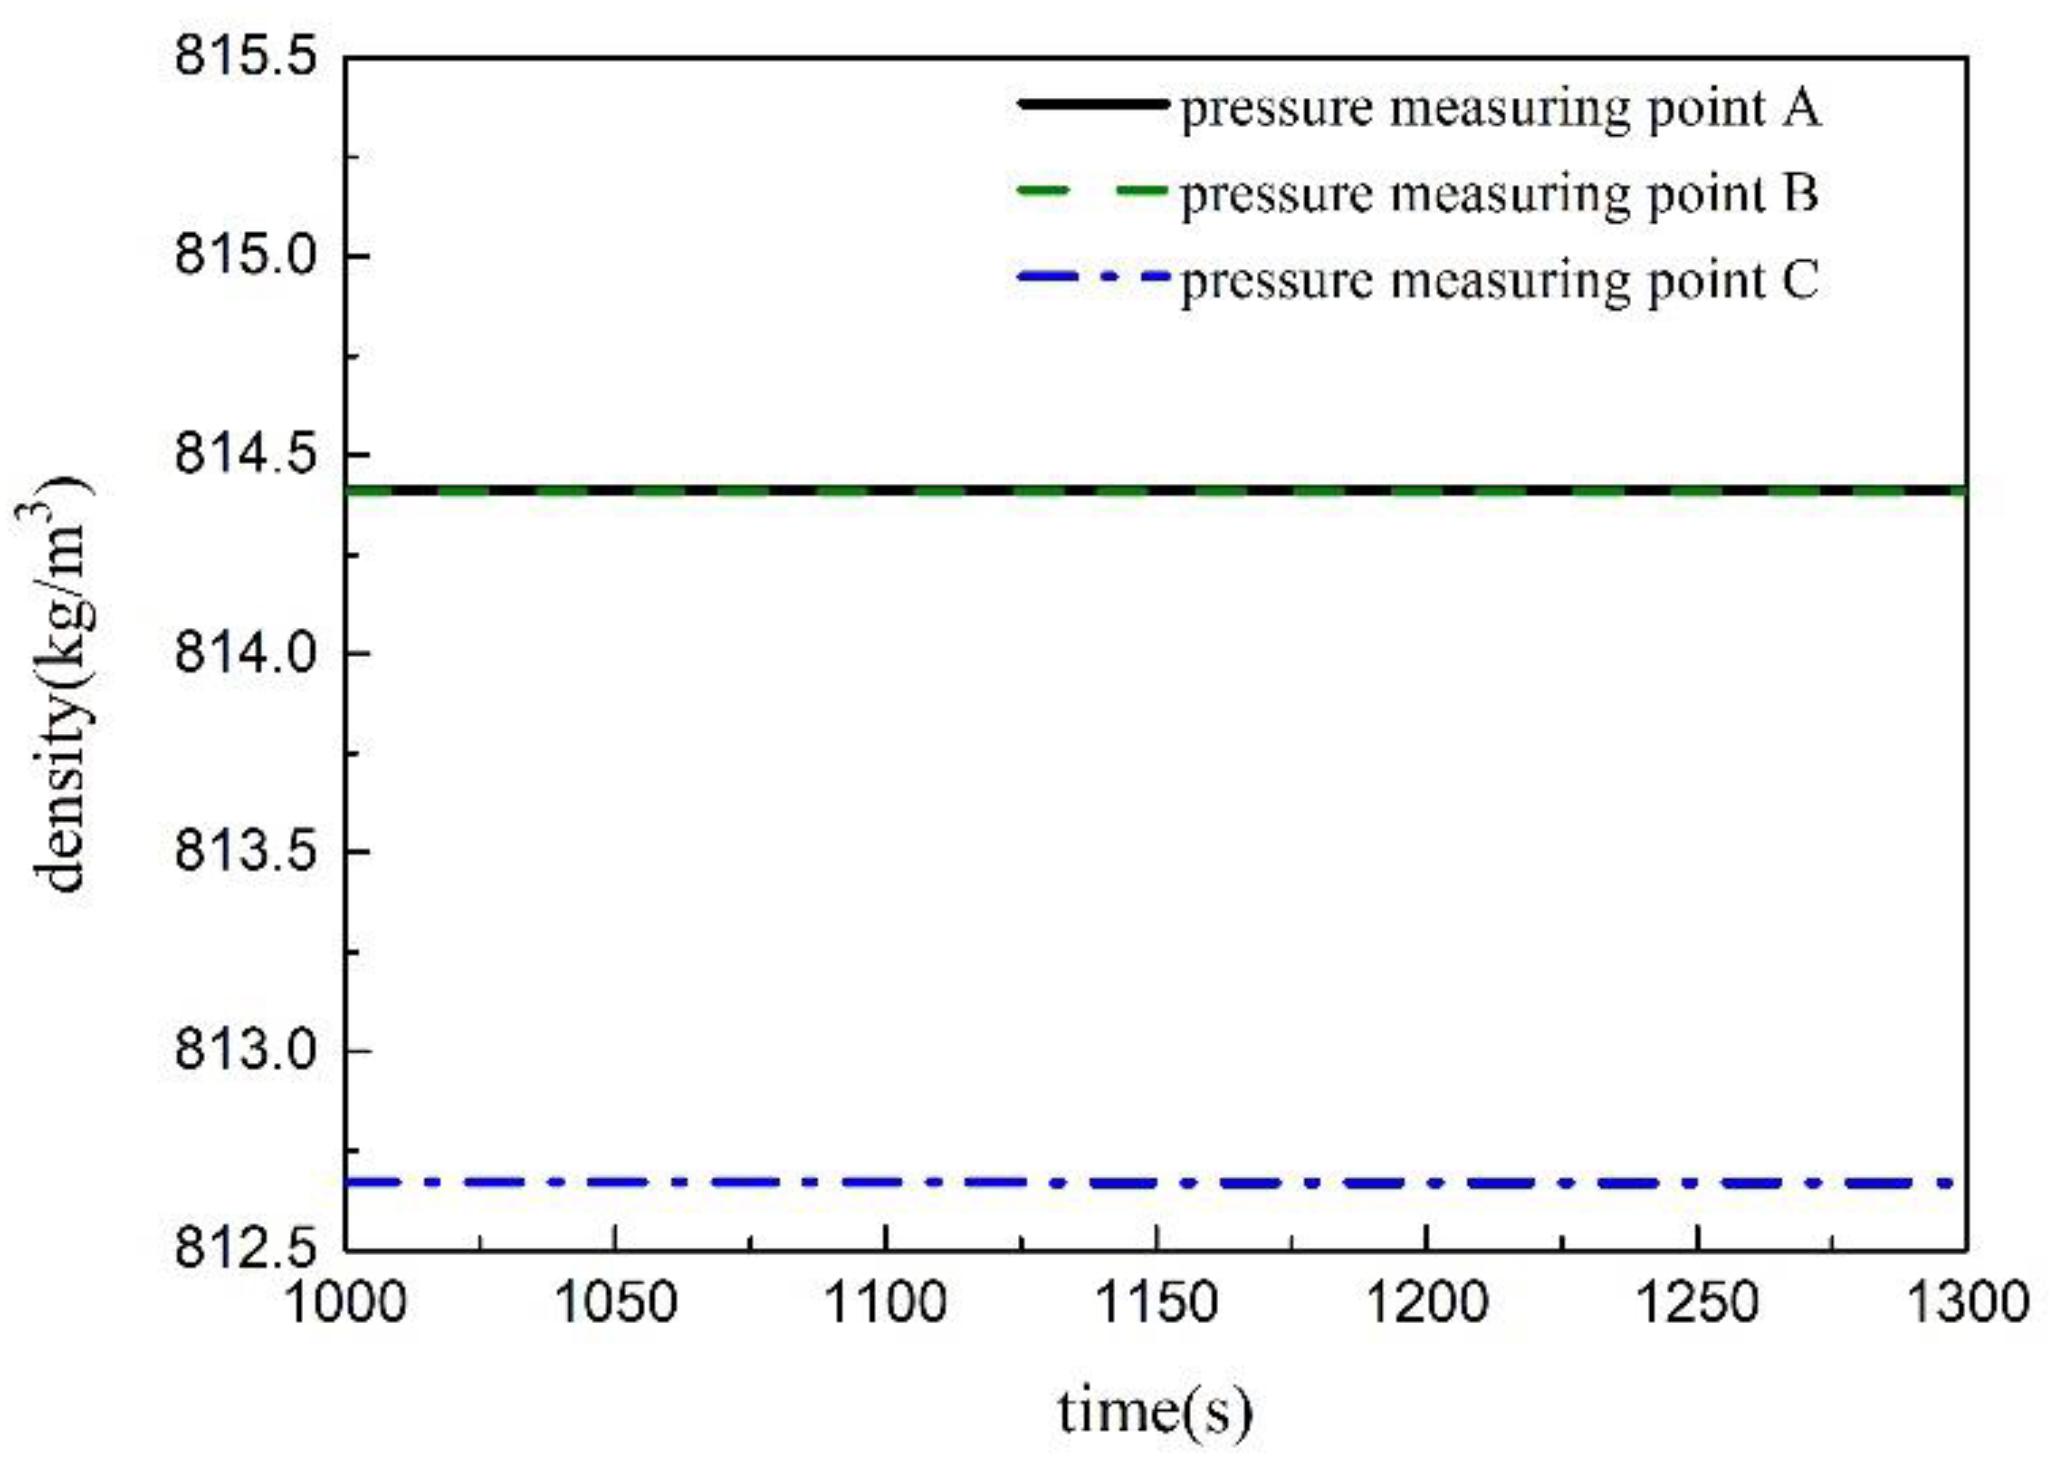
Figure 4. The density of pressure tapping point under steady state condition.
Measuring Characteristics During Rapid Depressurization
The void fraction at the bottom of the water space of the vessel under transient conditions is shown in Figure 5. The results of the RELAP5 code show that a large amount of bubbles will be generated in the water space and reach the peak quickly, then the proportion of bubbles will gradually decrease until the normal level is reached after the flashing under transient depressurization condition. The maximum void fraction at the bottom of the vessel will reach about 0.27 under the extreme depressurization condition C2. The peak value of void fraction will reach approximately 0.1 even under C5 condition with low depressurization rate. This will have a significant impact on the pressure measurement at pressure tapping point C, and then affect the measurement value of double reference tube level gauge.
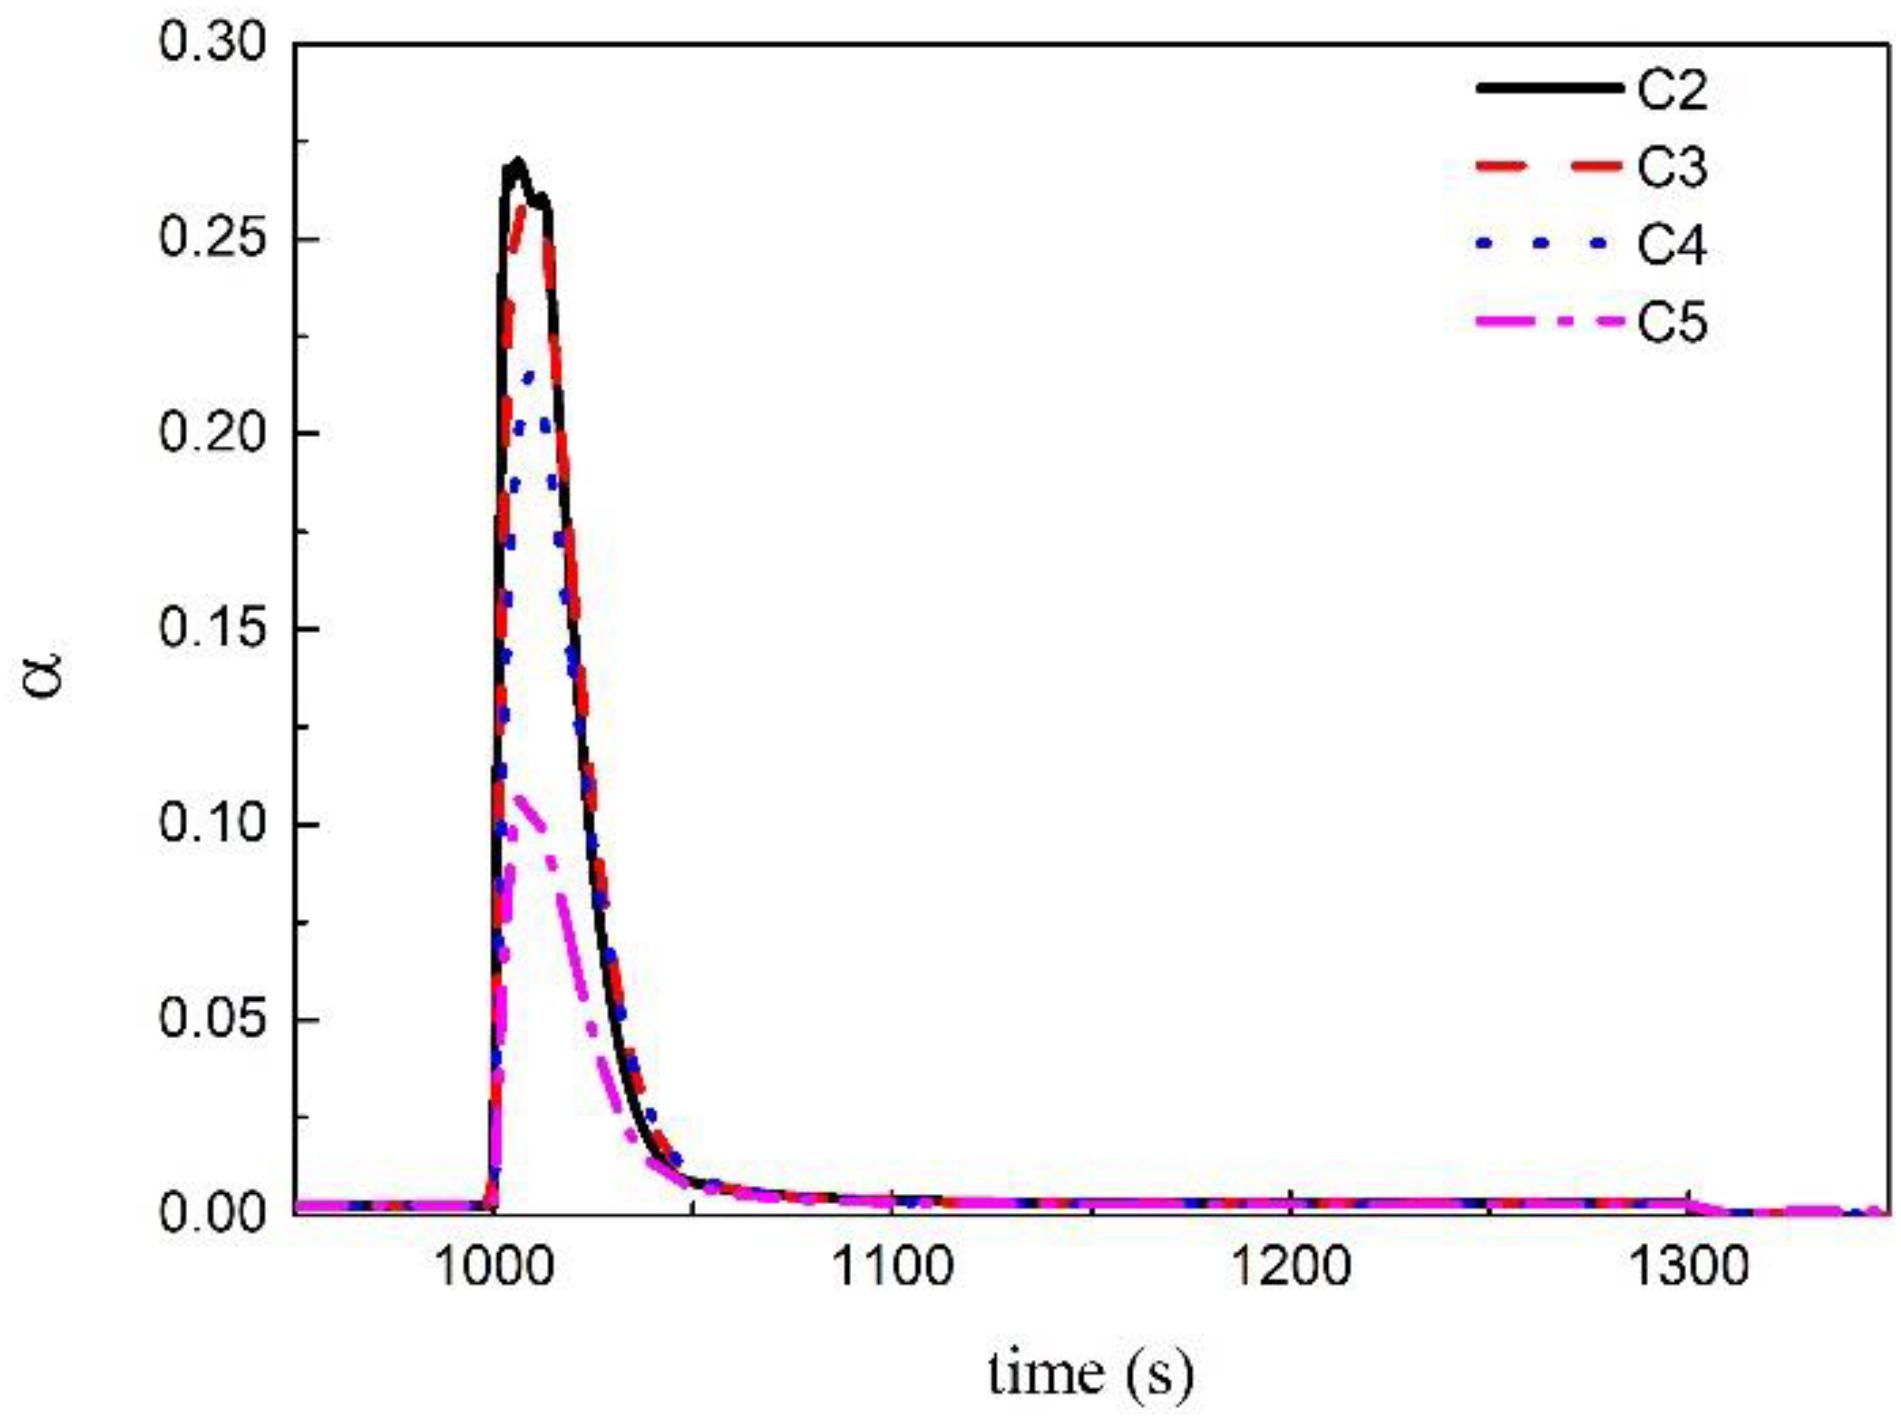
Figure 5. Void fraction at the bottom of water space under different conditions.
At 1011.8 s, the void fraction of water reaches the peak value, and the void fraction of each water volume at that time is shown in Figure 6. It can be found that the void fraction at the bottom is significantly lower than the upper part under transient conditions C4 and C5, a slow rising process is presented. The bottom of the water of the vessel is less affected by the pressure drop. However, the change of the void fraction in the axial direction is small under transient conditions C2 and C3, indicating that the entire vessel’s water space has experienced severe flash evaporation.
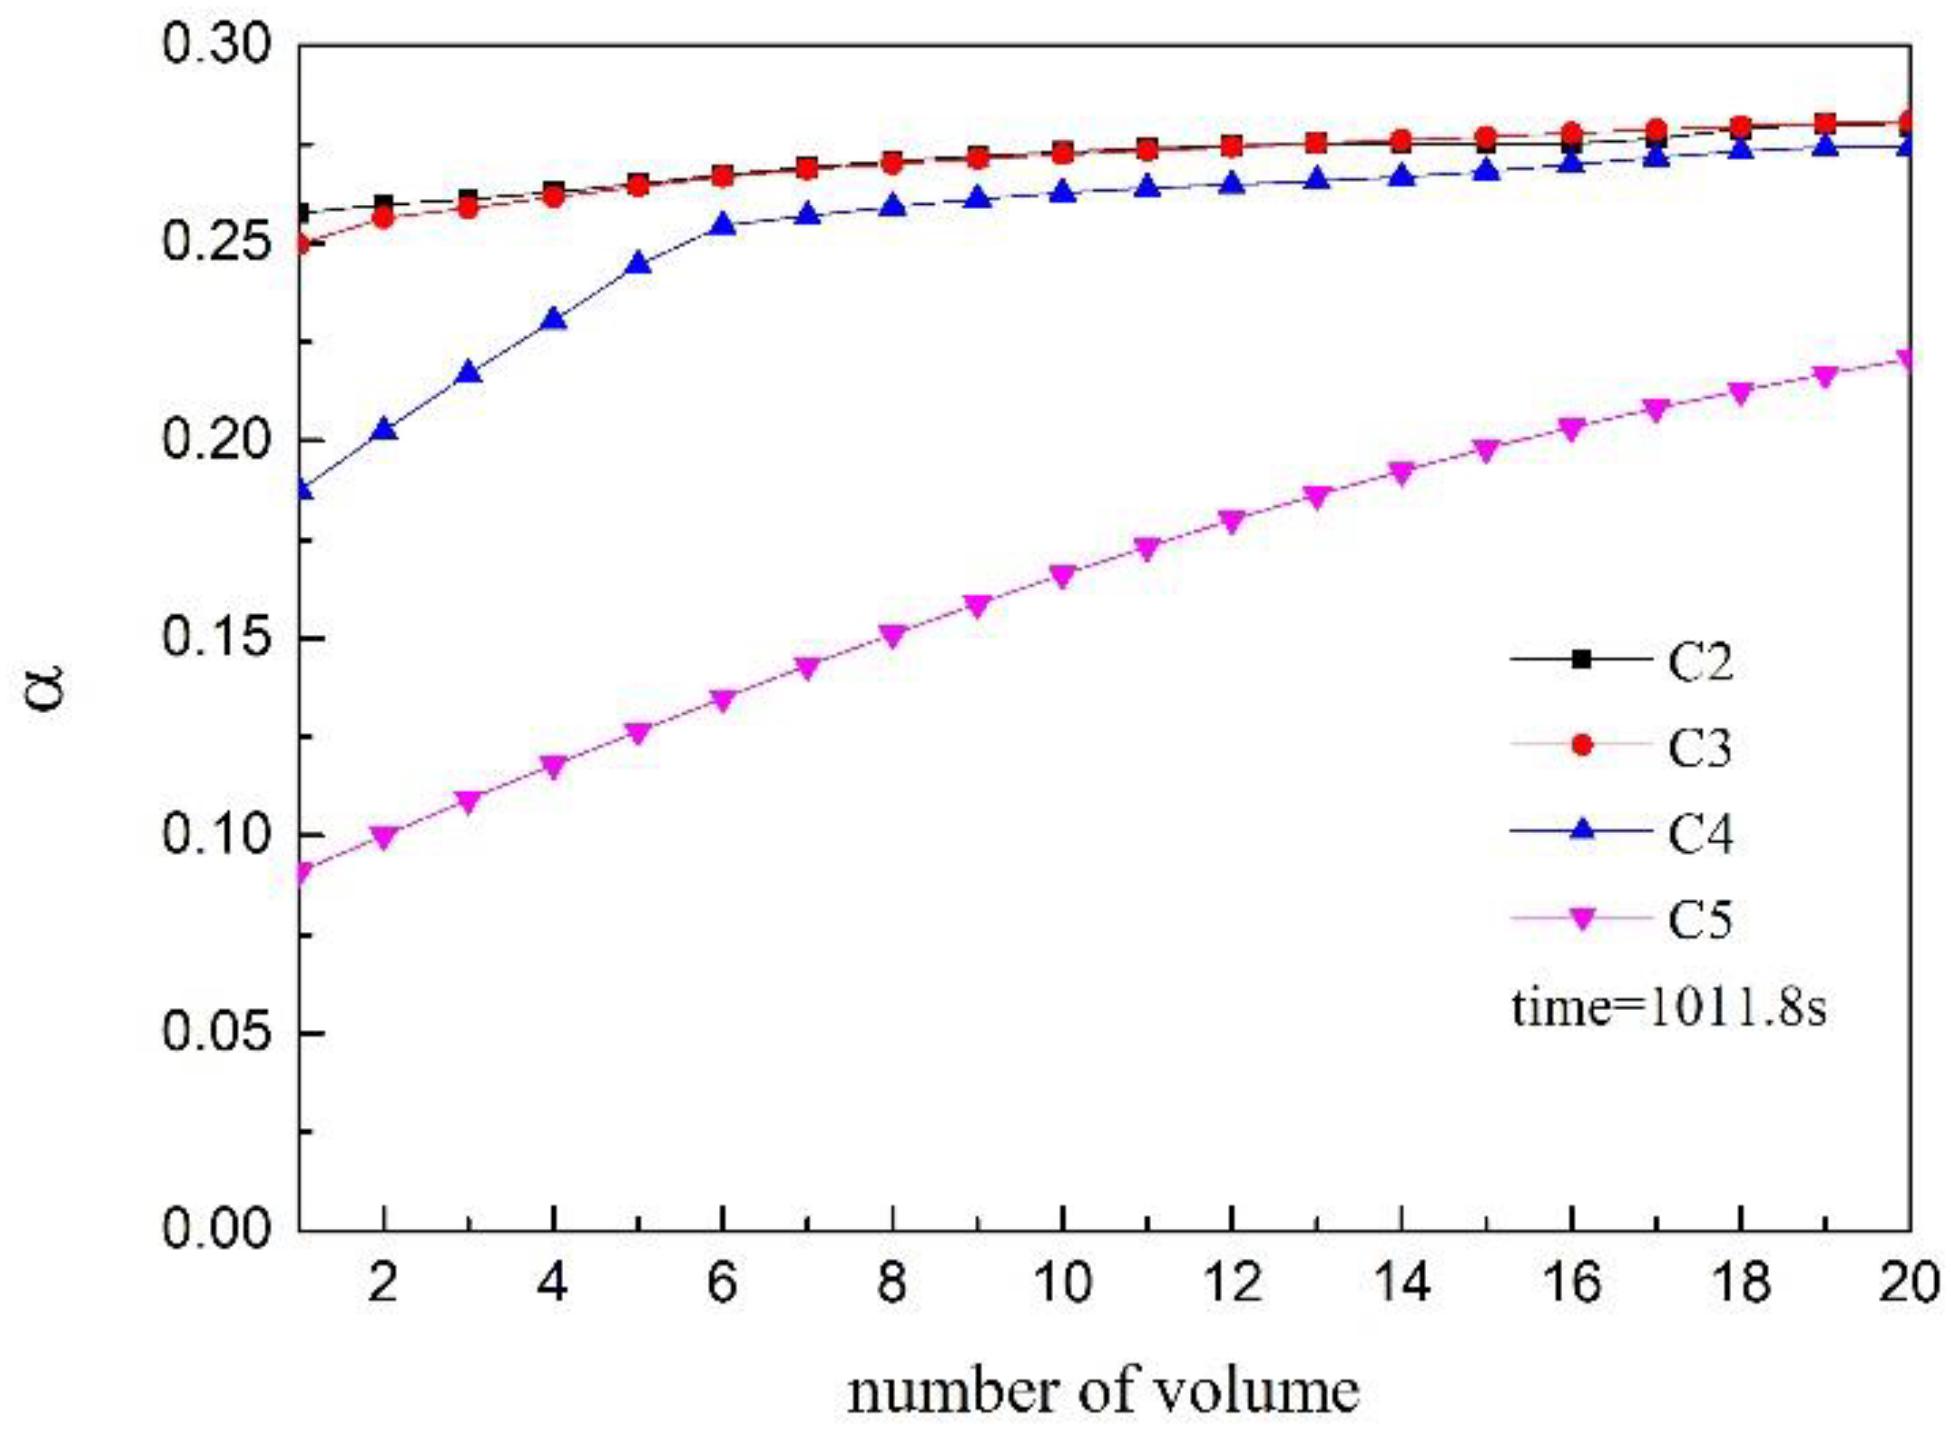
Figure 6. The void fraction of different volume in vessel.
It can be found from Figure 7 that the flash conditions in the high reference tube and the low reference tube are almost the same, and the fluctuation range of the void fraction increases with the increase of the depressurization rate. Under transient conditions C2, the temperature and pressure are in a more severe imbalance state, and the steam is intermittently overheated and saturated. This may result in a mismatch in the proportion of void fraction between the high and low reference tubes.
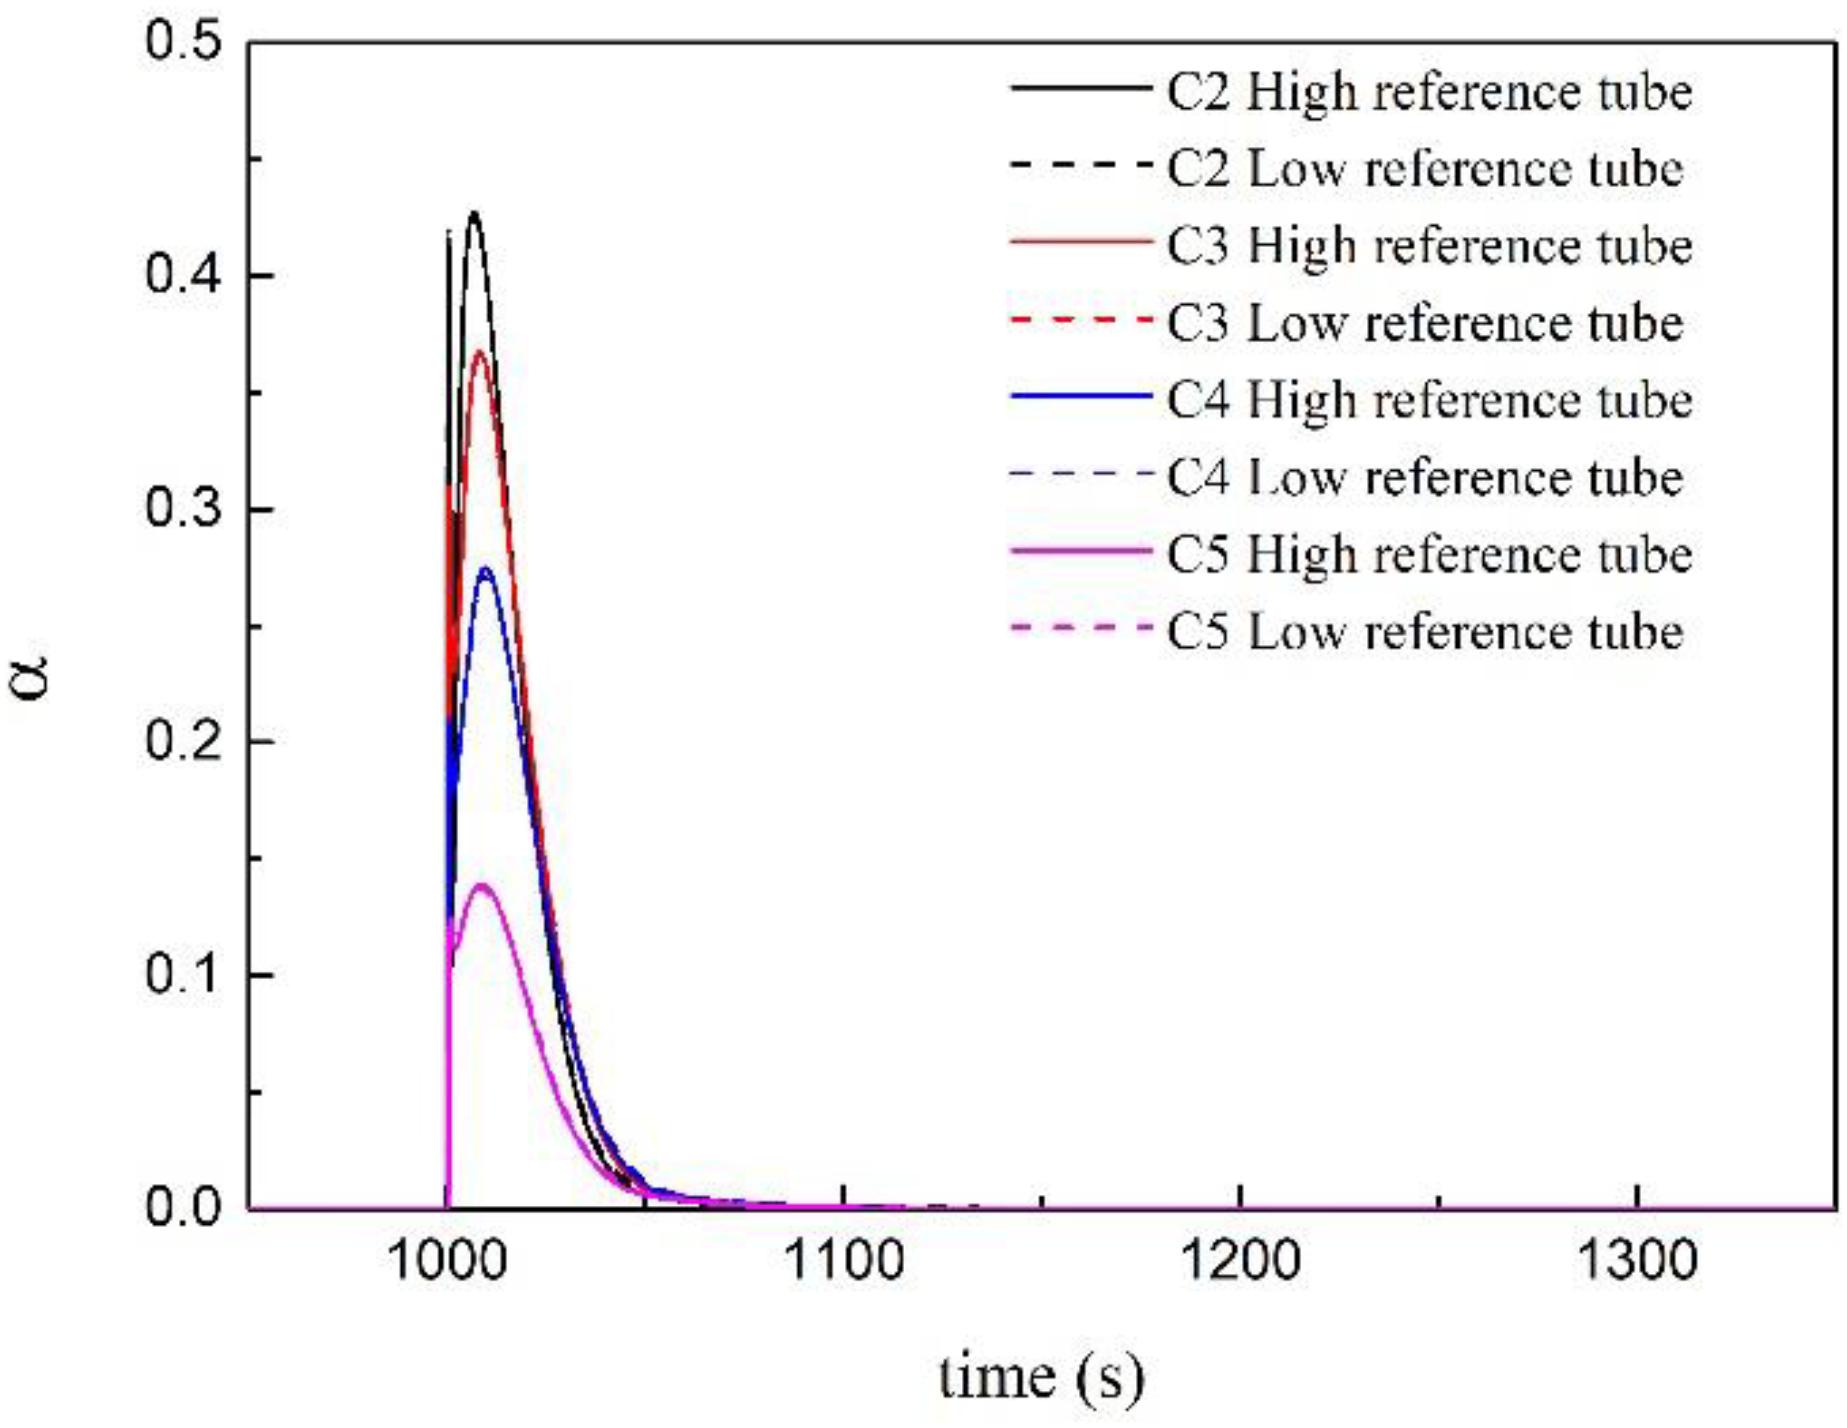
Figure 7. Void fraction at the bottom of the reference tube.
The void fraction in the reference tube will reach the peak value after the pressure is released for around 8 s. The change of void fraction at different volumes of reference tube at peak time is shown in Figure 8. Obviously, the change trend of void fraction under each condition is roughly the same, from bottom to top and rising slowly. However, the void fraction drops sharply when the volume number is large. According to RELAP5 node model Figure 2, the volumes 26 and 23 are on top of the reference tubes (nodes 210 and 310), and these volumes communicate with the reference cups. When a large amount of water in the reference tube is flashed, the water in the reference cup penetrates into the volumes at the upper end of the reference tube under the action of gravity, which makes the void fraction in these volumes drop sharply. The void fraction in the reference tube is much higher than that in the water space of the vessel under the same transient depressurization condition. A large number of bubbles produced by flash evaporation are not easily discharged from the reference tube quickly since the inner diameter of the reference tube is extremely small, as a result that there is a bubble accumulation effect in the reference tube, which will affect the measuring accuracy of the level measurement device.
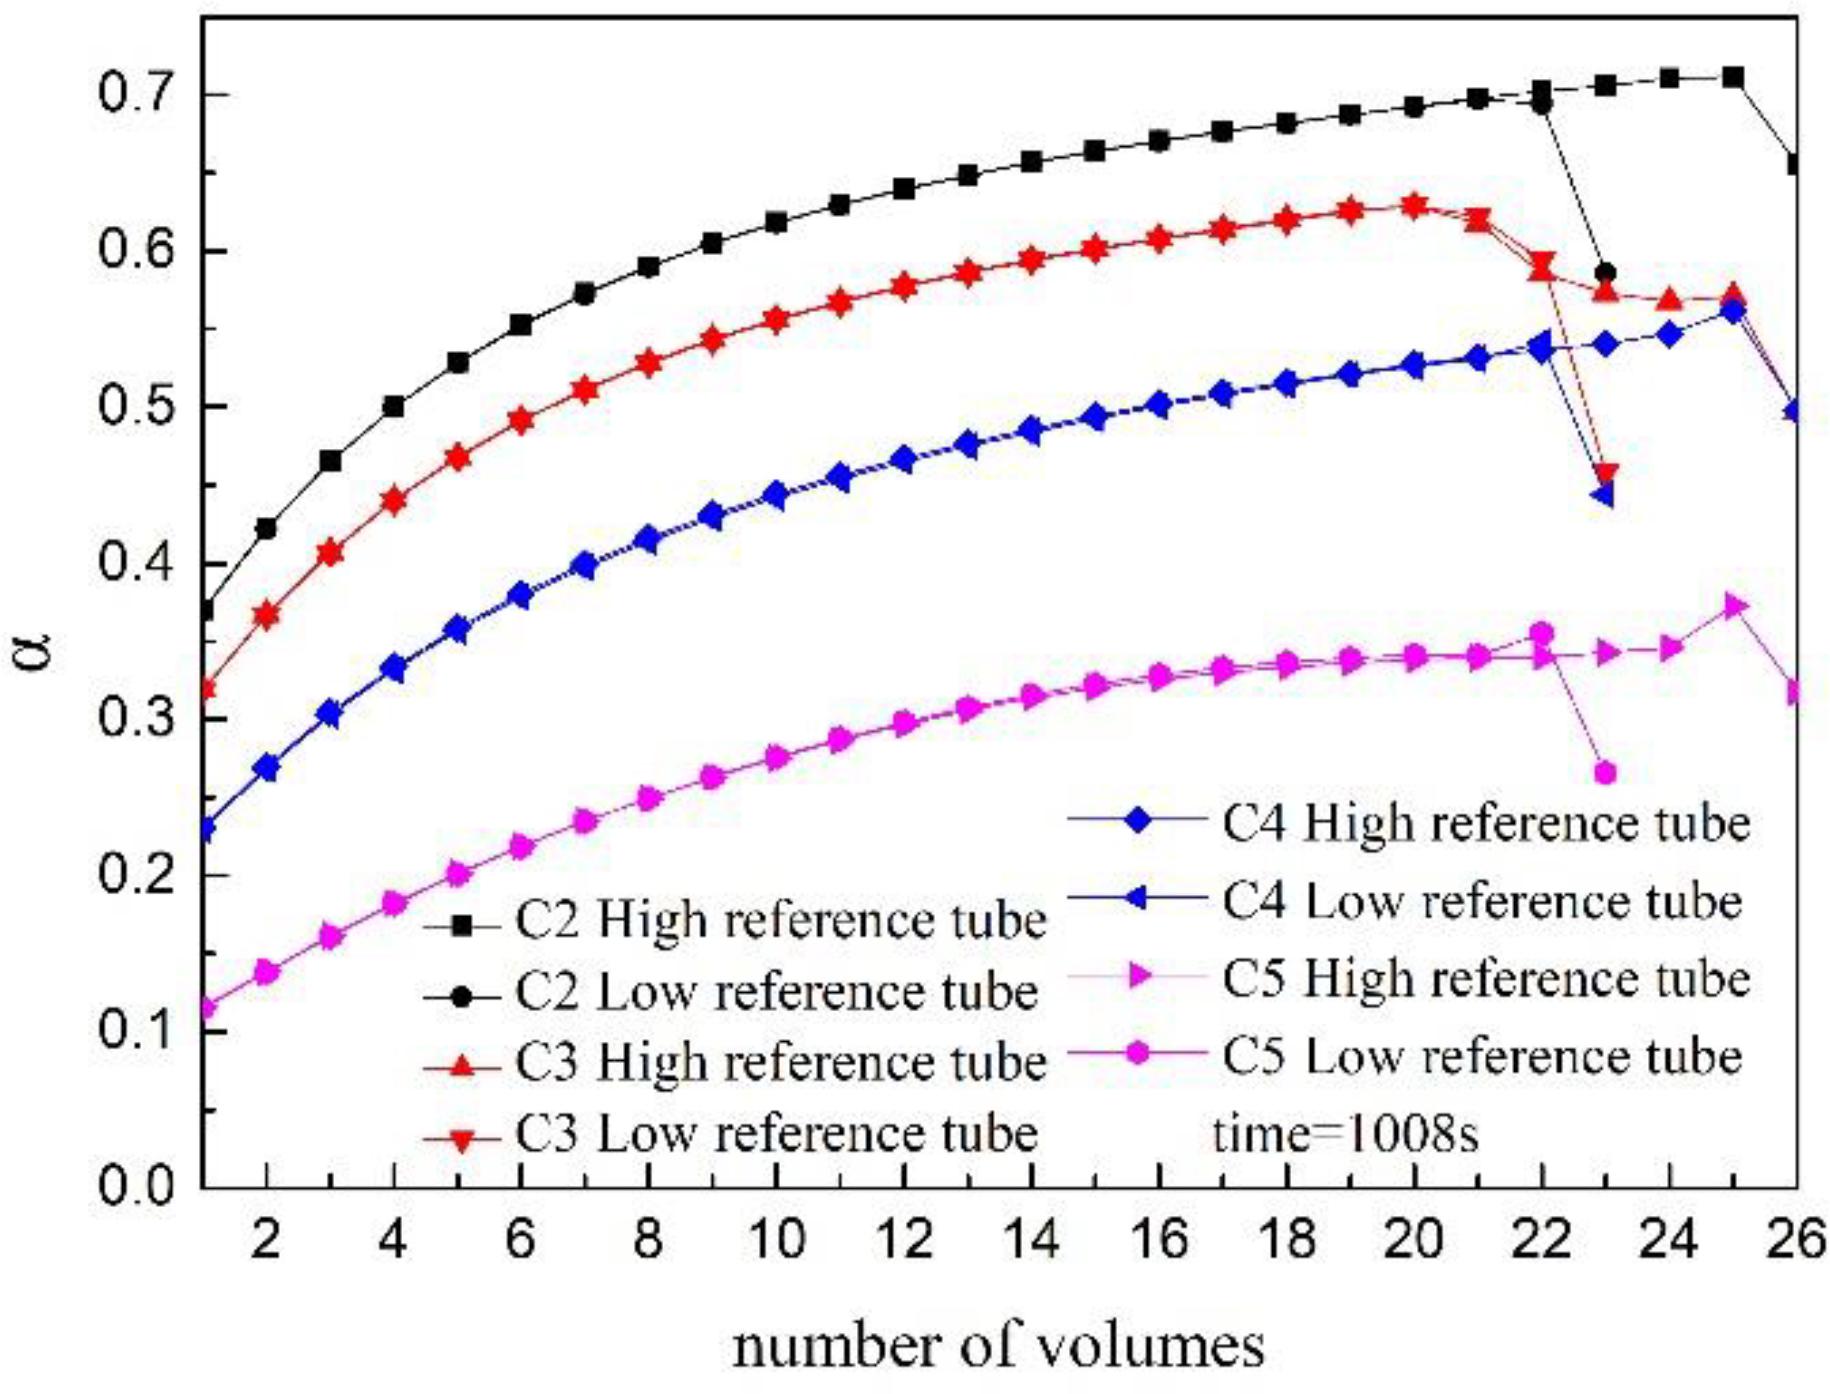
Figure 8. Void fraction of different reference tube volume.
The temperature of the pressure tapping point changes along with time under different pressure reduction rates is shown in Figure 9. The temperature at each pressure tapping point will drop sharply, then slowly rise until it recovers after the pressure is released. The pressure at each pressure tapping point is shown in Figure 10, and the density at each pressure tapping point is shown in Figure 11. The pressure of the whole measurement system will drop rapidly after the valve is opened to relieve pressure, then a severe flash evaporation will occur, resulting a great quantity of bubbles, which will greatly reduce the density of each pressure tapping point in a short time. With the end of flash evaporation and the rise of vapor bubbles into the gas space, the space occupied by the bubbles around the pressure tapping point will be quickly backfilled by liquid water, which will lead to a suddenly density increase, and then gradually decrease to normal values due to the gradual temperature rise. In addition, the fluctuation range of temperature, density, and pressure are all closely related to the decompression rate.
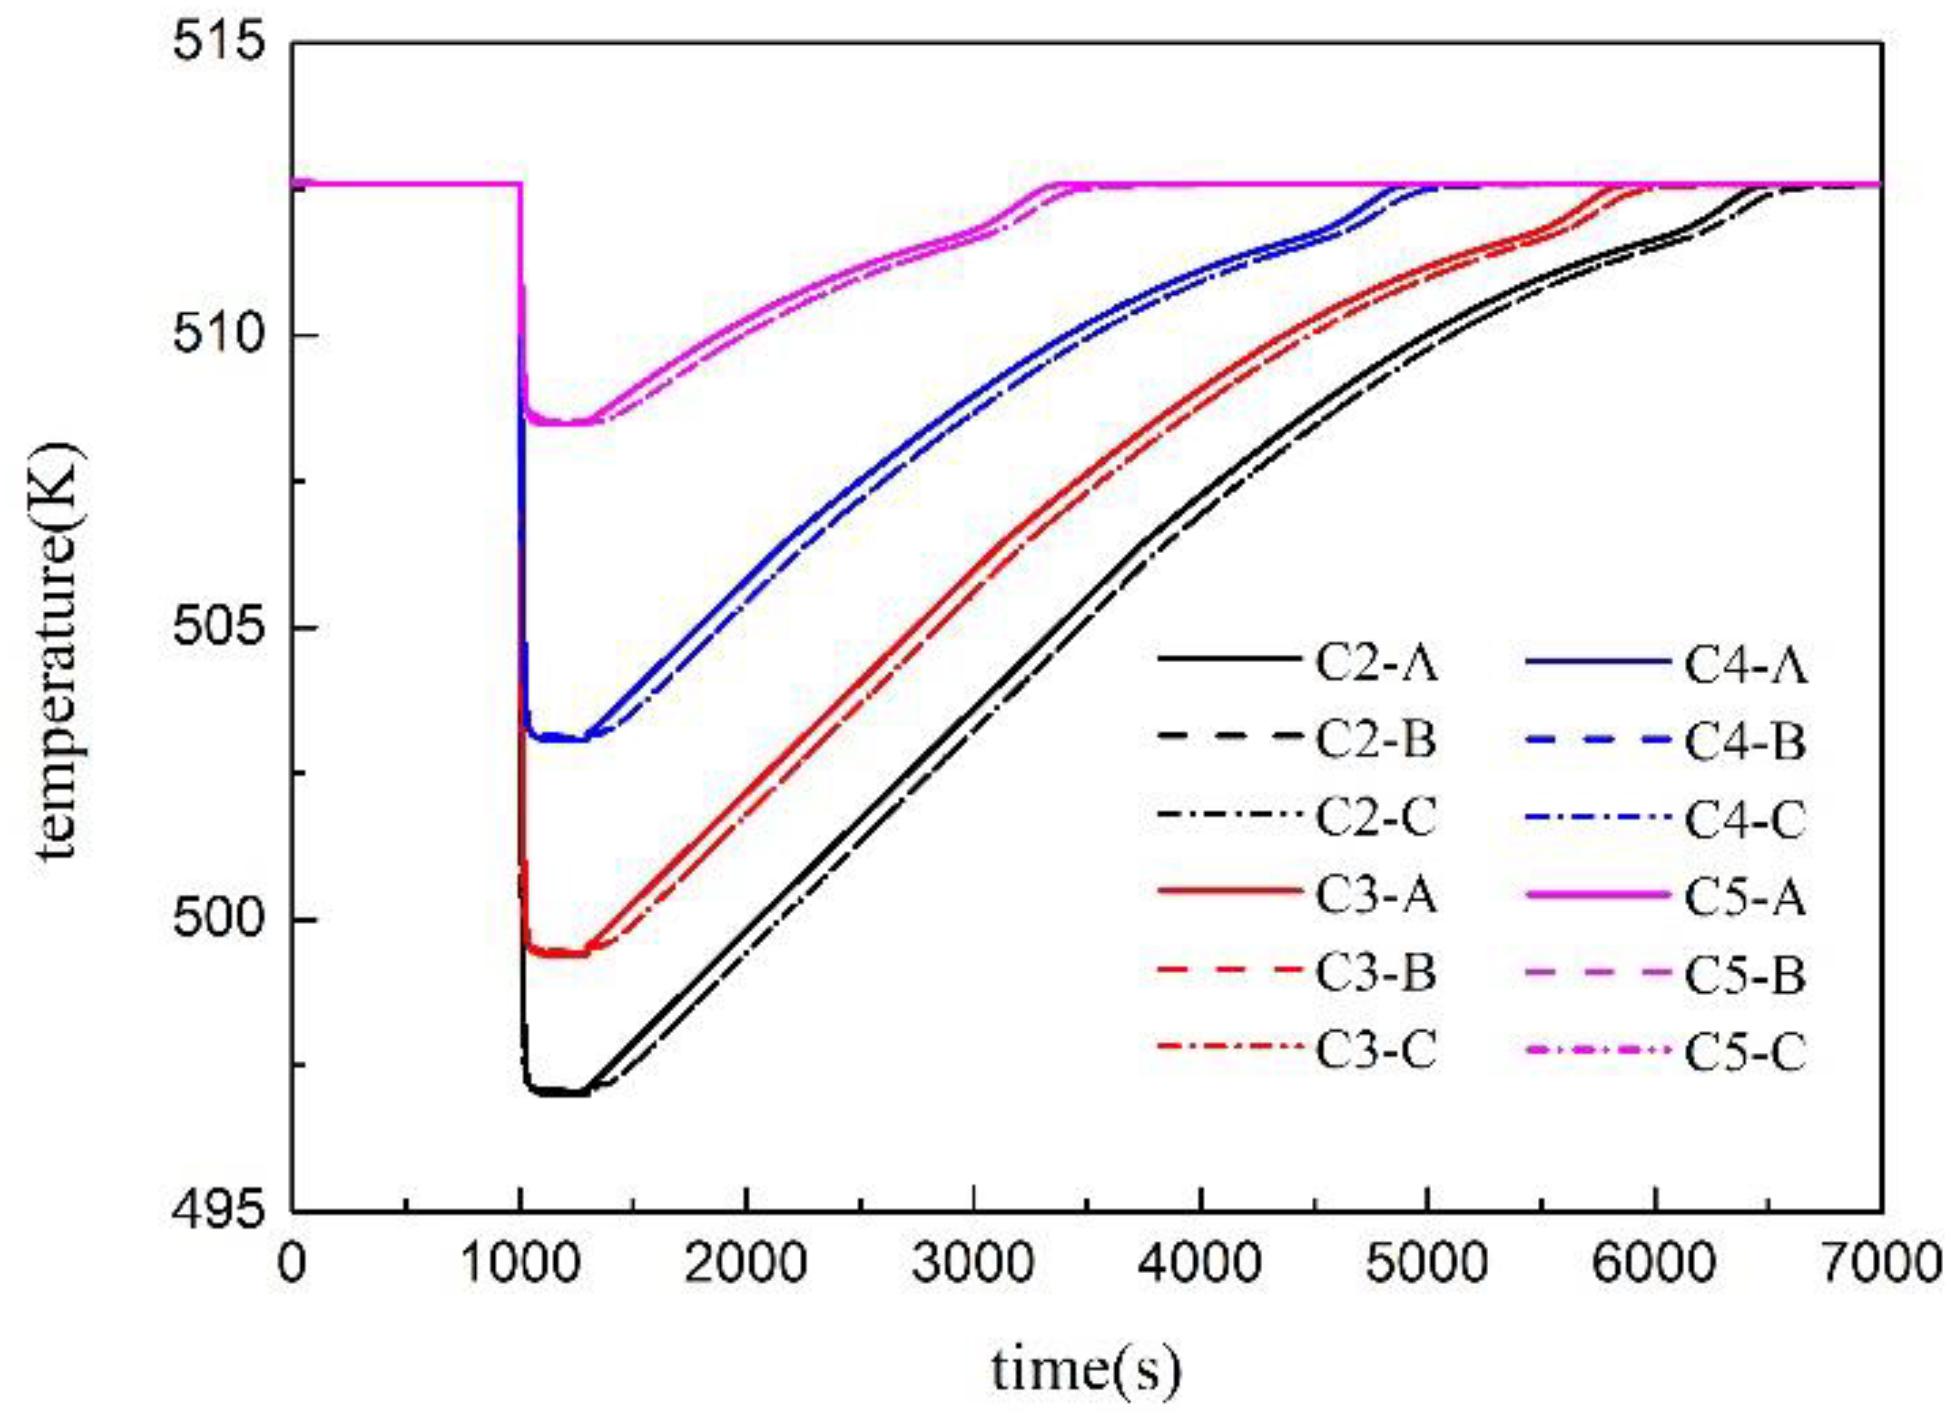
Figure 9. Temperature of each pressure measuring point.
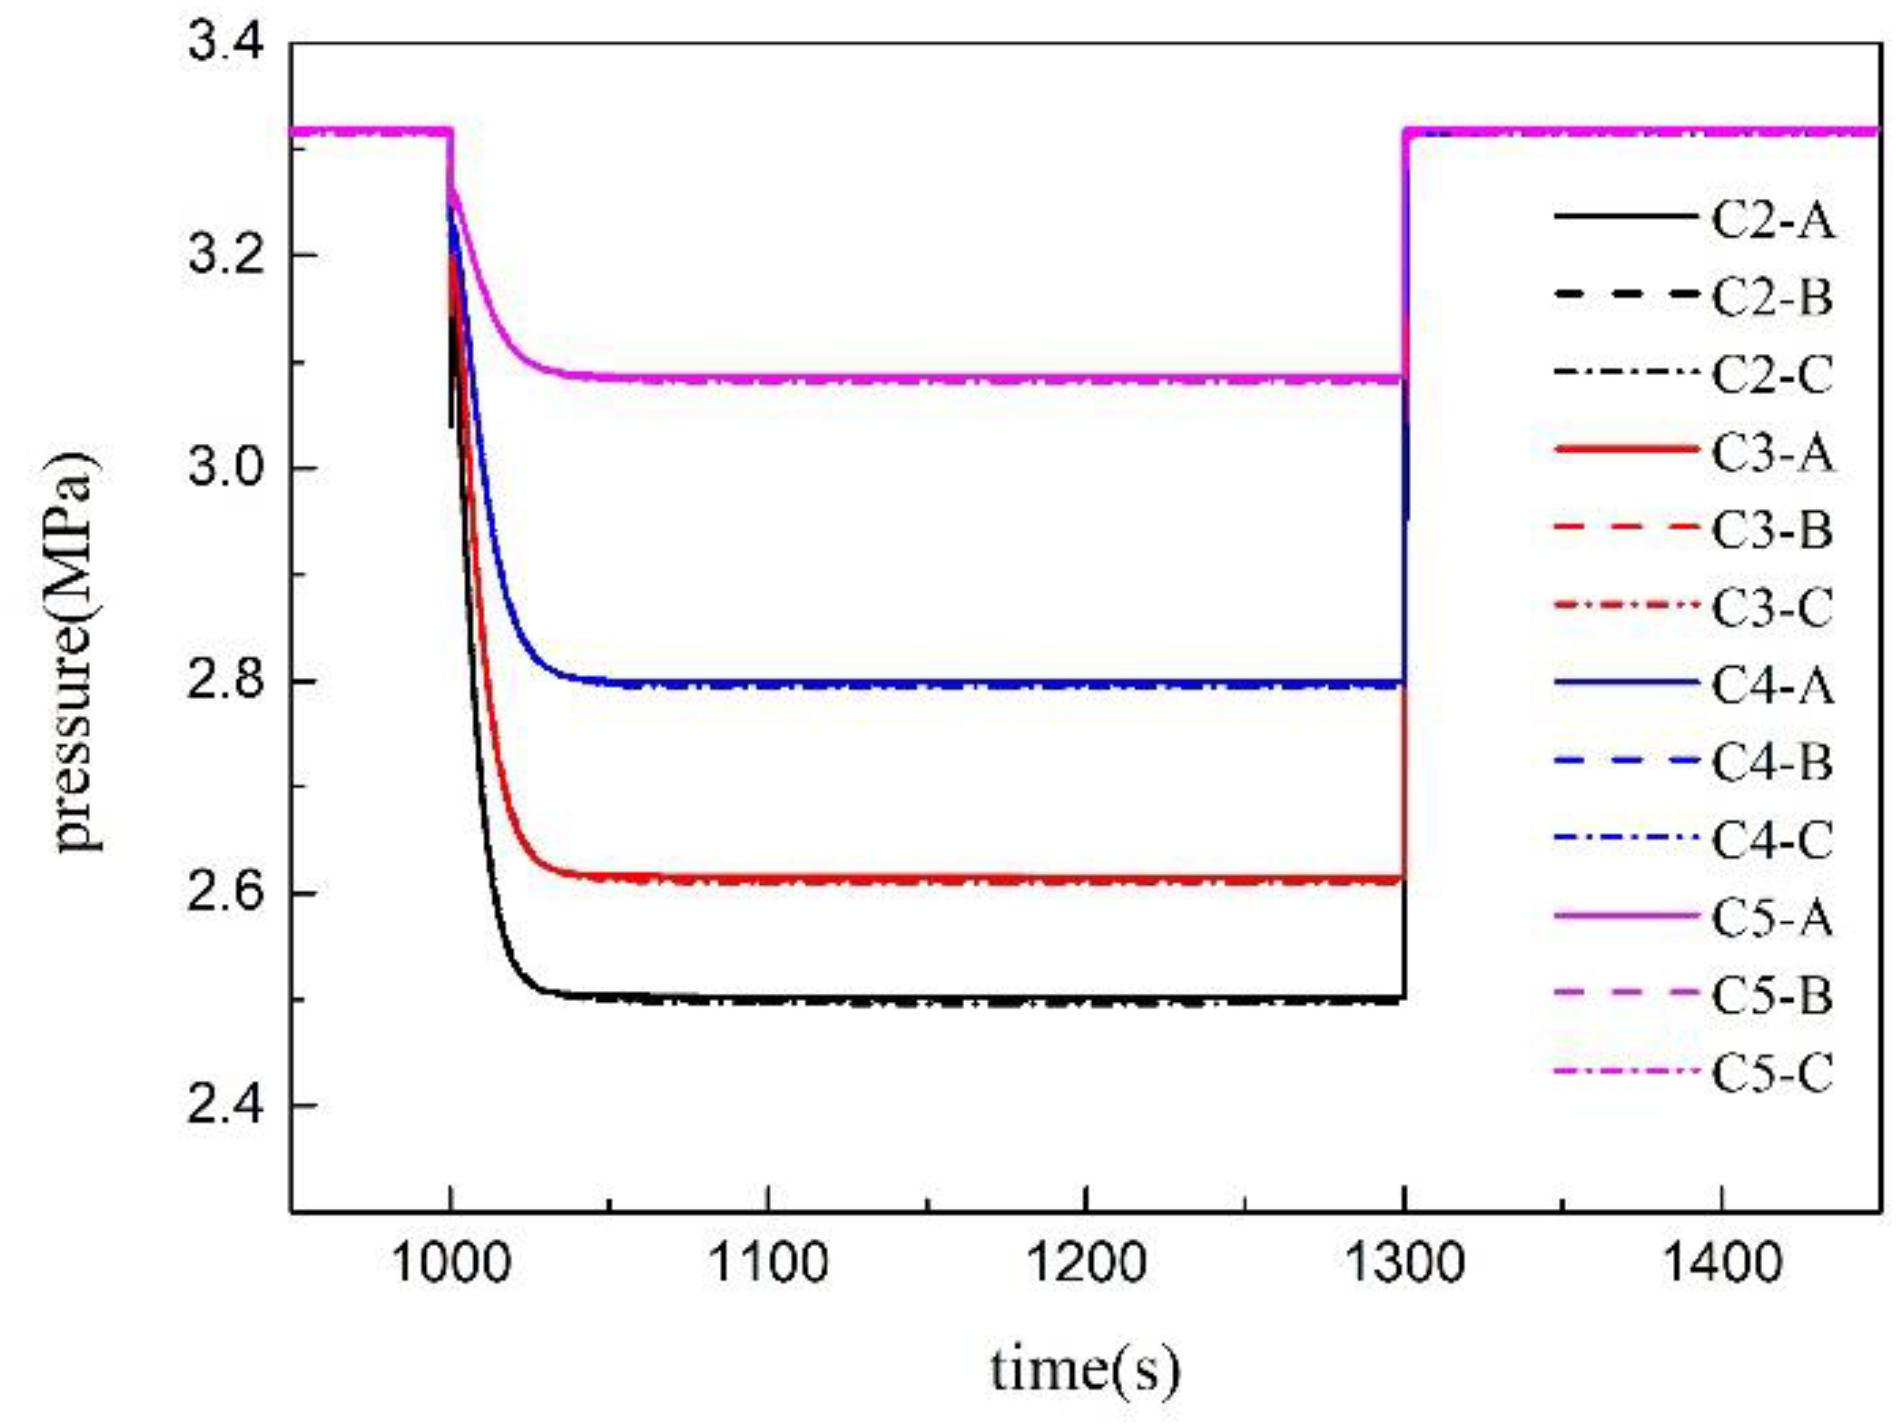
Figure 10. Pressure of each pressure measuring point.
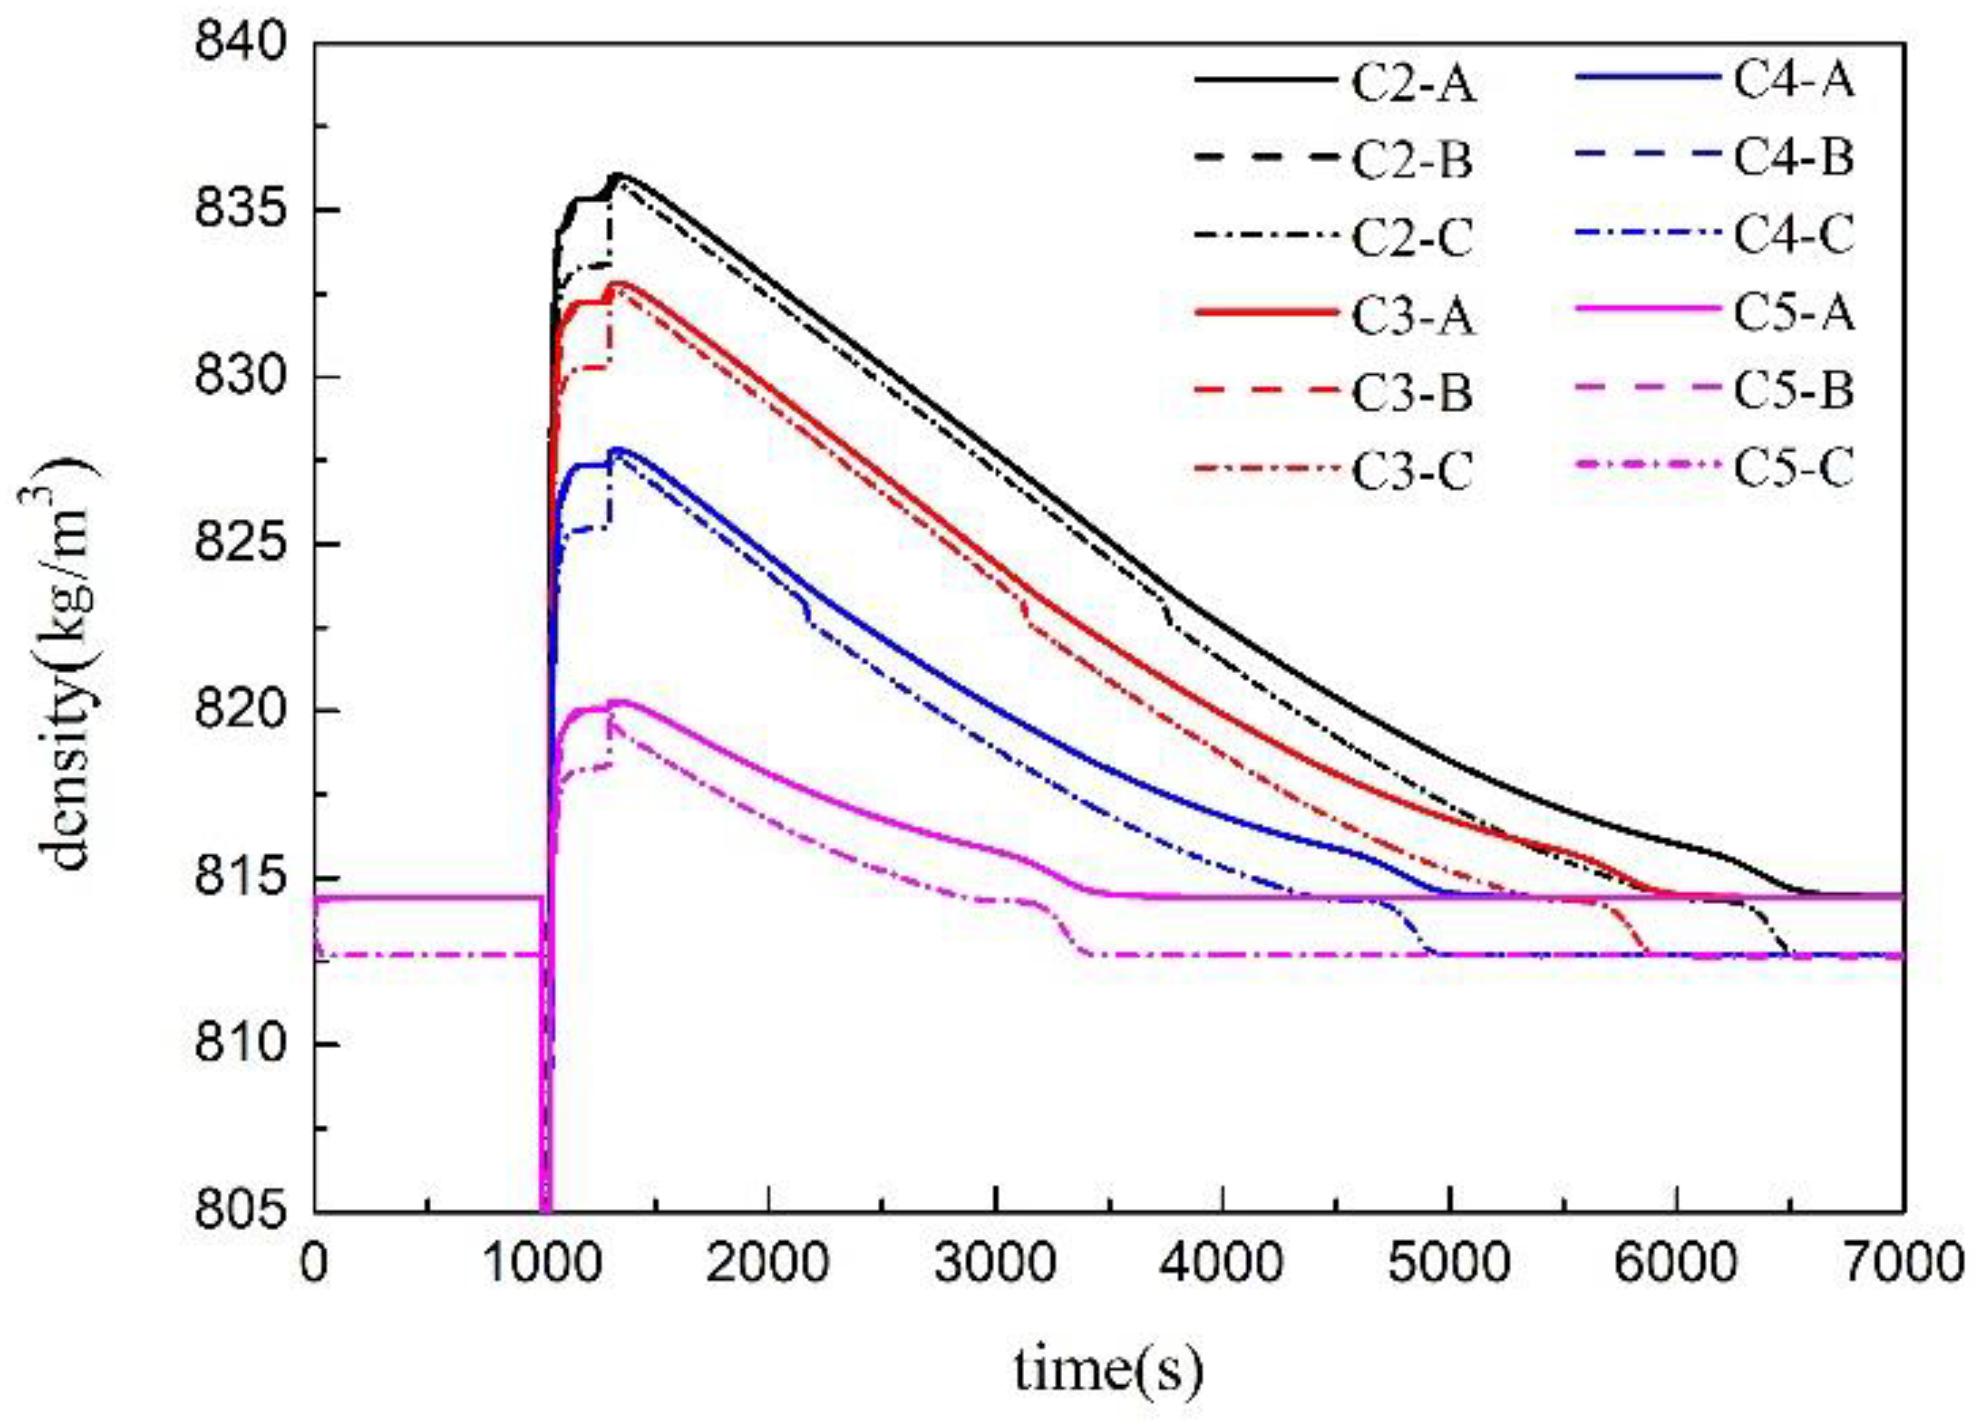
Figure 11. Density of each pressure measuring point.
The transient water-level of the double reference tube level gauge under the condition of rapid pressure drop is shown in Figure 12. The water-level gauge appears to have a false water-level within a short time after the pressure is released. Under the extreme decompression condition C2, the measured value of water-level gauge will have a significant vibration phenomenon, and its water-level display value has far exceeded the real water-level value. During rapid depressurization, the water in the reference tube will flash evaporation violently since the temperature of the water in the reference tube is similar to the temperature of the water in the vessel, resulting in a large number of bubbles, which will cause an inaccurate conversion between the pressure difference value and the water-level value. Therefore, the measurement results of the double reference tube level gauge in the process of rapid depressurization are not ideal. The error is pretty large at least within a few tens of seconds after the pressure is released.
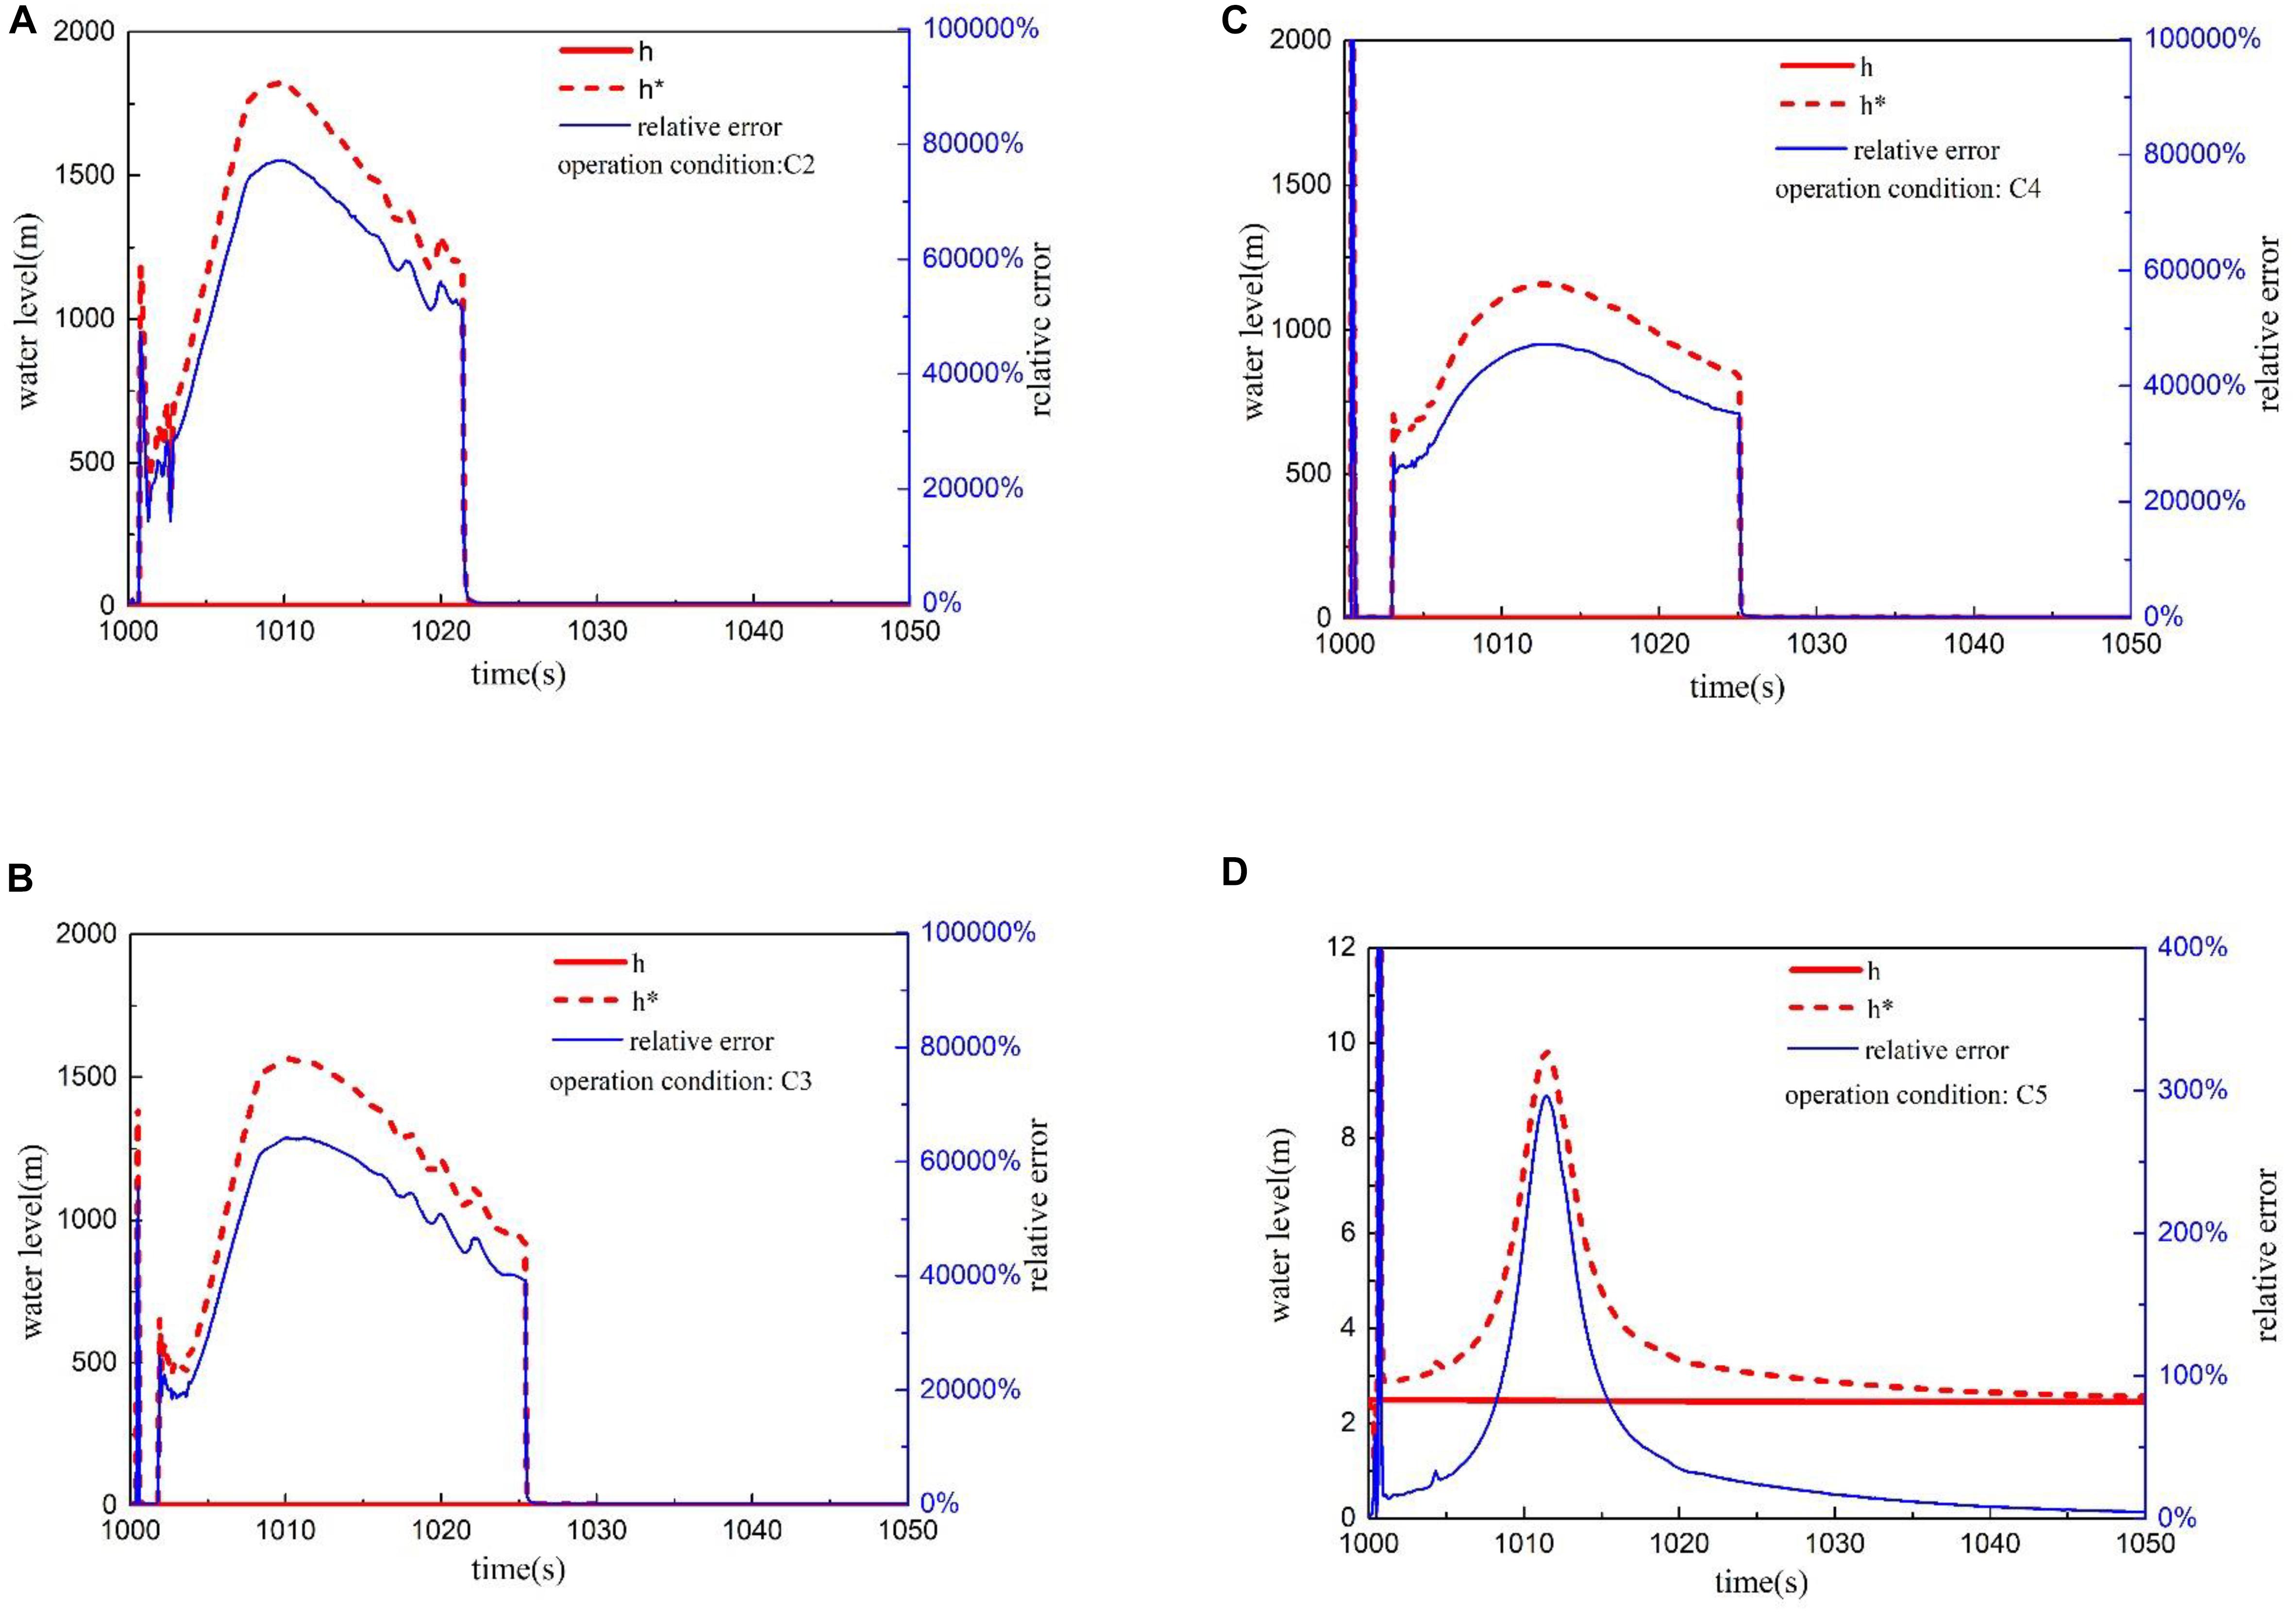
Figure 12. Transient water-level and relative error under rapid depressurization. (A) Transient water-level under condition C2. (B) Transient water-level under condition C3. (C) Transient water-level under condition C4. (D) Transient water-level under condition C5.
Measuring Characteristics During Slow Depressurization
The transient water-level under slow depressurization condition is shown in Figure 13. A large amount of vapor bubbles will be discharged from the vessel after the pressure is released, causing the real water-level to drop slightly. With the decrease of the depressurization rate, the variation amplitude of the measured level value in the early stage of depressurization will be weakened, and the phenomenon of water-level oscillation will disappear. The flash evaporation phenomenon is not obvious since the pressure change in the vessel during the slow depressurization process is not large. The time for the measured water-level of the water-level gauge to track the real water-level will be slightly shortened. The relative error remains basically below 10.0% in the process of slow depressurization, and a smaller the depressurization rate will lead to a smaller the maximum relative error. The recovery time of relative error below 1.0% will be shortened with decreasing the depressurization rate. The simulation results indicate that the measured water-level of the double reference tube level gauge performs better in the process of slow pressure reduction, and the real water-level can be tracked in tens of seconds.
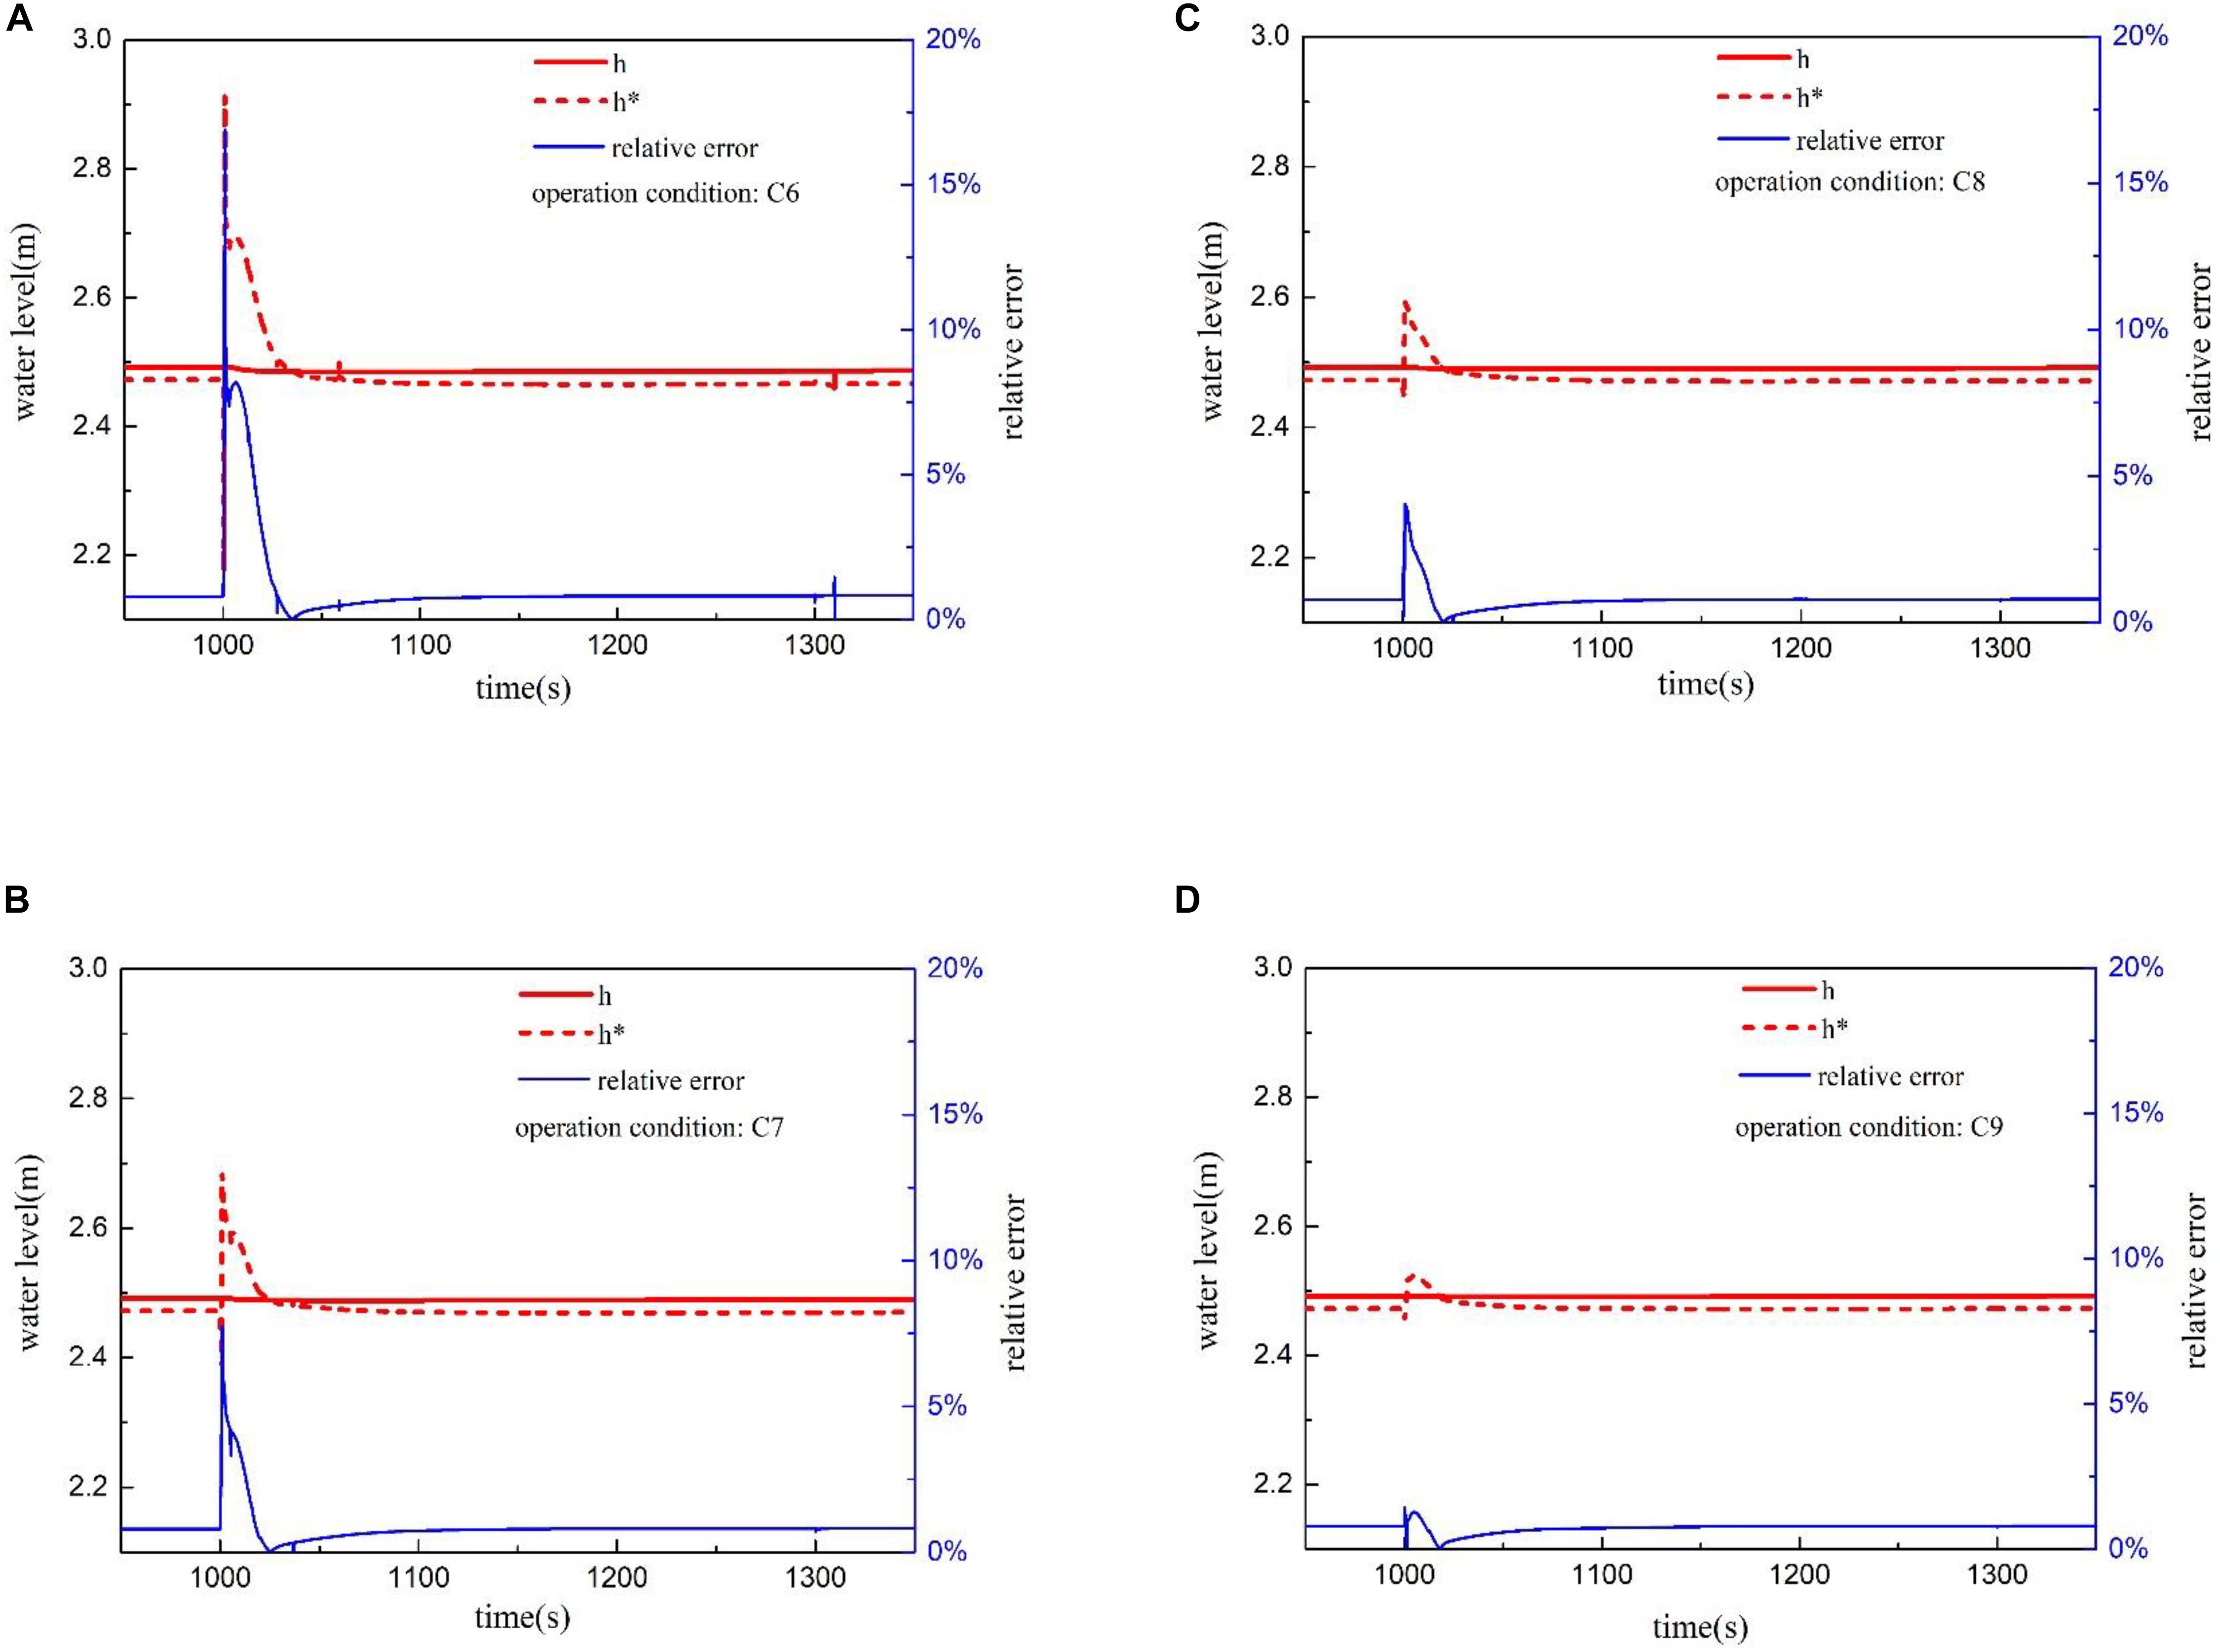
Figure 13. Water-level and relative error under slow depressurization. (A) Transient water-level under condition C6. (B) Transient water-level under condition C7. (C) Transient water-level under condition C8. (D) Transient water-level under condition C9.
Influence of Supply Water Flow Rate
It can be found from the above discussion that there is violent flash evaporation at each critical part of the double reference tube level under the condition of rapid depressurization, which greatly affects the transient measurement accuracy. In order to solve the problem, the section discusses the influence of the supply water flow of the reference cup on the measured value of the differential pressure water-level measurement system.
Taking the low reference cup as an example, the void fraction under different supply water flow conditions is shown in Figure 14. The vibration of the void fraction gradually weakened with the increase of the reference cup supply water flow, and the time needed to recover the void fraction to the normal level is also decreased. A part of the steam can be condensed by increasing the supply water flow, reducing the severity of the flash in the reference cup.
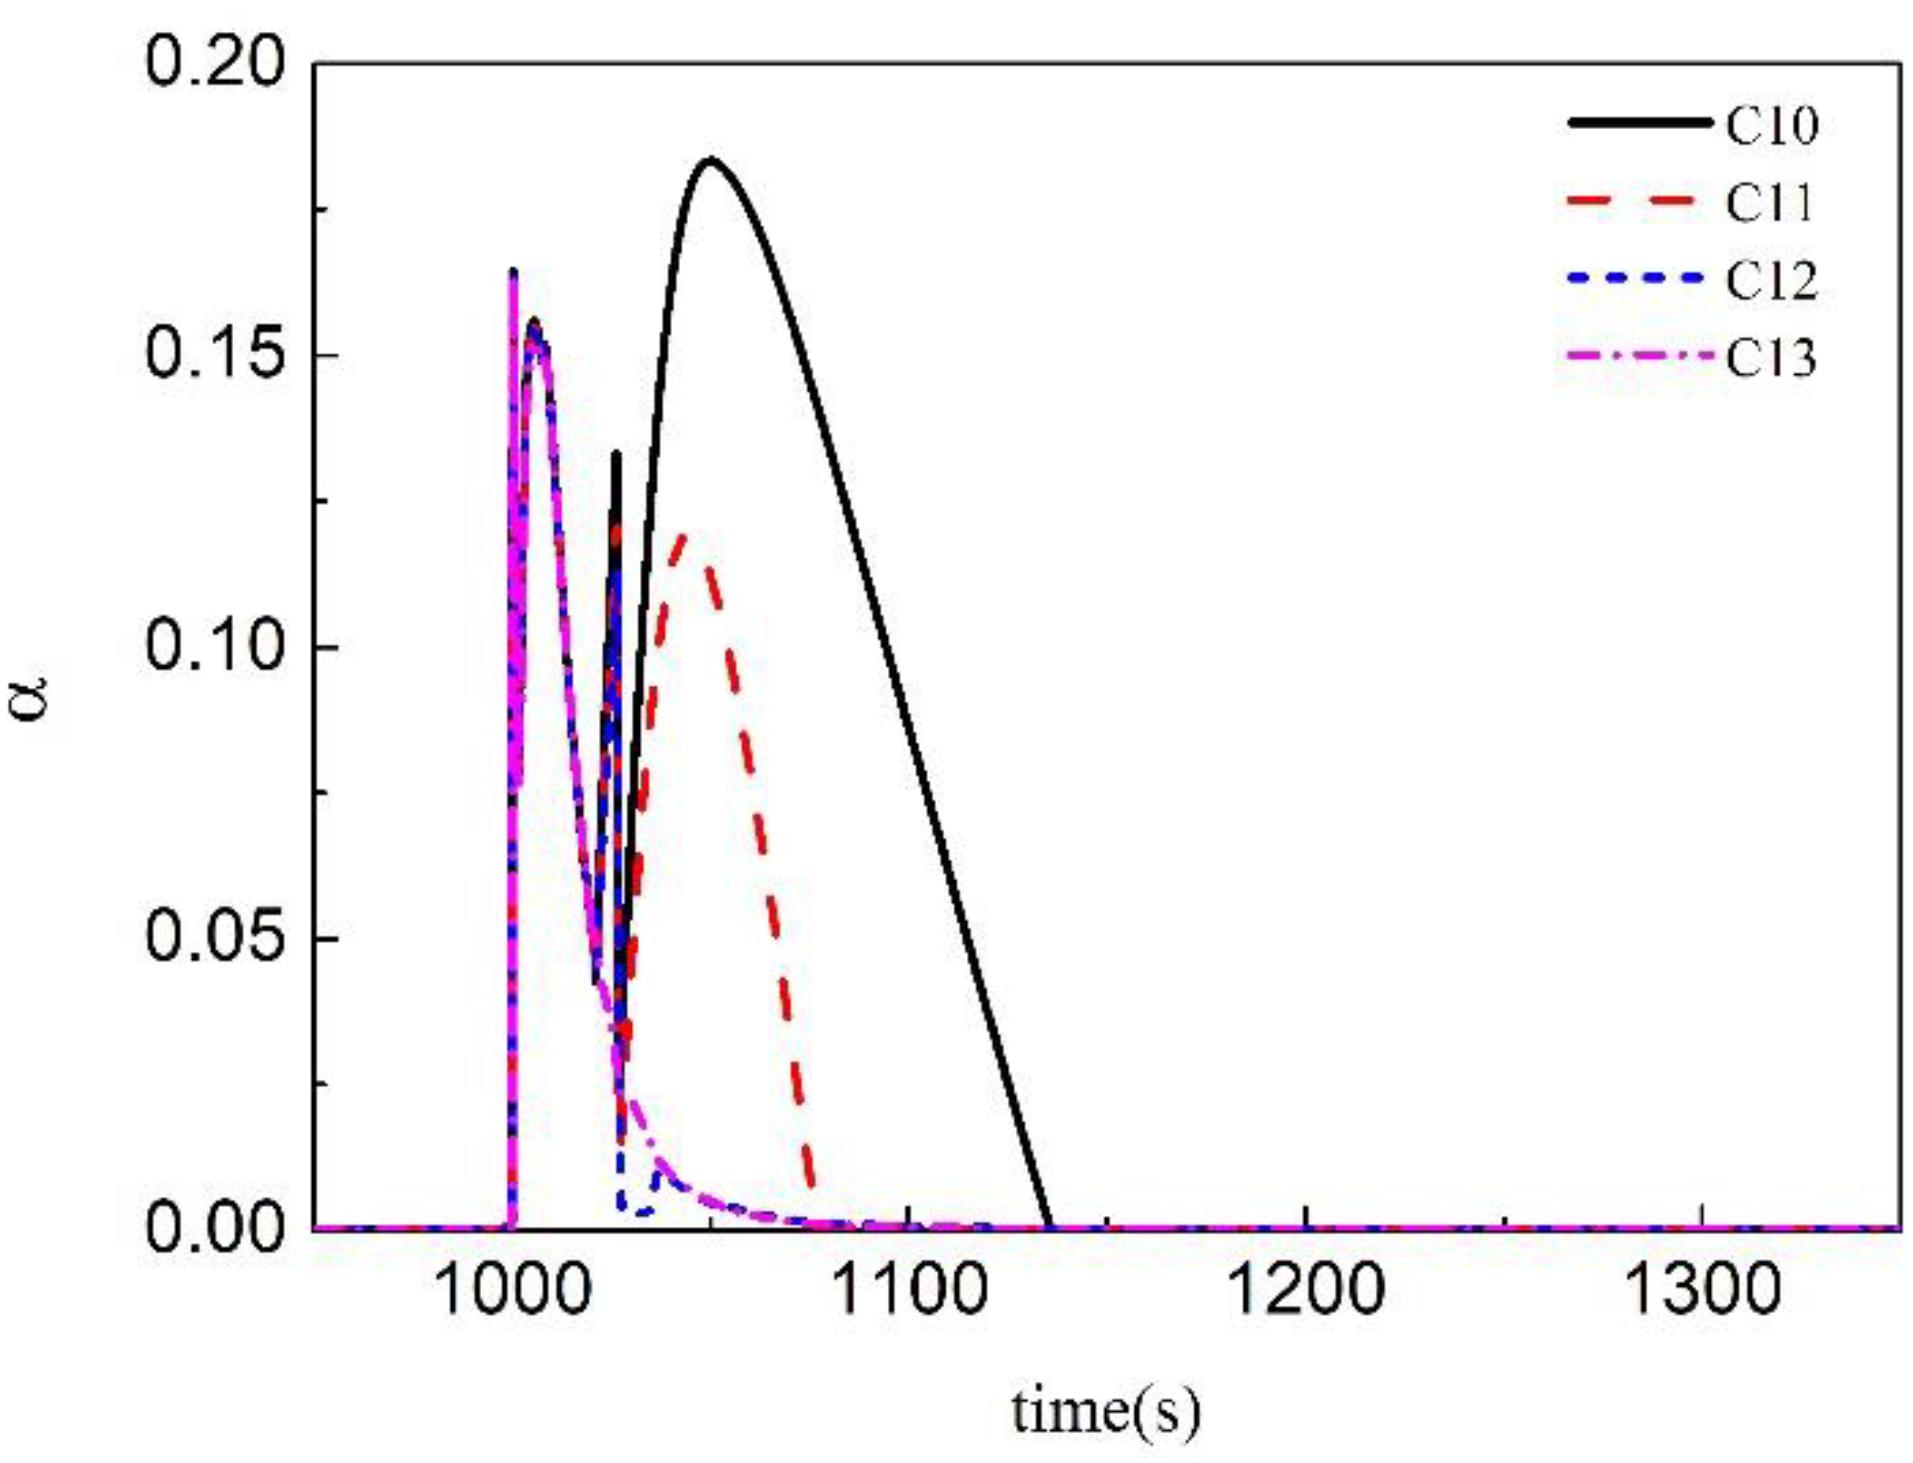
Figure 14. Void fraction in low reference cup.
The void fraction of the different volume in low reference tube under supply water flow rates is shown in Figure 15. The void fraction inside the reference tube cannot be effectively reduced by increasing the supply water flow. Since the inner diameter of the reference tube is pretty small, a large amount of bubbles cannot be discharged in time under the condition of rapid depressurization, resulting in a short period of bubble blockage. The reason for such a result might be that a large amount of bubbles rushed out from the inlet of the reference tube in an instant, which inhibited the process of supply water into the reference tube, resulting in that most of the supply water overflowed from the reference cup.
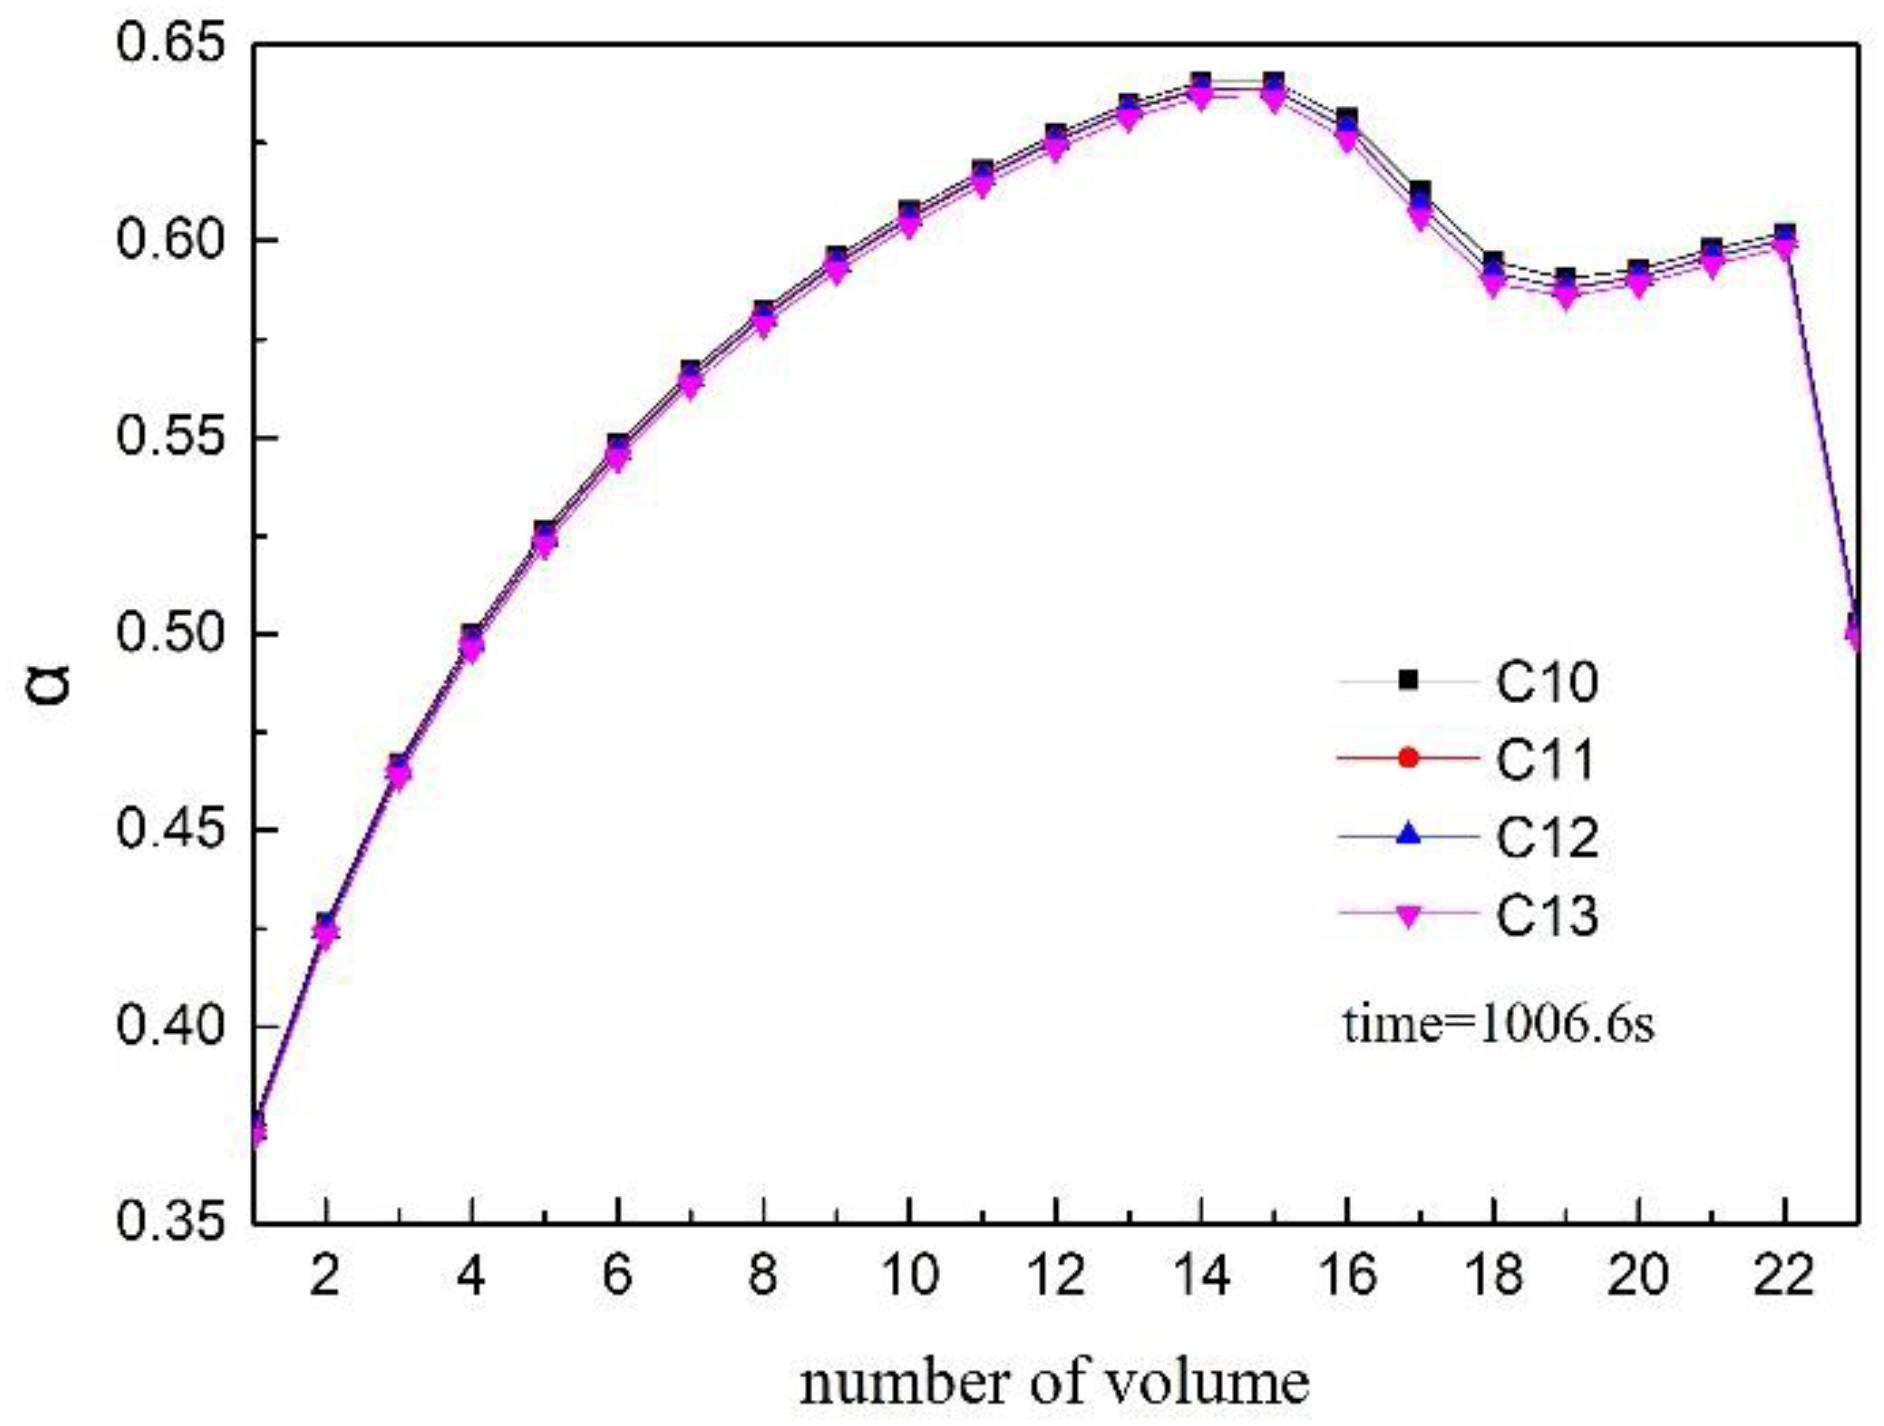
Figure 15. Void fraction of different volume of low reference tube.
As shown in Figure 16, there is no significant effect to increase the supply water flow rate in shortening the tracking time and reducing the deviation of the measured water-level. The flash evaporation will occur in both the reference tube and the reference cup under the condition of high depressurization rate, and a large number of bubbles are generated, resulting in that supply water cannot be injected into the reference tube in time.
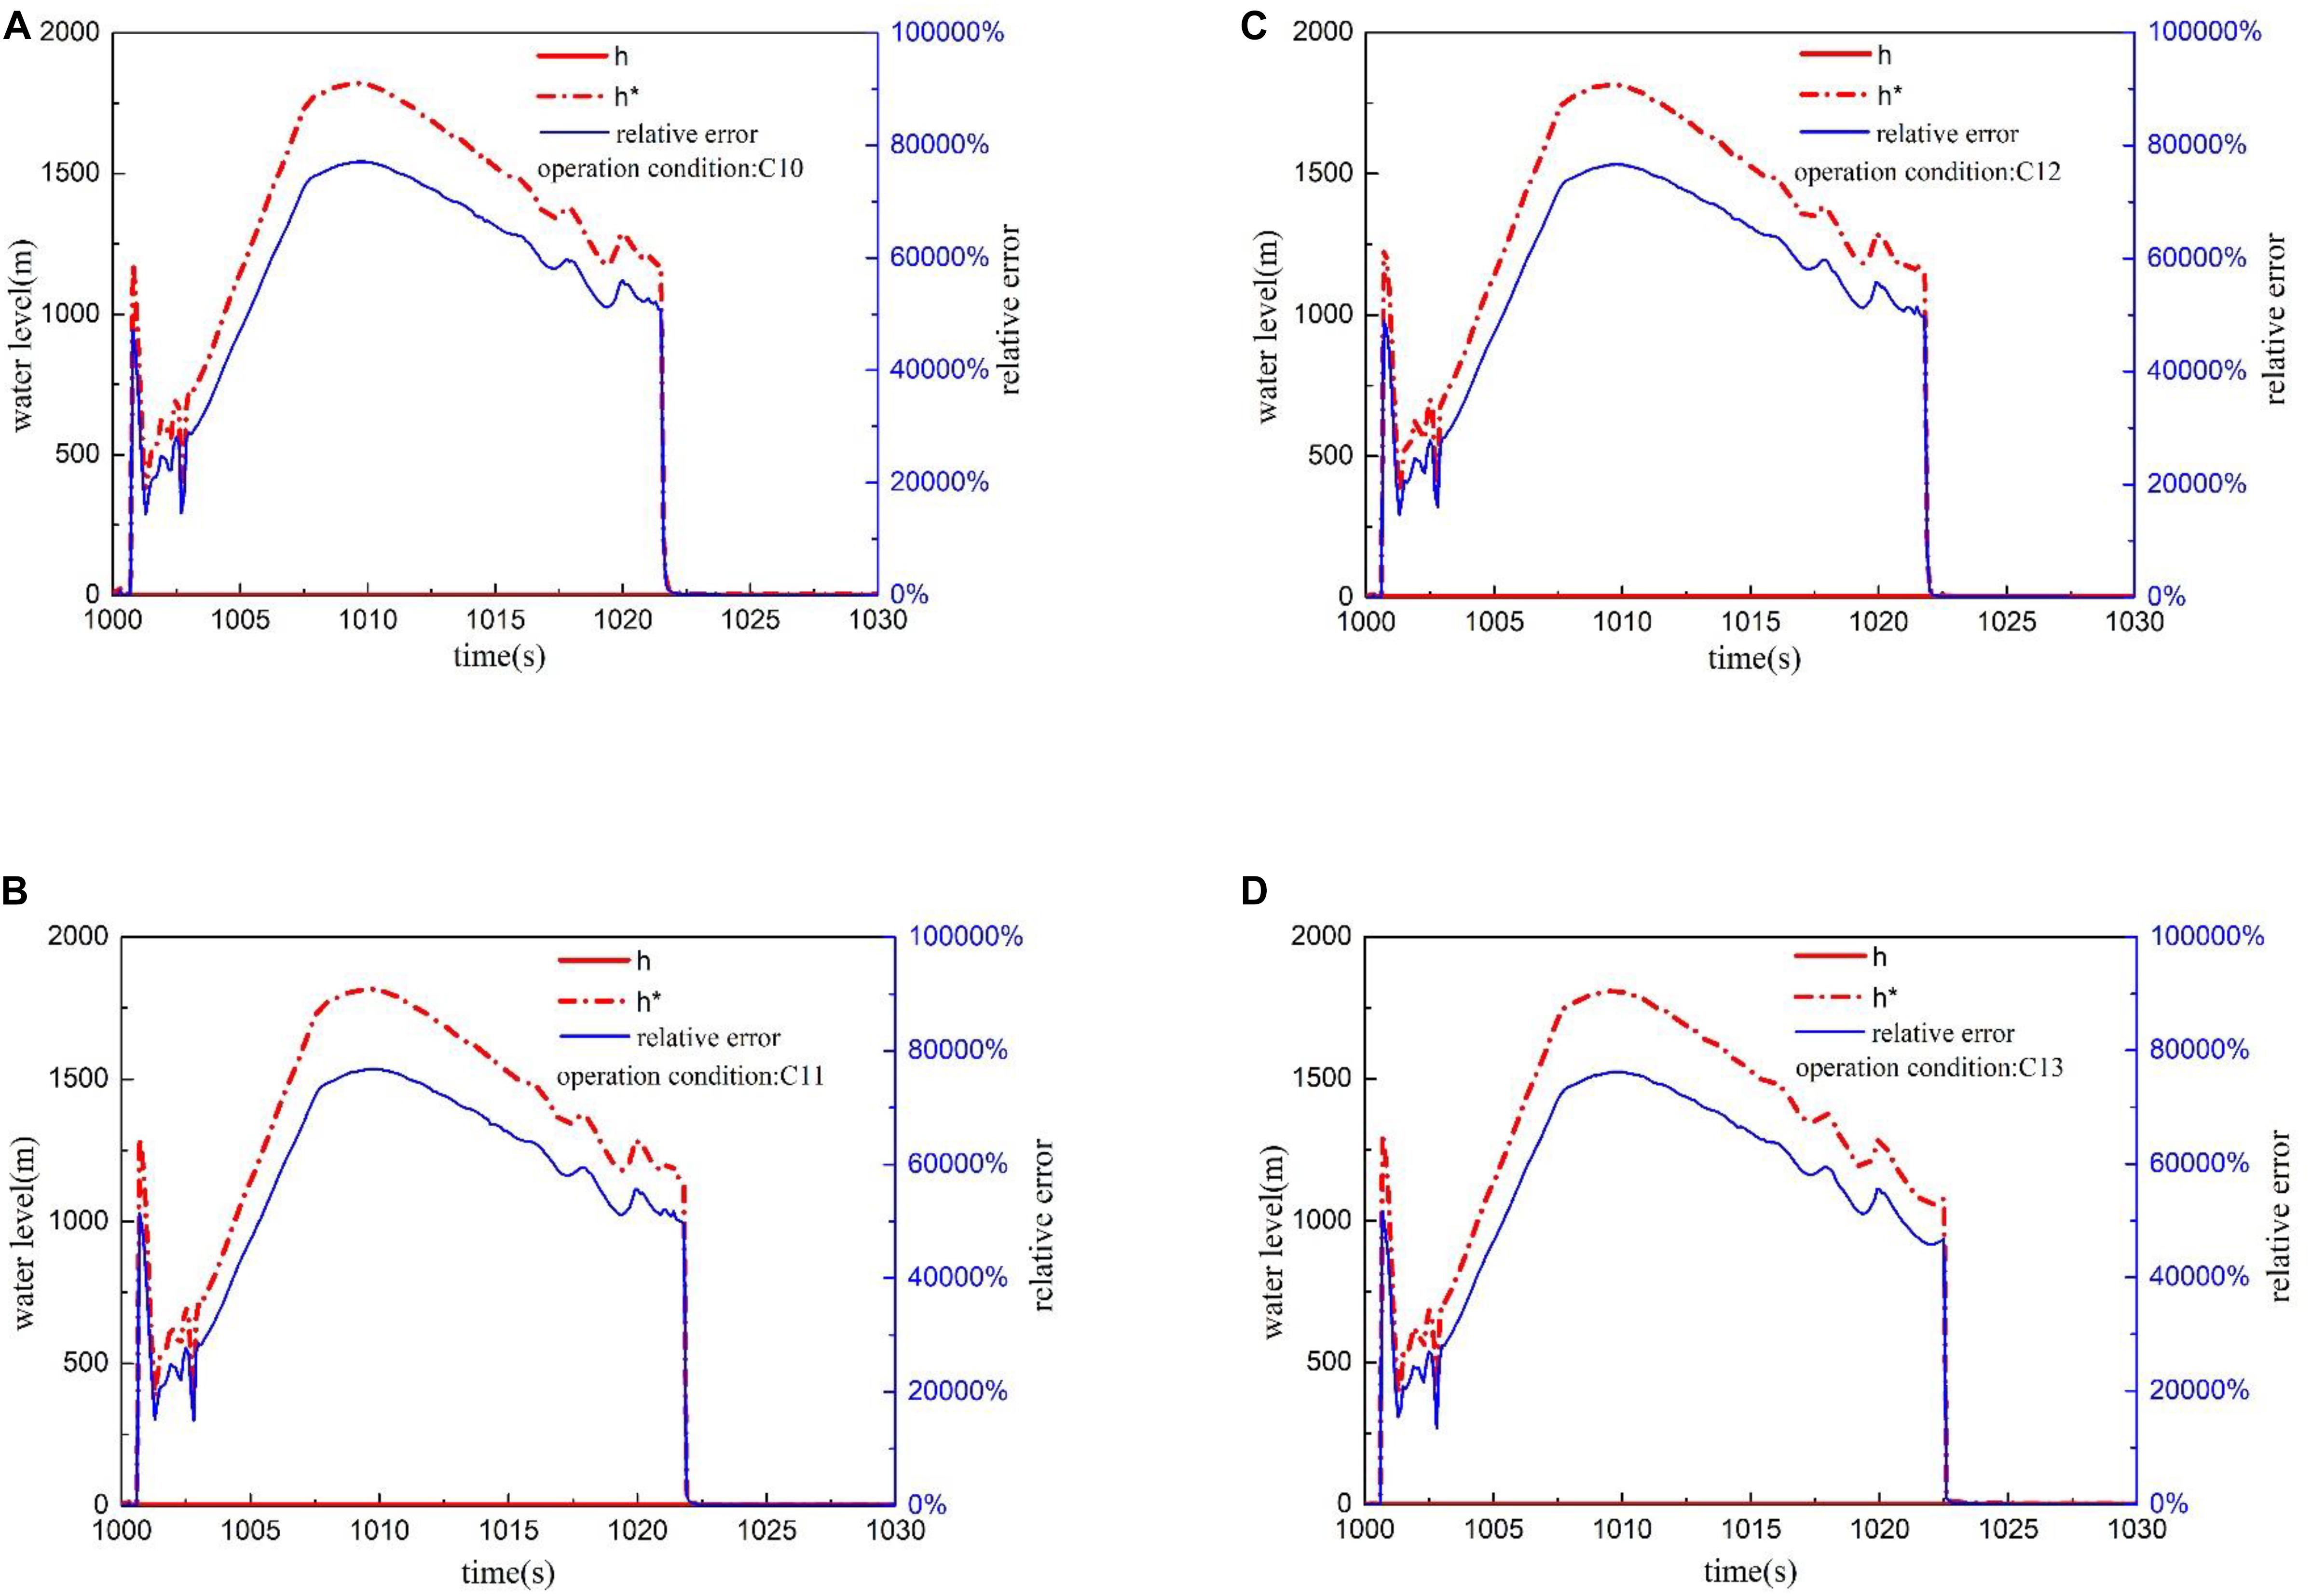
Figure 16. Water-level and relative error curve under different supply water flow. (A) Transient water-level under condition C10. (B) Transient water-level under condition C11. (C) Transient water-level under condition C12. (D) Transient water-level under condition C13.
Conclusion
In this paper, a simulation model of RELAP5 code is established for the double reference tube level gauge. The measuring characteristics of the differential pressure water-level measurement system are analyzed under both steady state condition and transient depressurization condition. The conclusions are as follows:
(1) The measurement error of the double reference tube level gauge can be controlled within 1% under the steady state condition, which can usually meet the accuracy requirements.
(2) There will be violent flash evaporation in the water-level measurement system when the depressurization rate is large, which makes the water density, temperature, and pressure fluctuate sharply in the reference tube and vessel. The measured value of the double reference tube level gauge deviates greatly from the real water-level value in a short time. The measurement error of the double reference tube level gauge can be controlled within 10% when the depressurization rate is small, and the real water-level can be tracked in tens of seconds.
(3) Increasing the supply water flow rate can reduce the flash evaporation intensity in the reference cup under the condition of rapid depressurization rate, but cannot reduce the relative error of the water-level measurement system during the transient measurement, nor shorten the response time of water-level measurement systems.
The research that has been completed so far is mainly about the measuring characteristics of the measurement device in a stationary state. Additionally, the water-level measurement device may work under the conditions of rolling motion and sloshing motion. In the future, we will focus on the ocean application scenarios to further study the measuring characteristics of the measurement device. Meanwhile, we also hope that researchers can do further experimental research on the double reference tube level gauge under the transient depressurization condition and optimize its structure to improve the measurement accuracy.
Data Availability Statement
The raw data supporting the conclusions of this article will be made available by the authors, without undue reservation.
Author Contributions
In the course of the completion of this thesis, all authors have substantial contributions to design of the work. GF and JC provided the research direction of the subject. XZ determined the research method and specific parameters such as the working quality. LS and XZ carried out numerical simulation and obtained, collated and analyzed the data, in the process, JC had been instructed and helped. XZ wrote the first draft of the manuscript and was corrected by GF, and JC also gave some suggestions. All authors approved the final version to be published and agreed to be responsible for all aspects of the work.
Funding
The authors greatly appreciate support from the National Natural Science Foundation of China (Grant No. 11875117) and the Fundamental Research Funds for the Central Universities (No. 3072020CFJ1502).
Conflict of Interest
The authors declare that the research was conducted in the absence of any commercial or financial relationships that could be construed as a potential conflict of interest.
References
CGN Research Institute Co., Ltd. (2018a). A Device and Method for Measuring Water Level of Pressurizer: China, 201810443517.6. 2018-05-10 (in Chinese).
CGN Research Institute Co., Ltd. (2018b). Pressurizer and Liquid Level Measuring Device for Pressurizer of Offshore Floating Platform: China, 201810433077.6. 2018-05-08 (in Chinese).
Jiang, R. T., Zhou, S. L., and Wei, Y. Q. (2013). Transient analysis for water level of AP1000 steam generator. Atomic Energy Sci. Technol. 47, 610–613.
Jin, B., Zhang, Z., and Zhang, H. (2015). Structure design and performance analysis of a coaxial cylindrical capacitive sensor for liquid-level measurement. Sens. Actuators A Phys. 223, 84–90. doi: 10.1016/j.sna.2014.12.027
Kim, J. Y., Lee, J. H., Bae, S. E., Paek, S., Kim, S. H., Kim, T. J., et al. (2017). Automated high-temperature liquid level measurement system using a dynamic tube pressure technique. J. Indus. Eng. Chem. 49, 30–35. doi: 10.1016/j.jiec.2016.10.041
Lee, D. W., No, H. C., and Song, C. H. (2005). Measurement of two-phase mixture level using an ultrasonic method. Exp. Ther. Fluid Sci. 29, 609–614. doi: 10.1016/j.expthermflusci.2004.07.003
Li, D. P., and Jiao, Z. G. (1999). Correction calculation of the double reference tube level gauge for steam generator. Power Syst. Eng. 15, 21–23.
Li, D. P., and Sun, F. R. (1997). The improvement of water level measurement system of marine steam generator. Power Gen. Equip. 5, 28–30.
Li, D. P., Yang, Z. D., and Zhao, Y. S. (2005). Improvement of soft sensing technology of double reference tube level measurement system of evaporator. Comput. Meas. Control 13, 1186–1188.
Lin, J. (1986). The method for measuring level of high temperature and high pressure vessels for marine. Nucl. Power Eng. 7, 65–71.
Mel’nikov, V. I., Ivanov, V. V., and Teplyashin, I. A. (2016). The study of ultrasonic reflex-radar waveguide coolant level gage for a nuclear reactor. Nucl. Energy Technol. 2, 37–41. doi: 10.1016/j.nucet.2016.03.007
Melnikov, V. I., and Khokhlov, V. N. (1997). Waveguide ultrasonic liquid level transducer for nuclear power plant steam generator. Nucl. Eng. Design 176, 225–232. doi: 10.1016/s0029-5493(97)00155-6
Paczesny, D., Tarapata, G., Michał, M., and Jachowicz, R. (2015). The capacitive sensor for liquid level measurement made with ink-jet printing technology. Proc. Eng. 120, 731–735. doi: 10.1016/j.proeng.2015.08.776
Petrie, C. M., and Mcduffee, J. L. (2018). Liquid level sensing for harsh environment applications using distributed fiber optic temperature measurements. Sens. Actuators A Phys. 282, 114–123. doi: 10.1016/j.sna.2018.09.014
Rizi, M. T., and Abadi, M. H. S. (2017). Analytical modeling of a coaxial cylindrical probe capacitive sensor based on MATLAB/Simulink for conductive liquids level measurements. Turkish J. Elect. Eng. Comput. Sci. 25, 3024–3036. doi: 10.3906/elk-1603-259
Salehi, A., Kazemi, M. H., and Safarzadeh, O. (2018). The μ–synthesis and analysis of water level control in steam generators. Nucl. Eng. Technol. 51, 163–169. doi: 10.1016/j.net.2018.09.018
Singh, S., and Mohanty, A. R. (2018). Measurement of boiling liquid levels by decomposition of sound waves in a waveguide. Appl. Acoust. 129, 248–257. doi: 10.1016/j.apacoust.2017.08.005
Wang, G. H., Peng, C. H., and Guo, Y. (2016). The preliminary thermal–hydraulic analysis of a water cooled blanket concept design based on RELAP5 code. Fusion Eng. Design 109, 489–495. doi: 10.1016/j.fusengdes.2016.02.069
Xiong, F., and Zhou, H. Q. (2016). The optimization of level measurement system for steam generator of CPR1000 Nuclear Power Plant. Electr. Instrum. Customer 23, 95–97.
Zhang, G. D., Yang, X. H., Ye, X. L., Xu, H., Lu, D. Q., and Chen, W. (2012). Research on pressurizer water level control of pressurized water reactor nuclear power station. Energy Procedia 16(Part–B), 849–855. doi: 10.1016/j.egypro.2012.01.136
Zhang, Y., and Liu, X. Y. (2013). Research on the liquid level in tin bath based on application of capacitance sensor. Adv. Mater. Res. 816-817, 429–432. doi: 10.4028/www.scientific.net/amr.816-817.429
Keywords: the double reference tube level gauge, transient depressurization, measurement error, response characteristics, the measuring characteristics
Citation: Zhou X, Cheng J, She L and Fan G (2020) Analysis of Measuring Characteristics of the Differential Pressure Water-Level Measurement System Under Depressurization Condition. Front. Energy Res. 8:145. doi: 10.3389/fenrg.2020.00145
Received: 25 April 2020; Accepted: 12 June 2020;
Published: 27 August 2020.
Edited by:
Jun Wang, University of Wisconsin–Madison, United StatesReviewed by:
Jiankai Yu, Massachusetts Institute of Technology, United StatesXingang Zhao, Massachusetts Institute of Technology, United States
Copyright © 2020 Zhou, Cheng, She and Fan. This is an open-access article distributed under the terms of the Creative Commons Attribution License (CC BY). The use, distribution or reproduction in other forums is permitted, provided the original author(s) and the copyright owner(s) are credited and that the original publication in this journal is cited, in accordance with accepted academic practice. No use, distribution or reproduction is permitted which does not comply with these terms.
*Correspondence: Guangming Fan, ZmFuZ3VhbmdtaW5nMDA3QGhvdG1haWwuY29t