 Tristan R. Davenne*
 Benjamin M. Peters
- Rutherford Appleton Laboratory, Science and Technology Facilities Council, Harwell Campus, Oxfordshire, United Kingdom
Results from the first demonstration of Pumped Thermal Energy Storage (PTES) were published in 2019, indicating an achieved turn-round efficiency of 60–65% for a system capable of storing 600 kWh of electricity. PTES uses a theoretically reversible thermodynamic cycle involving compression and expansion stages with constant pressure heat addition and rejection to hot and cold thermal stores. Energy storage turn-round efficiency largely depends on the isentropic efficiencies of the compression and expansion equipment, the thermal effectiveness of the thermal stores, the presence of circuit pressure drops, heat leaks to and from the system and electrical machine efficiencies. We present a simulation model of a PTES system which is used to produce an inventory of the relative magnitudes of the various system losses. We consider the feasibility of a large-scale, 1 GWh nominal storage capacity, PTES system with de-coupled thermal stores; and provide comparison with the so far more investigated, coupled system. Based on ambitious yet realistic component performances, we calculate an energy storage turn around efficiency of 65.3 and 59.5% for the coupled and de-coupled systems, respectively. Even with dwell times in the charged state as long as 5 days, a turn-round efficiency of over 50% is still predicted in both systems; suggesting that PTES could offer a viable large-scale, long duration energy store.
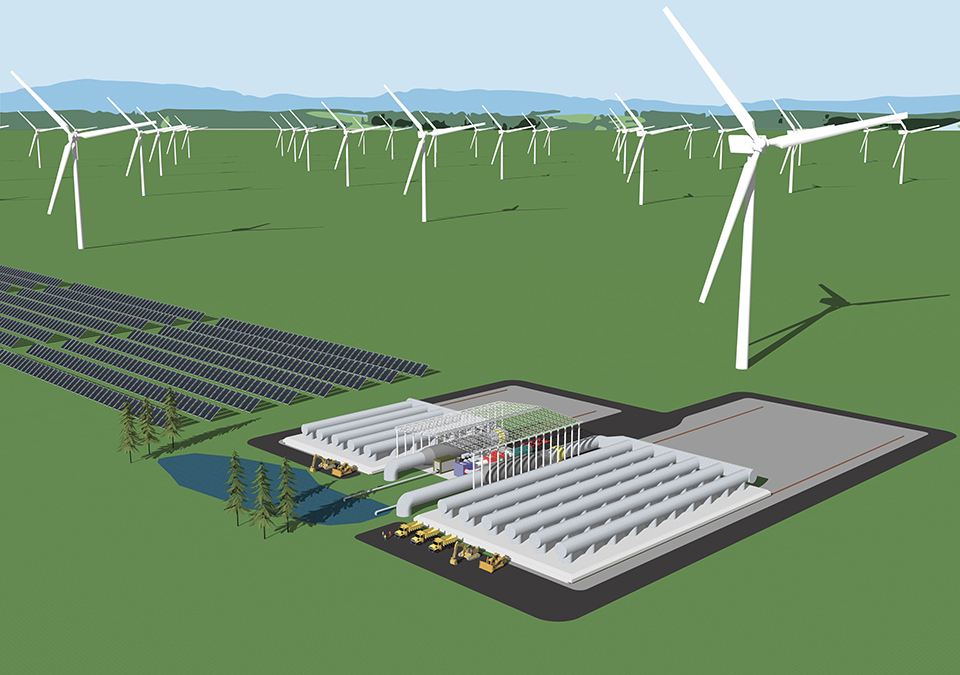
Graphical Abstract. Graphical representation of a 1GWh Pumped Thermal Energy Storage System.
Introduction
Anthropogenic climate change is linked to the emission of greenhouse gases such as carbon dioxide. Efforts to increase the proportion of low carbon electricity in the national grid are hampered by the intermittent nature of renewable energy, necessitating substantial energy storage. Mackay suggested that in order to accommodate future projected penetrations of renewable energy, the UK would need 20 kWh of storage per person; equating to 1,200 GWh of energy storage.
Batteries have been, and continue to be, a heavily investigated approach to energy storage. This is unsurprising because they can produce turn-round efficiencies of 67–86% (Mongird et al., 2019). They are especially suitable for small scale storage and in cases where rapidly adjustable output is desired. Hence, their extensive application in decarbonizing road vehicles. Assuming that the entire UK vehicle fleet can be transitioned to electric, the storage requirement per person would be met collectively by the vehicle batteries. However, national energy strategies that depend on the public's potential submission of personal vehicles for grid purposes are presently difficult to imagine. Batteries have also found larger scale applications in grid electricity. Specifically, providing short term storage to ensure the frequency of the grid electricity remains within acceptable limits; a task that has become more prevalent with the transition to renewable technologies from coal fired power plants that naturally provided frequency stability through high inertia mechanical components. Nevertheless, batteries are associated with problems related to scarcity of essential materials such as cobalt, high carbon footprint associated with manufacture and the cost of scalability.
For large-scale energy storage capable of balancing a grid with high penetrations of renewables, hydro power is the most well-proven approach and according to Mackay, the UK could potentially expand from its current 30 GWh of storage capacity to 400 GWh (Mackay, 2009). Pumped hydro has good turn-round efficiency between 65 and 80% (Kougias and Szabo, 2017) and can deliver long term storage. However, this is clearly geography dependant and requires significant civil engineering costs such as building dams.
Compressed air energy storage (CAES) has been proven in a plant in Germany and in Canada but turn-round efficiencies have so far been quite low (<50%). Adiabatic-CAES has achieved higher turn-round efficiency yielding values of 63–74% in a small scale pilot demonstrator in a tunnel in the Swiss Alps (Geissbühler et al., 2018) but as yet these schemes have not been demonstrated at large-scale. Large-scale CAES is also geography dependant requiring salt caverns.
PTES stores heat in rock or gravel and uses compression and expansion equipment to insert and extract energy. The low cost of the energy storage media renders the technology highly scalable. It has been predicted that the levelised cost of storage (LCoS) (Smallbone et al., 2017) is competitive with more established methods such as pumped hydro and CAES. However, unlike pumped hydro and CAES, PTES does not depend on geography and could be sited almost anywhere; such as near large wind farms or on the site of coal fired power stations that have been converted to run on gas and no longer require the land occupied by coal heaps. PTES for large-scale storage is significantly cheaper than battery storage of an equivalent scale and it is reasonable to expect the difference to increase with storage capacity because, contrary to batteries, the storage material itself is a negligible factor on the LCoS.
At the heart of a Pumped Thermal Energy Storage (PTES) system is a reversible cycle where, in charge mode, a working fluid is compressed (1-2), gives up its heat to the hot store (2-3), is expanded to a low temperature (3-4) where it cools the cold store (4-1) before being recompressed (Figure 1). Here, the compressor work is much higher than the expander work and so mechanical energy is being absorbed and transferred into stored heat within the packed bed thermoclines. The work absorbed by the system is the area within the anti-clockwise cycle on the T-S diagram. Upon discharge the fluid direction is reversed, the working fluid is cooled by passage through the cold store (1-4) prior to passing into the compressor (4-3). Ambient temperature fluid discharge from the compressor is then heated by passage through the hot store (3-2) prior to expansion in the expander (2-1) (Figure 1). Here, the compressor work is minimized and expander work maximized to return as much energy as possible. The cycle is now clockwise and so the area within the cycle represents the work done. If the compression and expansion is isentropic, and the heat exchange in the thermal stores was ideal with no pressure drop, then the discharge cycle area is the same as that of the charge cycle; highlighting the theoretically reversible nature of this method of energy storage. The achieved turn-round efficiency depends on the thermodynamic reversibility of the compressor and expander, the effectiveness of the thermal stores at returning the gas during discharge as near to the charging temperature as possible, pressure drops in the circuit and heat leaks to and from the circuit.
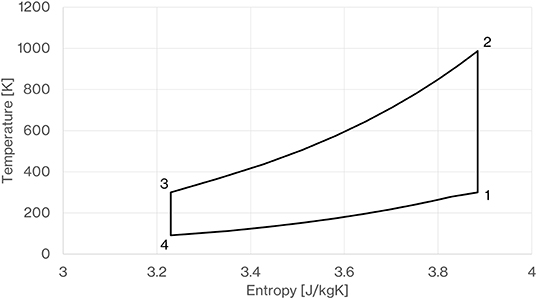
Figure 1. Temperature-Entropy diagram for ideal PTES system, charge mode is anticlockwise, discharge mode is clockwise.
There has been a significant body of academic work on pumped thermal energy storage in the last decade. In 2010, Desrues et al. described a new type of thermal energy storage process for large scale electrical applications (Desrues et al., 2010). They describe a PTES system with a high and low pressure thermal store and four turbo machines and present an expression for the turn round efficiency based on a polytropic efficiency for all the turbomachines. In 2011, Morandin et al. (2012) described the conceptual design of a Thermo Electric Energy Storage system based on a transcritical CO2 cycle. In this study hot water and ice storage are separated from thermal machines by heat exchangers which transfer energy in the form of heat from the thermodynamic cycle to the storage subsystems. In 2012, Mercangoz et al. (2012) also presented a transcritical CO2 storage system and predicted that system cost would fall significantly for large scale systems and gave a limit on turn round efficiency of 74%. Then in 2013, Morandin et al. (2013) published a techno-economic optimization of his concept system and concluded that the turn round efficiency >64% would not be practically realizable. Work by Howes (2012) described the development of reversible heat pumping as an energy storage strategy and showed some results from a prototype reciprocating heat pump which informed much of the development of the recent successful demonstration of PTES. Howes also made the important point that for the application of energy storage, an ideal thermodynamic cycle that has potential for achieving the Carnot efficiency is not necessary but instead the important requirement is that the ideal cycle is theoretically reversible. It is also noted that PTES appears to offer an efficiency comparable to existing pumped hydro installations combined with very competitive installed costs, inherent safety, and the ability to be deployed in a range of scales. White et al. (2013) show that PTES performance is fundamentally determined by the ratio between the highest and lowest temperatures in each reservoir. The sensitivity of round-trip efficiency to various loss parameters is also analyzed and this indicates particular susceptibility to compression and expansion irreversibility. The CHEST (Compressed Heat Energy Storage) concept facility presented by Steinmann (2014) is a PTES concept based on a medium temperature steam cycle with both sensible and latent heat energy storage units. Steinman makes the point that high temperature adiabatic compressors required for efficient PTES systems do not exist in the state of the art. Simulations of the CHEST concept show a turn-round efficiency of >70% with a maximum system temperature of only 400°C. Pressure losses in pipes and storage systems are ignored and it is assumed that the system is adiabatic, i.e., no heat leaks to the environment. The first demonstration PTES facility was built by a company known as Isentropic Ltd and it was then handed over to the Sir Joseph Swan center at Newcastle1 University to commission and test the facility. The system has a storage capacity of 600 kWh and a rated output power of 150 kW and proprietary reversible compression and expansion equipment with a pressure ratio of 12. The working fluid passes directly through the thermal stores and the hot thermal store is a pressure vessel capable of withstanding 12 bar and a temperature of 773 K. In 2019, successful demonstration of a turn-round efficiency of 65% was reported in this first of a kind system and we believe this is a great achievement showing the potential of PTES.
While the first demonstration PTES facility was being completed, academic work continued. In 2017, Benato (2017) performed a comprehensive study of PTES and also proposed a PTES system with additional electric heating and a single heat exchanger with air as the transfer fluid. He also used and tested 1D numerical models of packed bed thermal stores. Laughlin (2017) shared his concepts for a PTES system where heat is added to and removed from the working fluid of a closed-cycle Brayton engine by means of heat exchangers with counter flowing storage liquids. This system uses two tank thermal storage systems with molten salt and hydrocarbon liquid for the hot and cold thermal storage media, respectively. In 2017, Laughlin says about his PTES concept that “it is an implementation of pumped thermal storage, that differs from others chiefly in the substitution of heat exchangers for thermoclines.” He points out that in the limit, the entropy generation by the heat exchangers is zero. He also makes an interesting comparison of PTES with pumped hydro saying “One kg of water falling 380 m transmits 3.4% of the energy to the turbine blades that 1 kg of argon working fluid does when it travels around the Brayton circuit. In the case of nitrogen working fluid, it is 1.7%. Thermal storage also uses less land than pumped hydroelectricity does—and, of course, requires no mountains or water supplies.” Tauveron et al. (2017) presented an experimental study of supercritical CO2 in a Thermo-Electric Energy Storage system including Rankine and Heat-Pump Cycles in 2017. They quote transient numerical simulations of a complete system achieving round trip efficiency of ~30–35% due to losses in storage and irreversibilities occurring in heat exchangers and machineries.
Since the construction of the demonstrator, work by McTigue et al. (2019) on PTES with supercritical CO2 cycles has illustrated how a cycle with non-ideal gas can give better turn-round efficiency as compared to an ideal gas. Using a temperature and pressure loss coefficient turn-round efficiency is calculated as a function of isentropic efficiency for ideal and non-ideal gas cycles. Including all loss coefficients, it is stated that turn-round efficiency for PTES between 40 and 70% is feasible (McTigue et al., 2019). Lalanne and Byrne (2019), also in 2019, presented a Large-Scale Pumped Thermal Electricity Storage system using CO2 as the working fluid combined with an underground pumped hydro system that used lined rock caverns to house the storage media. A steel lining is used for sealing and then a concrete backfill structure is used to transfer the pressure forces from pressurized gas in the container to the bedrock. It is pointed out that, at high operating pressures of 7–15 MPa, cylinder-shaped steel vessels in open-air locations not constrained by rock mass, cannot represent economical solutions for diameters larger than 5 m, since large above ground pressurized vessels benefit from no effect of scale in terms of mass of construction materials and since large thickness of metal are too costly to assemble related to the welding work and its certification.
We investigate a de-coupled system and compare it to a coupled one. The de-coupled system is differentiated by having a separate working circuit that is connected to two low pressure packed bed thermoclines (one hot and one cold) via heat exchangers. Having the heat transfer fluid in the thermal stores near to atmospheric pressure, means that the storage vessels can be scaled up without the constraints imposed by having the working fluid in the hot store at high pressure. It may also make running the working fluid circuit with higher pressure ratios more feasible.
Motivated by the promising work carried out on PTES so far, and the impending demand for large-scale energy storage, here we offer several contributions. Firstly, the dependence of PTES turn-round efficiency on turbomachinery isentropic efficiencies in isolation. Secondly, the conceptual design and performance analysis of a 1 GWh de-coupled PTES system including comparison to the coupled counterpart.
This analysis shows the expected performance with realistic design parameters and the influence of the various design parameters in a One at a Time sensitivity analysis; a breakdown of the losses from each component is given. The model used includes isentropic efficiencies of compression and expansion equipment, pressure drops in heat exchangers and numerical representation of the thermocline thermal stores. The analysis also addresses the question of long term energy storage performance of a PTES system by studying performance as charged dwell time increases. Lastly, we look at some practicalities of both systems and perform a simple cost analysis.
PTES System Models
First consider the simpler coupled system model where the working fluid passes directly through the thermal stores (Figure 2). The thermal stores would be filled with gravel, mainly consisting of quartz with an average pebble size of around 4–10 mm in diameter. We assume heat exchange with ambient water is available. During the charging and discharging phases, the operating temperatures of the compression and expansion equipment differ significantly. For example, in the charge phase the expander may have an inlet temperature of 300 K and an outlet temperature near 100 K, whereas during discharge the expander may have an inlet temperature near 1,000 K and outlet temperature near to 300 K. We envisage that axial flow turbomachinery could be employed for the compression and expansion requirements and we suggest that having different machines for the charge and discharge conditions would aid the design of machines with high isentropic efficiency. A series of two-way valves are shown which are switched between charge and discharge modes; changing the direction of flow through the thermal stores and switching in and out the appropriate compression and expansion equipment. As the working fluid passes through the thermal stores, the hot store will always be at, or near to, the compressor delivery pressure; necessitating a significant pressure vessel to store the hot gravel.
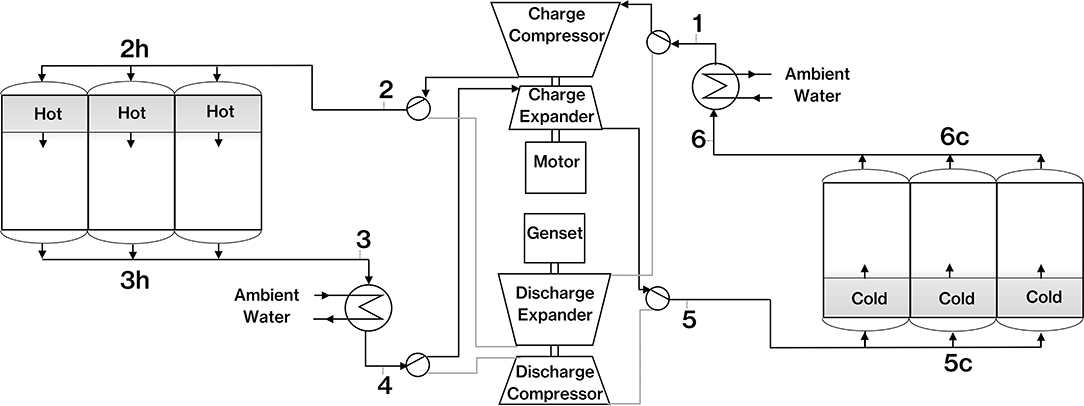
Figure 2. Coupled PTES system in charge mode (note valve arrangement for switching to discharge mode).
What we are referring to as a de-coupled system is one where the thermal stores have their own heat transfer fluid circulating within them that does not pass through the compression-expansion circuit (Figures 3, 4), or what we refer to as the working circuit. The separate working circuit transfers heat to the thermal store circuits via de-coupling heat exchangers. The working circuit is essentially the same as the coupled system except the near constant pressure heat transfer is done in the de-coupling heat exchangers instead of directly with the thermal storage material. The potential advantage of this is that the thermal stores, in particular the hot store, does not have to be at the elevated pressure of the working circuit and so can operate at near atmospheric pressure. At first glance, this opens the door to the design of large thermal stores without the constraints and size limits of high pressure, heavy walled, cylindrical vessels which are recognized as the most efficient geometry for a pressure vessel. The de-coupled system does require two fans to circulate heat transfer fluid through the thermal stores and the de-coupling heat exchangers. These bring an additional loss, but the pressure drop through the thermal store and de-coupling heat exchanger can be made low to minimize this.
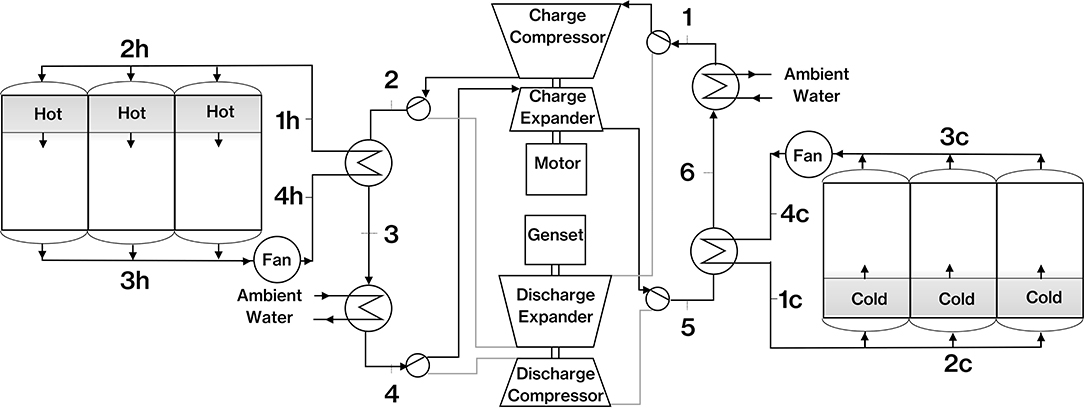
Figure 3. De-coupled PTES system in charge mode.
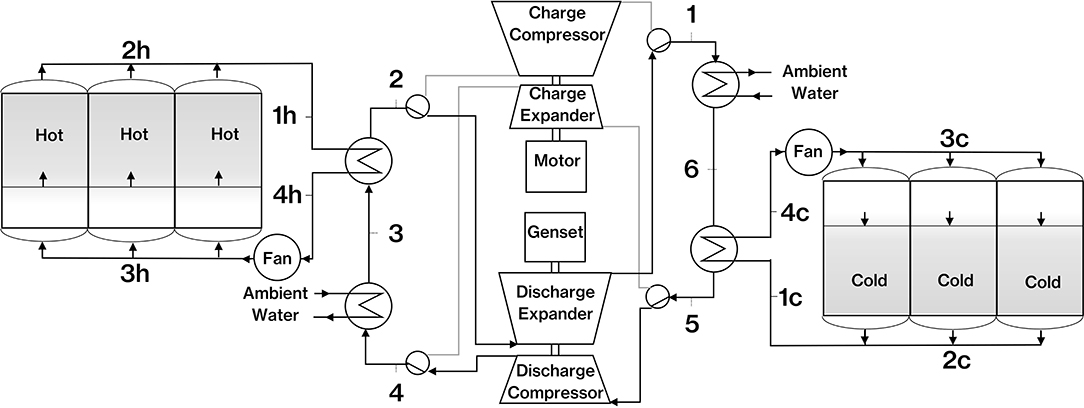
Figure 4. De-coupled PTES system in discharge mode.
Dependence of PTES Turn-Round Efficiency on Isentropic Efficiency of Turbomachinery
We note that several equations for the turn-round efficiency have been presented in the last decade (Desrues et al., 2010; White et al., 2013; Laughlin, 2017) including in particular White's general expression for turn-round efficiency. This general expression is now developed in a slightly different form that directly shows the dependence of turn-round efficiency on the isentropic efficiency of both the compressor and the expander and the pressure ratio.
We consider an idealized PTES system where the working gas is treated as an ideal gas and the only loss considered is the irreversibility of the compressor and expander. The work associated with the compressor and expander are calculated from the steady flow energy equation. The temperature change across each machine depends on the pressure ratio and the isentropic efficiency giving the following expressions for compressor and expander work, respectively.
It ensues that the net work absorbed by the PTES system during charging and the net work done during discharging is represented in the following equations where we note the charging and discharging pressure ratio is the same.
From the definition of isentropic efficiency the following expressions for the temperature ratio across the compressor and expander as a function of pressure ratio and isentropic efficiency can be determined
Assuming that the system is charging and discharging for the same amount of time then we calculate the turn-round efficiency as follows
We also assume that T1 = T4 and that we have perfect thermal stores which return gas at the charging temperature such that the expander and compressor inlet temperatures during discharge are always equivalent to the hot and cold storage temperatures achieved during charging. Substituting Equations (5) and (6) into Equation (4) and then substituting Equations (3) and (4) into (7) we arrive at the following expression for turn round efficiency.
where
Figure 5 shows the result of calculating the turn-round efficiency with Equation (8) for a working fluid of argon and a pressure ratio of 20. As this assumes no other losses in the system this represents the maximum possible turn-round efficiency that is achievable for a given pressure ratio and compressor and expander isentropic efficiency which are the parameters generally used by industry to describe machine performance. It is clear that minimizing irreversibilities in both machines is critical for efficient PTES. We also note a stronger drop in performance as the expander isentropic efficiency is reduced as compared to that of the compressor. This is because irreversibilities in the compressor lead to a higher outlet temperature than a theoretically perfect isentropic machine and so some of the extra work required to power the imperfect machine is converted to useful high grade heat that can be stored during the charge phase. This is not the case for the expander where an imperfect machine just results in a higher cold store temperature and less expander work on discharge, degrading turn-round efficiency on both counts.
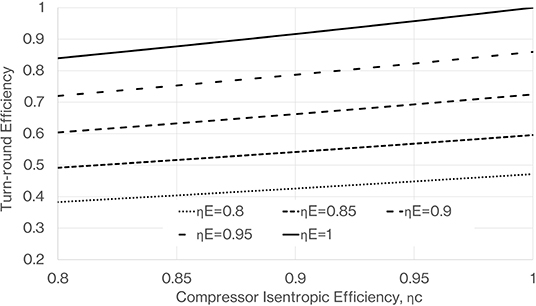
Figure 5. Turn-round efficiency as a function of compressor and expander isentropic efficiencies, calculated using Equation (8) with pressure ratio of 20 and ratio of specific heats for a monatomic gas such as argon.
Outline Design of 1 GWh De-coupled PTES System
We model a PTES system that is capable of repeatedly delivering 1 GWh of electrical power with a rated output power of the order 100 MW. The hot and cold stores have an internal volume of 30,000 and 60,000 m3, respectively. Simple thermodynamic analysis of PTES indicates that the hot and cold thermal stores should have the same thermal mass (Davenne et al., 2017). However, due to the reduction in heat capacity of the storage media at low temperature (Anderson, 1936) the cold store needs to be approximately double the size of the hot store. The total required mass of gravel to fill the thermal stores assuming a void fraction of 0.5 is ~90 ktons. The outline design has thermal stores which are surrounded by a layer of ceramic fiber insulation, 0.5 m thick, with thermal conductivity of 0.5 W/mK. A pebble diameter of 4 mm is selected as this gives a good compromise between pressure drop and heat transfer surface area. The thermal stores have a low aspect ratio with a minimum width of 30 m and a depth in the flow direction of 10 m. A low aspect ratio is also found to be beneficial in terms of minimizing pressure drop and associated energy losses (Cardenas et al., 2018). The thermal stores are fed with a manifold based on series of ducts of diameter 5 m, which ensures the manifold pressure drop is significantly lower than thermal store pressure drop. This should help to ensure the flow is uniform across the thermal store and avoid problems with thermocline instabilities (Davenne et al., 2018). We select argon as the working circuit fluid and nitrogen in the de-coupled thermal stores, facilitating comparison with a coupled system using argon. The higher ratio of specific heats of argon as compared to nitrogen means that higher temperature ratios can be achieved for a given pressure ratio. It can be seen from Equation (8) that a pressure ratio of 20 with argon and 64 with nitrogen will achieve equivalent turn-round efficiencies. The maximum temperature ratio for a PTES system will be limited by the allowable operating temperature of the storage materials and the materials used for construction of the turbomachinery, the liquification temperature of the gas and the pressure ratio that is achievable with the turbomachinery. Argon working fluid with a pressure ratio of 20 approaches the practical maximum temperature ratio within typically achieved industrial axial flow compressor pressure ratios (i.e., up to 30) (Boyce, 2011). We assume the use of axial flow compressors and expanders and select a value of isentropic efficiency of 0.9 for the compressor and 0.95 for the expander. According to Balmer (2011) turbine and compressor isentropic efficiencies of modern aircraft gas turbine engines are typically in the range 85–95% and 80–90%, respectively. While we have taken optimistic values at the top of these ranges we also show the effect on system performance if these values are not achieved. Isentropic efficiencies for other machines such as scroll, roots or screw compressors/expanders tend to be lower than what is required here; i.e., of the order 0.7 (Dumont et al., 2018).
We now present some architect images of the outline design of the 1 GWh system to give an impression of the scale and content of such a system (Figures 6–8). The two thermal stores are situated on each side of an energy transfer hall which contains the working circuit. The thermal stores are built into an underground recess and then a top manifold is slid over the thermal store once it has been filled with gravel. Figure 6 shows the smaller hot store completely full of gravel and the top manifold still in the partially open position. The larger cold store is still being filled with the upper manifold fully open. Figure 7 shows more detail of the energy transfer hall containing the coaxial compression and expansion equipment in the middle of the building. These machines are then connected to the de-coupling heat exchangers via 1.5 m diameter ducts. These heat exchangers are critical components in terms of the efficiency of the system and their estimated size of 20 m length and 7 m diameter is driven by a need for high effectiveness and low pressure drop. While the de-coupled system will require large heat exchangers, there is evidence that with modern compact heat exchanger technology the desired performance is achievable (see Results section). The location of the fans which circulate nitrogen in the thermal stores is shown and also the ambient water heat exchangers and the valve boxes that enable switching from charge to discharge mode. Figure 8 shows a view of the facility from below ground showing the lower manifolds constructed beneath the thermal store and the depth of the gravel containing recess.
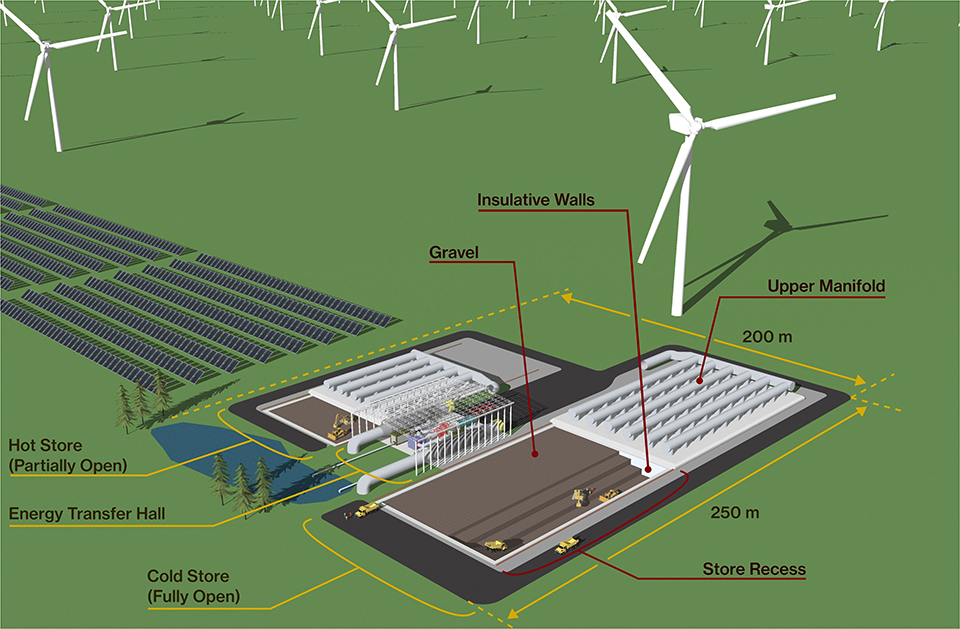
Figure 6. View of the facility shown in maintenance configuration (thermal stores open).
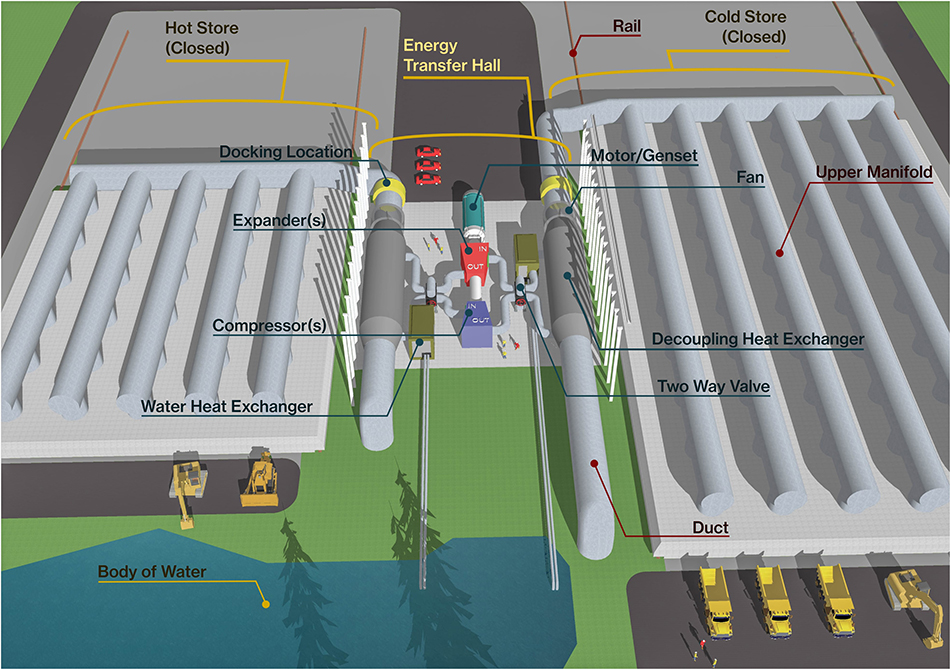
Figure 7. View of the Energy Transfer Hall and thermal stores shown in operating configuration.
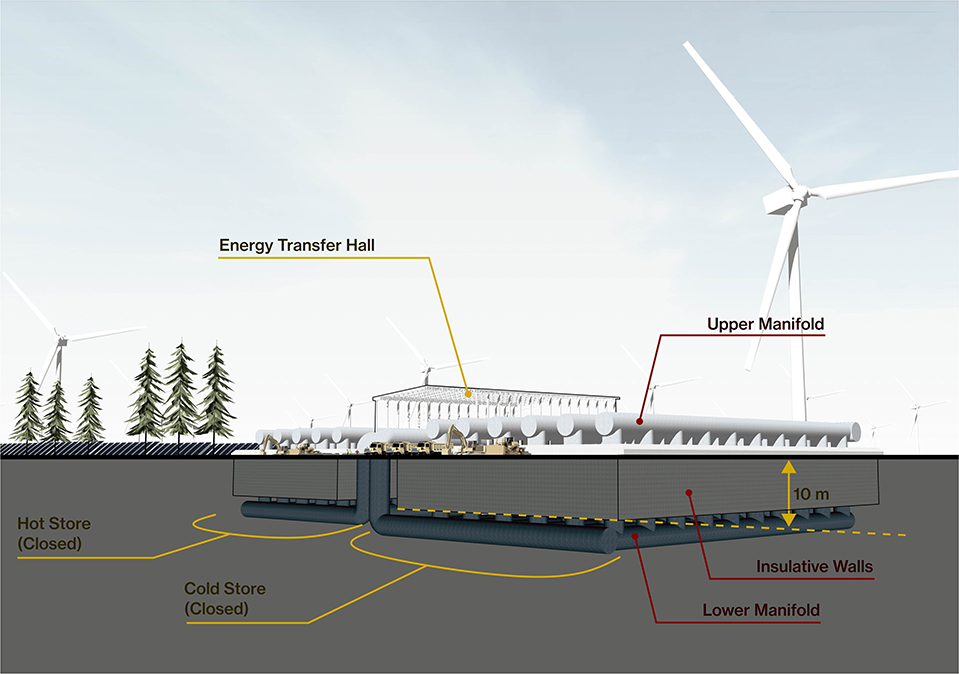
Figure 8. Underground view of the facility shown in operating configuration.
We list the selected design parameters for the outline design of the de-coupled PTES system (Table 1).
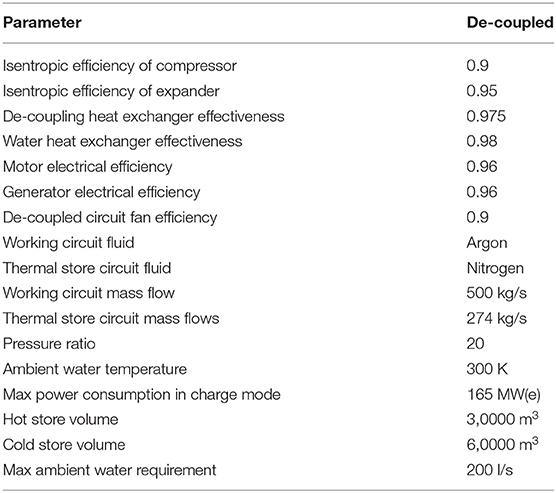
Table 1. Summary of outline design parameters.
PTES Simulation
A script has been written in MATLAB to model the performance of a PTES system. The main script calls several subroutines for modeling the sub-systems such as the thermal stores, compressors and expanders and heat exchangers. The algorithm shown in Figure 9 is intended to show the underlying logic used by the script and in what order the sub system models are called. It shows the temperature and pressure input and output values for each subsystem. The script is based around a forward time marching semi-implicit numerical method which is used to resolve the thermal store profiles. The stability of the solution has been investigated by checking that consistent results are given as time step and spatial steps are varied around the nominally used values which are a time step of 20s and a spatial step of 0.01 m. The equations behind each of the sub system models are explored in this section.
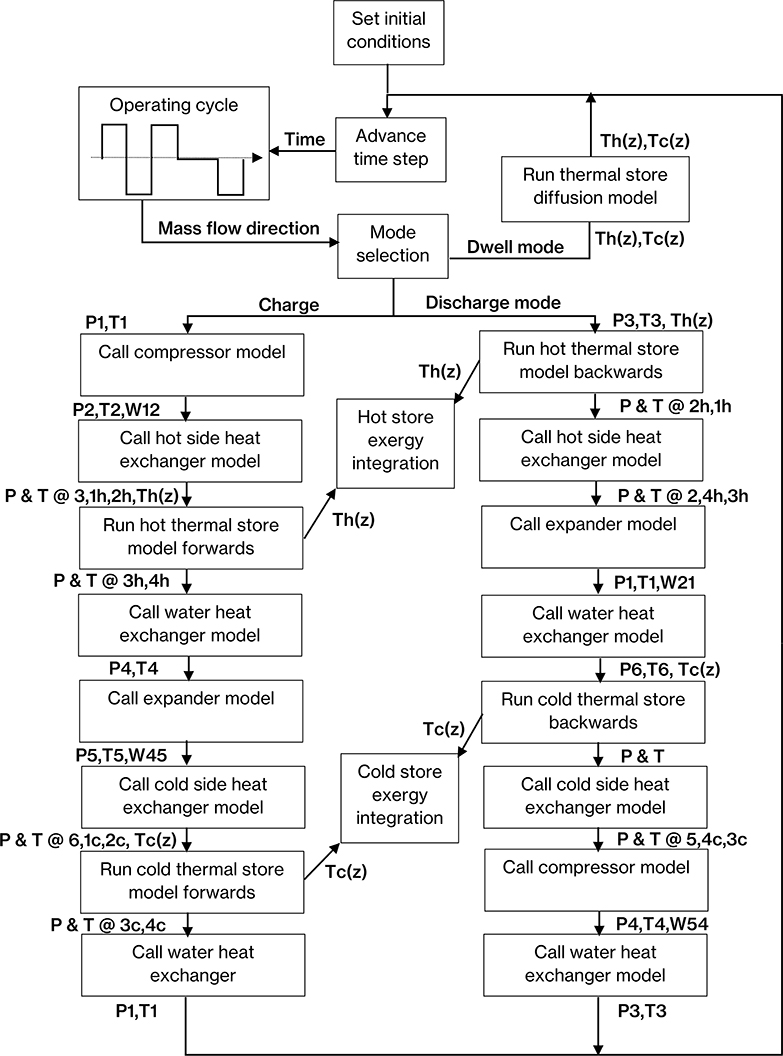
Figure 9. PTES simulation algorithm.
Thermal Store Model
At the heart of the PTES model is the simulation of the thermal stores. The evolving temperature and pressure profile in the thermal stores are determined with a time marching numerical method applied to a one dimensional model of the packed bed thermoclines. It should be noted here that this model assumes circular geometry of the packed beds despite the architect images showing rectangular stores (the total volume however is the same as in this model). This is not because a circle is preferable, but because it was convenient for the 1D model to have geometry that can be defined by a single dimension; furthermore, with large stores of low aspect ratio (such as drawn in architect images) results are still representative. The model includes a gas and solid element at each z position along the store and also accounts for heat transfer to and from the wall of the thermal store and heat leak through an external layer of insulation as shown in Figure 10.
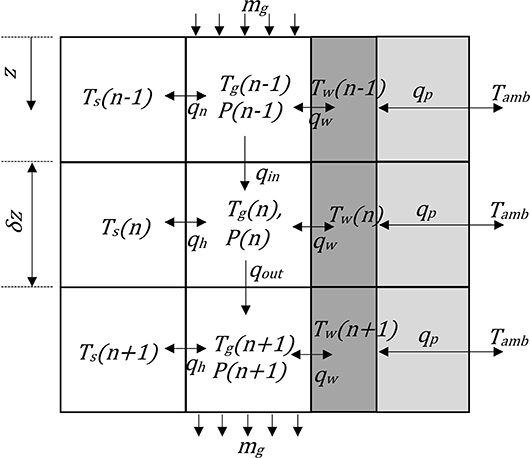
Figure 10. One-dimensional finite element model of thermocline showing solid and gas elements, vessel wall, insulation, and peripheral heat leak.
A heat balance accounting for elemental heat transfer between the gas and solid, qh, and convection of thermal energy between upstream and downstream elements, qout, qin, yields the following two differential equations known as the Schumann equations (Schuman, 1929).
and
where
We employ a semi-implicit method to solve this set of equations as described by White (2011). We start by integrating Equation (9) over a spatial step assuming Ts is constant across that step which gives the following
Adding the limits as each side of the spatial step gives
Then using the following
we get
Then integrate Equation (10) over each time step assuming Tg is constant. Following the same procedure gives a similar expression for Ts and then writing the two expressions in matrix form gives the following
Where a and b
Then invert the 2 × 2 matrix to find which represents the gas and solid temperatures at the next step in time. The computational space is shown in Figure 11.
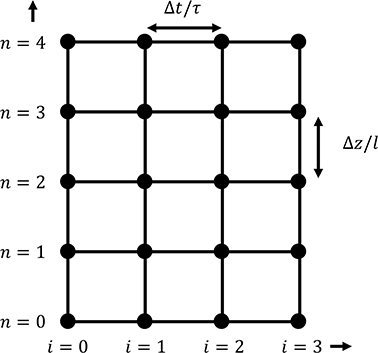
Figure 11. Computational space.
The initial condition for all values in space i.e., all values of n is applied to the left hand column of nodes (i =0). The value at n = 0 remains a user input for all i as this corresponds to the inlet temperature to the store. Knowing the value of Tg and Ts at i = 1, n = 0 and i = 0, n = 1 then the value at i = 1, n = 1 can be found using the matrix inversion. After each column in space is completed the algorithm marches on to the next column corresponding to a step forward in time.
The thermal inertia of the thermal store wall is accounted for by calculating the wall temperature at each position along the thermal store and the heat transfer between the gas inside the thermal store and the wall is calculated as follows
where UAw represents the overall heat transfer coefficient between the gas in the store and the center of mass of the wall. Peripheral heat loss from the thermal store to the surroundings is accounted for using an overall heat transfer coefficient between the wall and the ambient air. It depends on the conduction path through an outer insulation jacket and an assumed natural convection coefficient. Peripheral heat loss from each discrete element of the thermal store is determined using
Where
And R3 and R4 are the outer radius of the thermal store and the external radius of the insulation, respectively. Heat leak at the hot or cold end of the thermal stores is determined as follows where w is the thickness of the insulation on the top and bottom of the thermal store.
A discretized version of the Ergun equation (Ergun, 1952) is used to determine the pressure drop across the thermal stores at every time step
The temperature dependence of the gas properties means that the pressure drop through the thermal stores depends on their state of charge and is calculated at every time step.
Thermal Diffusion Model
We also consider the impact on turn-round efficiency of maintaining the thermal stores in the charged state. With no flow through the thermal stores the temperature profiles will change due to thermal diffusion in the packed bed and due to heat leak through the insulation to atmosphere. We solve the following diffusion equation numerically where β is the thermal diffusivity based on an effective thermal conductivity of the packed bed thermocline (Dietz, 1979).
In discretized form for each time step we have the following change in energy within an element of the thermal store, where keff is the effective thermal conductivity of the packed bed thermal store.
The temperature of the element at the next time step is then recalculated as follows
Exergy Integration
The exergy associated with a mass changing in temperature from a reference state 0 to state 1 is given by the following integral
We perform this integral for every element within the thermal store to determine the exergy held within each thermal store. We have used a temperature dependant expression for the heat capacity of the gravel (Equation 48). Substituting this into Equation (27) and integrating gives the following expression for the exergy contained within the nth element of the thermal store.
We can also find the exergy flow in and out of the thermal store as follows
Compressor/Expander Model
The compressor power is related to pressure ratio and isentropic efficiency as previously shown in Equation (1). Unlike in the section studying isentropic efficiency in isolation, the expander power is now calculated as follows
Where TIN represents the compressor and expander inlet temperatures. Referring to the system model (Figure 3) then TINc = T1 and TINe = T4 in charge mode and TINc = T5 and TINe = T2 in discharge mode (Figure 4). The expander pressure ratio is determined from the compressor pressure ratio and the calculated pressure drops in the thermal stores as follows.
Where in the case of a coupled system, ΔPh and ΔPc are the pressure drops in the hot and cold thermal stores, respectively, and obtained from integration of Equation (23) over the length of the thermoclines. ΔPwh and ΔPwc are the pressure drops in the ambient water heat exchangers. In the case of a de-coupled system ΔPh and ΔPc are the calculated pressure drops in the de-coupling heat exchangers. The net power being absorbed or delivered is simply determined from
During the charging phase the inlet to the compressor and expander is maintained near ambient temperature thanks to the ambient water heat exchange, i.e., T4≈T1≈Tamb. During charge mode the compressor discharge temperature is calculated as follows
and the expander discharge temperature is calculated as follows
During the discharge phase the inlet temperature for the compressor and expander are derived from the output of the thermal stores with account for heat leaks and heat exchanger effectiveness in the de-coupled case.
Fan Model
In the de-coupled system the heat transfer fluid is pushed through the heat exchangers and thermal stores with a fan. The fan compression work is simply based on the isentropic compression work as follows.
The fan is strategically placed at the top of the cold store circuit and at the bottom of the hot store circuit so that it operates near to ambient temperature thus making a standard machine viable. The pressure ratio is calculated on each time step from the sum of the pressure drop in the thermal store and the heat exchanger.
Heat Exchanger Models
The gas to gas de-coupling heat exchangers and the gas to ambient water heat exchangers are modeled using the NTU method. They are assumed to be a shell and tube heat exchanger consisting of a bundle of small pipes for the high pressure gas side surrounded with a single counter flow low pressure duct. The device is modeled as a series of counter flow heat exchangers with the number of transfer units being calculated as follows.
Where UA is the overall heat transfer coefficient between the two fluids. This is estimated based on the Dittus-Boelter Nusselt number correlation on each side and also the thickness of the pipe walls which are assumed to have the thermal conductivity of Inconel. The effectiveness of the heat exchanger is then determined as follows
If Cmin = Cmax then the effectiveness simplifies to
Once an effectiveness has been calculated it is then possible to determine the outlet temperatures from the heat exchangers as a function of the inlet temperatures. So for example with the de-coupled system model then assuming that the heat capacity of the flow on each side of the heat exchanger is equal then when in charge mode the inlet temperature to the thermal stores can be determined as a function of heat exchanger effectiveness as follows.
When in discharge mode the inlet temperatures to the compressor and expander are found as follows
The pressure drop on each side of the heat exchanger is determined from the Darcy equation for pressure gradient (Massey, 1989) due to turbulent flow in a smooth pipe. For turbulent flow the Blasius expression for the friction factor is used i.e.,
Heat Leak
Heat leak between the thermal stores and ambient air has already been accounted for in the thermal store model. We also account for heat leak between the manifold ducts and ambient air. This is simply dealt with using an overall heat transfer coefficient acting between the gas temperature in the duct and the ambient air. We assume the ducts are wrapped with a 0.5 m layer of ceramic fiber insulation. This results in a temperature difference which impacts on performance as shown by the following equations for operation in charge mode.
Where UAducts is the overall heat transfer coefficient between the gas inside the duct and the ambient air.
Material Models
The argon and nitrogen gases are treated as ideal gases. Data for the temperature dependence of gas properties such as viscosity and thermal conductivity are determined from the NIST database (Stewart and Jacobsen, 1989; Lemmon et al., 2018).
A linear relationship is used to determine the temperature dependence of the gravel as follows. This is based on a fit to data for quartz from Hemingway (1987) and Anderson (1936). Inspection of Equation (48) with CA = 450 and CB = 0.695 shows how the heat capacity is expected to drop with reducing temperature (Figure 12), T in units of Kelvin and specific heat capacity in units of J/kgK.
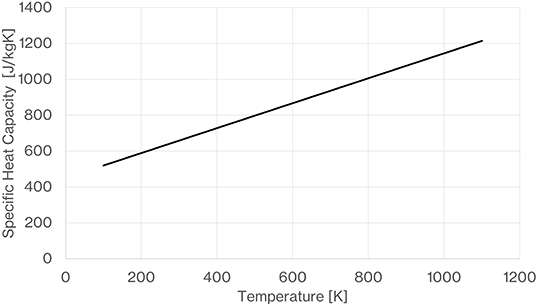
Figure 12. Temperature dependence of Heat Capacity of Quartz.
Turn-Round Efficiency
The turn-round efficiency is calculated on a cycle by cycle basis where the charge and discharge time is equivalent and the system and thermal stores have reached periodic operation, normally after 100 cycles.
where tc1 and tc2 are the start and end time of the charge cycle and td1 and td2 are the start and end time of the discharge cycle. ηM is the electric motor efficiency and ηG is the efficiency of the generator.
Results
We now present a series of results looking at the performance of the outline de-coupled design. We vary different important parameters one at time to see how sensitive the system is to each parameter. In all cases we calculate the turn-round efficiency of the outline design by entering a simple charge-discharge cycle (Figure 13) as the input to the simulation model. Each charge-discharge cycle is simply 10 h of charging followed by 10 h of discharging (1.65 GWh of electrical energy consumed during charging and 1 GWh of electrical energy produced during discharging with outline design parameters). The reported turn-round efficiency is calculated once the system reaches a repeatable periodic performance on each cycle. Unless stated otherwise all design parameters are as per the outline design (Table 1).
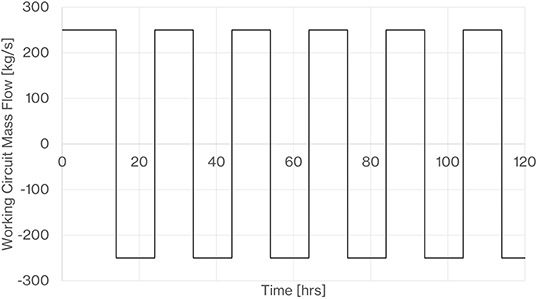
Figure 13. Repeating charge/discharge cycle used. On the mass flow axis, +ve refers to charging, -ve refers to discharging.
Thermal Stores
Figures 14, 15 show the thermal profiles in the hot and cold stores following an initial charge discharge cycle and then after 100 repeated charge-discharge cycles. The thermocline profiles shown after 100 cycles represent the periodic thermal fronts that develop after each charge and discharge phase. Figure 16 shows the calculated pressure within the decoupled hot and cold thermal stores at the end of the charge and discharge cycles, the predicted pressure difference across the hot thermal store is greater than that across the cold store as might be expected due to the higher temperature lower density gas. Even when nearing the fully charged state the pressure difference does not exceed 3,500 Pa.
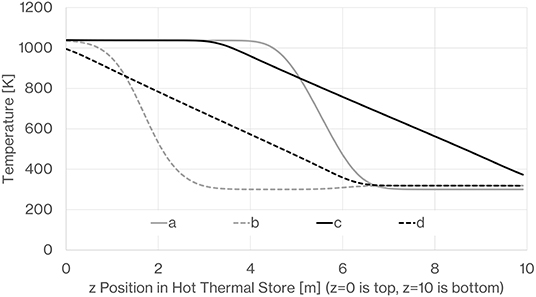
Figure 14. Hot store temperature profiles (z = 0 is top, z = 10 m is bottom). (a) After initial charge, (b) after initial discharge, (c) after 100 charge cycles, after 100 discharge cycles.
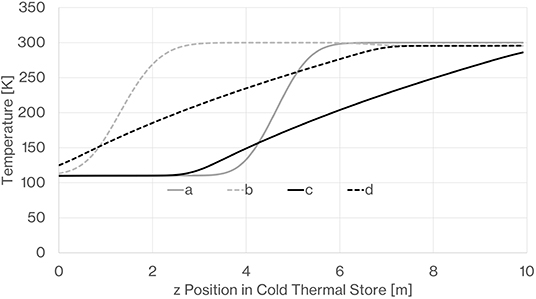
Figure 15. Cold store temperature profiles (z = 0 is bottom, z = 10 m is top). (a) After initial charge, (b) after initial discharge, (c) after 100 charge cycles, (d) after 100 discharge cycles.
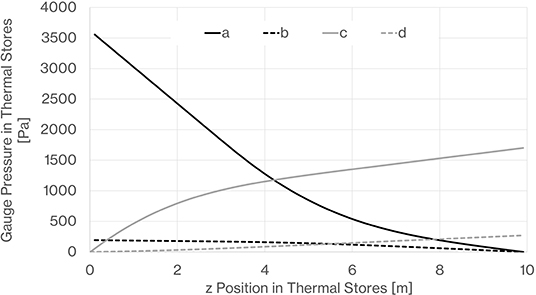
Figure 16. Guage Pressure within thermal stores. (a) Hot store in charge mode at end of charge cycle, (b) cold store in charge mode at end of charge cycle, (c) hot store in discharge mode at end of discharge cycle, (d) cold store in discharge mode at end of discharge cycle.
Figure 17 shows the integrated exergy contained within the thermal stores after each 20 h cycle and shows how the values asymptotes toward a constant. This confirms that the thermal store behavior becomes periodic with the thermal store profiles reaching the same shape following each charge/discharge cycle. The exergy reduces initially due to the rapid smearing of the initially sharp thermocline that occurs on the initial cycles. Then as the thermocline diffuses across the store more exergy is held until a limit is reached where the difference between outlet and inlet temperature starts to reduce on both the charge and discharge phases.
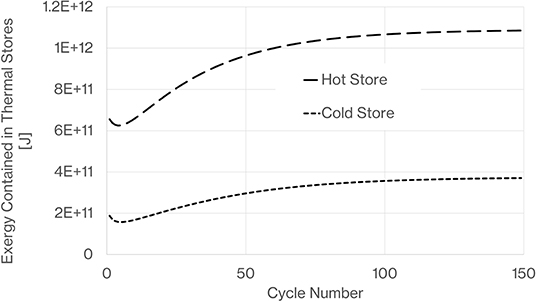
Figure 17. Stabilization of exergy within thermal stores indicating that thermal store behavior becomes periodic.
By way of validation we calculate the exergy loss from the thermal stores and the system energy loss for an ideal system where the only losses accounted for are those in the thermal stores. Initially the energy loss per cycle is low because the thermal stores are able to return heat very near to the stored temperature for the entire discharge period as there has not been any significant thermocline smearing. The complex development of the thermal front leads to an increase in system energy loss followed by a reduction asymptoting toward a constant value. The exergy loss in the thermal store is primarily dependant on the rate of diffusion of the thermal store thermal fronts. Initially on the first cycles this is a maximum when the model starts with a sharp edged thermal front. Then as the thermoclines reach a periodic repeatable shape with a smooth long variation in temperature from the hot side to the cold side the diffusion rate and exergy loss stabilize at a minimum value (Figure 18). Once a periodic operating state is reached it can be seen that the system energy loss per cycle determined from first law analysis corresponds well with the exergy loss within the thermal stores.
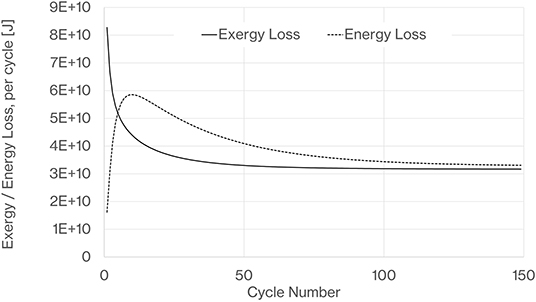
Figure 18. Exergy loss from both thermal stores and complete system energy loss per cycle, Ideal cycle i.e., compressor and expander isentropic efficiencies =1, heat exchange effectiveness =1 and heat exchanger pressure drops = 0.
Isentropic Efficiency
We now vary both the compressor and expander isentropic efficiency in the de-coupled system simulation with all losses associated with heat exchangers, thermal stores, electrical machine efficiencies, heat leaks and pressure drops accounted for. Figure 19 shows similar dependence on isentropic efficiencies as we have already seen but comparing with Figure 5 shows the impact of considering all the system losses as compared to a case where machine isentropic efficiencies are the only irreversibility in an otherwise ideal system. For the outline design parameters (isentropic efficiency of 0.9 and 0.95 for compressor and expanders, respectively) the system losses result in a drop in turn–round efficiency from 79 to 59.5%. Figure 19 shows how turn-round efficiency will degrade if we do not achieve the outline design isentropic efficiencies.
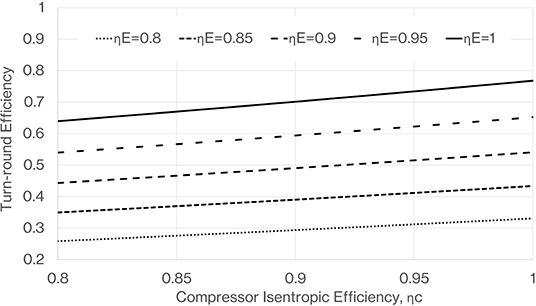
Figure 19. Turn-round efficiency as a function of compressor and expander isentropic efficiencies.
Pressure Ratio
The turn-round efficiency of the de-coupled system is found to increase with compressor pressure ratio (Figure 20), this is primarily because turn round efficiency is fundamentally dependant on temperature ratio and temperature ratio goes up with pressure ratio. The pressure difference across the expander will always be less than the pressure difference produced by the compressor due to pressure drops in the heat exchangers and duct work in the working circuit. However, as compressor pressure ratio is increased, the gas density on the high pressure side of the working circuit goes up and so pressure drops reduce and have less impact on the pressure difference available to drive the expander. The other implication of the pressure ratio is the maximum and minimum temperature of the hot and cold thermal stores (Figure 21). At a pressure ratio of 30 we are approaching a maximum temperature of 1,250 K which is at the limit of operating temperature for expensive nickel alloys for the connecting pipe work and hot thermal store vessel. Also at a pressure ratio of 30 the minimum temperature is approaching 90 K which is very close to the temperature where the gases we propose to use liquefy, i.e., around 87 K for argon and 77 K for nitrogen at atmospheric pressure. As argon and nitrogen approach liquification their specific heat capacity starts to increase significantly and this may be undesirable as it has the effect of increasing compressor work during the discharge phase thus reducing net output work. We consider a pressure ratio of 20 to be a practical limit where maximum hot store temperatures of the order 1,000 K are well-proven with nickel containing steel alloys and there remains a reasonable margin from liquification at the minimum cold store temperature. Studying the dependence of heat capacity on pressure and temperature reveals that specific heat capacity will not vary by more than 5% within a PTES system with a pressure ratio of 20. Tests have shown that rocks that are cyclically heated to 873 K retain integrity and only suffer a small reduction in heat capacity (Becattini et al., 2017) and so some further higher temperature testing would be of interest to confirm viability of a pressure ratio of 20. White et al. (2013) showed an expression for turn-round efficiency where the discharge pressure ratio is less than the charging pressure ratio and pointed out that there is an optimum turn-round efficiency as discharge pressure ratio reduces. Figure 22 shows a result from the model with the outline design parameters including charging pressure ratio of 20 but with a reducing discharge pressure ratio. An optimum efficiency can be clearly seen at a pressure ratio of 13 where turn-round efficiency is increased by just over 1.5% points as compared to the case of equal pressure ratio on charge and discharge. A reduced discharge pressure ratio would also give a benefit in terms of size and complexity of the discharge turbomachinery.
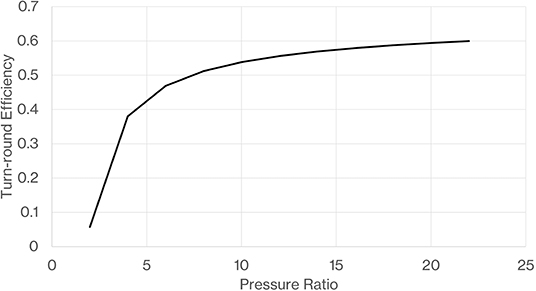
Figure 20. Influence of pressure ratio on turn-round efficiency.
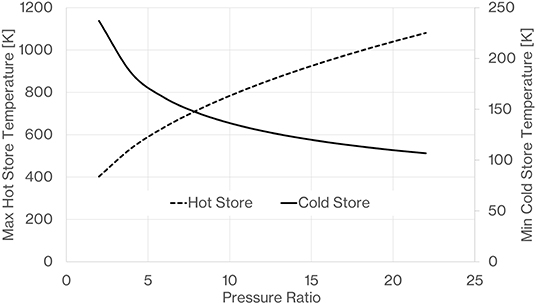
Figure 21. Influence of pressure ratio on maximum and minimum thermal store temperatures.
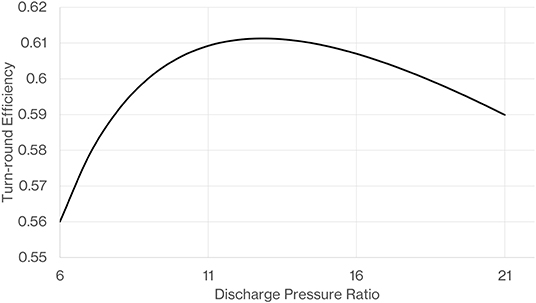
Figure 22. Advantage of reducing discharge pressure ratio, charging pressure ratio constant at 20.
Heat Exchanger Effectiveness
The performance of the de-coupled system is very sensitive to the heat exchanger effectiveness as shown in Figure 23. We calculate that based on a shell and tube configuration a significant heat exchange area of the order 90,000 m2 is required to achieve the outline design effectiveness of 0.975 while keeping pressure drops to the order of 1,000 Pa. This can be packaged in a 7 m diameter 20 m long shell and tube design. For reference modern compact heat exchangers have been made with heat transfer areas up to 15,000 m2/m3 (Reay et al., 2008) of heat exchanger and effectivenesses of 99% have also been reported in microchannel heat exchangers (Pua and Rumbold, 2003).

Figure 23. Sensitivity to heat exchanger effectiveness.
Loss Accounting
The turn-round efficiencies are 59.5 and 63.4%, respectively, for the de-coupled and coupled systems. Here, we show an inventory of the relative magnitudes of all the irreversibilities of the simulated PTES systems that collectively result in these efficiencies. To illustrate the effect of the various irreversibilities, Figures 24, 25 show a snap shot of the real charge and discharge cycles of the outline design. For comparison the ideal PTES cycle is also shown. The turn-round efficiency can also be derived by completing a cyclic integral of the charge and discharge T-S diagrams at each time step in the simulation and then summing the totals.
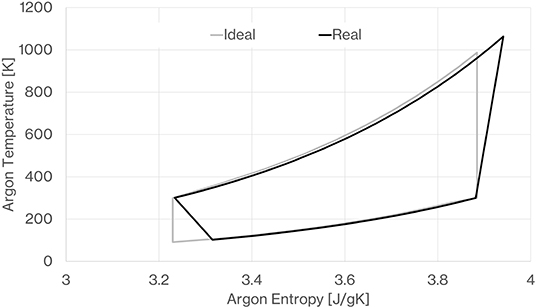
Figure 24. Temperature-Entropy diagram of the simulated charge cycle showing the effect of the calculated irreversible losses as compared to the ideal cycle.
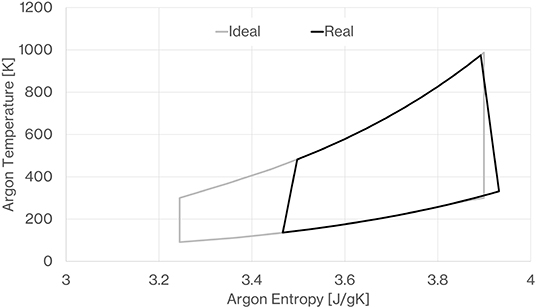
Figure 25. Temperature-Entropy diagram of the simulated discharge cycle showing the effect of the calculated irreversible losses as compared to the ideal cycle.
Figure 26 displays the percentage losses for the outline design de-coupled system. It highlights that the biggest irreversibility is due to the imperfect nature of the compressors and expanders, and that the second most significant loss is due to the de-coupling heat exchangers. The heat exchanger loss of nearly 10% includes the loss due to the effectiveness and due to pressure drop. The electrical efficiency of the motor and generator also has an important impact on overall turn-round efficiency. The simulation indicates that the stratified thermoclines are very effective; being only responsible for a 2.4% loss which account for both imperfect return of the stored heat and pressure drop. It seems that it would be feasible to reduce heat leak losses from the proposed 1 GWh system to <2% of the input work. Using large, low aspect ratio stores, and with careful design of the heat exchanger, we believe pressure drop in the thermal store circuits can be limited to <5,000 Pa. The compression work in the fans is responsible for a 2% loss which is included in the de-coupling heat exchanger and thermal store losses in Figure 26.
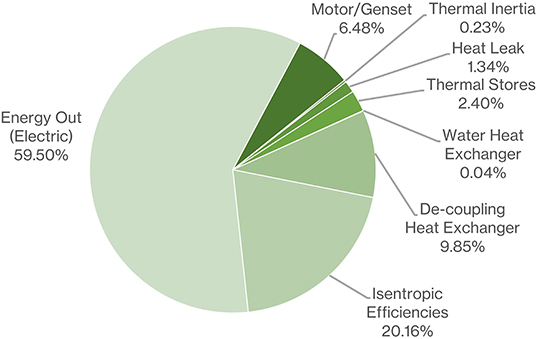
Figure 26. Inventory of losses for each sub-system of the de-coupled 1 GWh PTES system.
Figure 27 shows the inventory for the coupled system, where the greater turn-round efficiency of 65.3% is achieved. The main difference with the coupled system is that the hot store is pressurized to 20 bar; we believe that this will require the use of multiple cylindrical vessels. The comparison model has 240, 4 m diameter cylindrical vessels to match the amount of storage material as in the de-coupled design. Clearly the coupled system does not suffer the losses associated with the de-coupling heat exchanger. Also, there are slightly lower losses in the thermal stores due to reduced pressure drop; a pressurized hot store will result in a lower pressure drop. However, due to the significant necessary increase in hot thermal store vessel material compared to the de-coupled design, there is a more significant loss associated with the thermal inertia of the vessel. We have assumed the 4 m diameter vessel walls would be 10 cm thick in order to maintain the hoop stress in the metal at a manageable level for high temperature operation.
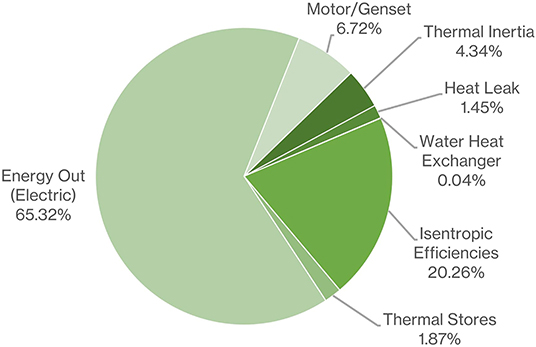
Figure 27. Inventory of losses for each sub-system of the coupled 1 GWh PTES system.
We also note that a significant amount of low-grade heat can be extracted from the system during discharge with minimal effect on turn-round efficiency. Due to the irreversibilities the argon discharges from the compressor and expander significantly above ambient temperature during the discharge cycle. It is important to cool the expander discharge back to ambient temperature to maintain desirable cycle operating temperatures. Cooling the compressor discharge flow back to ambient temperature is not so critical. If both ambient water heat exchangers are used, around 34 MW of heat is passed to the water at full discharge power. This heat that is lost to the water is not counted as a benefit in this efficiency analysis, but could potentially be used for district heating and so improve the effective system efficiency.
Long Duration Storage
In order to evaluate the potential of a PTES system to deliver long-duration energy storage for the order of 10–100 h, we calculate the reduction in turn-round efficiency that occurs due to the addition of a dwell time when the thermal store is charged. Figure 28 shows the shape of the operating cycle including a dwell time in the charged state.
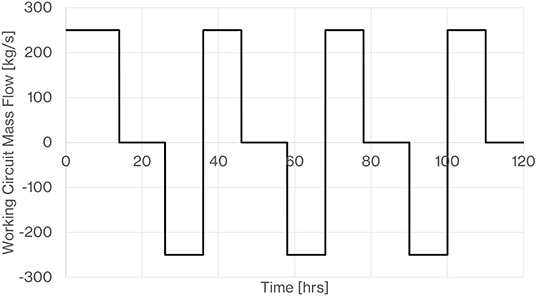
Figure 28. Example repeated operating cycle with dwell time in charged state. On the mass flow axis, +ve refers to charging, -ve refers to discharging.
During the dwell time, the thermal profile that we arrive at immediately after charging is smeared by diffusion and heat leak to the surroundings. Figure 29 shows the difference in the hot store profile immediately after charging and then after a dwell time of 100 h. Once the thermal store thermal fronts reach a periodic form they have quite a smooth gradient and so further diffusion and smearing of the thermal front is very slow. Figure 30 indicates how we expect the turn-round efficiency to fall with dwell time. While there is a significant loss of stored energy, it is interesting that even with a dwell time of 100 h the cycle turn-round efficiency is still above 50%. It is also noted that the de-coupled store suffers less loss in comparison to the coupled store as dwell time increases. This is due to the lower predicted heat leak from the large de-coupled thermal stores as compared to the multiple pressure vessels of the coupled system.
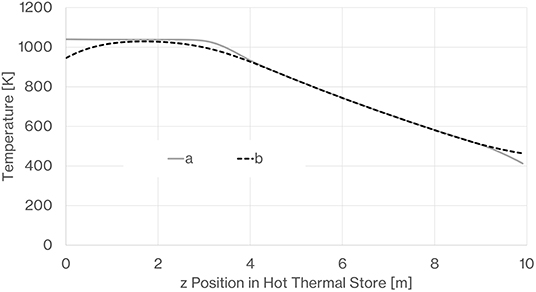
Figure 29. Effect of 100 h of dwell time on the hot store temperature profile (z = 0 is top, z = 10 m is bottom), a is immediately after charge phase, b is following 100 h in the charged phase.
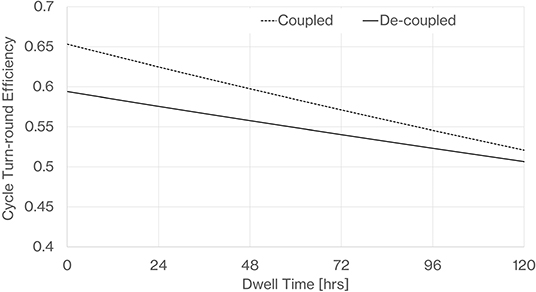
Figure 30. Impact on turn-round efficiency from increasing dwell time.
Practical Implications
There are several practical reasons why we believe a PTES system is suitable for construction on a large-scale. Firstly, the gravel used to store energy in the form of heat is very cheap meaning that the cost of the raw storage material should not limit the scale of a PTES system. Furthermore, a thermal store will have less heat leak to atmosphere per unit energy stored as the surface to volume ratio is increased. Finally, although the compression and expansion requirements necessitate the development of new, purpose-built turbomachinery, we suspect machine efficiency and economic viability to increase for a large-scale system.
Despite the modeling in this paper indicating that the loss due to de-coupling renders a de-coupled system less efficient, we discuss some practical advantages of this configuration. A de-coupled system, with near atmospheric pressure thermal stores, offers structural simplicity and greater design flexibility which is important for scaling purposes. Only in this configuration do we anticipate stores to be situated in recesses (below ground) as shown in the architect images (Figures 6–8). Secondly, a de-coupled system also removes the risk of dust from the thermal store material passing through the turbomachinery and causing damage or reliability issues.
Comparing the calculated efficiencies, the coupled system would generate more revenue once operational. However, this configuration is predicted to require much greater initial investment. There is significant extra material usage and cost associated with making a large hot thermal store that could sustain the working circuit pressure; more than the predicted cost of two de-coupling heat exchangers. A simple cost differential analysis indicates that it may take longer than the service life of a typical large facility (a coal or nuclear power plant for instance) to pay back the additional capital expenditure due to the construction of a large pressurized hot store. To obtain the cost differential we use the following expression published by Fraas (1989) to estimate the cost of the de-coupling heat exchangers in USD.
Where F is the heat transfer area in square feet up to a maximum of 836 m2, I is an index (taken as 1.6) to account for inflation up to present day and m is an additional scaling factor to account for the number of heat exchanger modules to achieve the 90,000 m2 (i.e., m=107) heat transfer area required. This gives an estimated heat exchanger cost of £10.6M. For the thermal store cost estimates, we assume the cold store of a coupled and de-coupled system is at a similar pressure and so does not introduce any cost differential. For the hot stores, we assume a pressure of 20 bar for the coupled system as opposed to a nominal atmospheric pressure for the de-coupled system.
The cost differential for the manufacture of the 20 bar vessel as compared to a nominal atmospheric pressure vessel has been estimated using the following expression from Seider et al. (1999)
Where L is the height of the vessel (10 m) and D is the diameter. We assume 4 m diameter as this is the largest vessel considered in the costing analysis. As such we would require 240 4 m diameter vessels. FPM is a scaling factor based on material and pressure. It works out to be 18 for a 20 bar stainless vessel and 8 for a lowest pressure stainless vessel. The estimated cost of the 240 20 bar vessels is £233M and for 240 low pressure vessels is £104M. Accounting for this differential in thermal stores and the cost of the two de-coupling heat exchangers gives a cost differential on capital expenditure in favor of the de-coupled system of the order £108M. Figure 31 shows a break even plot for the cost differential. This indicates that if the PTES systems can sell their dispatchable electricity at the current cost of renewable energy which we have assumed to be £50/MWh based on a scan of current published prices2, then it would take more than 50 years to recover the additional capital expenditure of the coupled system. All the trends show renewable electricity becoming cheaper however if dispatchable renewable electricity becomes more valuable as the penetration of renewable energy increases, then the value of the PTES output maybe higher. Figure 31 estimates that a factor of 5 on value of stored electricity would be required to achieve payback within 25 years.
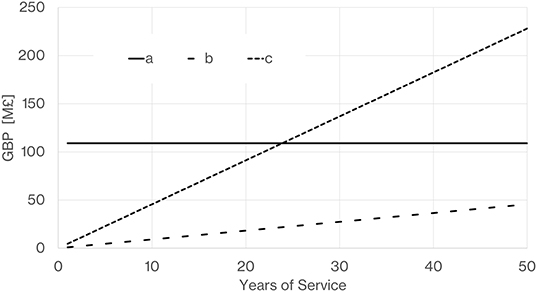
Figure 31. Break even plot for the cost differential of a coupled vs. de-coupled system (a) is the extra differential CAPEX of a coupled system, (b) represents the returned value of the extra efficiency of the coupled system assuming the sale price of electricity is similar to current renewable price of £50/MWh, (c) represents the returned value of the extra efficiency of the coupled system assuming the sale price of dispatchable electricity is given a premium and becomes worth 5 times the current value of renewable electricity, i.e., £250/MWh).
Conclusions
Here, a simple expression to indicate the limit of turn-round performance achievable as a function of the compressor and expander isentropic efficiencies was given. We have shown that the turn-round efficiency of any PTES system is more sensitive to expander isentropic efficiency than that of the compressor. The one-dimensional model of the packed bed thermoclines showed that the thermal profiles within the thermal stores reach a periodic, repeatable shape following a number of repeated charge/discharge cycles.
We presented an outline design of a de-coupled PTES system where the thermal stores are de-coupled from the working circuit via two de-coupling heat exchangers that enable them to operate at near atmospheric pressure. The outline system is designed to be capable of delivering 1 GWh of stored energy (electric) and we predict that a turn-round efficiency of 59.5% is achievable following a simple repeated charge-discharge cycle. Thermal store gas can be circulated through large, low aspect ratio thermal stores with minimal circuit pressure drop, <5,000 Pa. Heat exchange losses due to de-coupling may be partially compensated for by virtue of it being easier to have a higher pressure ratio in an isolated working circuit. Primarily, we believe that de-coupling the thermal stores avoids the complexity and cost of significant pressure vessels thus rendering the de-coupled concept highly scalable; a necessity of a technology intended to address grid-scale storage.
To justify our support of a de-coupled PTES system, we provided a performance and simple cost comparison between the outline de-coupled design and an equivalent coupled one. In both cases, the irreversibilities of the compressor and expander were shown to be responsible for the heaviest loss (20%) and the losses associated with the thermal stores are found to be at the order of 2%. De-coupling the thermal stores results in a loss of the order of 10%.
Simple cost differential analysis indicated that the period required to cover the additional capital expenditure of the required pressure vessel in a 1 GWh coupled system may be longer than the life of a typical industrial facility. However, the point was made that this depends on the value of dispatchable stored electricity going forward.
The outline design of a 1 GWh system has a total surface area of 5 hectares. For reference, the surface area covered by the coal heap at the Ratcliff on Soar power station (one of the UKs remaining coal burning power stations) is over 6 hectares. For comparison with battery storage, the UK's largest storage system has 150,000 lithium-ion battery cells housed in seven pre-fabricated air-conditioned buildings across a 0.5 hectare site and has a storage capacity of 50 MWh.
To explore the feasibility of the proposed de-coupled system, future work should include a design study of adiabatic turbomachinery; particularly tailored toward PTES. Developing a multi-dimensional numerical study of the thermal stores is advised to check that the 1D method and assumptions used here are reasonable for very large, low aspect ratio thermal stores. A detailed study of the design of the thermal stores would deliver a more comprehensive cost analysis of a 1 GWh PTES system.
Data Availability Statement
The datasets generated for this study are available on request to the corresponding author.
Author Contributions
TD wrote the initial computer simulation code to model the PTES system and wrote the first submission of the paper. Following the initial referees comments which all indicated that more detail of the test case system was needed, BP developed an outline design of a 1 GWh system and generated images of this. BP also contributed with improvements to the code and generating updated results for second and third submissions as well as making significant contributions to the updated manuscripts. All authors contributed to the article and approved the submitted version.
Conflict of Interest
The authors declare that the research was conducted in the absence of any commercial or financial relationships that could be construed as a potential conflict of interest.
Acknowledgments
We gratefully acknowledge Jonathan McDonald for producing the outline design graphical representations used in this paper. We gratefully acknowledge the support of the EPSRC and their funding of the Multi-scale ANalysis for Facilities for Energy STorage Project (MANIFEST), grant number EP/N032888/1.
Footnotes
1. ^Newcastle University connects first grid-scale pumped heat energy storage system. The Engineer. Available online at: https://www.theengineer.co.uk/grid-scale-pumped-heat-energy-storage/ (accessed January 2019).
2. ^BloombergNEF. Available online at: https://about.bnef.com/about/ (accessed April 2020).
References
Anderson, C. (1936). The heat capacities of quartz, cristobalite and tridymite at low temperatures. Am. Chem. Soc. 58, 568–570. doi: 10.1021/ja01295a008
Becattini, V., Motmans, T., Zappone, A., Madonna, C., Haselbacher, A., and Steinfeld, A. (2017). Experimental investigation of the thermal and mechanical stability of rocks for high-temperature thermal-energy storage. Appl. Energy 203, 373–389. doi: 10.1016/j.apenergy.2017.06.025
Benato, A. (2017). Performance and cost evaluation of an innovative pumped thermal electricity storage power system. Energy 138, 419–436. doi: 10.1016/j.energy.2017.07.066
Cardenas, B., Davenne, T., Rouse, J., and Garvey, S. (2018). Effect of design parameters on the exergy efficiency of a utility-scale packed bed. Energy Storage 18, 267–284. doi: 10.1016/j.est.2018.05.005
Davenne, T., Garvey, S., Cardenas, B., and Rouse, J. (2018). Stability of packed bed thermoclines. Energy Storage 19, 192–200. doi: 10.1016/j.est.2018.07.015
Davenne, T., Garvey, S., Cardenas, B., and Simpson, M. (2017). The cold store for a pumped thermal energy storage system. Energy Storage 14, 295–310. doi: 10.1016/j.est.2017.03.009
Desrues, T., Ruer, J., Marty, P., and Fourmigue, J. F. (2010). A thermal energy storage process for large scale electric applications. Appl. Thermal Eng. 30, 425–432. doi: 10.1016/j.applthermaleng.2009.10.002
Dietz, P. W. (1979). Effective thermal conductivity of packed beds. Ind. Eng. Chem. Fundam. 18, 283–286. doi: 10.1021/i160071a015
Dumont, O., Partheons, A., Dickes, R., and Lemort, V. (2018). Experimental investigation and optimal performance assessment of four volumetric expanders (scroll, screw, piston and roots) tested in a small-scale organic Rankine cycle system. Energy 165, 1119–1127. doi: 10.1016/j.energy.2018.06.182
Geissbühler, L., Becattini, V., Zanganeh, G., Zavattoni, S., Barbato, M., Haselbacher, A., et al. (2018). Pilot-scale demonstration of advanced adiabatic compressed air energystorage, Part 1: Plant description and tests with sensiblethermal-energy storage. Energy Storage 17, 129–139. doi: 10.1016/j.est.2018.02.004
Hemingway, B. (1987). Quartz: heat capacities from 340 to 1000 K and revised values for the thermodynamic properties. Am. Mineral. 72, 273–279.
Howes, J. (2012). Concept and development of a pumped heat electricity storage device. Proc. IEEE 100, 493–503. doi: 10.1109/JPROC.2011.2174529
Kougias, I., and Szabo, S. (2017). Pumped hydroelectric storage utilization assessment: forerunner of renewable energy integration or Trojan horse? Energy 140, 318–329. doi: 10.1016/j.energy.2017.08.106
Lalanne, P., and Byrne, P. (2019). Large-scale pumped thermal electricity storages—converting energy using shallow lined rock caverns, carbon dioxide and underground pumped-hydro. Appl. Sci. 9, 1–23. doi: 10.3390/app9194150
Laughlin, R. (2017). Pumped thermal grid storage with heat exchange. J. Renew. Sustain. Energy, 9:044103. doi: 10.1063/1.4994054
Lemmon, E., Bell, I., Huber, M., and Mclinden, M. (2018). REFPROP Documentation Version 10. Boulder, CO: National Institute of Standards and Technology.
McTigue, J., Farres-Antunez, P., Neises, T., Ellingwood, K., and White, A. (2019). “Pumped Thermal Electricity Storage with Supercritical CO2 Cycles and solar heat input,” in 2019 Solar Power and Chemical Energy Systems (Daegu).
Mercangoz, M., Hemrle, J., Kaufmann, L., Z'Graggen, A., and Ohler, C. (2012). Electrothermal energy storage with transcritical CO2 cycles. Energy 45, 407–415. doi: 10.1016/j.energy.2012.03.013
Mongird, K., Viswanathan, V., Balducci, P., Alam, J., Fotedar, V., Koritarov, V., et al. (2019). Energy Storage Technology and Cost Characterization. Washington, DC: US Dept of Energy. doi: 10.2172/1573487
Morandin, M., Marechal, F., Mercangoz, M., and Buchter, F. (2012). Conceptual design of a thermo-electrical energy storage system based on heat integration of thermodynamic cycles - Part A: Methodology and base case. Energy 45, 375–385. doi: 10.1016/j.energy.2012.03.031
Morandin, M., Mercangoz, M., Hemrle, J., Marechal, F., and Favrat, D. (2013). Thermoeconomic design optimization of a thermo-electric energy storage system based on transcritical CO2 cycles. Energy 58, 571–587. doi: 10.1016/j.energy.2013.05.038
Pua, L., and Rumbold, S. (2003). “Industrial microchannel devices - where are we today,” in First International Conference on Microchannels and Minichannels (Rochester, NY).
Reay, D., Ramshaw, C., and Harvey, A. (2008). Process Intensification Engineering for Efficiency Sustainability and Flexibility. Oxford: Butterworth-Heinemann.
Schuman, T. (1929). Heat transfer: a liquid flowing through a porous prism. Franklin Inst. 208, 405–416. doi: 10.1016/S0016-0032(29)91186-8
Seider, W. D., Seader, J. D., and Lewin, D. R. (1999). Process Design Principles: Synthesis, Analysis, and Evaluation. New York, NY: Wiley, 824 pp.
Smallbone, A., Julch, V., Wardle, R., and Roskilly, T. (2017). Levelised cost of Storage for pumped heat energy storage in comparison with other energy storage technologies. Energy Convers. Manag. 152, 221–228. doi: 10.1016/j.enconman.2017.09.047
Steinmann, W. D. (2014). The CHEST (Compressed Heat Energy STorage) concept for facilityscale thermo mechanical energy storag. Energy 69, 543–552. doi: 10.1016/j.energy.2014.03.049
Stewart, R. B., and Jacobsen, R. T. (1989). Thermodynamic properties of argon from the triple point to 1200 K with pressures to 1000 MPa. J. Phys. Chem. Refer. Data. 18, 639–798. doi: 10.1063/1.555829
Tauveron, N., Macchi, E., Nguyen, D., and Tartière, T. (2017). Experimental study of supercritical CO2 heat transfer in a thermo-electric energy storage based on rankine and heat-pump cycles. Energy Procedia 129, 939–994. doi: 10.1016/j.egypro.2017.09.121
White, A., Parks, G., and Markides, C. N. (2013). Thermodynamic analysis of pumped thermal electricity storage. Appl. Thermal Energy 53, 291–298. doi: 10.1016/j.applthermaleng.2012.03.030
White, A. J. (2011). Loss analysis of thermal reservoirs for electrical energy storage schemes. Appl. Energy 88, 4150–4159,. doi: 10.1016/j.apenergy.2011.04.030
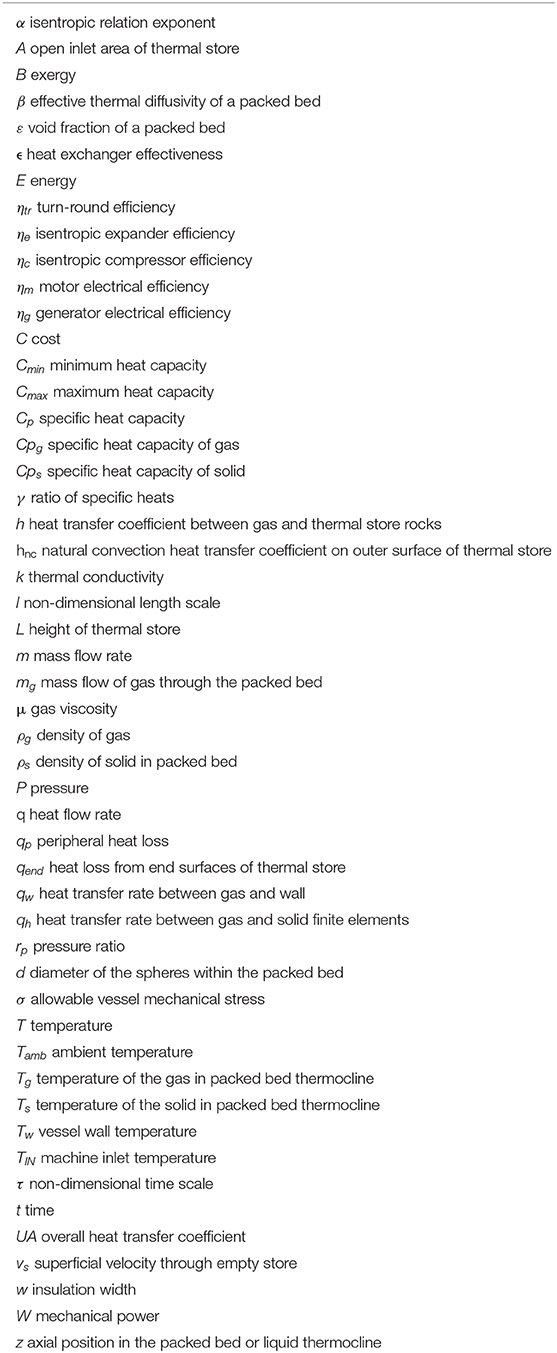
Nomenclature
Keywords: PTES, energy storage, simulation, isentropic efficiency, turn-round efficiency, 1 GWh, pumped thermal
Citation: Davenne TR and Peters BM (2020) An Analysis of Pumped Thermal Energy Storage With De-coupled Thermal Stores. Front. Energy Res. 8:160. doi: 10.3389/fenrg.2020.00160
Received: 26 February 2020; Accepted: 23 June 2020;
Published: 11 August 2020.
Edited by:
Joshua Dominic McTigue, National Renewable Energy Laboratory (DOE), United StatesReviewed by:
Alberto Benato, University of Padova, ItalyLuis M. Serra, University of Zaragoza, Spain
Pau Farres Antunez, University of Cambridge, United Kingdom
Copyright © 2020 Davenne and Peters. This is an open-access article distributed under the terms of the Creative Commons Attribution License (CC BY). The use, distribution or reproduction in other forums is permitted, provided the original author(s) and the copyright owner(s) are credited and that the original publication in this journal is cited, in accordance with accepted academic practice. No use, distribution or reproduction is permitted which does not comply with these terms.
*Correspondence: Tristan R. Davenne, dHJpc3Rhbi5kYXZlbm5lQHN0ZmMuYWMudWs=