 Jordy Santana
 Mayken Espinoza-Andaluz
 Tingshuai Li3
- 1Laboratory Renewable Energy Sources, Faculty of Mechanical Engineering, Escuela Superior Politécnica del Litoral (ESPOL), Guayaquil, Ecuador
- 2Centro de Energías Renovables y Alternativas, Facultad de Ingeniería Mecánica y Ciencias de la Producción, Escuela Superior Politécnica del Litoral (ESPOL), Guayaquil, Ecuador
- 3School of Materials and Energy, University of Electronic Science and Technology of China, Chengdu, China
- 4Department of Energy Sciences, Faculty of Engineering, Lund University, Lund, Sweden
Polymer electrolyte fuel cells (PEFCs) have shown a great potential to be used in several applications, e.g., portable, mobile and stationary systems. Each of the mentioned applications demands from PEFCs different operating conditions to perform in the best possible manner. Knowing in detail the behavior of their internal components will help to improve the mechanical and thermal properties of the different constitutive layers. The objective of this research is to analyze in detail the behavior of the internal resistances of a PEFC, using the impedance spectroscopy technique. A single cell is evaluated in a broad range of current densities, i.e., from 0.2 to 2.0 A.cm–2, to evaluate the resistances that cause loss of performance. The analyzed resistances correspond to the ohmic, charge transfer and mass transport resistance. The results were obtained after the interpretation of the data taking from Nyquist diagrams, and they were analyzed considering high and low conditions of relative humidity (RH). The obtained results showed that the ohmic resistance (attributed to membrane Nafion® 212), is independent of the load applied for fully humidified conditions, with a value of 0.0725 Ω.cm2. On the other hand, it is strongly dependent on low humidification conditions, with values between [0.198–0.132] Ω.cm2, for current density of [0.2–2.0] A.cm–2, respectively. It was also found that the charge transfer resistance decreases with respect to the applied load until a saturation value, and further it represents the major participation to the total resistance of the cell. The charge transfer resistance represents around 50–75% of the total resistance in conditions of high RH, and among 30–65% for conditions of low RH. In addition, it was found that the mass transport resistance appears early at low RH and triples for full humidification conditions.
Introduction
The effects of the emission and excessive accumulation of carbon dioxide (CO2) gases in the atmosphere is a topic of great importance. Studies show that at the end of this century, our planet can reach the critical threshold causing a climatic disequilibrium that will seriously affect the life on the planet (Rothman, 2019). Under this scenario, the reduction of CO2 emissions plays an important role to stop or decrease the damage of our ecosystem. According to a report from the International Energy Agency (IEA), the presence of fossil fuels to cover the total energy demand until 2015 was around 80% (International Energy Agency, 2014). The development of clean technologies as energy sources contribute with the perseveration of the environment. One of the devices with a great projection is the polymer electrolyte fuel cell (PEFC), which is an electrochemical device that convert the chemical energy present in the fuel into electrical energy and water in a clean manner. PEFCs have received great attention during the last years (Wang et al., 2011), because they can operate in the distinct sectors of energy demand as the transport, portable devices and stationary electric generation (Wee, 2007; Wilberforce et al., 2016). To produce electrical energy, hydrogen as fuel and oxygen/air as oxidant has to be supplied into the cell. Unlike batteries, the production process of electrical energy is continuous while the feed gases are constantly supplied. Basically, PEFCs are formed by one membrane electrode assembly (MEA), which consists of a solid electrolyte or polymeric membrane sandwiched with a catalyst layer (CL) and a gas diffusion layer (GDL) in both sides as illustrated in Figure 1.
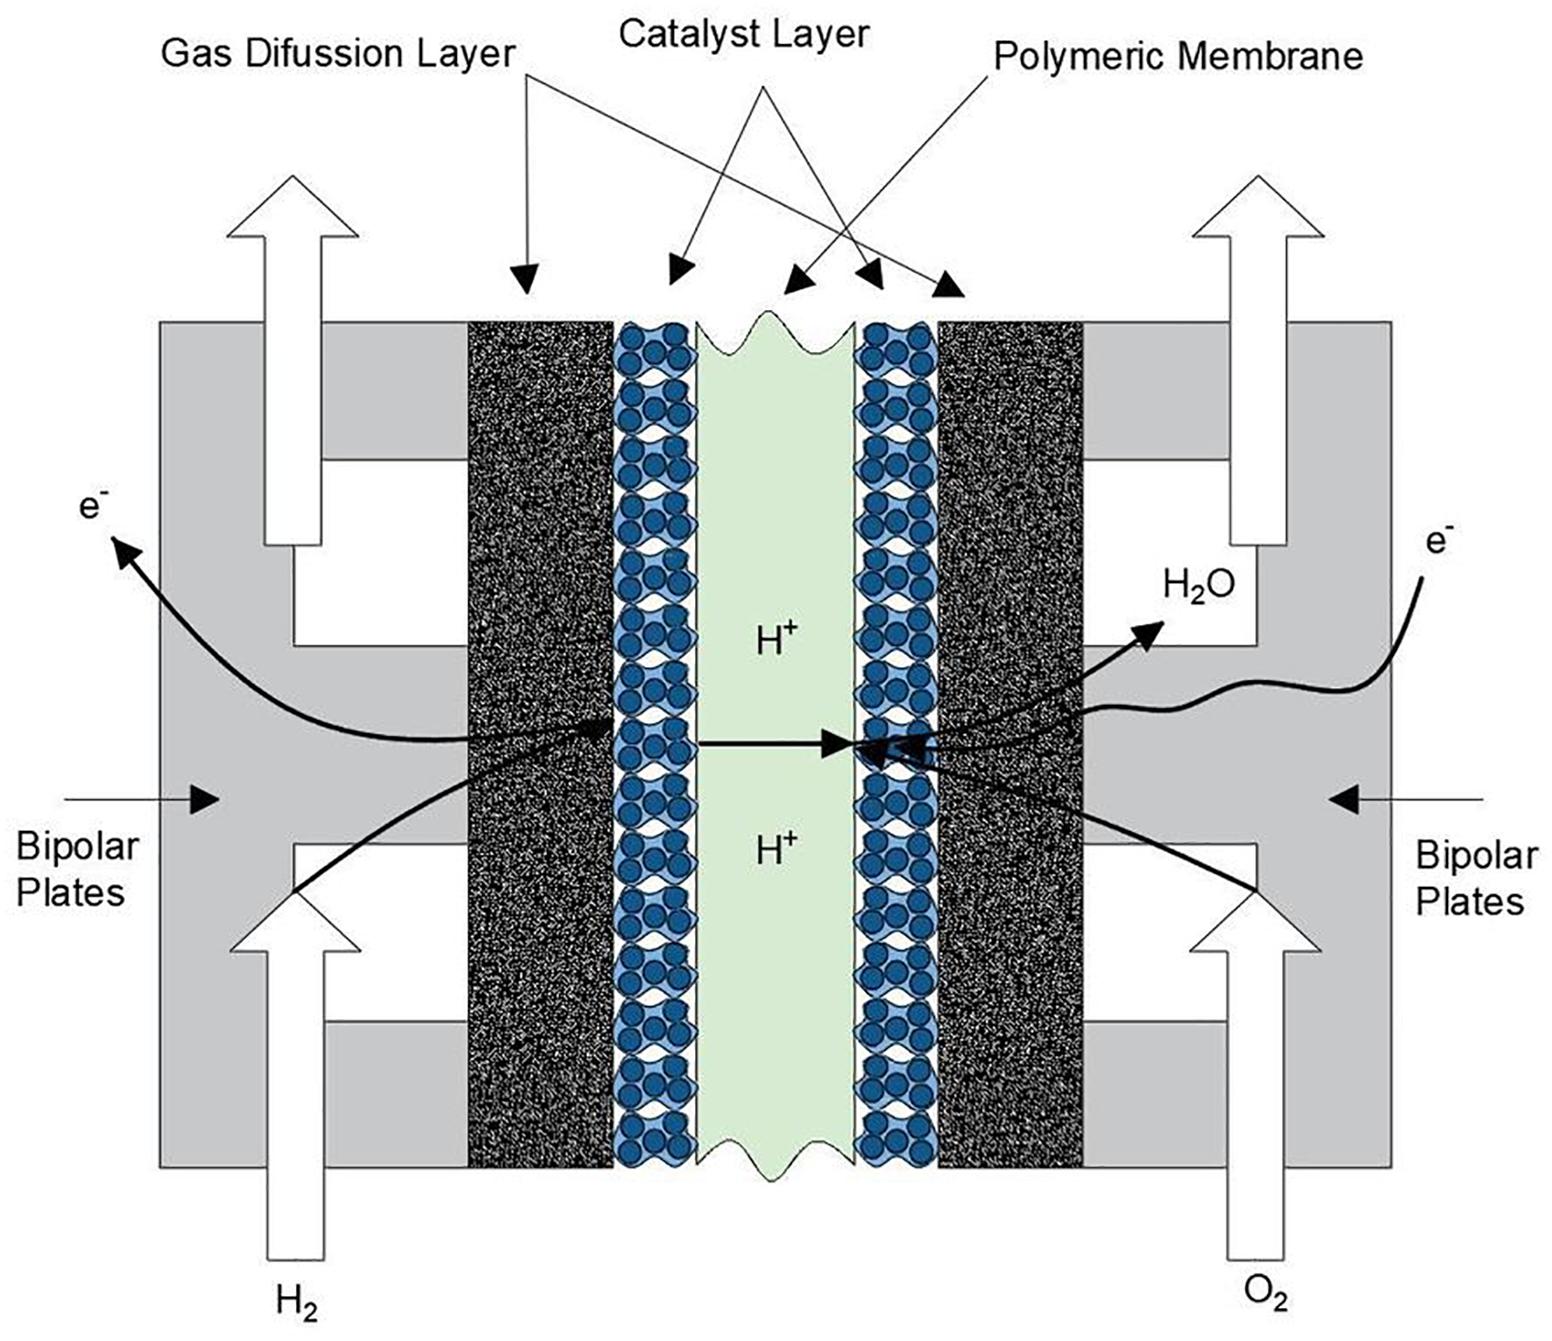
Figure 1. Internal configuration of the constitutive parts of a single PEFC.
Thanks to the MEA, the kinetic activity occurs facilitating the separation of hydrogen ions, the cations (negative charge) travel in an external circuit producing electrical current. At the same time the anions (positive charge) pass through the polymeric membrane reaching the cathode side and form water molecules due to the combination with the oxygen from the air. The mechanical external support of the layers is given by the bipolar plates, commonly made of graphite, which allow the distribution of reactant gases inside the cell. Among the several advantages that a PEFC offer, one can mention the following: relatively low operating temperature (40–80°C), quick start of operation, and modularity. Another advantage is attributed to the solid electrolyte membrane, which helps to have a simple sealing. Basically, the sealing is given by pressure using a pair of gaskets to prevent gas leak. Finally, an electrical conversion efficiency between 40 and 60% compared to 25% found in thermal machines make the PEFCs a device to be used in multiple applications.
Despite the numerous advantages and applications of PEFCs, they are still some issues that have to be faced to gain a significant presence at market. One of the most crucial phenomena to be scientifically understood in PEFCs is water management (Andersson et al., 2016). Among the aspect to be considered are the water production on the cathode side during the energy conversion process, the water molecules crossing the polymeric membrane and the entry of water to the system as result of the humidified gases. Considering the characteristics of the polymeric membrane, the water balance plays an important role since the mentioned membrane require a certain degree of water content. A right amount of water into the membrane makes the proton transport efficient. A low humidification degree produces an increment of the proton resistant while a high humification can produce flooding in the porous layers at the cathode side reducing the catalytic activity of the reactions (Espinoza-Andaluz et al., 2019).
Another bottleneck is related to the materials involved in the manufacturing process of the CLs. Platinum is commonly used since it provides the greatest efficiency as catalyst to facilitate the reactions into the cell. This precious metal is expensive and susceptible to contamination by CO2 and sulfur compounds, i.e., H2S and carbonyl sulfide (COS). Due to this susceptibility, the feed gases H2/O2 must be of high purity. Studies focusing on new catalyst materials or alloys decreasing the platinum content in CLs have been performed (Chen et al., 2014; Park et al., 2015). In addition, the reduction of platinum can be achieved analyzing transport phenomena inside PEFCs. A study to predict different transport parameters in a GDL is presented in Espinoza et al. (2015).
One of the most widely used technique to study the behavior of a PEFC is the electrochemical impedance spectroscopy (EIS) (Rezaei Niya and Hoorfar, 2013). The EIS test consist of sending a small disturbance of alternating current (AC) sinusoidal current to the direct current (DC) applied to the cell. The system response is evaluated in a frequency range that can vary from 0.1 Hz to 100 kHz. The obtained data are interpreted and adjusted to determine the different resistances of a cell. Considering that the experiment is performed in the frequency domain, it is possible to obtain detail information about the resistance contributions. Each of the internal resistances appear at different frequency ranges (Yuan et al., 2010).
The behavior of a PEFC can be described by the impact of different polarizations regions reflected into the voltage-current curve. This curve is characterized by the ohmic polarization region (a linear behavior with negative slope), the activation and concentration polarization regions. These polarization regions are also called loss zones due to each one contributes to the decrease of cell performance voltage. The losses by activation, ohmic and concentration are represented by charge transfer, ohmic, and mass transport resistance, respectively. The impedance, and therefore the losses, originated by the internal elements of the cell are studied with the help of Nyquist and Bode charts. The Nyquist diagram represents the imaginary part impedance (Im) against the real part impedance (Re), i.e., Im-Z vs. Re-Z. The Bode plot shows the variation of the magnitude of the total impedance and phase angle between the current and voltage, regarding of the evaluated frequency range (Santana et al., 2020). The Nyquist graph gives us useful information on the efficiency losses in the cell, since it is possible to represent and quantify these losses by equivalent circuits constituted by passive components such as resistance, capacitors, and inductors. The adjustment depends on the shape of the Nyquist diagram and there are several equivalent circuits that can represent the response of the system (Dhirde et al., 2010; Harrington and Van Den Driessche, 2011).
Several studies applying EIS have been conducted on PEFCs and evaluated several aspects from a cell point of view, Mérida et al. (2006) investigated two failure modes, dehydration and flooding in a cell stack, proposing as a diagnostic method for identification that both failures are shown at different frequency ranges. On the other hand, Asghari et al. (2010) investigated the influence of the tightening torque in the cell, finding that the charge transfer resistance and mass transport resistance increase with a selected pressure. Brunetto et al. (2009) conducted a performance study by EIS on the internal processes that occur in a cell with various conditions of relative humidity (RH) and stoichiometric ratios of feed gases. Dale et al. (2010) showed an analysis of the EIS behavior by varying the current load, starting time and percentage of the AC current with respect to the DC, obtaining optimal conditions. Freire and Gonzalez (2001) investigated the effects of the RH of the feed gases applied to different membrane thicknesses. They concluded that thinner membranes have better water management characteristics. Lefebvre et al. (1999) investigated the ionic conductivity of the CL, finding that it decreases with the distance to the membrane. Tang et al. (2006) conducted performance studies considering high temperatures, e.g., 80–120°C, analyzing the different types of losses. They found that at high operating temperature the ohmic resistance and the activation resistance increases, while the mass transport resistance decreases. The importance of the RH of the feed gases is evident, therefore also knowing in detail what happens at the mesoscale level in the MEA and the effect it produces on the performance of a PEFC, which can operate in a wide current range. The objective of this study is to quantify and to compare the impact on the internal resistances of a PEFC when the feed gases get into the cell with low and high RH, respectively. This study is carried out experimentally on a cell with a Nafion® 212 as a polymeric membrane and using the EIS technique. Different current load conditions are considered, and the internal resistances are analyzed to obtain the most efficient operating points.
The rest of the paper is divided as follows: “Experimental” section is mainly dedicated to the explanation of the experiment setup and physical characteristics of the cell utilized in the current study, operating parameters, impedance measurement and equivalent circuit are briefly presented. The obtained results of the test, as well as the data description and trend curves analysis are presented in “Results and Discussions” section. Finally, Conclusions are presented.
Experimental
Fuel Cell Test System
The present study was carried out with a PEFC fuel cell test system provided by Scribner Inc.®. The system allows us to operate and obtain the parameters of cell performance in real time. The system has flow controllers of the feed gases that permit to adjust the stoichiometric ratio of the flows before entering the cell. It also has humidifying tanks and electrical resistors with their respective temperature controllers for the anode, cathode, and the full cell. The fuel cell test system is equipped with a DC-AC current load controller, in addition to a frequency response analyzer (FRA). All information is collected through a data acquisition system connected to a peripheral device. It allows to perform the initial setup configuration and operation of the experiment. For more details on the operation of this equipment readers are referred to the Scribner manual (Scribner Associates, 2007). The data acquired from the single cell allows the corresponding analysis under different current load and humification of the feed gases. Parameters such as anode/cathode/cell temperature, current load, pressure and humification of the feed gases are monitored during the energy conversion process.
Single Cell Hardware
The cell used has an effective area of 25 cm2, its end plates are made from graphite plates with triple serpentine channels. The channels in the plates have a depth and width of 1 and 1 mm, respectively. It has a MEA composed by a polymeric membrane Nafion® 212 with a 50.8 μm thickness. The membrane is sandwiched by two CLs with 60 wt% of platinum (Pt) nanoparticles on vulcan (carbon). The GDLs are of woven carbon cloth type, and they include two micro porous layers (MPL) located at the interface of the CLs and GDLs. Figure 2 shows the external view of the single cell hardware used in the current study.
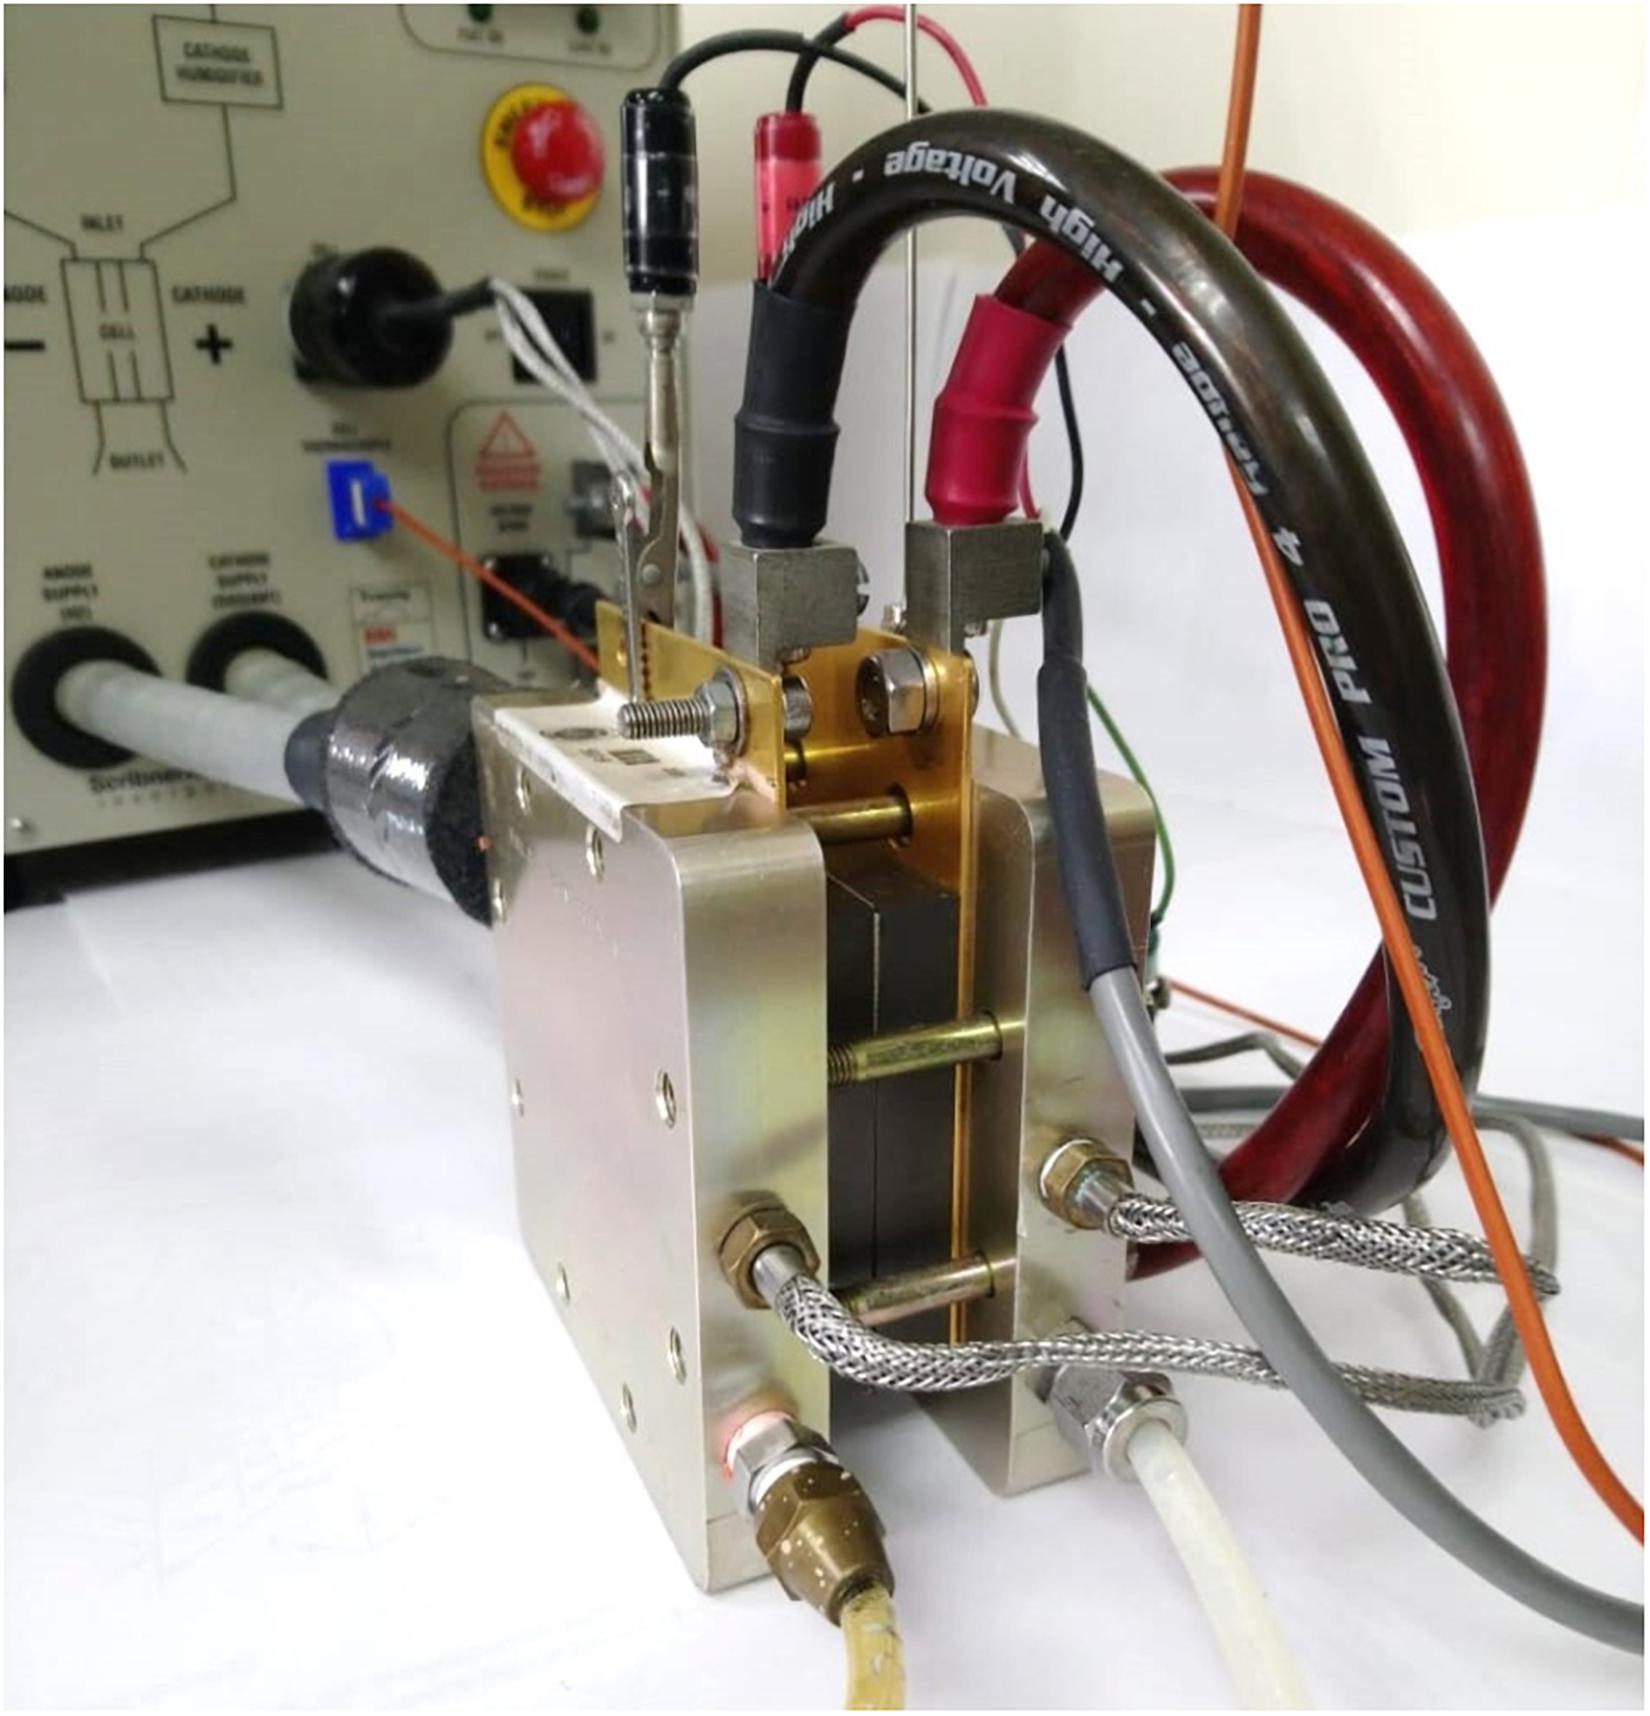
Figure 2. Picture of the single PEFC used in this study with the required connections for data collection.
Operating Parameters
Ultra-pure hydrogen (H2) is used as fuel at the entrance of the anode, whereas medical oxygen (O2) is used as oxidant at the entrance of the cathode. For purging and cleaning purposes, nitrogen (N2) is used as inert purge gas. The gas inlet pressure is controlled and maintained at 55 psi. Ultra-pure water treated under the American Society for Testing and Materials (ASTM) norm Type I quality, with minimum resistivity of 18 MΩ.cm–1, is used. The stoichiometric ratio for the H2 flow was established as 1.2× and for the O2 flow was 2.5×. Both flows were configured based on the load applied (current), denoted by the letter x through the software Fuel Cell®, as described in the manual of methods and experiments for PEFCs (Cooper et al., 2005). The tests were performed under two specific conditions, 100% RH and 33% RH, in order to quantify performance losses between fully humidified and critically humidified conditions. The value of 33%RH was taking from fuel cell test system manual (Cooper et al., 2005) as dry condition and It belongs the range [25–35]% RH considered to previous studies (Ramani et al., 2004; Yan et al., 2006; Salva et al., 2016) as low RH. Further, It is important to notice that the electric load variations are performed from 5 to 50 A in steps of 5 A.
Impedance Measurement and Equivalent Circuits
The EIS test was carried out with the help of the FRA, which is included in the Fuel Cell Test System. The frequency scan was initially set at 10 kHz running until 0.1 Hz. The data are collected and presented in logarithmic scale, obtaining 10 data per decade Hz, e.g., from 10,000 to 1000 Hz, 10 data were obtained. The integration time used in the current study is 0.3 s, with 1 cycle per integration. Finally, the amplitude of the AC signal used was established as 5% of the DC value. The data were collected simultaneously when the single cell is converting the chemical energy into the electrical and thermal energy.
There are several models to quantify-analyze the responses of an EIS test, a widely used method is the so-called equivalent circuits. The model for this study consists of an ohmic resistance (Rohm) connected in series with two parallel circuits (Rct–CPE1) and (Rmt–CPE2). Rohm represents the ohmic resistance of the cell, Rct corresponds to the resistance to charge transfer at the electrolyte/electrode interface, and Rtm is equivalent to the resistance to the mass transport losses. In addition, the capacitors CPE are constant phase elements (CPEs) used to adjust the system response to an equivalent circuit model. The experimental data obtained were adjusted by means of the ZView®. Figure 3 shows the equivalent circuit used in the current study to represent a single fuel cell.
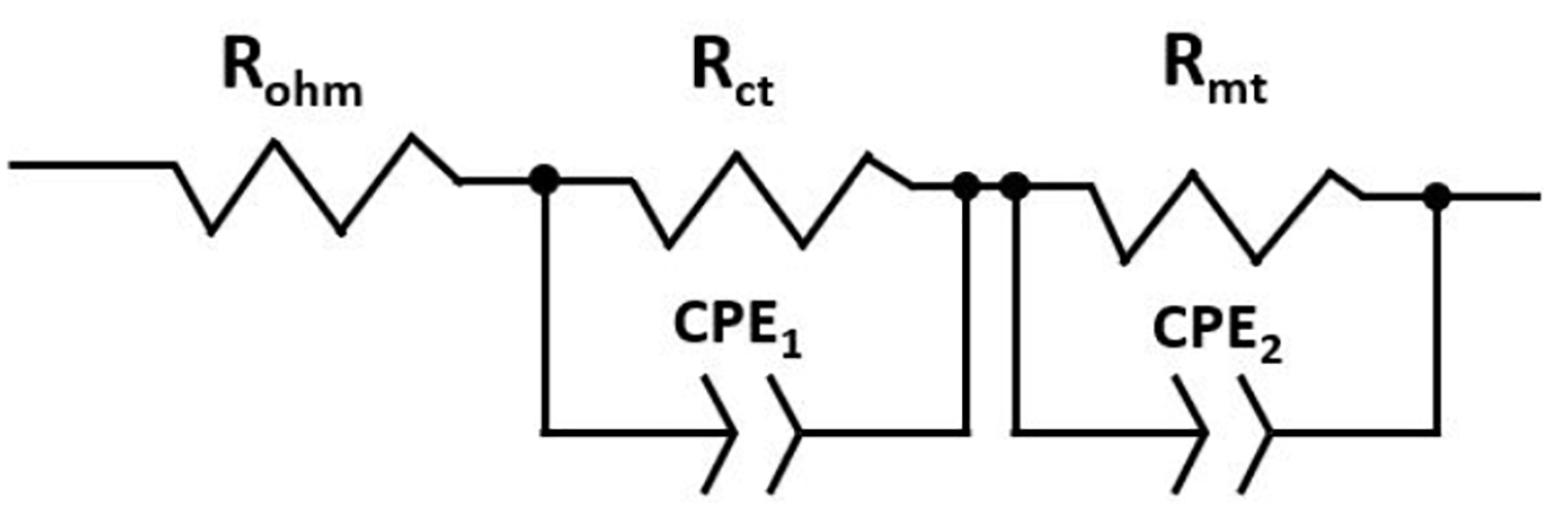
Figure 3. Equivalent circuit representing a single fuel cell constituted by resistors and constant phase elements.
Results and Discussion
Interpretation of the Response in a Nyquist Diagram
As mentioned, the use of the EIS technique is appropriate to analyze the different electrochemical phenomena that occur during cell operation. The EIS allows us to determine the internal cell resistances that cause the voltage loss. The total cell resistance is divided into three types, e.g., ohmic resistance, charge transfer resistance and mass transport resistance. The data obtained from an EIS test are usually components of the total impedance of the cell evaluated in a wide frequency range. The obtained data depicted in a graph show the components based on a diagram as presented in Figure 4. The interpretation of a Nyquist diagram helps to determine each of the internal resistances.
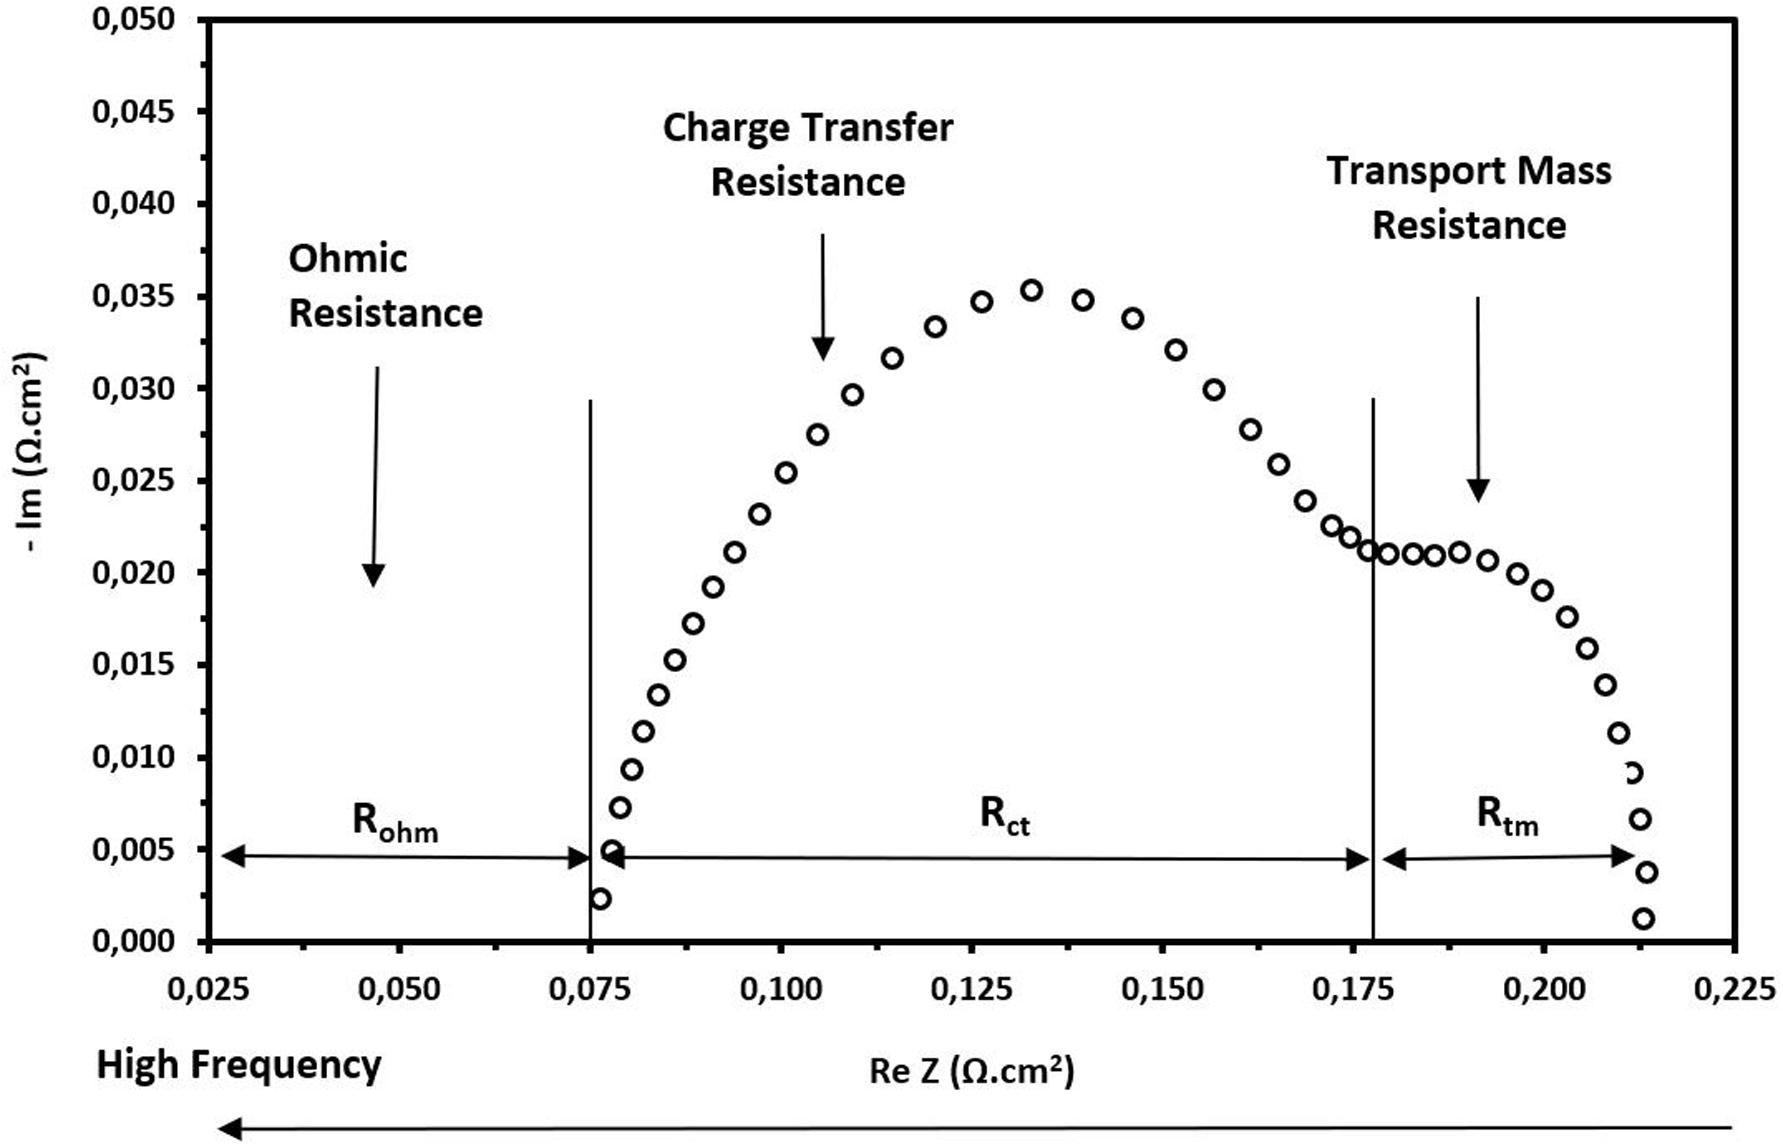
Figure 4. Scheme for the interpretation of internal resistances in the Nyquist diagram. Frequency is evaluated in an increasing manner from the right to the left.
From Figure 4, it is easy to observe that the ohmic resistance is basically the intersection with the real axis, and it represents the ohmic resistance of all the components of the cell including the MEA and end plates. However, as most of these components have a significant electrical conductivity, this resistance is mainly attributed to the resistance of the membrane, in this case Nafion® 212. The end of the first arc corresponds to the charge transfer resistance. This resistance is indirectly related with the kinetic reactions that occur in the CLs at the anode and cathode. However, the main contribution is due to cathode side since the oxygen reduction reaction (ORR) is much slower than the reactions that occur at the anode side with the hydrogen. The amplitude of the second arc represents the mass transfer resistance or resistance to diffusion of oxygen species in the CLs. This resistance generally appears at high current densities and low frequencies.
Although good approximations can be obtained by simple inspection, an adjustment of the Nyquist curves by using the Z view software has been made to improve the measurement. The equivalent circuit used is shown in Figure 3. It is constituted by three normal resistances and two CPEs. It is important to mention that the CPEs replace the capacitors since the capacitors model a perfect semicircle whereas the CPEs give a greater freedom of adjustment. For an extensive discussion about CPEs the reader is referred to Hirschorn et al. (2010).
Performance Based in Impedance Spectroscopy at High Relative Humidity
In the current research, the PEFC is evaluated by means of a sweep in the range of 0.1 Hz to 10 kHz at different current densities. The collected data are presented in Figure 5, which shows the response of impedance in a Nyquist diagram at 100% RH using oxygen as oxidant gas. On the left side we can see that the current densities are relatively low, i.e., ranging from 0.2 to 1.0 A.cm–2, whereas on the right side high current densities are considered, i.e., in the range of 1.2–2.0 A.cm–2. Following the interpretation from Figure 4, the three resistances are identified, i.e., ohmic, charge transfer and transport mass resistances. The ohmic resistance of the cell is identified by the intersection with the horizontal axis on the high frequency side, it is evident from Figure 5, that this value is approximately 0.075 Ω.cm2. It is completely clear that the ohmic resistance determined in this part does not depend on the load applied to the cell. It is also observable that the charge transfer resistance decreases as the current load increase, which agrees with the decrease in the arc on the left side of Figure 5.
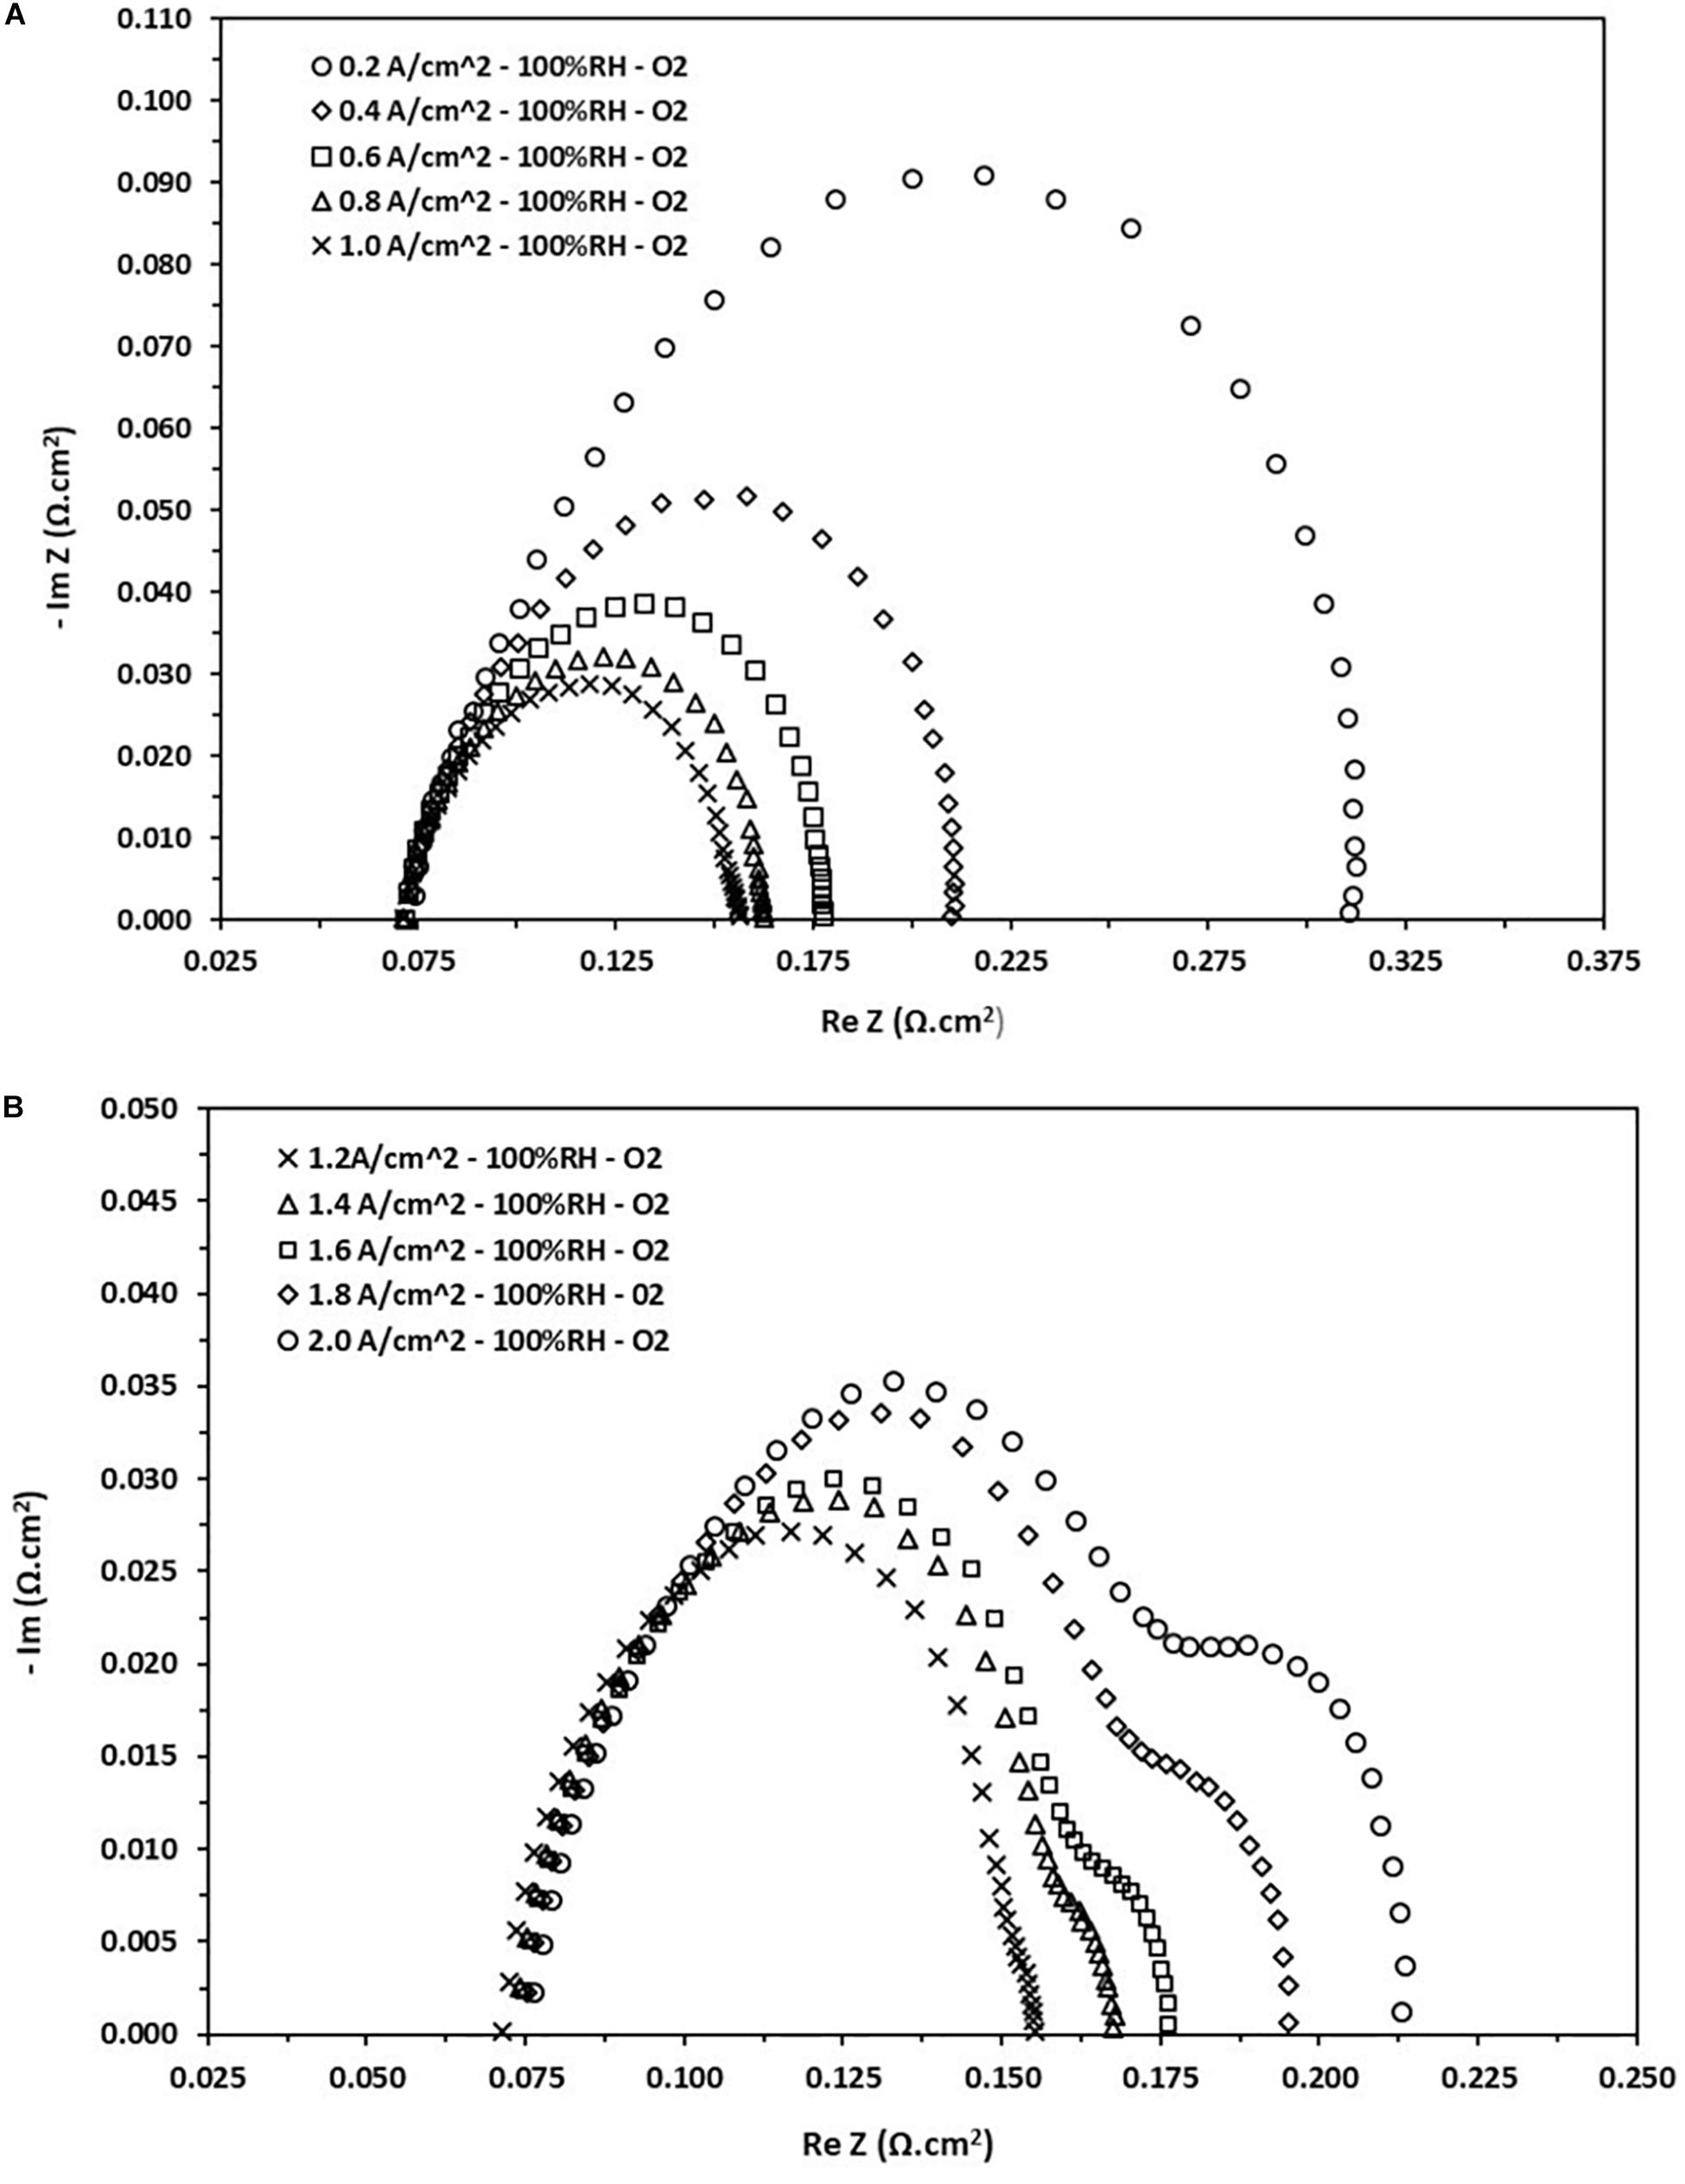
Figure 5. Nyquist diagram obtained from the EIS test at different current loads at 100% RH. (A) Density current from 0.2 to 1.0 A/cm2. (B) Density current from 1.2 to 2.0 A/cm2.
This decrease can be attributed to a rise in the kinetic activity of the cell as the load demands it, but then reaches a saturation limit, and finally begins to increase slightly (see Figure 5, right). The charge transfer resistance at low current densities varies in the range values from 0.08 to 0.24 Ω.cm2. On the other hand, the mass transport resistance appears on the side of high current densities and begins to increase as the load increases, i.e., it appears just when the cell begins to saturate. This phenomenon can be attributed to the diffusion of species within the CL giving a decrease in the reaction kinetics, an increase of electronic crossing and later obstruction of the porous media of the GDL. As result, there is a considerable loss of the cell voltage. This resistance varies in the range of 0.004–0.036 Ω.cm2.
Performance Based in Impedance Spectroscopy at Low Relative Humidity
This section will deal with the Nyquist diagrams obtained for low RH (33% RH). It is expected that the performance decreases as the internal resistance associated with the cell increases at low humidification rates. The main cause is attributed to the polymeric membrane, being a solid electrolyte that requires a certain degree of humidification to work at maximum efficiency. This issue is even more important when the cell operates at high current loads. The need to conduct an analysis at this level of RH is due to the wide range of possible applications that have a PEFC working at low levels of humidification. In Figure 6, the ohmic resistance has considerably increased if compared to the value for fully humidified conditions. Further, for this case the ohmic resistance is dependent on the applied load, this is due to an increase in the kinetic activity of the cell produces a higher content of water inside the cell. Then, the ohmic resistance values are reduced from 0.198–0.132 Ω.cm2 to 0.2–2.0 A.cm–2, respectively. It also observable that the values of the charge transfer resistance also increase, and their behavior is similar to what is described in the previous section. The charge transfer resistances fall in the range of 0.1–0.38 Ω.cm2. On the other hand, in dry conditions is noticeable that the increase in the mass transport resistance, phenomenon that occurs at low current densities but is much more considerable at high current densities. It can be attributed to a decrease in efficiency in the polymeric membrane and an increase in the diffusion of species in the CL. These values fall in the range of 0.014–0.104 Ω.cm2.
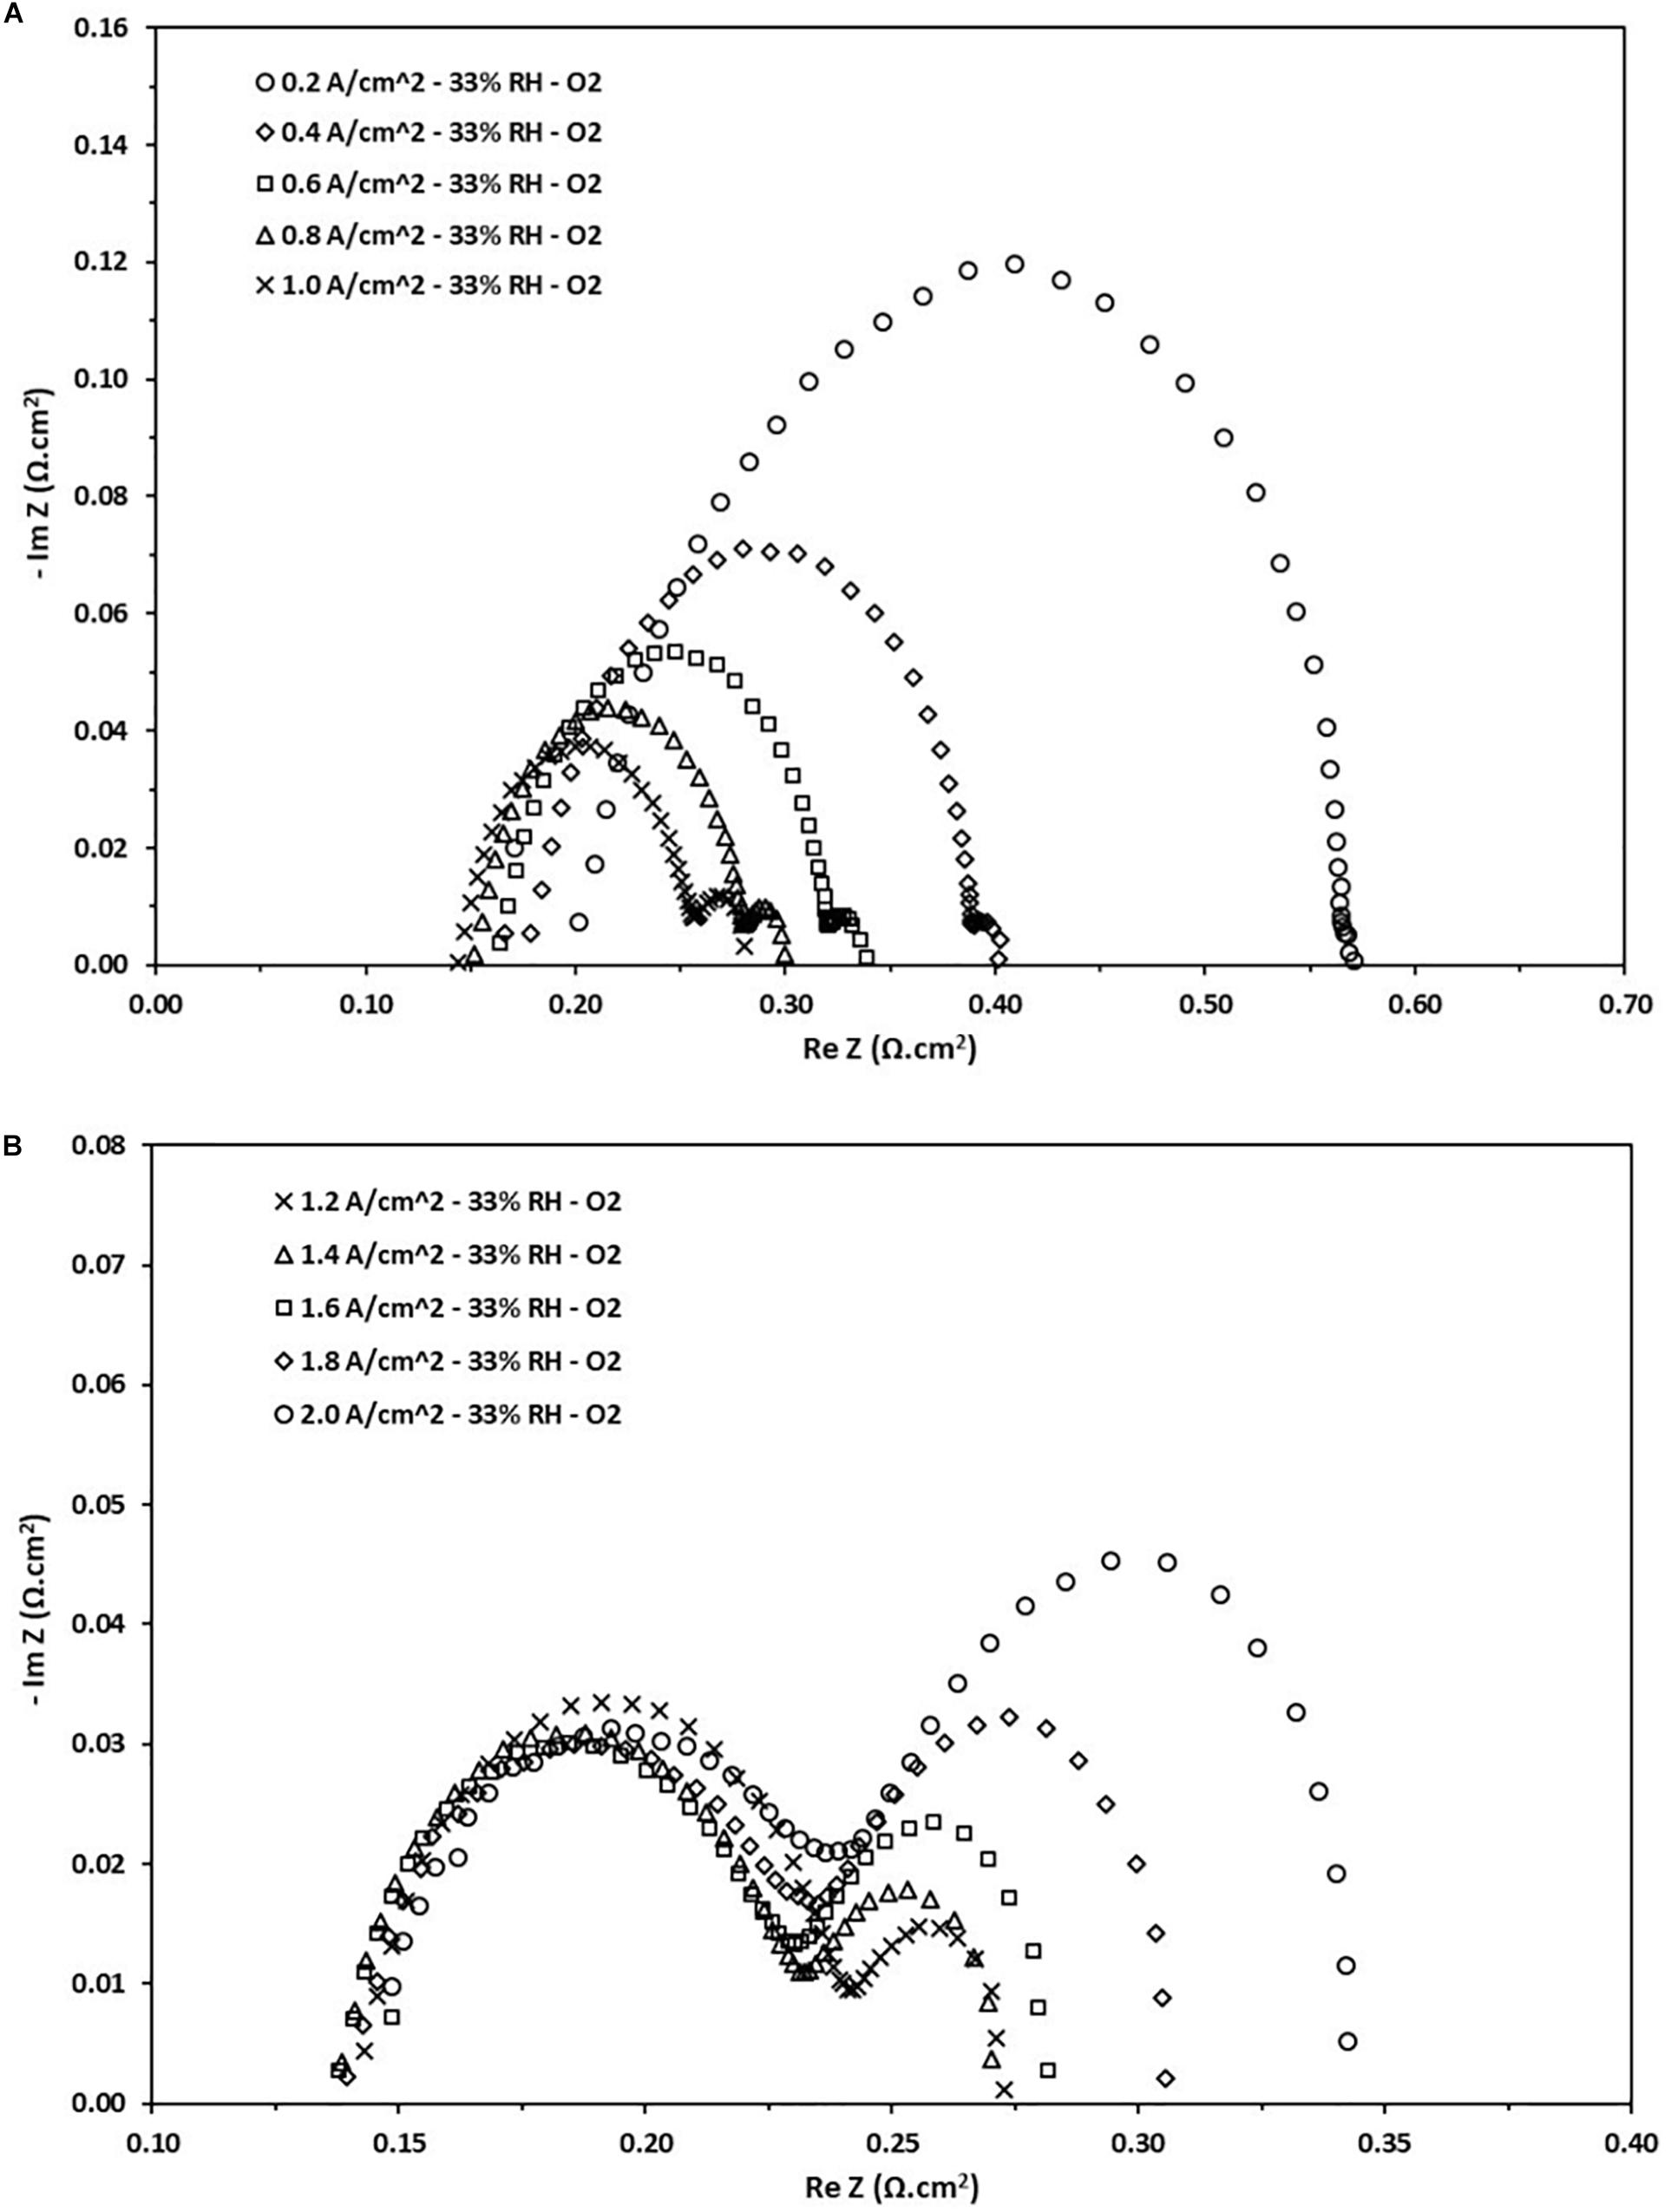
Figure 6. Nyquist diagram obtained from the EIS test at different current loads at 33% RH. (A) Density current from 0.2 to 1.0 A/cm2. (B) Density current from 1.2 to 2.0 A/cm2.
Effect on the Performance in the Membrane at High and Low RH
Figure 7 shows the results of the measured ohmic resistance as a function of current density at high and low RH, 100 and 33% respectively. As expected, the ohmic resistance of the Nafion® 212 membrane is lower when it operates at 100% RH whereas there is a significant increase when it operates in dry conditions at 33%. It is notable that there is a variation in ohmic resistance when the cell operates at low humidity. At a current density of 1.2 A.cm–2, the ohmic resistance is approximately 0.141 Ω.cm2 whereas that for 100% humidification it is 0.071 Ω.cm2, i.e., it practically doubles.
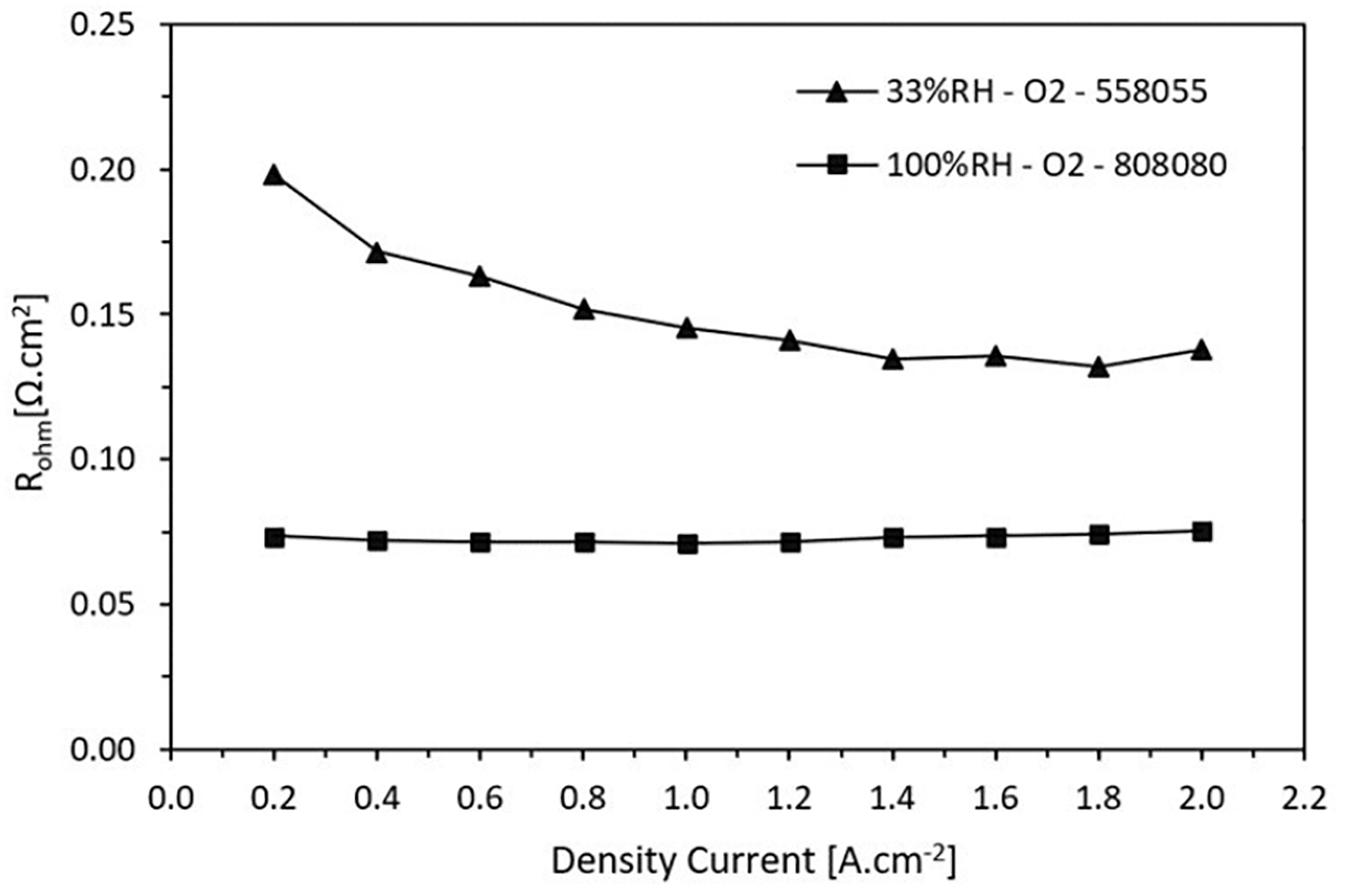
Figure 7. Ohmic resistance trend in function on the current density for high and low relative humidity.
Kinetics Effect on the Performance at High and Low RH
Figure 8 shows the charge transfer resistance as a function of current density at high and low RH, 100 and 33%, respectively. As a first observation the charge transfer resistance decreases when the current density increases until reaching a minimum point and then it remains somewhat stationary. This behavior is corroborated with previous studies (Ramani et al., 2004; Tang et al., 2006). It is attributed to a greater demand of the catalytic activity of the electrochemical reactions that occur in the CL producing a decrement of this resistance. Note that for both wet and dry conditions, for current densities higher to 1.6 A.cm–2 the resistances are around 0.1 Ω.cm2.
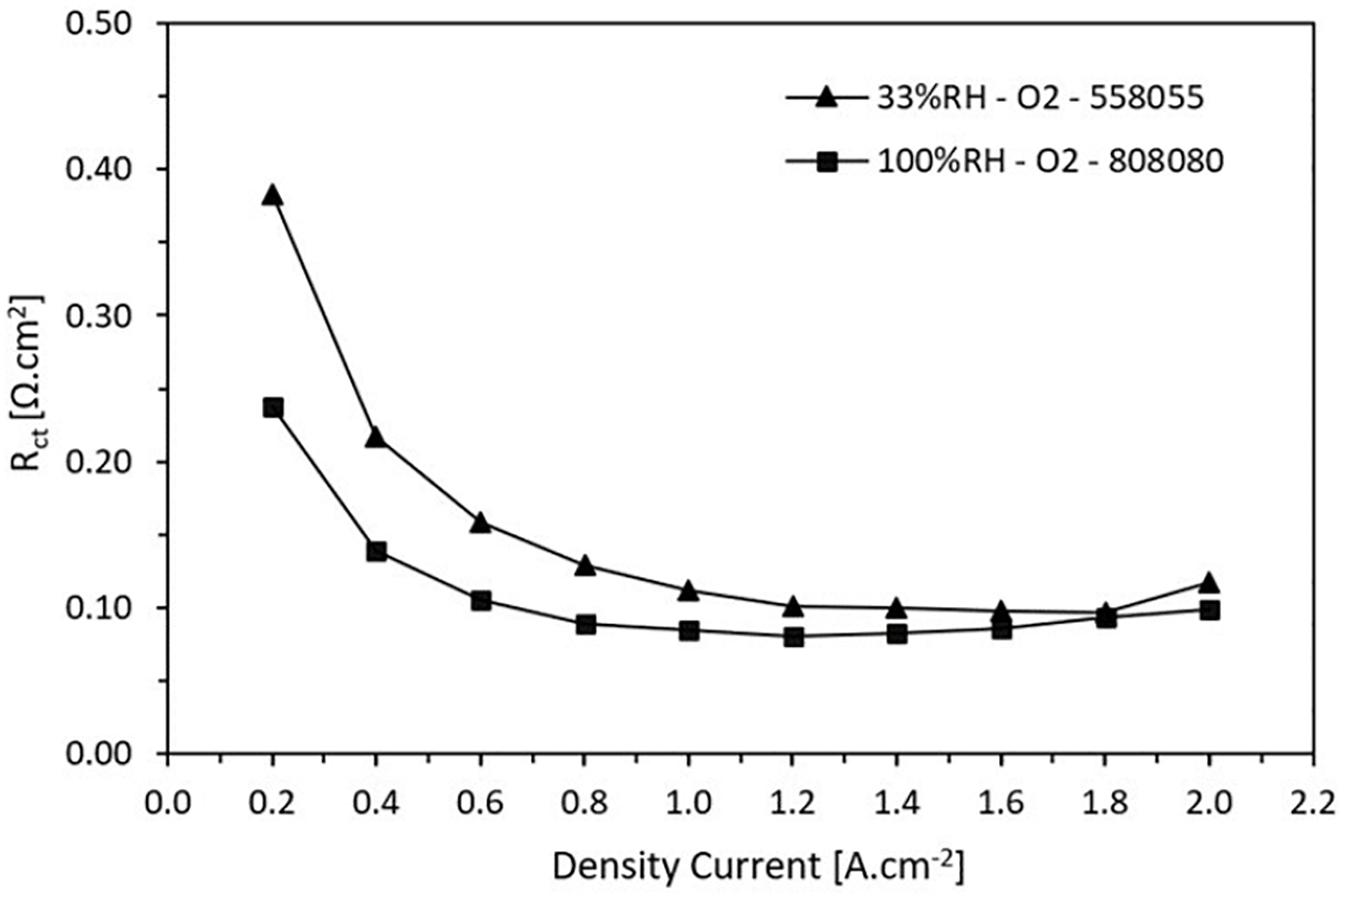
Figure 8. Charge transfer resistance trend in function on the current density for low and high relative humidity.
Mass Transfer Effect on the Performance at High and Low RH
Figure 9 shows how the mass transfer resistance varies according to the current density for high and low RH. It is noticed that at low RH, the losses for mass transfer are greater and they are presented for all the current density values. For high RH, the mass transfer resistance appears when the current density achieves 1.2 A.cm2. It has a growing behavior, which is due to the saturation of the species involved in the reactions in the CL. The charge transfer increases as the load demand increases. This situation continues until to reach a point where the cell is not able to operate.
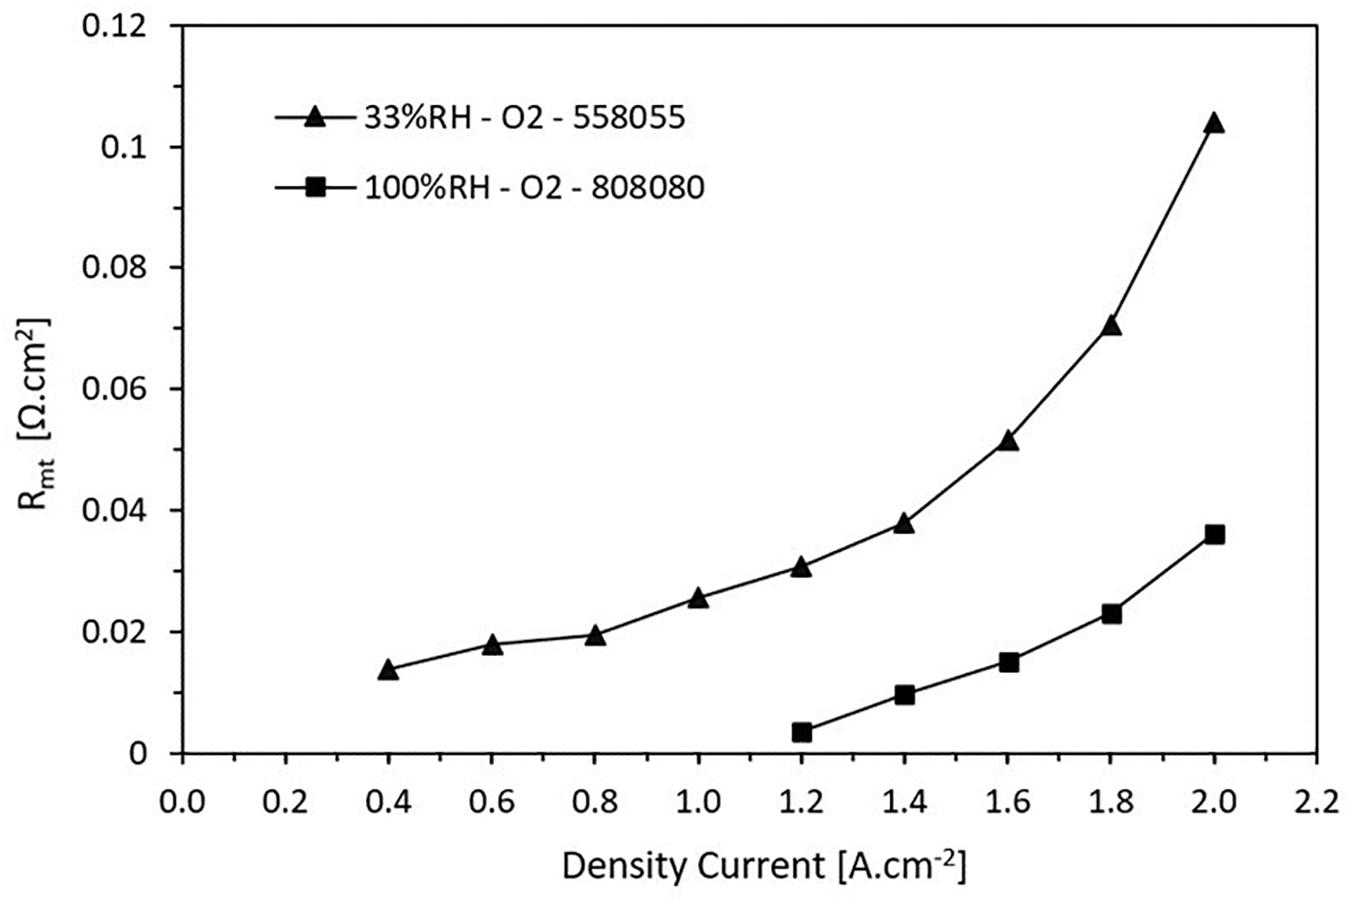
Figure 9. Trend of the mass transport resistance as a function of the current density. The resistance increases when the current density increases.
Finally, all the results obtained in this work are shown in Table 1. They are divided into two parts, for 100 and 33% RH of the reactant gases. Based on the results showed in Table 1, it is noticed that for a current density of 1.2 A.cm–2, an operating voltage of 0.662 volts is obtained and a total resistance of 0.155 Ω.cm2 operating the cell at 100% RH, which is the point of maximum performance. In the same way, for the same current density has an operating voltage of 0.529 volts and a total resistance of 0.273 Ω.cm2 operating the cell at 33% RH. In addition, it is evident that the maximum resistance of the cell is of 0.311 and 0.581 Ω.cm2 for 100 and 33% RH, respectively. The maximum total resistances occur at low current density, i.e., 0.2 A.cm2.
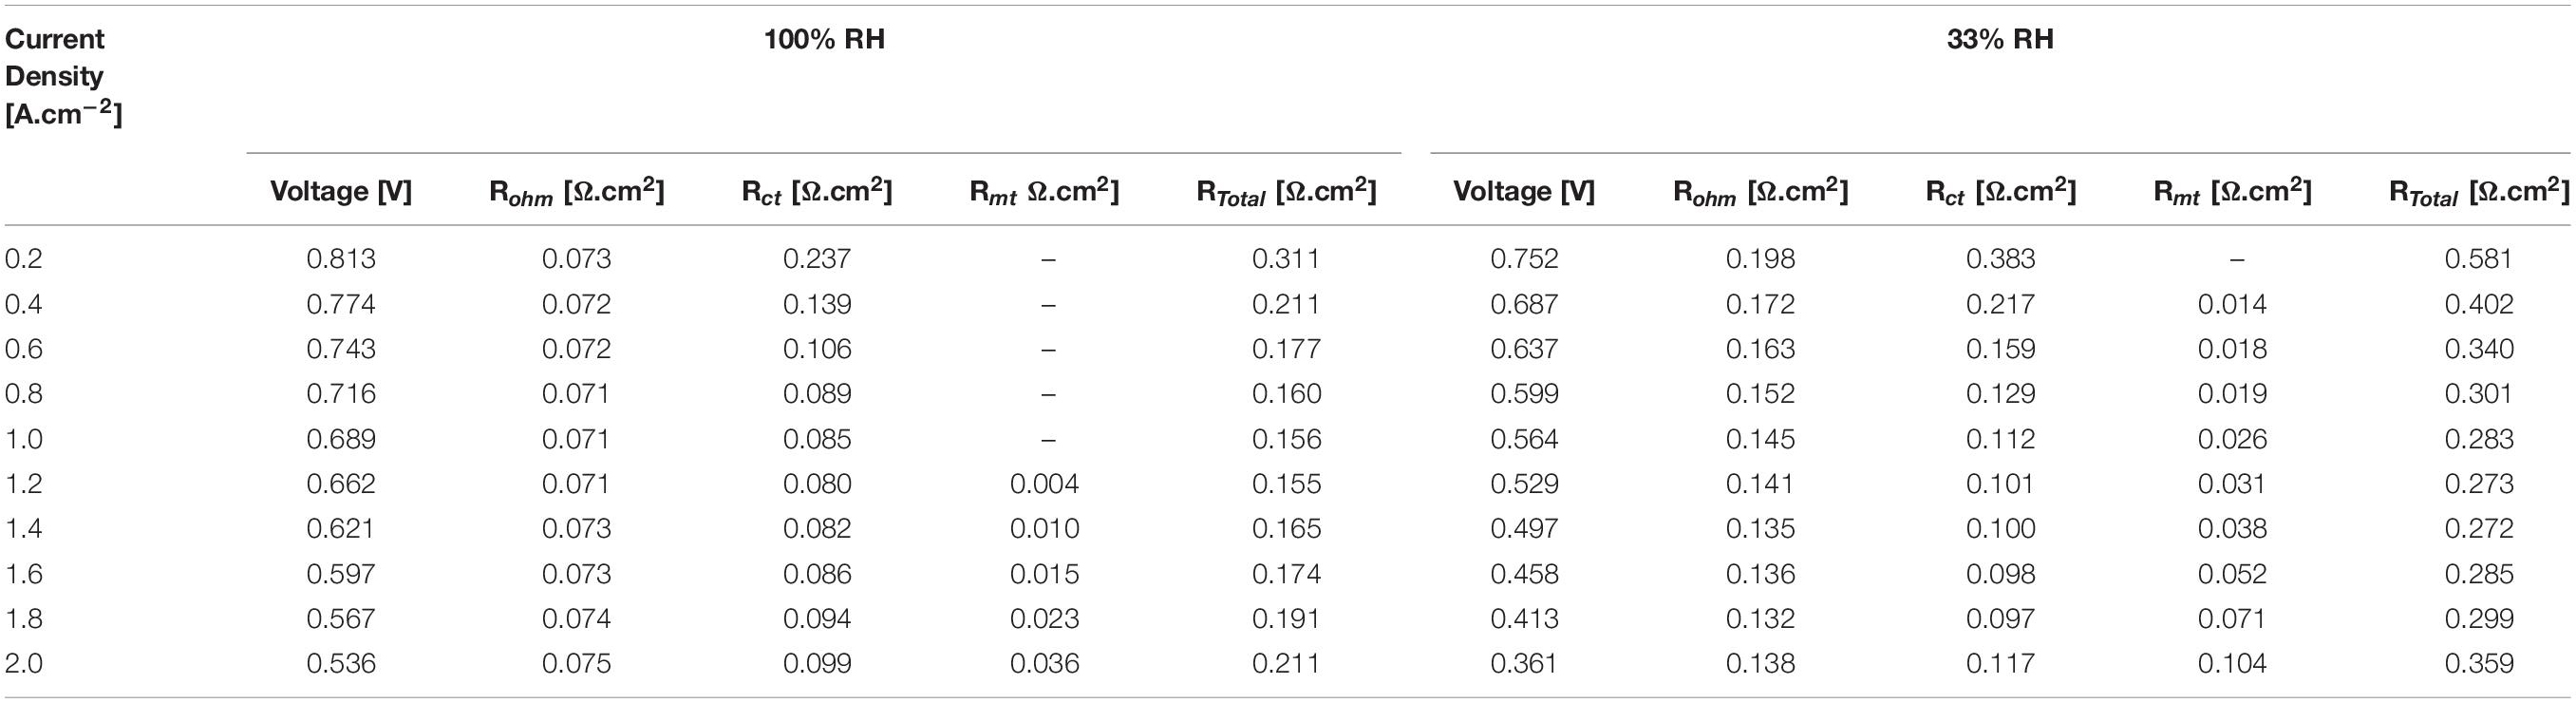
Table 1. Results of the performance in the internal resistances comparing high and low relative humidity.
Conclusion
The results obtained through EIS test revealed the behavior of the various voltage losses within the cell, which are attributed to ohmic resistance, charge transfer resistance and mass transport resistance. The ohmic resistance is mainly attributed to the resistance of Nafion® 212 (used in this work), with a value of 0.075 Ω.cm2 for high RH, and 0.198–0.132 Ω.cm2 for low RH. The ohmic resistance represents around 23–45% of the total resistance of the cell for high RH and between 33 and 51% for low RH. It was also demonstrated that the ohmic resistance is independent to the applied cell load at high RH (100%). The charge transfer resistance decreases with an increased current load and tends to approach a constant value which can be attributed as the starting point of the saturation of the species in the CL. These values represent between 50 and 75% of the total resistance of the cell under conditions of high RH, and between 30 and 65% in low of RH conditions. Future studies can be focused on optimizing the porous media of the gas diffuser layers and the composition of the CL in order to reduce the impact of the charge transfer resistance. In addition, it was verified that the resistance to mass transfer appears only at high current densities. However, at low RH they can appear also at low current densities. In high humidification conditions they represent up to 17% of the total resistance of the cell, while at low humidification they represent up to 30% of the total resistance of the cell approximately. Finally, it was found that the optimal operating points in high humification conditions was 0.662 volts with a total resistance of 0.155 Ω.cm2, and in low humidification conditions was 0.529 volts with a total resistance of 0.273 Ω.cm2, both for a current density of 1.2 A.cm–2.
Data Availability Statement
The raw data supporting the conclusions of this article will be made available by the authors, without undue reservation.
Author Contributions
JS: conceptualization, methodology, validation, data curation, and writing – original draft. ME-A: formal analysis, investigation, resources, writing – review and editing, and supervision. TL: methodology and validation. MA: formal analysis, writing – review and editing, and validation. All authors contributed to the article and approved the submitted version.
Conflict of Interest
The authors declare that the research was conducted in the absence of any commercial or financial relationships that could be construed as a potential conflict of interest.
Acknowledgments
The authors kindly acknowledge the support from ESPOL. The authors kindly acknowledge the financial support from FIMCP-CERA-05-2017. In addition, Åforsk project No. 17-331 is gratefully acknowledged.
Abbreviations
AC, alternating current; ASTM, American Society for Testing and Materials; CPE, constant phase element; CL, catalyst layer; CO2, carbon dioxide; COS, carbonyl sulfide; DC, direct current; EIS, electrochemical impedance spectroscopy; FC, fuel cell; FRA, frequency response analyzer; GDL, gas diffusion layer; H2, hydrogen; H2O, water; IEA, International Energy Agency; Im, imaginary part impedance; MEA, membrane electrode assembly; MPL, micro porous layer; N2, nitrogen; ORR, oxygen reduction reaction; O2, oxygen; PEFC, polymer electrolyte fuel cell; Pt, platinum; Rct, charge transfer resistance, Ω; Rohm, ohmic resistance, Ω; Rmt, mass transport resistance, Ω; RH, relative humidity; Re, real part impedance; Z, impedance.
References
Andersson, M., Beale, S. B., Espinoza, M., Wu, Z., and Lehnert, W. (2016). A review of cell-scale multiphase flow modeling, including water management, in polymer electrolyte fuel cells. Appl. Energy 180, 757–778. doi: 10.1016/j.apenergy.2016.08.010
Asghari, S., Mokmeli, A., and Samavati, M. (2010). Study of PEM fuel cell performance by electrochemical impedance spectroscopy. Int. J. Hydrogen Energy 35, 9283–9290. doi: 10.1016/j.ijhydene.2010.03.069
Brunetto, C., Moschetto, A., and Tina, G. (2009). PEM fuel cell testing by electrochemical impedance spectroscopy. Electr. Power Syst. Res. 79, 17–26. doi: 10.1016/j.epsr.2008.05.012
Chen, G., Zhao, Y., Fu, G., Duchesne, P. N., Gu, L., Zheng, Y., et al. (2014). Interfacial effects in iron-nickel hydroxide-platinum nanoparticles enhance catalytic oxidation. Science 344, 495–499. doi: 10.1126/science.1252553
Cooper, K. R., Ramani, V., Kunz, H. R., and Fenton, J. M. (2005). Experimental Methods and Data Analyses for Polymer Electrolyte Fuel Cells. Southern Pines: Scribner.
Dale, N. V., Mann, M. D., Salehfar, H., Dhirde, A. M., and Han, T. (2010). Ac impedance study of a proton exchange membrane fuel cell stack under various loading conditions. J. Fuel Cell Sci. Technol. 7:031010. doi: 10.1115/1.3207871
Dhirde, A. M., Dale, N. V., Salehfar, H., Mann, M. D., and Han, T.-H. (2010). Equivalent electric circuit modeling and performance analysis of a PEM fuel cell stack using impedance spectroscopy. IEEE Trans. Energy Convers. 25, 778–786. doi: 10.1109/TEC.2010.2049267
Espinoza, M., Andersson, M., Yuan, J., and Sundén, B. (2015). Compress effects on porosity, gas-phase tortuosity, and gas permeability in a simulated PEM gas diffusion layer. Int. J. Energy Res. 39, 1528–1536. doi: 10.1002/er.3348
Espinoza-Andaluz, M., Li, T., and Andersson, M. (2019). Impact of water-drop presence on diffusion parameters of PEFC gas diffusion layers. Energy Proc. 158, 1400–1405. doi: 10.1016/j.egypro.2019.01.341
Freire, T. J. P., and Gonzalez, E. R. (2001). Effect of membrane characteristics and humidification conditions on the impedance response of polymer electrolyte fuel cells. J. Electroanal. Chem. 503, 57–68. doi: 10.1016/S0022-0728(01)00364-3
Harrington, D. A., and Van Den Driessche, P. (2011). Mechanism and equivalent circuits in electrochemical impedance spectroscopy. Electrochim. Acta 56, 8005–8013. doi: 10.1016/j.electacta.2011.01.067
Hirschorn, B., Orazem, M. E., Tribollet, B., Vivier, V., Frateur, I., and Musiani, M. (2010). Constant-phase-element behavior caused by resistivity distributions in films. J. Electrochem. Soc. 157:C458. doi: 10.1149/1.3499565
International Energy Agency (2014). Fossil Fuel Energy Consumption (% of Total). Available online at: https://data.worldbank.org/indicator/EG.USE.COMM.FO.ZS?end=2015&start=1960&view=chart (accessed July 14, 2019).
Lefebvre, M. C., Martin, R. B., and Pickup, P. G. (1999). Characterization of ionic conductivity profiles within proton exchange membrane fuel cell gas diffusion electrodes by impedance spectroscopy. Electrochem. Solid-State Lett. 2, 259–261. doi: 10.1149/1.1390804
Mérida, W., Harrington, D. A., Le Canut, J. M., and McLean, G. (2006). Characterisation of proton exchange membrane fuel cell (PEMFC) failures via electrochemical impedance spectroscopy. J. Power Sourc. 161, 264–274. doi: 10.1016/j.jpowsour.2006.03.067
Park, J., Zhang, L., Choi, S. II, Roling, L. T., Lu, N., Herron, J. A., et al. (2015). Atomic layer-by-layer deposition of platinum on palladium octahedra for enhanced catalysts toward the oxygen reduction reaction. ACS Nano 9, 2635–2647. doi: 10.1021/nn506387w
Ramani, V., Kunz, H. R., and Fenton, J. M. (2004). Investigation of Nafion§/HPA composite membranes for high temperature/low relative humidity PEMFC operation. J. Memb. Sci. 232, 31–44. doi: 10.1016/j.memsci.2003.11.016
Rezaei Niya, S. M., and Hoorfar, M. (2013). Study of proton exchange membrane fuel cells using electrochemical impedance spectroscopy technique - a review. J. Power Sources 240, 281–293. doi: 10.1016/j.jpowsour.2013.04.011
Rothman, D. H. (2019). Characteristic disruptions of an excitable carbon cycle. Proc. Natl. Acad. Sci. U.S.A. 16, 14813–14822. doi: 10.1073/pnas.1905164116
Salva, J. A., Iranzo, A., Rosa, F., Tapia, E., Lopez, E., and Isorna, F. (2016). Optimization of a PEM fuel cell operating conditions: obtaining the maximum performance polarization curve. Int. J. Hydrogen Energy 41, 19713–19723. doi: 10.1016/j.ijhydene.2016.03.136
Santana, J., Espinoza-Andaluz, M., Villon, G., Qi, Y., Li, T., and Andersson, M. (2020). Temperature impact on the internal resistance of a polymer electrolyte fuel cell considering the electrochemical impedance spectroscopy diagnosis. ECS Trans. 96, 183–190. doi: 10.1149/09601.0183ecst
Scribner Associates (2007). Fuel Cell Test System Operating Manual 850C. 1, 1-66. Available online at: http://ww2.che.ufl.edu/unit-ops-lab/experiments/FC/FC-Manual-850C-Rev-G-Mod-11_20_14.pdf (accessed May 1, 2019).
Tang, Y., Zhang, J., Song, C., Liu, H., Zhang, J., Wang, H., et al. (2006). Temperature dependent performance and in situ AC impedance of high-temperature PEM fuel cells using the Nafion-112 membrane. J. Electrochem. Soc. 153, 18–20. doi: 10.1149/1.2337008
Wang, Y., Chen, K. S., Mishler, J., Cho, S. C., and Adroher, X. C. (2011). A review of polymer electrolyte membrane fuel cells: technology, applications, and needs on fundamental research. Appl. Energy 88, 981–1007. doi: 10.1016/j.apenergy.2010.09.030
Wee, J. H. (2007). Applications of proton exchange membrane fuel cell systems. Renew. Sustain. Energy Rev. 11, 1720–1738. doi: 10.1016/j.rser.2006.01.005
Wilberforce, T., Alaswad, A., Palumbo, A., Dassisti, M., and Olabi, A. G. (2016). Advances in stationary and portable fuel cell applications. Int. J. Hydrogen Energy 41, 16509–16522. doi: 10.1016/j.ijhydene.2016.02.057
Yan, Q., Toghiani, H., and Wu, J. (2006). Investigation of water transport through membrane in a PEM fuel cell by water balance experiments. J. Power Sources 158, 316–325. doi: 10.1016/j.jpowsour.2005.09.013
Keywords: internal resistance, performance, PEFC, humidification, reactant gases
Citation: Santana J, Espinoza-Andaluz M, Li T and Andersson M (2020) A Detailed Analysis of Internal Resistance of a PEFC Comparing High and Low Humidification of the Reactant Gases. Front. Energy Res. 8:217. doi: 10.3389/fenrg.2020.00217
Received: 13 June 2020; Accepted: 10 August 2020;
Published: 28 August 2020.
Edited by:
Mohammed S. Ismail, The University of Sheffield, United KingdomReviewed by:
Elena Carcadea, National Research and Development Institute for Cryogenic and Isotopic Technologies (ICSI), RomaniaNahla E. Alhazmi, King Abdulaziz City for Science and Technology, Saudi Arabia
Copyright © 2020 Santana, Espinoza-Andaluz, Li and Andersson. This is an open-access article distributed under the terms of the Creative Commons Attribution License (CC BY). The use, distribution or reproduction in other forums is permitted, provided the original author(s) and the copyright owner(s) are credited and that the original publication in this journal is cited, in accordance with accepted academic practice. No use, distribution or reproduction is permitted which does not comply with these terms.
*Correspondence: Mayken Espinoza-Andaluz, bWFzZXNwaW5AZXNwb2wuZWR1LmVj