 Ayman Temraz
 Falah Alobaid
 Thomas Lanz1
 Ahmed Elweteedy
- 1Mechanical Engineering Department, Institute for Energy Systems and Technology, Technical University of Darmstadt, Darmstadt, Germany
- 2Mechanical Power and Energy Department, Military Technical College, Cairo, Egypt
The safe operation of a two-phase heat exchanger can be performed by determining the instability threshold values of power plant parameters. Thus, the power plant parameters must be designed outside these thresholds to avoid undesirable instability. The fluctuations in mass flow and system pressure are undesirable processes, resulting in system failure. In diverse heat transfer distribution, that can lead to burn-out of heat exchanger tubes. Therefore, the maintaining of flow stability in a power plant is of particular relevance. The researchers and engineers can predict the threshold of flow instability with dynamic models validated with experimental records. The phenomenon of dynamic flow instabilities in two-phase flows is an important issue that has high relevance for many industries. The awareness about the triggers and the effects of fluid dynamic instabilities is of great importance in the design and operation of steam generators, refrigeration systems, thermosiphons or boiling water reactors. These instabilities manifest themselves in variations of mass flow, pressure, and fluid properties. In this work, the dynamic instabilities involved in evaporation processes were briefly discussed with simple models to understand the mechanism of its different types. Additionally, it is presented the design and construction of a two-phase flow test rig using the similarity and the scaling criteria. A heat recovery steam generator (HRSG) designed by Doosan Heavy Industries and Construction is scaled down to 4 × 4 × 2 m3. The combination of the flow diagram and the thermohydraulic design is represented in three-dimension model of the test rig using the Siemens NX 10.0 software. The flexibility of operation was taken into account in the design of this test rig. Finally, we provided preliminary results to showcase some functionalities and the capability of the test rig to characterize the existing flow pattern through the evaporator and investigate the internal characteristic curve of the evaporator.
Introduction
Thermal power plants generate the largest share of electrical energy worldwide (Bp Statistical Review of World Energy, 2019). According to World Energy Outlook (in 2015), the gas-fired power generation contributed to 23% global electricity supply, dominated by combined cycle power plants (CCPP) (International Energy Agency, 2015). The modern concept of CCPP is mainly driven by increasing performance of the gas turbine. Today, a 1 + 1 arrangement of gas turbine and steam turbine in combination with a triple-pressure heat recovery steam generator (HRSG) is state of the art, reaching a nominal process efficiency of up to 60% (Alobaid, 2018). Since the gas turbine is an inherently flexible component, studies in the literature were largely focused on the dynamic response of the water/steam bottoming cycle. In HRSGs, demineralised water is vaporized using the hot exhaust gasses from the upstream gas turbine, thus driving the steam turbine. There are two different concepts for HRSGs. On the one hand, there is the vertical HRSG with horizontal tubes, and on the second hand the horizontal HRSG with vertical tubes. Depending on the construction and the working principle of the HRSG, there are more or less prone to so-called flow instabilities and concerning climate protection, it is a significant task to develop evaporation processes in the HRSGs, because this can increase the efficiency of the power plants and thus reduce CO2 emissions. It is important to understand occurring instabilities to prevent unstable and unsafe operating conditions during the evaporation process to increase the service life of the HRSGs. In order to achieve a better understanding of this evaporation process, research is being conducted in the areas of heat transfer, pressure drops and instability phenomena in two-phase (water-steam) flow.
Flow instabilities due to mass flow or pressure disturbances lead to mechanical as well as thermal fatigue (Boure et al., 1973). These instabilities can cause serious damage or impairment during operation. In the case of mechanical fatigue, vibrations are induced in the HRSG as well as in its components due to mass flow and/or pressure oscillations. Furthermore, swinging wall temperatures can develop thermal stresses within the tube. Flow instabilities can lead to a periodic change of the flow forms with different heat transfer mechanisms, which can lead to different wall overheating in the tube. Inadequate cooling of the tube wall leads to thermal failure, which usually manifests itself in the form of burnout of the wall. Thus, due to oscillations of several parameters, no stable process takes place. On the one hand, these flow instabilities lead to a reduction in the overall efficiency and on the second hand, they lead to many undesirable side effects, e.g., tube vibration. In particular, a reliable prediction of possible flow instabilities is important to avoid insufficient cooling of the steam generator tubes due to insufficient water circulation. Thus, reliable dimensioning and design of equipment in which these flows occur is a very important challenge.
In the two-phase flow systems, several different instabilities may occur. While the static instabilities are part of the standard boiler design and analytically accessible, a great effort is to be introduced by researchers to understand the dynamic instabilities. Unlike static instabilities, which contain a one-time excursion from an unstable operating point to a new stable condition, the dynamic instabilities are labeled by continuous cycling between slightly unstable operating points. These dynamic instabilities are hereunder briefly explained. In general, the dynamic instabilities in heat exchanger tubes can be classified as Density-wave type oscillations (DWO), Pressure-drop type oscillations (PDO), and Thermal type oscillations.
In the following review, different set-ups were used to investigate the different types of dynamic instabilities. Kaichiro et al. (1985) studied the relation between burnout and instabilities for water above the critical point and (Wang et al., 1994) formulated a correlation for the prediction of limiting heat flux and quality of the DWO type. Some other researchers studied the dynamic instabilities using water as a test fluid in a vertical test tube with natural circulation as an external characteristic. Jain et al. (1966) discussed the effect of system geometry on the behavior of the DWOs. Delmastro and Clausse (1994) studied the phase trajectories and chaos analysis. Kim and Lee (2000) emphasized the role of the flow restriction between the expansion tank and the experimental loop and studied several instability interacting modes. Guanghui et al. (2002) derived a criterion and period correlation of DWO and (Baars and Delgado, 2006) studied modes of geysering coupled with manometer oscillations and the interaction of the DWOI and DWOIII. These researchers conducted experiments with water in a vertical test tube exposed to the forced circulation.
The horizontally oriented test tube with water as a test fluid is very rare. Maulbetsch and Griffith (1965) studied the influence of the compressible volume on the PWO and DWO with water driven by forced circulation in horizontal orientation pipe and (Karsli et al., 2002) investigated the amplitudes and periods of the DWOs in a horizontal pipe with inserts.
The following researchers conducted experiments with horizontally oriented test tubes but they used a refrigerant as a test fluid. Yüncü (1990) developed a model based on the homogeneous flow assumption to predict stability boundaries of the boiling two-phase flow system for the PDO and DWO and compared its results with his experimental results. Çomaklı et al. (2002) investigated the pipe length effect on the dynamic instabilities besides defining the boundaries for the appearance of PDO, DWO and thermal oscillations. Karsli et al. (2002) investigated the effect of internal surface modification on the boundaries for the appearance and the characteristics of the PDO, DWO and thermal oscillations. Kakaç and Cao (2009) analyzed the PDO and thermal oscillations with upstream compressible volume in both, vertical and horizontal test tubes numerically with the Drift-Flux model and verified the results by his experimental findings. Liang et al. (2011) investigated the two types of instabilities, static and dynamic, in a refrigeration system. Dorao (2015) studied the period of DWOs in a uniformly heated horizontal test tube experimentally. Sørum and Dorao (2015) studied the effect of the DWO on the boiling heat transfer coefficient. Zhang et al. (2018a) investigated the relationship between changing the heat flux and inlet subcooling degree on the features of DWO and PWO. Park et al. (2018a) studied the interaction between PWOs and superimposed DWOs. Zhang et al. (2018b) analyzed the effect of the heat load distribution and the wall thermal capacity on the stability of the flow boiling. Finally, Park et al. (2018b) observed the influence of the existence of a compressible volume in the system on the amplitude of the superimposed DWO.
The dynamic instabilities analyses for vertical HRSG are of significant importance. As shown in the literature, there is no experimental study regarding the instabilities analyses for natural circulation vertical HRSG. Furthermore, it can be seen that little research in the field of two-phase flows deals with demineralized water as a test fluid. Previous experimental studies in this research area mainly used refrigerants such as Freon-11, because of their low boiling point. In contrast, a test rig is designed and operated with the demineralized water as a test fluid to avoid potential side effects due to different fluid properties. Another point by which the test rig differs from previous ones is the variability in parameters concerning startup processes, the orientation of the evaporator pipe and the multiplicity of operating options.
In this paper, the fundamentals of the two-phase flow are briefly explained and the mechanisms of three main types of the two-phase flow dynamic instabilities in water tube boiling are described in detail using simple models. Then, the design of the test rig using similarity-based scaling criteria and flexibility of our two-phase test rig are mentioned. In addition, we evaluated the main design and operational parameters of the test rig and characterized the components of the test rig. Finally, we provided preliminary results to showcase some functionalities and the capability of the test rig to characterize the existing flow pattern through the evaporator and investigate the internal characteristic curve of the evaporator.
Technical Fundamentals
To understand the properties and conditions in two-phase flow, it is first of all important to deal with the different flow or phase distribution states of a two-phase flow. The water and steam phases can differently be distributed in a tube with the independence of velocity, volume fraction and the tube orientation (horizontal, vertical or inclined). The various distributions of water and steam phases in a tube are known as flow patterns. Depending on the volume fraction of the steam and the orientation of the tube, different flow forms occur (Walter and Epple, 2017). In the horizontal heated pipe, the water enters the heated pipe as sub-cooled water and leaves as superheated steam. Between the inlet and outlet of the heated pipe, mixed and transitional forms occur as shown in Figure 1. Flow maps are generally applied to predict the local flow pattern in a pipe. In these maps, the existence range of flow regime is represented in two-dimensions. It displays the transition boundary between the flow regimes, generally plotted on a log-log graph. These flow maps can only give a rough guide on the flow regimes in the heated pipe because there are no clear boundaries between the individual flow forms. In the literature, several flow maps are available, where the comparison between them is very difficult. Many of these maps are developed for an adiabatic water-steam flow and thus are only suitable for heated pipe under additional assumptions. Simple maps use one axis to differ between the flow regimes, while complex maps are built based on different axes. Figure 2 shows a complex flow map for the horizontal and inclined heated pipe is developed by Taitel and Dukler (1976). It is one of the most widely used flow maps for predicting the transient between two-phase flow regimes in a horizontal heated pipe.
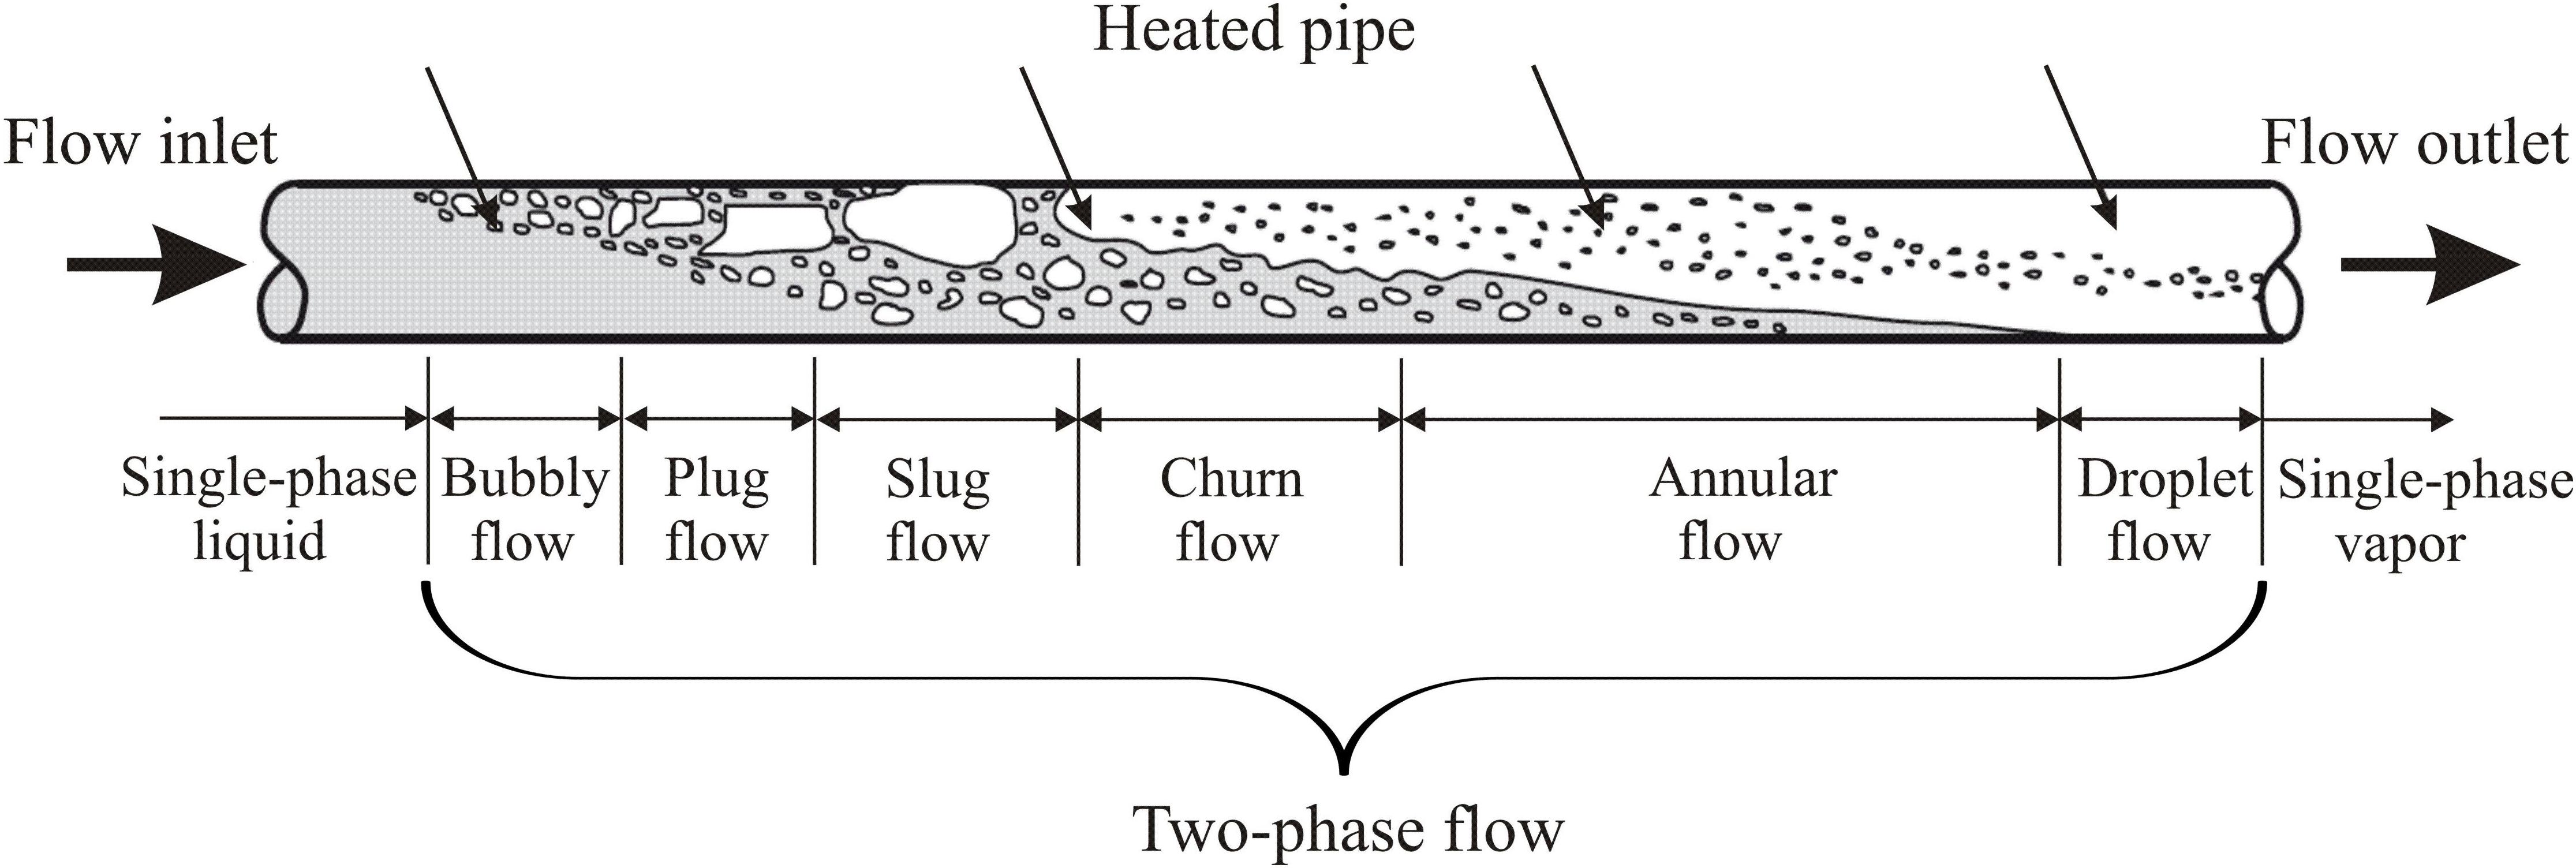
Figure 1. Flow patterns in the horizontal heated pipe (Walter and Epple, 2017).
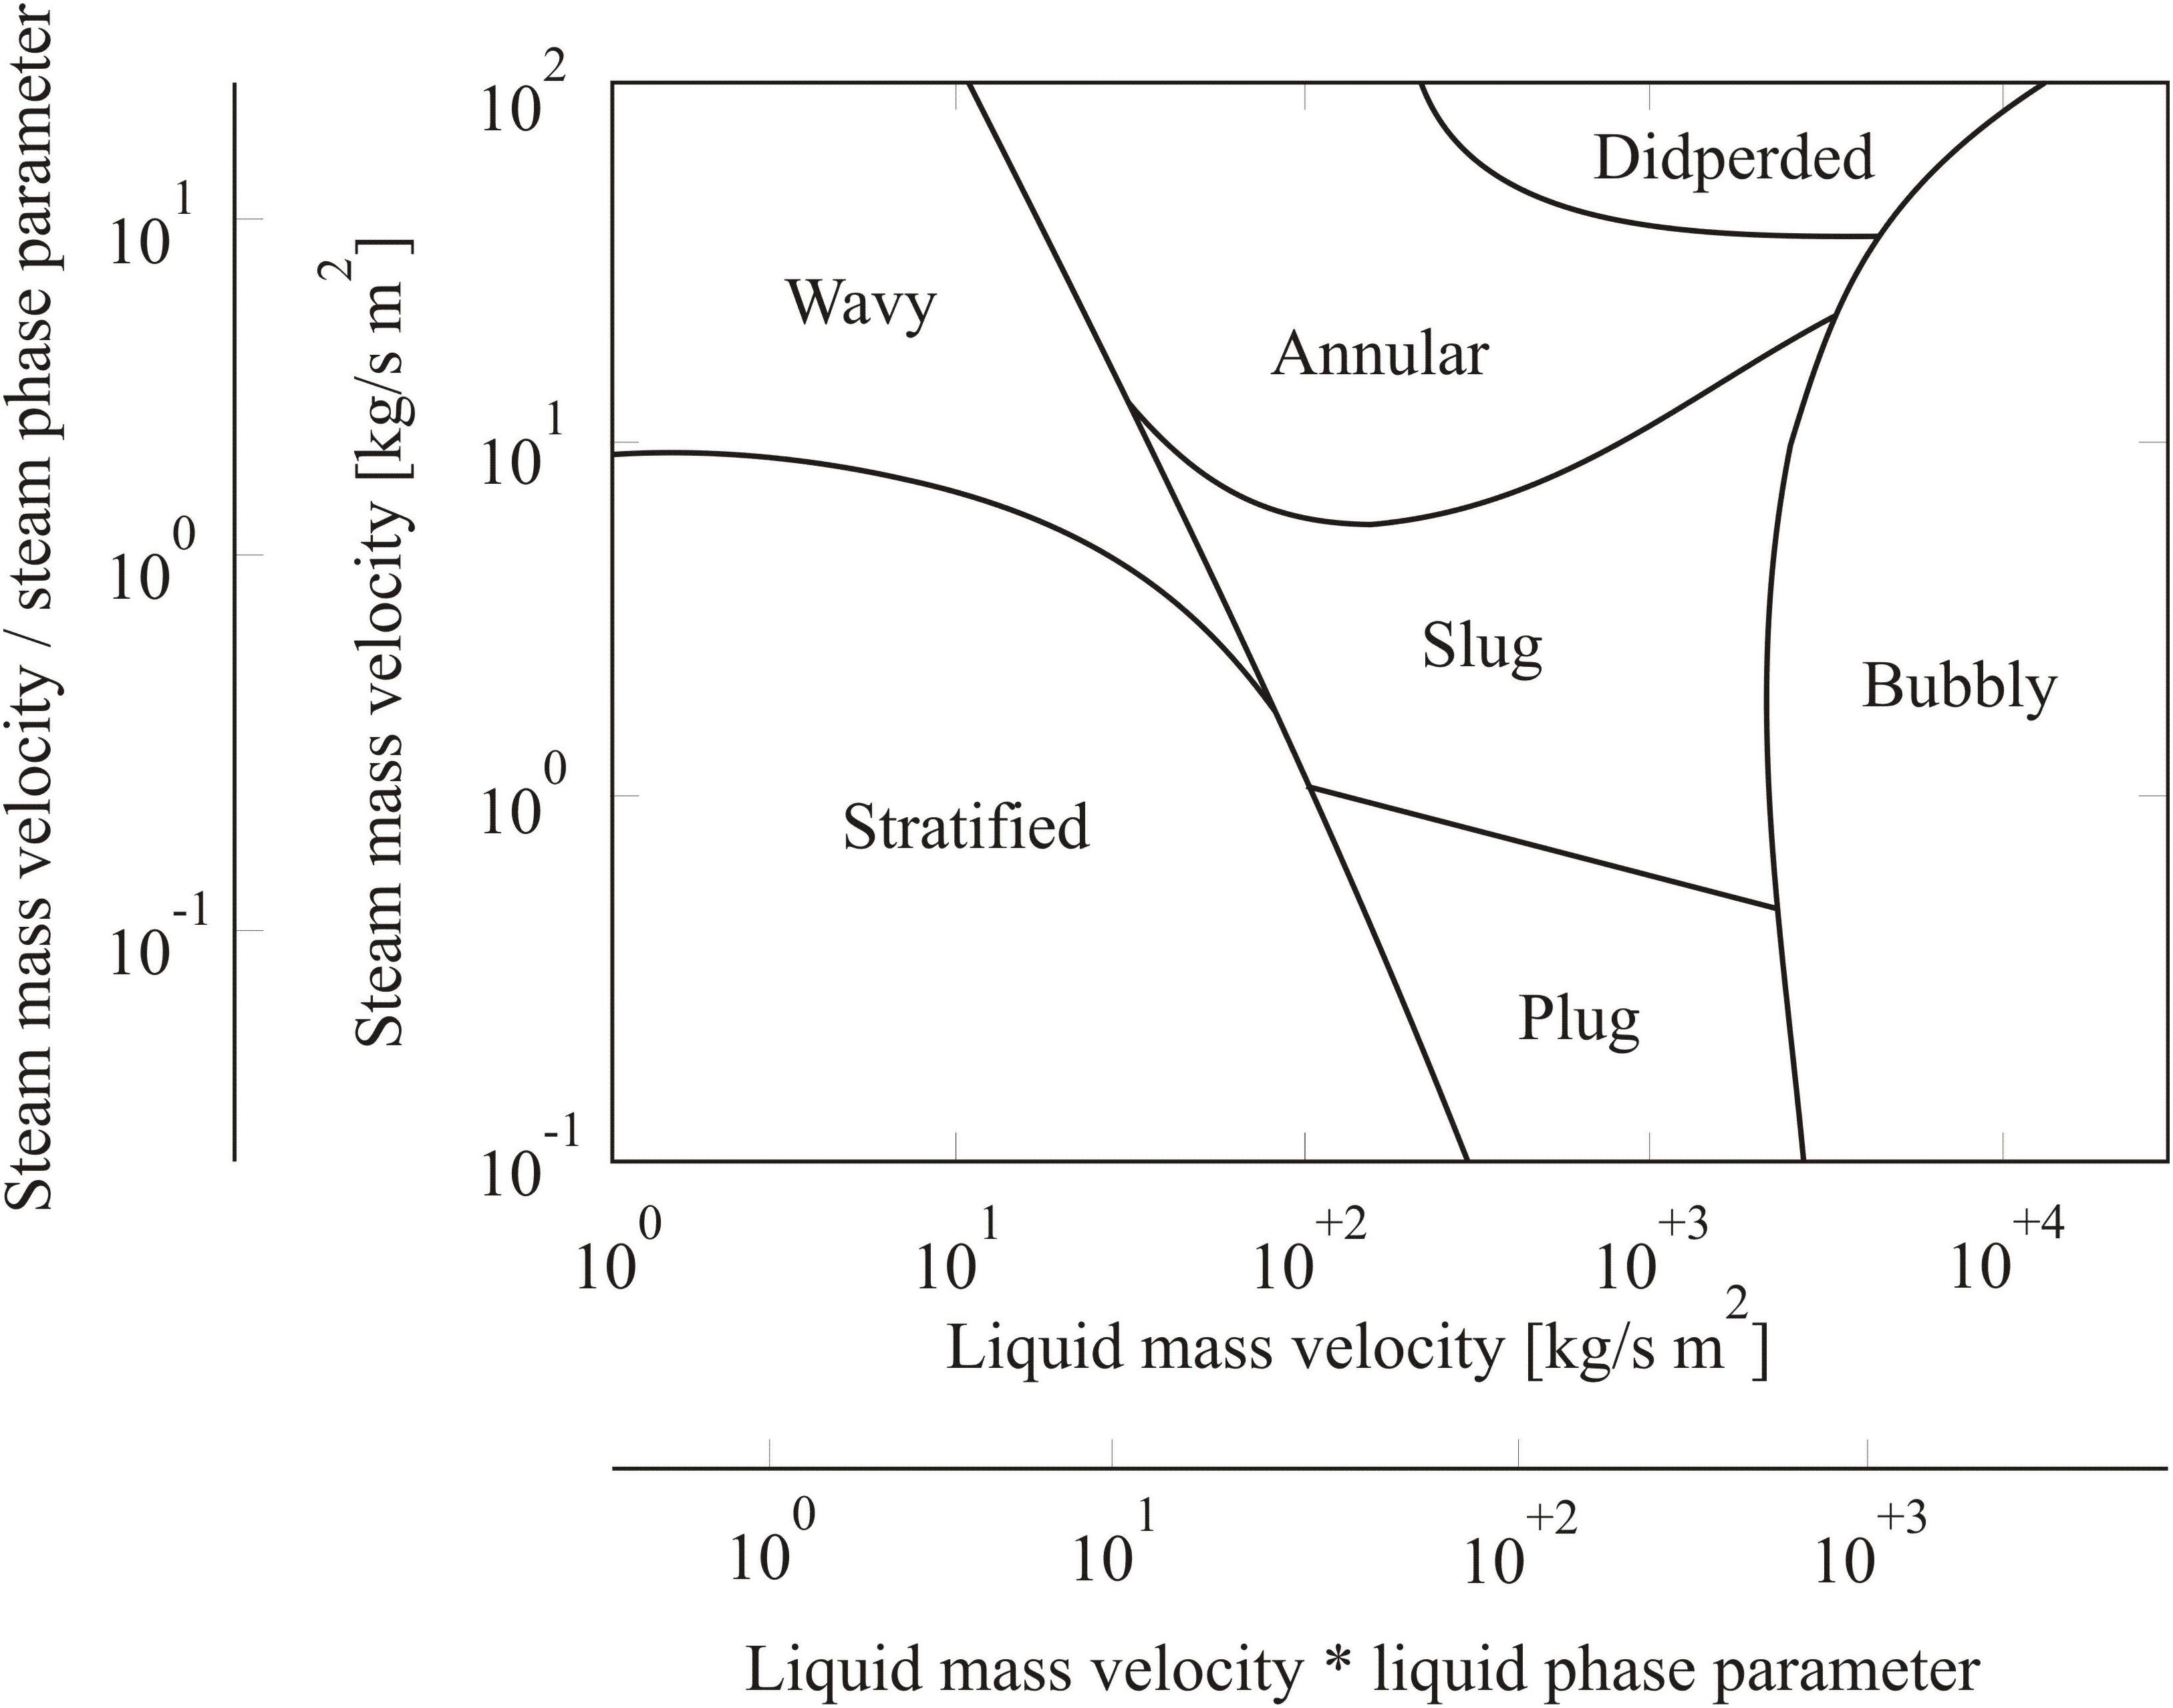
Figure 2. Flow map for the horizontal heated pipe by Taitel and Dukler (1976).
The intersection of mass velocities of the water and the steam on the Taitel’s map identifies the flow pattern that exists at these conditions, as shown in Figure 2. Although the flow maps can only give a rough guide on the flow regimes, they are of significance for predicting the flow regime inside the heated pipe.
Dynamic Instabilities Mechanisms
The two-phase flow instabilities can be classified as static and dynamic (Boure et al., 1973). The static instabilities were well defined and understood by a lot of studies and researches and they are a part of the standard boiler design. Here, the mechanisms of dynamic instabilities are explained using simple models.
Unlike static instabilities which involve leaving one unstable operating condition to a new stable one, the dynamic instabilities lead to periodic fluctuations around a semi-fixed operating point due to a feedback mechanism between competing impacts on the flow. In the case of dynamic instability, the flow parameters have sufficient interaction and delayed feedback between each other. The dynamic instabilities can result from the multiple feedbacks between mass flow, pressure-drop and density change variation in a boiling tube. The compressibility of the two-phase mixture provides the main motor of dynamic instabilities formation. The main types of the two-phase flow dynamic instabilities in evaporator tubes are DWOs, PDOs and thermal oscillations.
Mechanism of Density-Wave Oscillations
The DWO is one of the most important dynamic instabilities, which take place in the evaporator systems. Here, the fluid properties oscillate with relatively high frequencies. A simple model is adopted to understand the mechanism of DWOs. The model consists of a supply tank, an evaporator (investigated pipe) and two flow restrictions (Kakac and Bon, 2008). The mechanism of DWOs is explained with the aid of Figure 3. In this model, it is assumed that the pressure in the supply tank (p1) and the outlet pressure of the evaporator (pe) are kept constant. Furthermore, the steam generation is assumed to be constant in the test tube independent of mass flow. This means that the heater should maintain a constant steam production in case of mass flow variation.
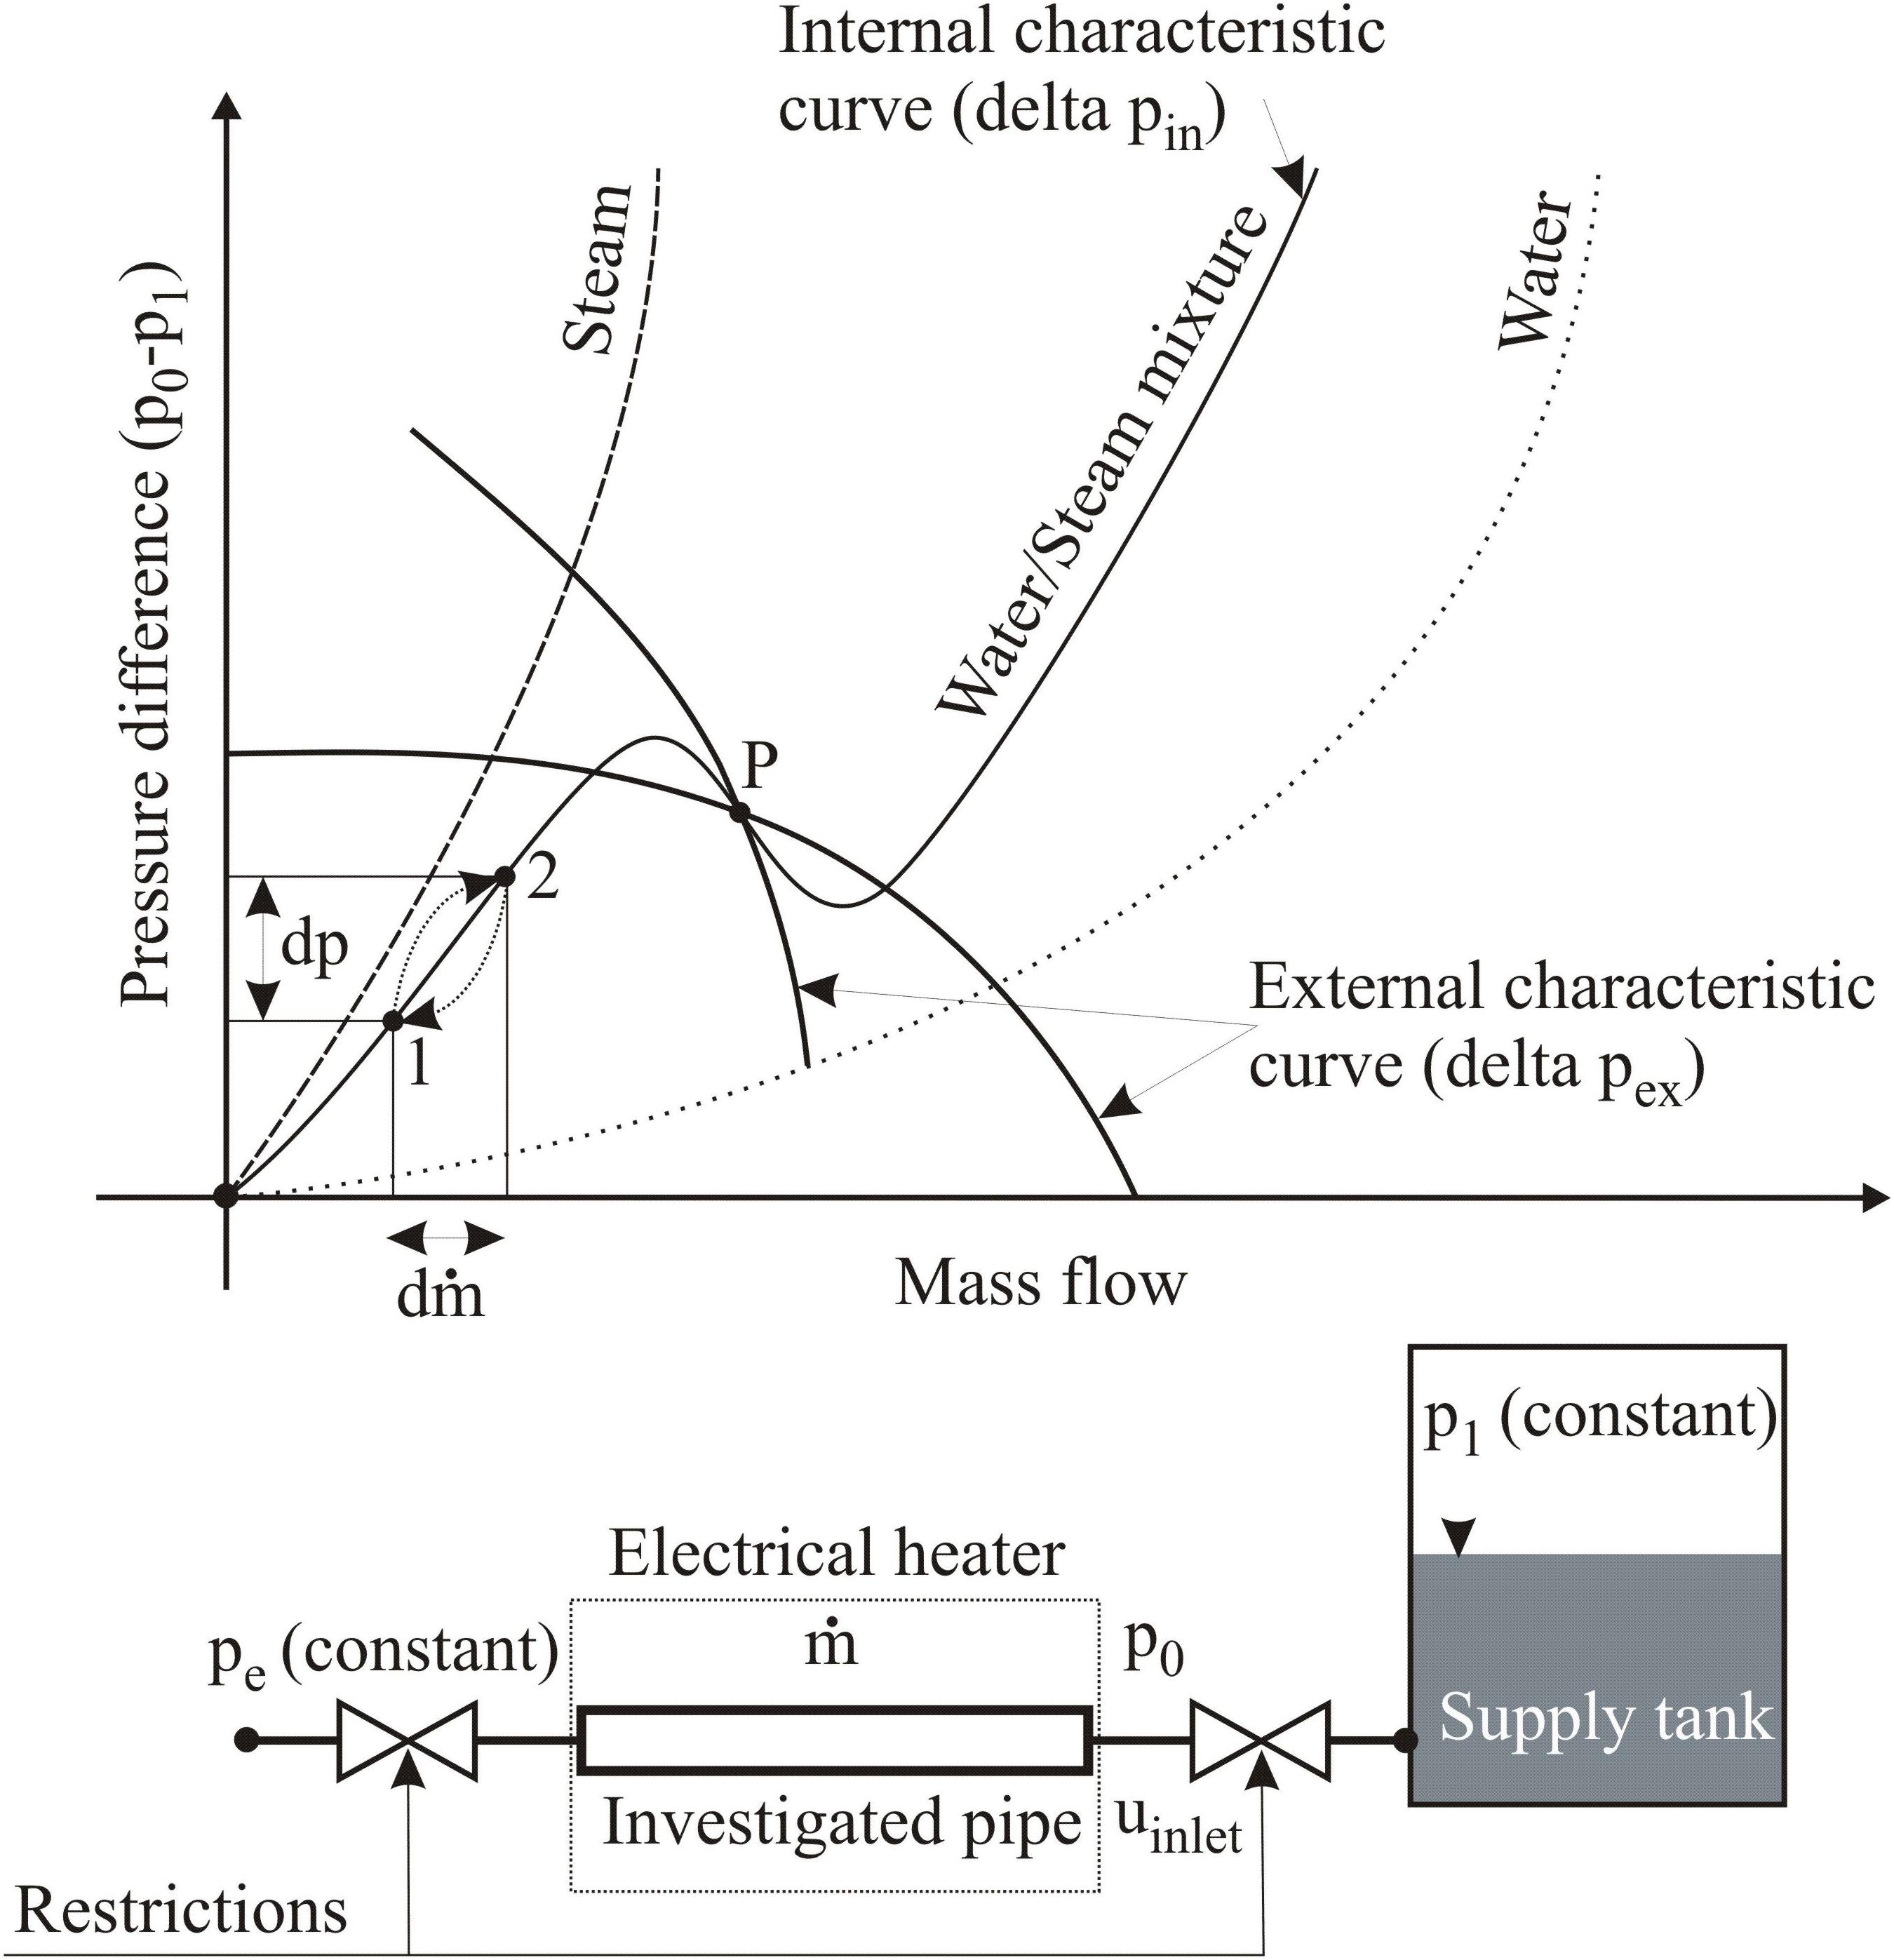
Figure 3. Density-wave oscillations.
As previously mentioned, mass flow or pressure disturbances can lead to two-phase flow instabilities. There are two key pressure characteristic curves are used in the analysis of the stability for the flow boiling systems. The curve of the demand pressure-drop vs. the mass flow, which called the internal pressure characteristic curve and the curve of supply pressure-drop vs. the mass flow, which called the external pressure characteristic curve. The intersection between these two curves determines the stability of a given operating point.
Suppose that the operation is on the positive slope portion of the internal characteristic curve (point 1). At a time (t = t0), if the pressure drop in the evaporator undergoes a sudden minor reduction from its nominal value with Δp = p0-pe then a drop in the inlet pressure (p0) will occur instantaneously since the exit pressure (pe) is constant. As a consequence, the mass flow in the evaporator and thus the inlet velocity (uin) increases according to the following equation:
As a result, a higher density fluid will flow at (t = t0) from the supply tank into the evaporator. However, an increase in the inlet velocity (mass flow) from point 1 to point 2 will cause an increase in the internal pressure-drop (see the internal characteristic curve in Figure 3). After the residence time (the time interval which is taken by a particle to cross from the inlet to the outlet of the evaporator), the increased internal pressure drop causes the inlet pressure (p0) to increase since the exit pressure (pe) is constant. According to the above equation, an increase in the inlet pressure (p0) leads to a decrease in pressure drop (p1-p0) and thus to a reduction in the inlet velocity (uin); since (p1) is constant. A reduction in the inlet velocity will result in mass flow reduction (from point 2 to point 1; see the internal characteristic curve in Figure 3). As results, less mass flow will enter the evaporator and thus the fluid has greater enthalpy as well as lower density when it reaches the outlet restriction. A lower inlet velocity causes a lesser pressure drop in the test tube (p0-pe) and this starts the cycle again and so on which causes density oscillations in the evaporator tubes.
Mechanism of Pressure-Drop Oscillations
The PDO can occur when the evaporator system has a compressible volume like a drum. Here, the fluid properties oscillate with lower frequencies compared to DWO. The same model is employed to understand the mechanism of PWOs but after adding a surge tank (as compressible volume) (Kakac and Bon, 2008) as shown in Figure 4. The surge tank is located upstream of the evaporator (investigated pipe). In this model, it is assumed that the pressure in the supply tank (p1) and the pressure at the outlet of the evaporator (pe) are constant and the steam generation is constant in the test tube independent of mass flow, i.e., the heater should maintain a constant steam generation in case of mass flow variation.
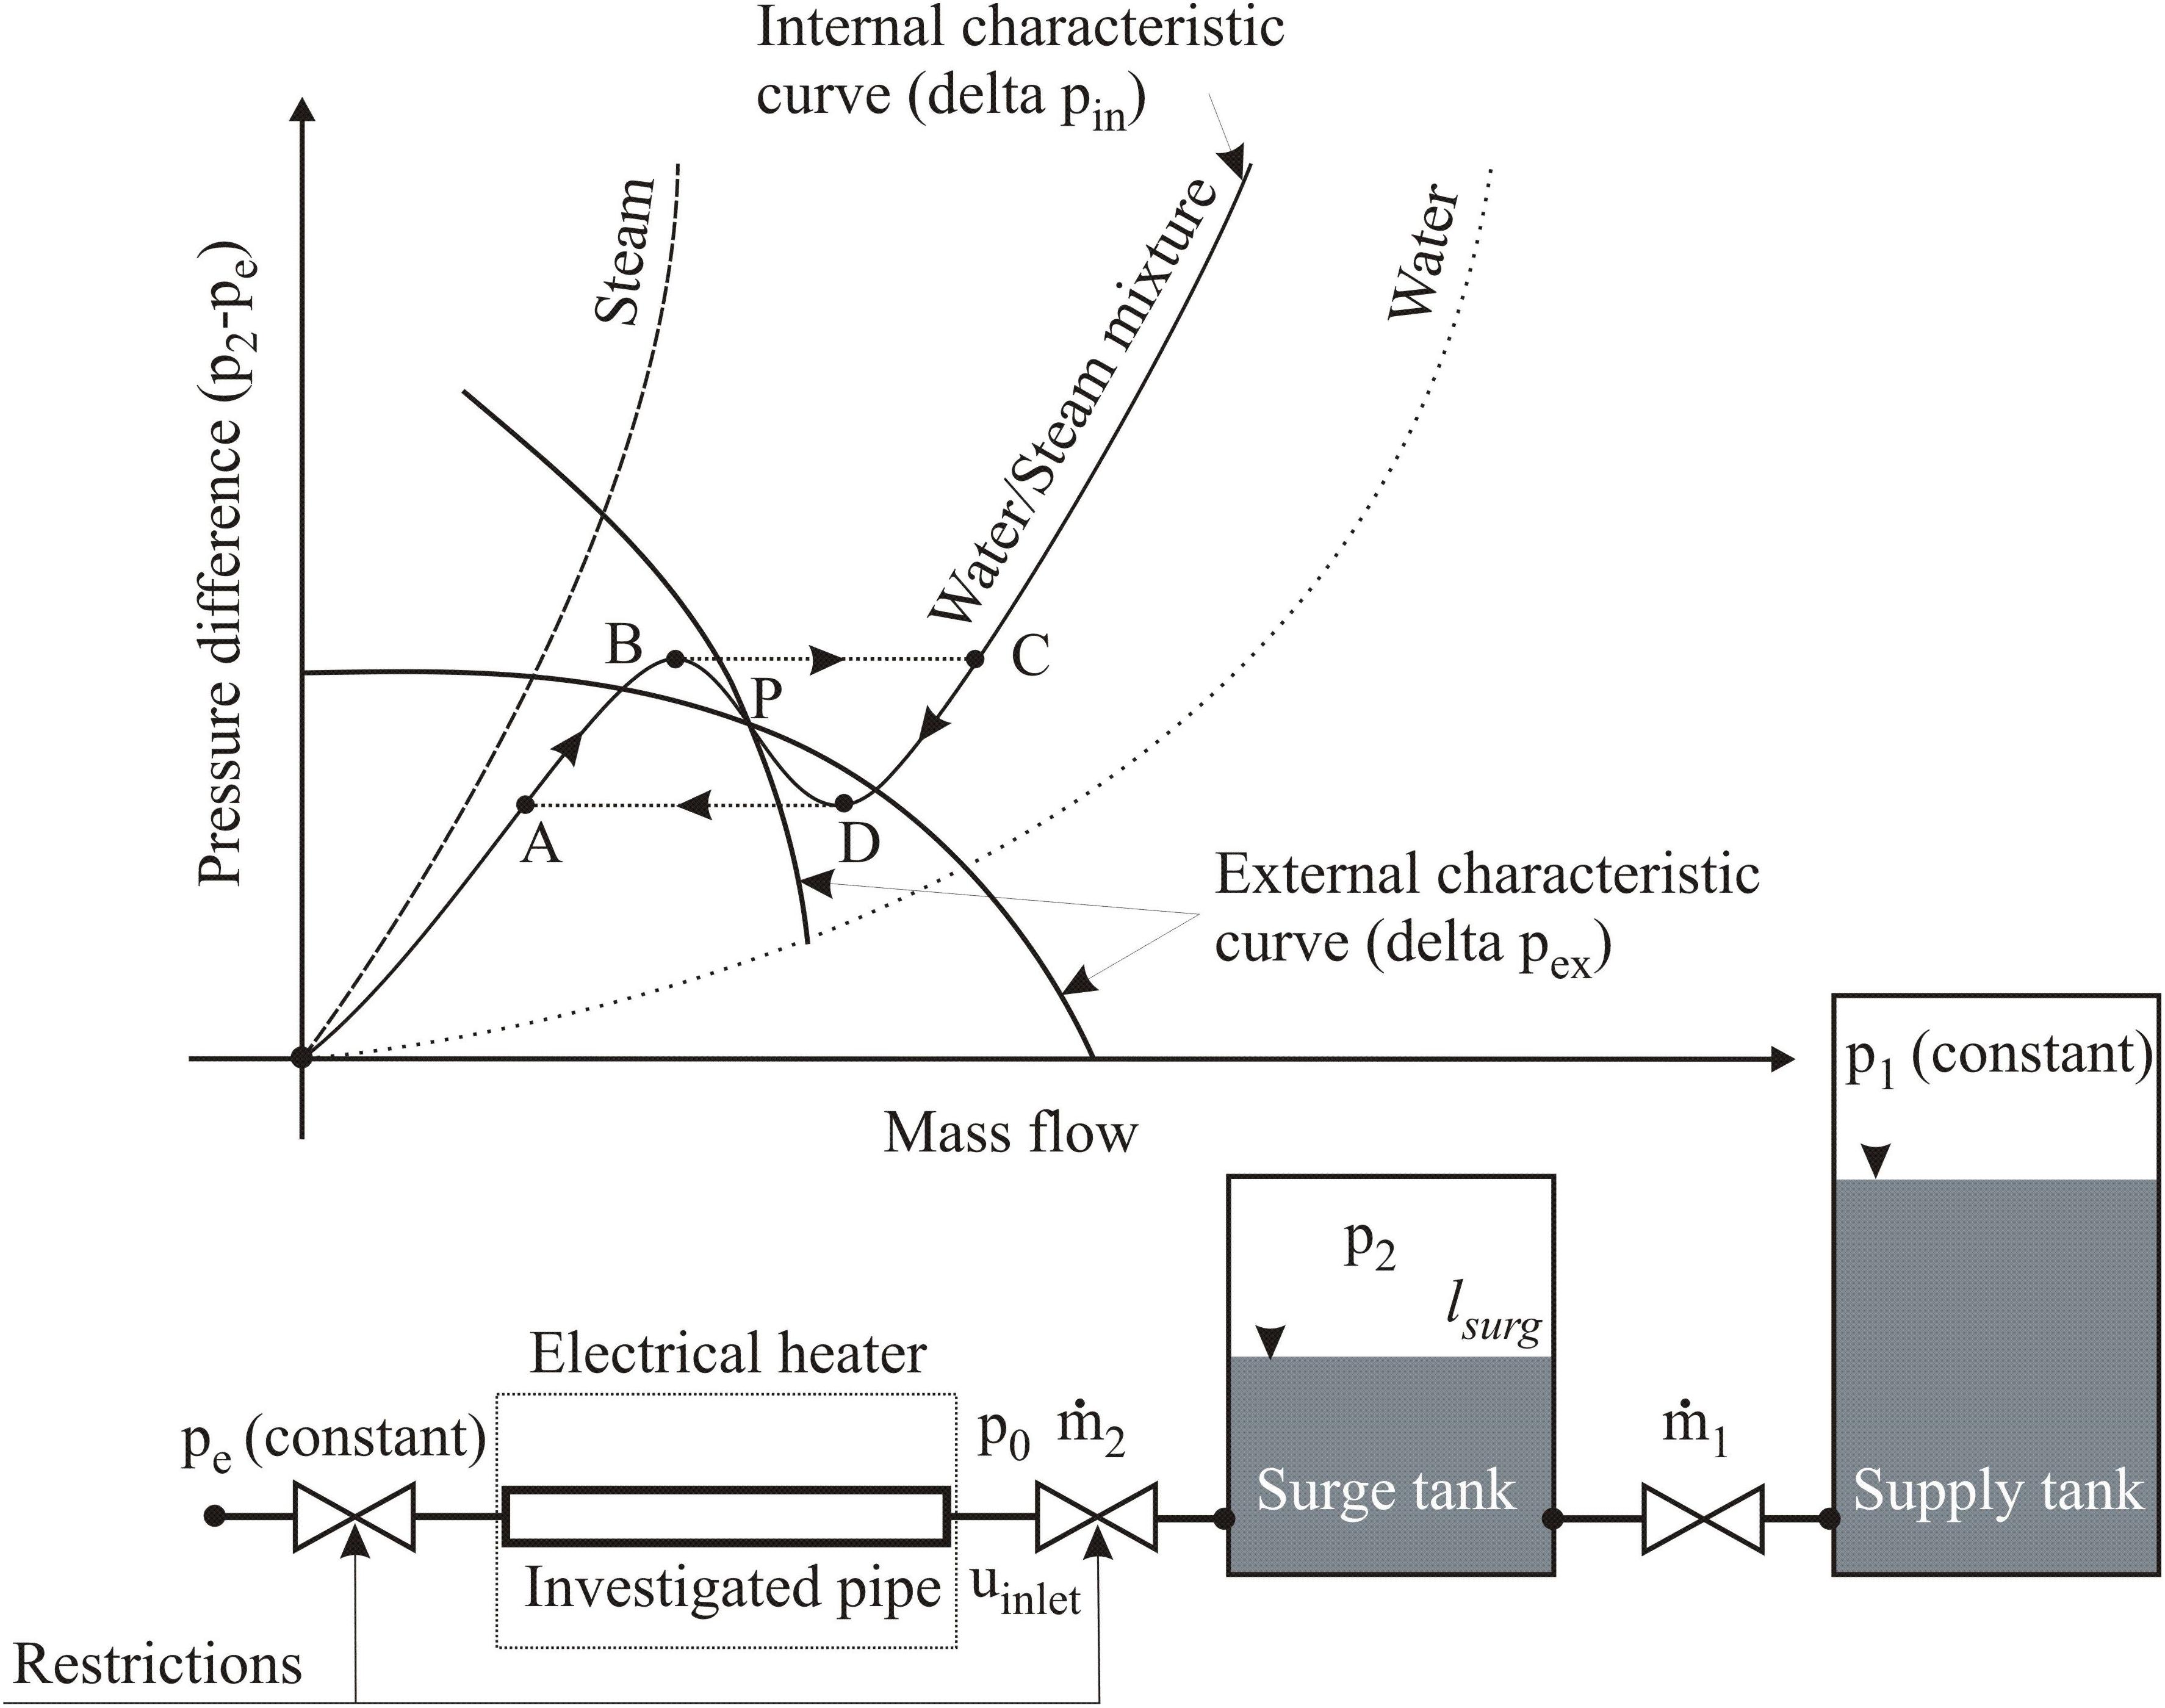
Figure 4. Pressure-drop oscillations.
The mechanism of PDOs can be explained using Figure 4. Suppose that at a time (t = t0), the operation is on the negative slope portion of the internal characteristic curve (point A). The slight decrease in the surge tank pressure triggers the mass flow to enter the surge tank more than leaves it, note that p1 and pe are constant. Due to the accumulation of fluid in the surge tank, the pressure of the surge tank (p2) will increase. As a sequence of this, the equilibrium point moves up until it reaches the peak (point B). Here, any higher pressure can only be obtained by a higher mass flow as given by internal characteristic curve (point C). At point C, the amount of mass flow that leaves the surge tank (ṁ2) is more than the amount of mass flow that enters the surge tank (ṁ1). Due to the mass flow imbalance, the level in the surge tank will be decreased. This means that the surge tank pressure (p2) will also reduce till reaches the operating point D. At point D (the lowest point of the internal characteristic curve), lower pressure can only be sustained if the mass flow decreases again to the operation point A. At point A, the mass flow leaving the surge tank (ṁ2) is less than the mass flow that enters it (ṁ1). Hence, the pressure inside the surge tank (p2) increases and causes a shift to operating point B. This starts cycling (ABCDA) again and so on which causes pressure oscillations in the evaporator tubes.
Thermal Oscillations
Thermal oscillations are a consequence of the mass flow oscillations occurred in the evaporator tubes by the reason of previously explained density-wave and pressure-drop oscillations. The evaporator inlet fluid temperature and the heat input are usually constant at the steady-state operation of the power plant. The mass flow rate variations occur in the evaporator tubes can lead to a variable thermal response of the heated wall due to the variable heat transfer coefficient. These variations cause different wall overheating in the tube due to inadequate cooling of the tube wall and that can get coupled with the DWO. This overheating of the tube walls leads to thermal failure, which usually manifests itself in the form of burnout of the wall.
The appearance of these thermal oscillations is highly undesirable specifically at the high temperatures of the HRSGs. This oscillations not only can degrade system performance but it can also lead to early fatigue and control problems that can become devastating.
Characterization of the Developed Test Rig
Modern HRSGs usually consist of three pressure levels (low-, medium- and high-pressure levels). This series of pressure levels is required to minimize the area between the flue gas and steam temperatures. Thus, the exhaust enthalpy can be used for more efficient steam generation. Each level consists of an economizer, evaporator and super-heater. As already mentioned in the introduction, the main focus of this experimental stand is on the vertical HRSGs with horizontal pipes. The heated test pipe of our test rig is a geometrically reduced version of a single low-pressure evaporator pipe of a vertical HRSG, as it will be explained in details later in this paper.
As a sequence of the design process, basic and schematic concepts for the start-up process of a natural circulation in which the desired flow direction can be specified are involved. Based on these variants, a detailed design had been created in which the arrangement of valves, vessels, pressure gauges, etc. was taken into account in the form of a P&ID circuit diagram as shown in Figure 5.
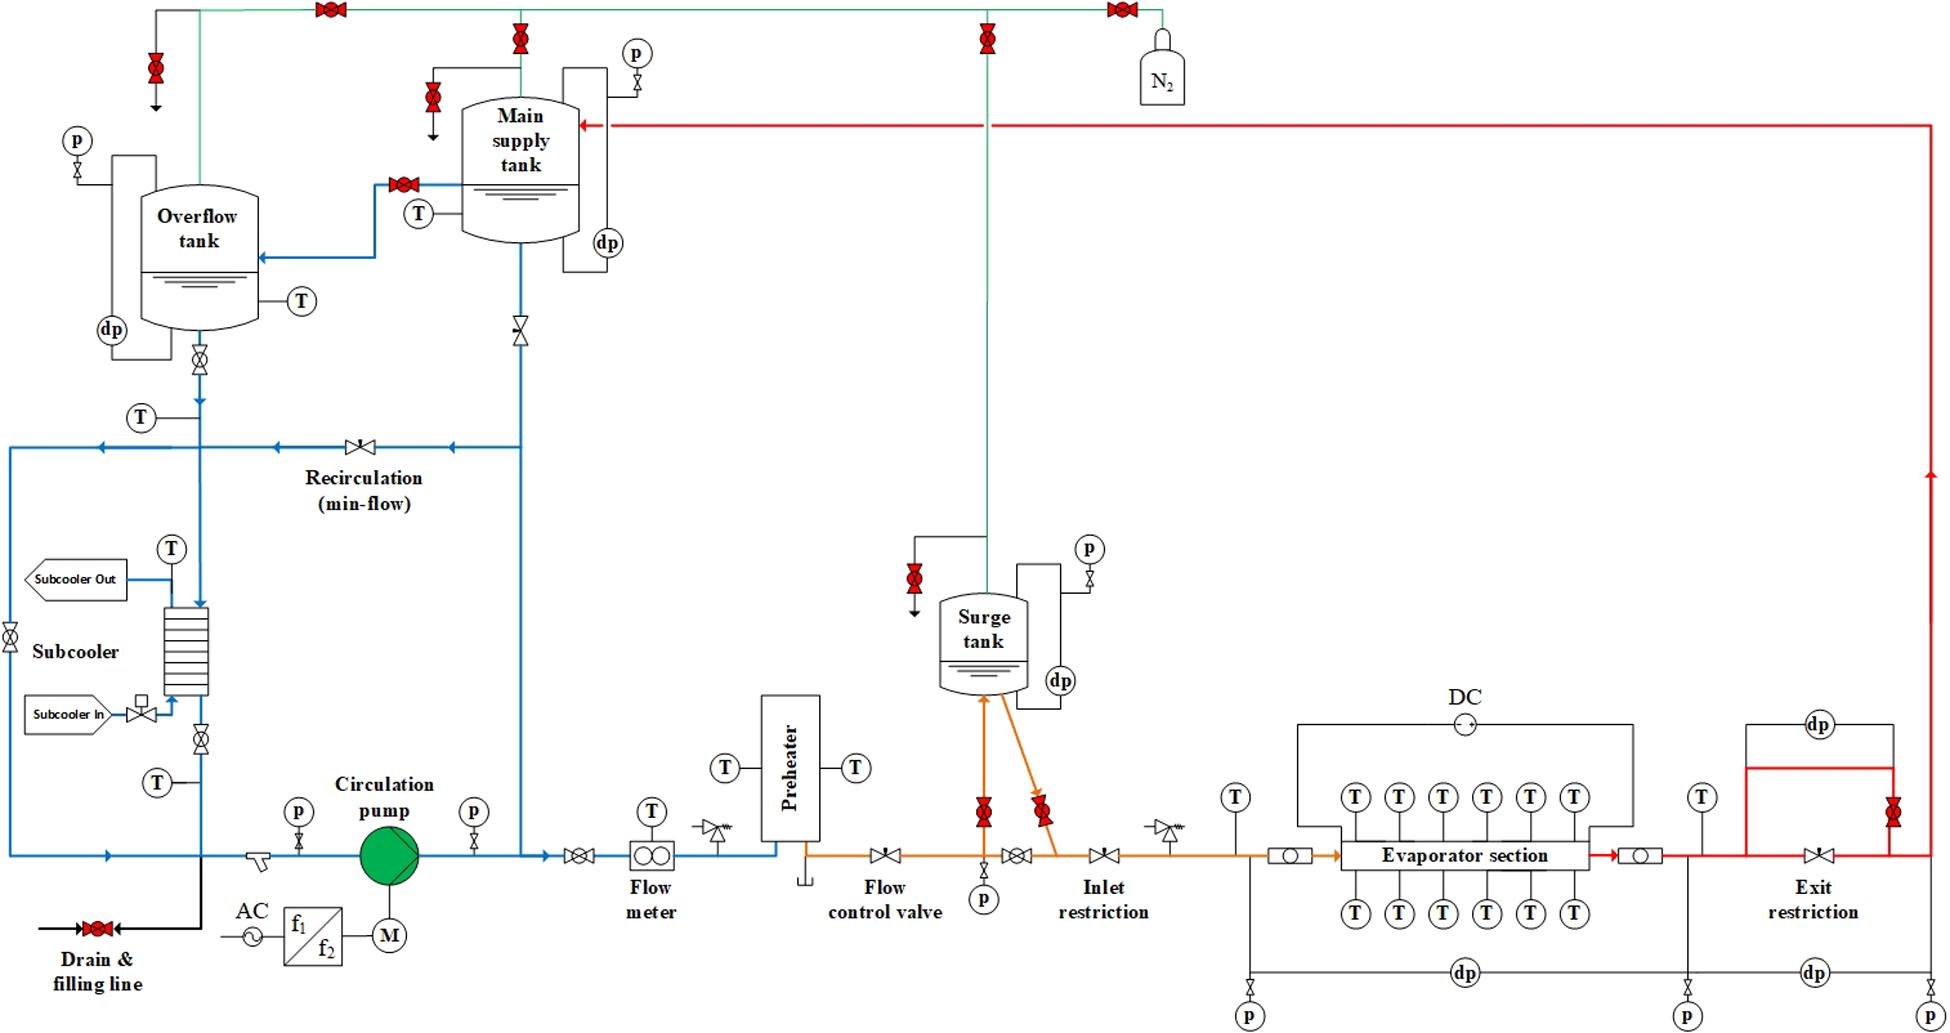
Figure 5. P&ID of the developed test rig.
Finally, from the information provided by the P & ID as well as the data to be taken from the similarity scaling and the standards, a visualization of the test rig was created in the CAD program NX10.0 as shown in Figure 6.
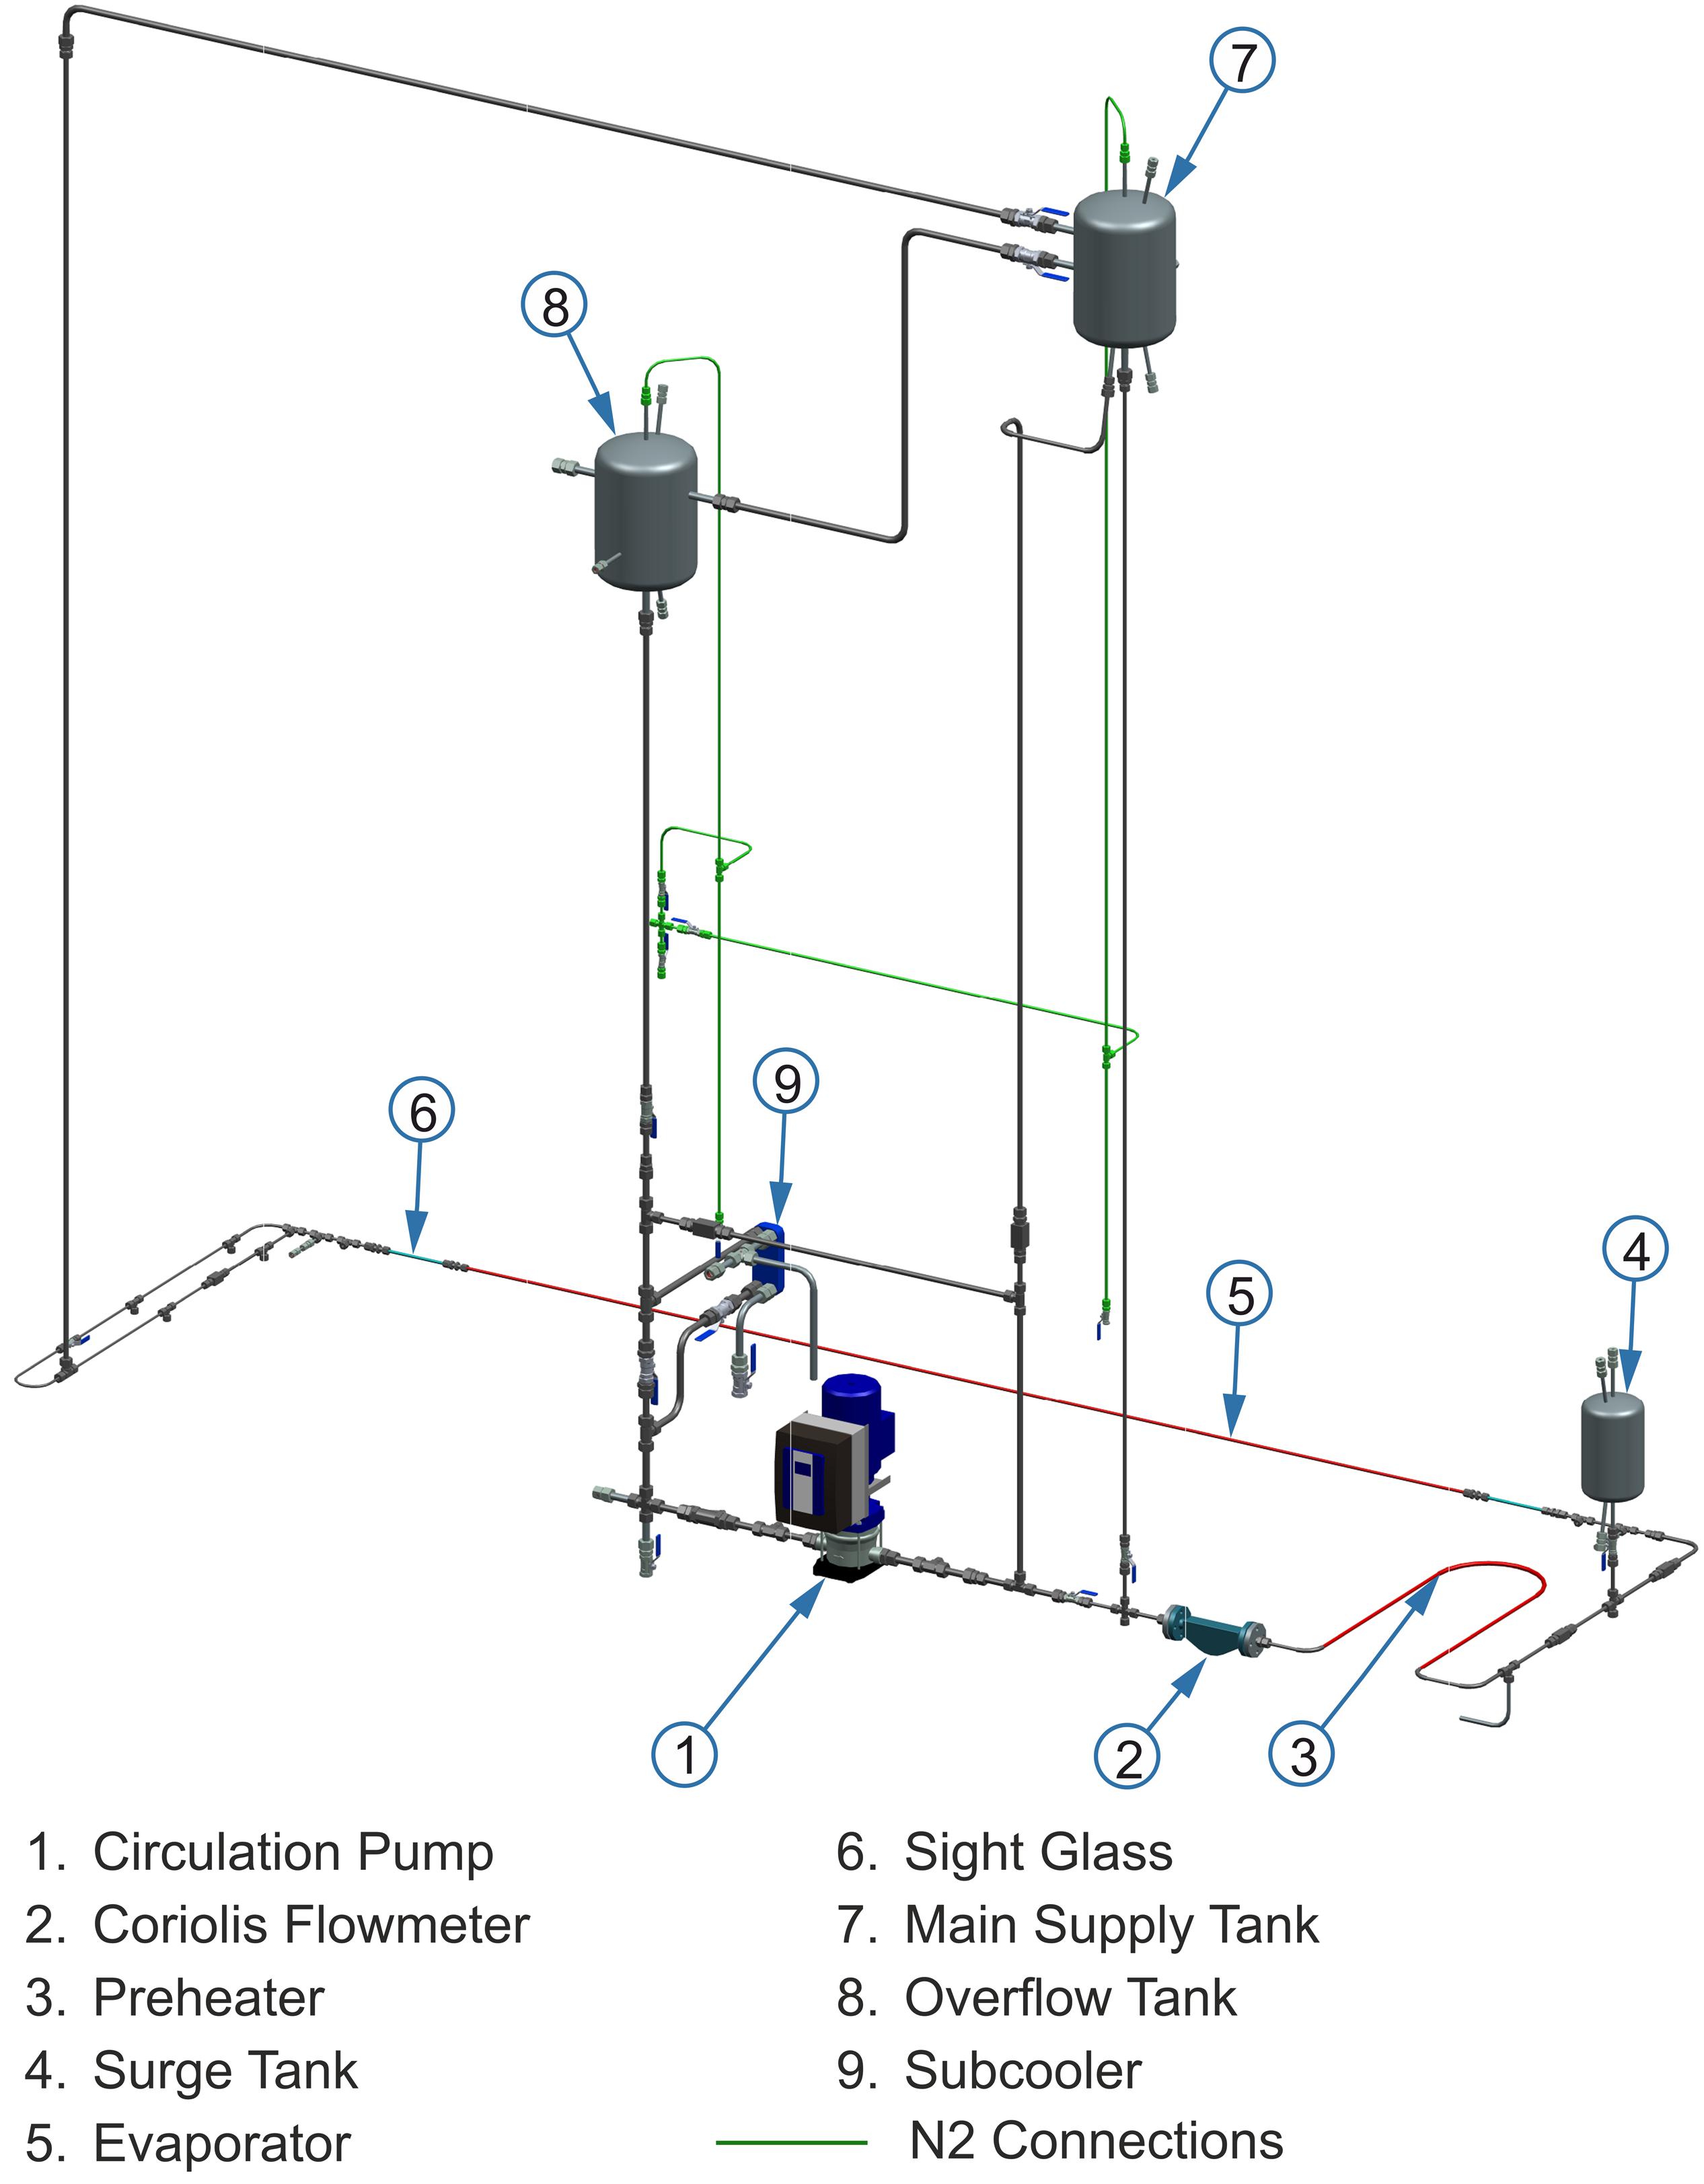
Figure 6. CAD model of the developed test rig.
Since the heated test pipe was made of AISI 316 stainless steel and has electrical resistance, direct current can be applied directly to the pipe and generate heat, which can determine the heat supply via the current and the voltage. Teflon connections were used at both ends of the evaporator pipe for electric insulation. For the heat to be transferred into the fluid, the heated test pipe was adiabatically insulated. In conclusion, the evaporator pipe gives off hardly any heat to the environment and the heat input into the working medium was almost identical to the electrical power.
To reduce the heat losses from the test rig to the environment, the pipelines, as well as the main supply tank (MST) and overflow tank (OFT), were insulated so that the heat required to reach the steady-state operation remained low.
The pressure at the inlet is adjusted by nitrogen, which is connected via pipes to the different water tanks. A flowmeter is mounted in front of the preheater and measures the mass flow that enters the evaporator tube. Besides, the mass flow at the entry of the evaporator pipe is regulated by the inlet restriction (in the form of a needle valve). There is a sight glass at the outlet of the evaporator pipe to observe the existing flow pattern and record it using a high-resolution camera.
The pressure drop in the preheater pipe can be varied via an exit restriction (needle valve). A needle valve is mounted at the outlet of the heated test tube, whereby it is possible to adjust the flow resistance and thus to analyze the resulting pressure drop. Also, the needle valve can be completely closed, allowing the pressure drop to be examined over a parallel line.
A nitrogen bottle is used to set the absolute pressure in the system as well as in the compressible volume. Thus, all containers can be filled independently. To prevent critical pressures in the system, two safety valves were connected in series with the preheater and the evaporator tube. The valves open at a pressure of 10 bar and there is no way to decouple them from the respective heated test tube.
As previously mentioned, PDOs only occur in systems with a sufficiently large compressible volume. The compressible volume is a physical material quantity that describes which direction independent pressure load is necessary to produce a given volume change. It is calculated from the volume, as well as the difference between an infinitesimal pressure change and an infinitesimal volume change. The compressible volume can be connected to or disconnected from the circuit by a ball valve. This depends on whether PDOs or DWOs are to be investigated.
The instruments of the test rig are controlled and monitored with the LabVIEW program. This program was established as a standard in the engineering and natural sciences, especially in the areas of measurement, control technology, simulation, and data acquisition, analysis and visualization. Another reason for choosing this program lies in the simplified programmability in contrast to conventional text-based programming languages. The principle is based on prefabricated and partially combinable graphic blocks, each having specific source code. Thus, complex programs can be created in a clear block diagram. Besides, it is possible to create a Graphical User Interface (GUI) via a selection of different elements.
Design of Evaporator Pipe
To provide hydraulic consistency of the flow behavior of different systems, the similarity criteria are introduced. As a reference for the test rig constructed in our work, the HRSG from Doosan Heavy Industries and Construction in Table 1 has been used.
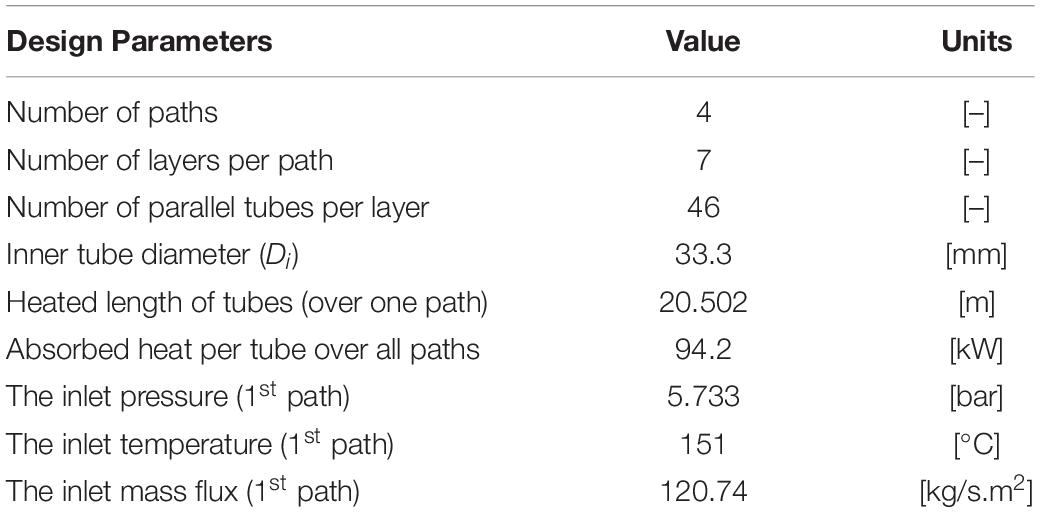
Table 1. Data of the reference HRSG (provided to TU Darmstadt by Doosan).
By the similarity criteria, it was possible to design the heated test pipe with reduced dimensions, but with thermohydraulic similar behavior to the original large-scale evaporator. Similarity criteria have been obtained from conservation equations, boundary conditions, and geometry of a system, as described in detail in Ishii (1971). For two-phase flow, the similarity criteria have been derived from perturbation analysis based on the one- dimensional drift-flux model. The system was calculated by using the dimensionless characteristic numbers, a dynamic, kinematic, and energetic scaling.
To achieve a geometric similarity of different arrangements, the ratio of the inner diameter to the length of the pipe (), for both pipes, must be equal.
We made the scaling of the subcooling over the evaporation temperature using the subcooling number (Nsub) which represents the ratio of sensible and latent heat. This is one of the fundamental parameters to be considered in the stability analysis.
where hf, hi and hfg are the specific enthalpy of liquid, the specific enthalpy of the fluid at the inlet of the test pipe and the specific enthalpy of vaporization, respectively. ρf and ρg are the density of the liquid and the vapor, respectively.
To achieve identical flow conditions and a similar turbulence behavior in both arrangements, the Reynolds number (Rei) at the inlet of the evaporator was calculated. An identical flow pattern is guaranteed by achieving the same Reynolds number in both evaporator pipes.
where ρ is the density of the fluid, u is the flow velocity and μ is the dynamic viscosity of the fluid.
The last relevant number is the phase change number (Npch). The phase change number (Npch) describes the phase change of the working fluid due to the heat input. It gives significant hints in the description of the equilibrium points, as well as in the stability limits.
where Q is the rate of heat transfer, G is the mass flux and Ai is the inner cross-section area of the pipe.
Based on the data provided in Table 1, the similarity and scaling criteria were performed. In the calculation of these dimensionless numbers, we assumed that the capillary forces are negligible. Furthermore, it was assumed that the flow is incompressible and therefore the dissipation forces were not considered in the energy conservation equation (Ishii, 1971). Besides, the influence of the friction heat is significantly small in comparison with the supplied heat.
Based on the values of the dimensionless numbers shown in Table 2, the design of the test rig was carried out. The range of experimental parameters (pressure, temperature, heating power and mass flux) of the test rig are shown in Table 3. Furthermore, it is possible to change the inside diameter of the evaporator pipe from 5 to 8 mm. Also, the length of the heated pipe in the test pipe is variable, so you can either install a 2 or 3 m long pipe as needed.
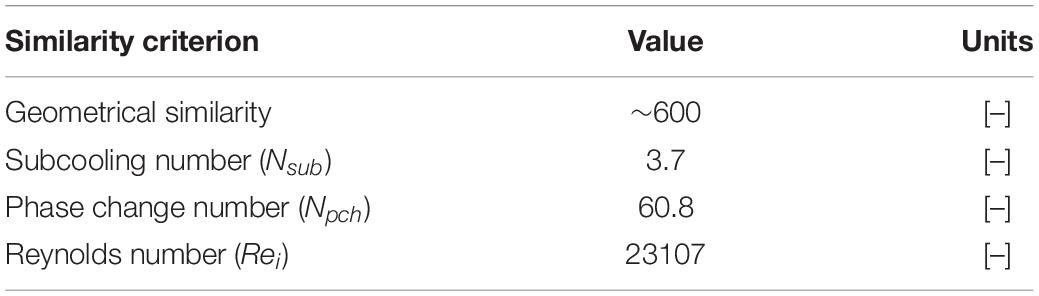
Table 2. The values of the dimensionless numbers.
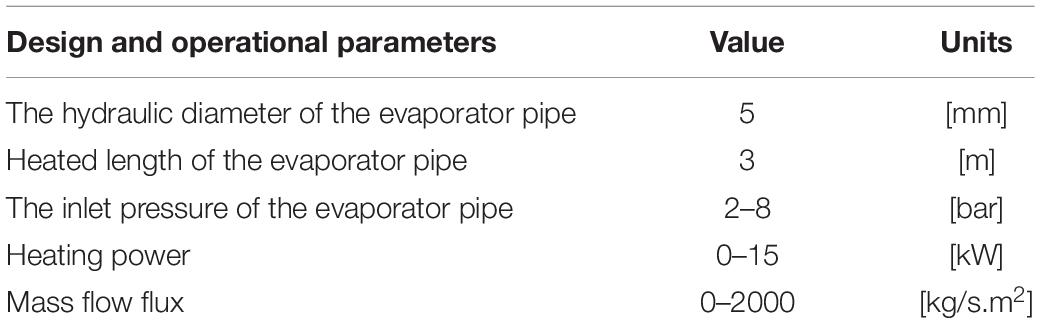
Table 3. Characteristics of the developed test rig.
The Orientation of the Heated Test Pipe
Intending to further increase in the versatility of the system, there is a pipe fitting just before the test pipe. This fitting makes it possible by a small effort to convert the evaporator pipe from the horizontal to a vertical orientation and vice versa. This offers the advantage that both horizontal HRSGs with vertical evaporator tubes and vertical HRSGs with horizontal evaporator tubes can be examined.
Modes of Operation
For using our test rig for a wide range of possible experiments with different external characteristics, it offers the possibility to vary between the natural circulation and the forced circulation, as a drive for circulating the water in the test loop. Thus, from the results of measurements obtained later, a balance can be mentioned between the influence of natural circulation and forced circulation on the dynamic instabilities of the two-phase flow.
Forced Circulation
In the forced circulation mode, the pump is permanently operated to circulation and specifies the flow direction and the mass flow of the entire system. During the selection of the pump, we could not choose the typically used gear pump due to the high temperature of the test fluid (water) of about 170°C. Because in case of choosing the gear pump, it must be lubricated by the pumped medium but the viscosity of water is too low at these high temperatures. Even though the extra cooling would increase the viscosity of the water, but the fluid would need to be re-heated to a required subcooling temperature before entering the test section. In our design, we choose a centrifugal pump that can circulate the water at higher temperatures. To avoid the cavitation in the centrifugal pump, the temperature of the circulated water is reduced using the subcooler before the circulation pump. However, the water temperature shouldn’t drop too much before the pump because it must be heated again in the preheater to the desired subcooling temperature at the evaporator pipe. The control of the cooling capacity of the subcooler depends on the amount of tap water flowed through it. The tap water is controlled by a control valve at the inlet, together with the temperature measurements. The control is intended to prevent the evaporation of tap water in the subcooler to prevent the reduction of the cooling capacity of the subcooler. Besides, the pump has a self-cooling frequency inverter that enables continuously variable speed control that can be used to control the external characteristics of the system.
Natural Circulation
The second mode to operate the test rig is the natural circulation mode. Our test rig is mainly constructed for the investigation of flow instabilities in vertical HRSG, which are driven by natural circulation. In general, flow instabilities occur more frequently in natural circulation steam cycles, since the available driving force is lower than the driving force generated by the pump during the forced circulation. For this reason, the physical mechanism of natural circulation is described in detail. The test rig consists mainly of the main supply tank (MST), a downcomer and riser as shown in Figure 6. The MST acts as a drum in the natural circulation loop.
In the case of a vertical heated pipe, the density difference between the water-steam mixture in the riser and the water in the downcomer is sufficient to maintain constant mass flow by the aid of the gravity, which requires no pump. It is problematic when it comes to a vertical HRSG with horizontal tubes because the resulting water-steam mixture has no guaranteed flow direction due to a lack of gravity influence. Since the heated pipe in our test rig is arranged in the horizontal orientation, the steam has no preferred axial flow direction. The starting of the water circulation is often a problem because of the horizontal orientation of the heated pipe. In the following, two different concepts are introduced in our test rig to solve this problem. We can start our experiments in the natural circulation mode of operation in two ways. The positive side effect of our design is a stabilization of the overall system by the pressure generated using the nitrogen. We can use this nitrogen to generate pressure in the main supply tank as the first concept. Furthermore, the start-up process with the pump is also represented in the system since the pump is also connected in natural circulation mode to supply the MST with feed water before starting the experiment. Also, the pump can be used at the beginning of the evaporation process, this can give the fluid a flow direction as the second concept.
Instrumentation
The test rig is equipped with 9 pressure sensors and 6 pressure difference sensors that measure tank levels, pressure drops, and mass flow oscillations. It is also equipped with 22 thermocouples that measure the temperature of the water inside the tanks, the temperature distribution on the heated pipe (evaporator) and the temperatures of the water upstream and downstream the subcooler, the circulating pump, the preheater and the heated tube and for mass flow measurement, a Coriolis flowmeter is installed before the preheater. It also measures the density and temperature of the water. Other variables such as volume flow can be calculated by using these parameters.
All data such as the mass flow, the pressure drop across the test pipe and the temperatures are recorded during each experiment using measuring modules from National Instruments (NI 9208, NI 9211, and NI 9213).
Results and Discussion
The existing flow pattern for the water on the sight glass at the outlet of the evaporator pipe under the forced circulation operating condition was observed and recorded using a high-resolution camera as shown in Figure 7. These captures shown in Figure 7 were taken at the outlet of the evaporator for the water enters the evaporator pipe with constant inlet pressure (pin) and constant inlet temperature (Tin) equal to 4 bar and 92°C, respectively, with a uniform heating power of 6 kW and various mass flow rates. The pressure and temperature values listed under each capture in Figure 7 represent the conditions of water leaving the evaporator pipe. The flow pattern appeared in Figure 7A to be bubbly flow at the mass flow rate (ṁ = 85 kg/h) and transformed to plug flow in Figure 7B at mass flow rate (ṁ = 75 kg/h). During decreasing the mass flow rate from (ṁ = 65 kg/h) to (ṁ = 15 kg/h) at the same inlet and heating conditions, the flow pattern converted from churn flow as shown in Figures 7C,D to annular flow as shown in Figures 7E–H.
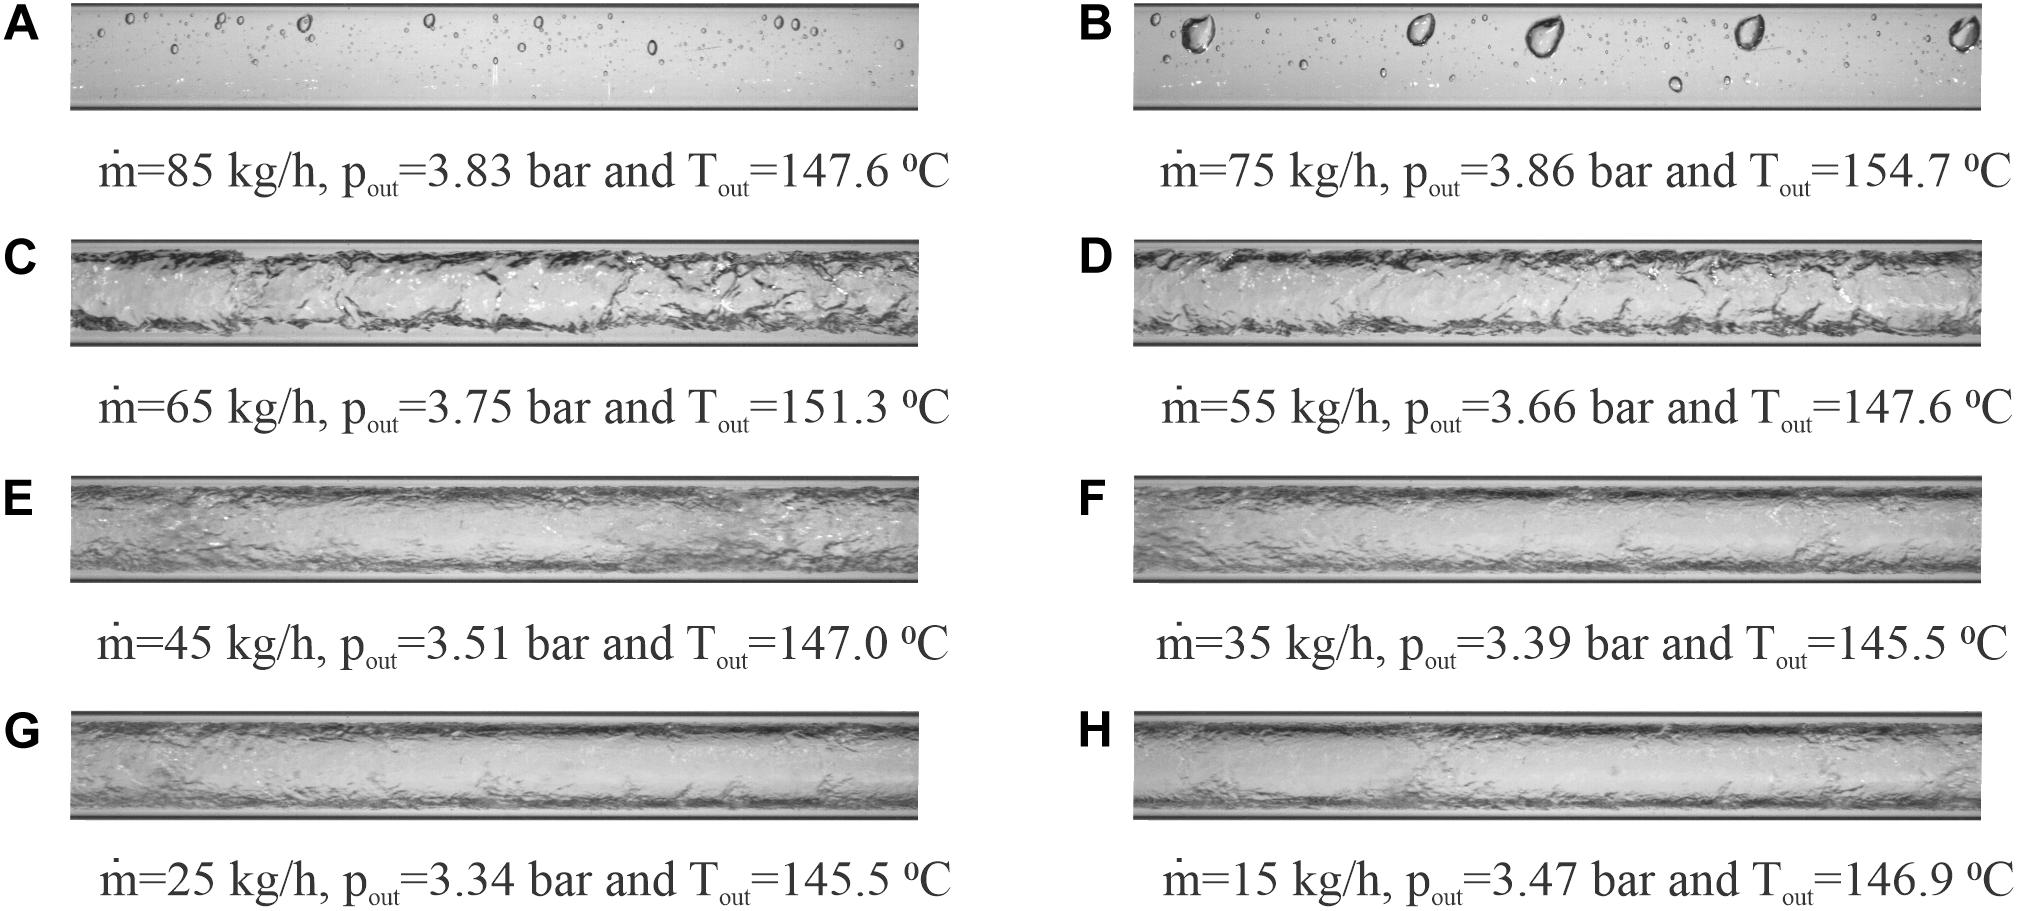
Figure 7. Flow pattern for water leaving the evaporator pipe with various mass flow rates (ṁ): (A) ṁ = 85 kg/s, (B) ṁ = 75 kg/s, (C) ṁ = 65 kg/s, (D) ṁ = 55 kg/s, (E) ṁ = 45 kg/s, (F) ṁ = 35 kg/s, (G) ṁ = 25 kg/s, and (H) ṁ = 15 kg/s.
To investigate the dynamic instabilities of two-phase flow in boiling systems such as the low pressure or high-pressure evaporators, the internal characteristic curves of these evaporators should be obtained. The reason for selecting the low-pressure evaporator (p ≤ 10 bar) is that in the high-pressure evaporators the high pressures lead accordingly to damp the oscillations. Therefore, the flow instabilities in the low-pressure evaporators represent here the worst case and thus are analyzed. At the previous operating inlet conditions (pin = 3.95 bar, Tin = 92°C and Q̇ = 6 kW) in captures shown in Figure 7, the internal characteristic curve of our evaporator pipe was obtained. The measured pressure drop (Δp) in [mbar] was plotted vs. the mass flow (ṁ) in [kg/h], as shown in Figure 8.
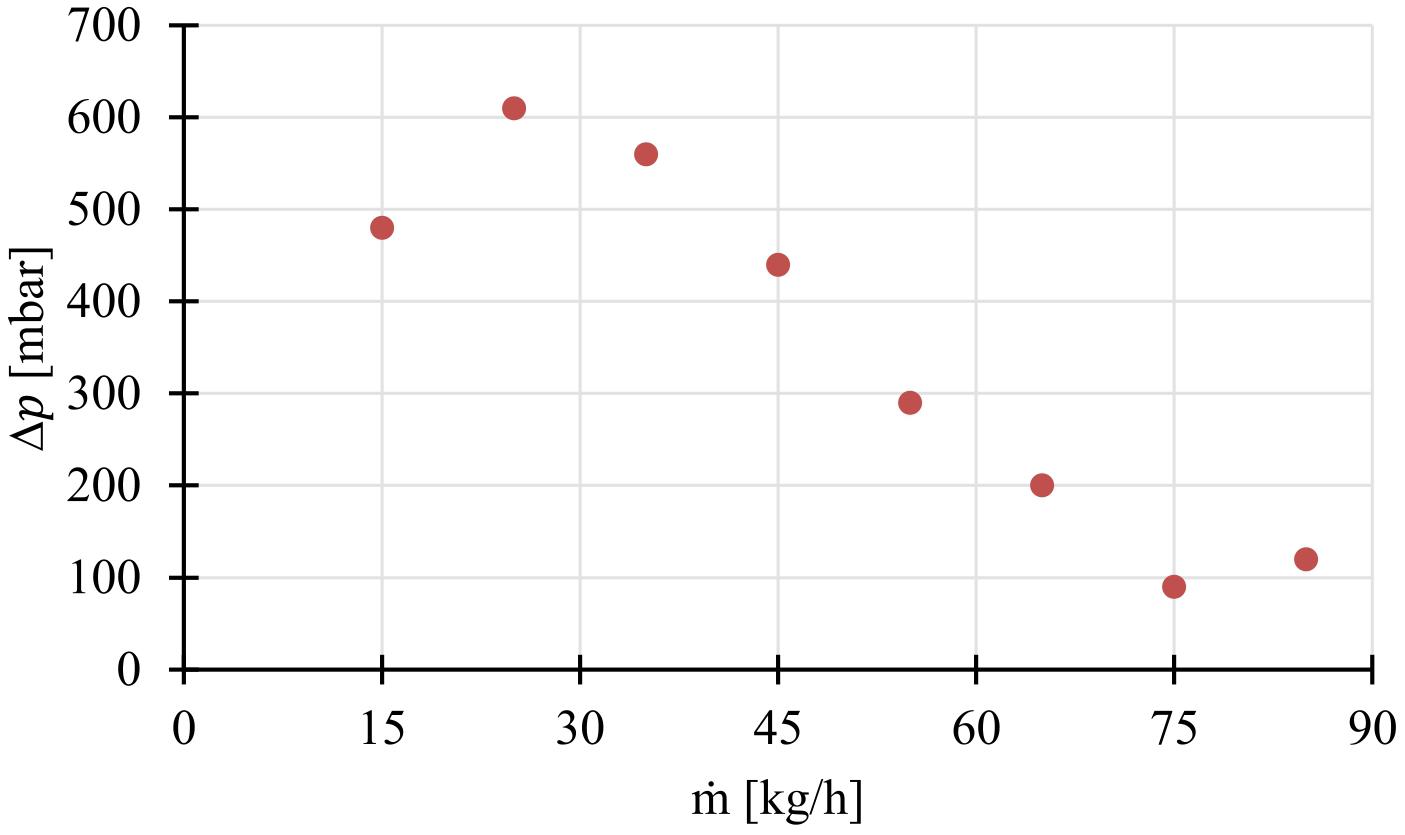
Figure 8. Measured pressure drop for water through the evaporator pipe.
The measurements show a change in the slope of the curve from positive to negative and back again to a positive slope, and this is known as the N-shape curve (behavior) as seen in Figure 8. For a mass flow of approx. (ṁ ≤ 25 kg/h), the water enters the evaporator pipe as a single phase, as a liquid, and leaves it again as a single phase in vapor as seen in Figure 7. From a mass flow of approx. (ṁ ≥ 75 kg/h), the heat flow is not sufficient to heat the liquid until the state of saturation is reached so the water flows through the evaporator pipe in one phase, as a liquid. So there is a region in the evaporator pipe in which the water flows in two phases, as a liquid-vapor mixture.
In Figure 8, the pressure drop through the evaporator pipe increases with the increase of the mass flow rate in single-phase regions (ṁ ≤ 25 kg/h, and ṁ ≥ 75 kg/h). Between these two mass flows, i.e., in the area in which (25 kg/h < ṁ < 75 kg/h) applies, the fluid flows within the evaporator pipe in two phases. So, the negative slope region in the internal characteristic curve of the evaporator pipe is due to the existence of the two-phase flow within the evaporator pipe in the area in which (25 kg/h < ṁ < 75 kg/h) applies, as shown in Figure 8. That may be due to the larger increase of the friction pressure drop in the two-phase flow compared with the liquid single-phase flow, the net effect is the increase in the pressure drop with the decrease of the mass flow rate (Chiapero et al., 2011).
The frictional pressure drop occurs when frictional forces reduce the velocity of the fluid and the decrease in the fluid velocity causes a decrease in the enthalpy, resulting in the pressure drop. In the two-phase flow, there is a slip between the liquid and the vapor phases and this slip increases the frictional pressure drop. The negative slope region in the internal characteristic curve of the evaporator pipe is the main responsible for the occurrence of the dynamic instabilities in two-phase flow tube boiling (Boure et al., 1973; Kakac and Bon, 2008; Kakaç and Cao, 2009; Chiapero et al., 2011; Ruspini et al., 2014).
Conclusion
In this paper, the technical fundamentals of two-phase flow and dynamic instabilities in two-phase flow were briefly clarified. The previous researches regarding the dynamic instabilities in vertical HRSG have been reviewed. From the literature, there is no experimental study regarding the instabilities analyses for natural circulation vertical HRSG. In this work, we used similarity criteria to construct a thermo-hydraulically similar evaporator pipe to Doosan Heavy Industries and Construction original model to investigate the dynamic instabilities of the two-phase flow in the vertical HRSGs. Precision was taken to ensure that our test rig is differentiated from previous research by different parameters (e.g., demineralized water as a test fluid, the orientation of the evaporator pipe and the multiplicity of operating options between natural and forced circulation). Characterization of test rigs was used to extract gaps in previous research in the field of investigating the dynamic instabilities in two-phase flow tube boiling. The developed test rig offers the possibility of changing between natural and forced circulation. Also changing the orientation of the evaporator pipe from a horizontal to a vertical orientation and vice versa is possible without great effort allowing a direct comparison of the instabilities in different conditions. Thereafter, the experimental investigation of thermohydraulic phenomena in two-phase flows provide a reliable tool to analyse the heat transfer, pressure drop, and instability in evaporator tubes.
In order to investigate the dynamic instabilities of two-phase flow in boiling systems such as the low-pressure evaporators, the internal characteristic curves of these evaporators should be obtained. The internal characteristic curve of the evaporator pipe shows an N-shape curve. The negative slope region in this N-shape curve is the main responsible for the occurrence of the dynamic instabilities in two-phase flow tube boiling. Finally, using this developed test rig, the effect of the evaporator pipe orientation and the pressure on two-phase flow dynamic instabilities will be investigated experimentally.
Data Availability Statement
The datasets generated for this study are available on request to the corresponding author.
Author Contributions
AT was responsible for writing, review, and editing the manuscript and contributed to the final manuscript. FA conceived the original idea and supervised the project with BE. TL contributed to the design and implementation of the test rig and performing the experiments. AE was involved in planning and supervised the work. All authors provided critical feedback and helped shape the research.
Conflict of Interest
The authors declare that the research was conducted in the absence of any commercial or financial relationships that could be construed as a potential conflict of interest.
Acknowledgments
AT appreciates the Egyptian Government for offering the Ph.D. scholarship and the Institute for Energy Systems and Technology (EST) at the Technical University of Darmstadt for funding the construction of the test rig. We acknowledge support by the German Research Foundation and the Open Access Publishing Fund of Technical University of Darmstadt.
References
Alobaid, F. (2018). Numerical Simulation for Next Generation Thermal Power Plants. Cham: Springer International Publishing. doi: 10.1007/978-3-319-76234-0
Baars, A., and Delgado, A. (2006). Multiple modes of a natural circulation evaporator. Int. J. Heat Mass Transf. 49, 2304–2314. doi: 10.1016/j.ijheatmasstransfer.2005.10.046
Boure, J. A., Bergles, A. E., and Tong, L. S. (1973). Review of two-phase flow instability. Nucl. Eng. Des. 25, 165–192. doi: 10.1016/0029-5493(73)90043-5
Bp Statistical Review of World Energy (2019). BP Statistical Review of World Energy 2019. Available online at: https://www.bp.com/content/dam/bp/business-sites/en/global/corporate/pdfs/energy-economics/statistical-review/bp-stats-review-2019-full-report.pdf
Chiapero, E. M., Fernandino, M., and Dorao, C. A. (2011). Parametric study of the pressure characteristic curve in a boiling channel. Comput. Therm. Sci. 3, 157–168. doi: 10.1615/ComputThermalScien.v3.i2.70
Çomaklı, O., Karslı, S., and Yılmaz, M. (2002). Experimental investigation of two-phase flow instabilities in a horizontal in-tube boiling system. Energy Convers. Manag. 43, 249–268. doi: 10.1016/S0196-8904(01)00021-8
Delmastro, D., and Clausse, A. (1994). Experimental phase trajectories in boiling flow oscillations. Exp. Therm. Fluid Sci. 9, 47–52. doi: 10.1016/0894-1777(94)90007-8
Dorao, C. (2015). Effect of inlet pressure and temperature on density wave oscillations in a horizontal channel. Chem. Eng. Sci. 134, 767–773. doi: 10.1016/J.CES.2015.03.040
Guanghui, S., Dounan, J., Fukuda, K., and Yujun, G. (2002). Theoretical and experimental study on density wave oscillation of two-phase natural circulation of low equilibrium quality. Nucl. Eng. Des. 215, 187–198. doi: 10.1016/S0029-5493(01)00456-3
Ishii, M. (1971). Thermally Induced Flow Instabilities in Two-Phase Mixtures in Thermal Equilibrium. Atlanta, GA: Georgia Institute Technology.
Jain, K. C., Petrick, M., Bankoff, S. G., and Miller, D. (1966). Self-sustained hydrodynamic oscillations in a natural-circulation boiling water loop. Nucl. Eng. Des. 4, 233–252. doi: 10.1016/0029-5493(66)90049-5
Kaichiro, M., Nishihara, H., and Michiyoshi, I. (1985). Boiling burnout and flow instabilities for water flowing in a round tube under atmospheric pressure. Int. J. Heat Mass Transf. 28, 1115–1129. doi: 10.1016/0017-9310(85)90120-6
Kakac, S., and Bon, B. (2008). A Review of two-phase flow dynamic instabilities in tube boiling systems. Int. J. Heat Mass Transf. 51, 399–433. doi: 10.1016/j.ijheatmasstransfer.2007.09.026
Kakaç, S., and Cao, L. (2009). Analysis of convective two-phase flow instabilities in vertical and horizontal in-tube boiling systems. Int. J. Heat Mass Transf. 52, 3984–3993. doi: 10.1016/j.ijheatmasstransfer.2009.03.025
Karsli, S., Yilmaz, M., and Comakli, O. (2002). The effect of internal surface modification on flow instabilities in forced convection boiling in a horizontal tube. Int. J. Heat Fluid Flow 23, 776–791. doi: 10.1016/S0142-727X(02)00147-9
Kim, J. M., and Lee, S. Y. (2000). Experimental observation of flow instability in a semi-closed two-phase natural circulation loop. Nucl. Eng. Des. 196, 359–367. doi: 10.1016/S0029-5493(99)00296-4
Liang, N., Shao, S., Tian, C., and Yan, Y. Y. (2011). Two-phase flow instabilities in horizontal straight tube evaporator. Appl. Therm. Eng. 31, 181–187. doi: 10.1016/J.APPLTHERMALENG.2010.08.029
Maulbetsch, J. S., and Griffith, P. (1965). A Study of System-Induced Instabilities in Forced-Convection Flows with Subcooled Boiling. Cambridge: MIT Libraries.
Park, I. W., Fernandino, M., and Dorao, C. A. (2018a). Experimental study on the characteristics of pressure drop oscillations and their interaction with short-period oscillation in a horizontal tube. Int. J. Refrig. 91, 246–253. doi: 10.1016/j.ijrefrig.2018.05.008
Park, I. W., Fernandino, M., and Dorao, C. A. (2018b). On the occurrence of superimposed density wave oscillations on pressure drop oscillations and the influence of a compressible volume. AIP Adv. 8:113. doi: 10.1063/1.5040113
Ruspini, L. C., Marcel, C. P., and Clausse, A. (2014). Two-phase flow instabilities: a review. Int. J. Heat Mass Transf. 71, 521–548. doi: 10.1016/j.ijheatmasstransfer.2013.12.047
Sørum, M., and Dorao, C. A. (2015). Experimental study of the heat transfer coefficient deterioration during density wave oscillations. Chem. Eng. Sci. 132, 178–185. doi: 10.1016/j.ces.2015.03.039
Taitel, Y., and Dukler, A. E. (1976). A model for predicting flow regime transitions in horizontal and near horizontal gas-liquid flow. AIChE J. 22, 47–55. doi: 10.1109/ICORR.2013.6650504
Walter, H., and Epple, B. (2017). Numerical Simulation of Power Plants and Firing Systems. Berlin: Springer.
Wang, Q., Chen, X. J., Kakaç, S., and Ding, Y. (1994). An experimental investigation of density-wave-type oscillations in a convective boiling upflow system. Int. J. Heat Fluid Flow 15, 241–246. doi: 10.1016/0142-727X(94)90044-2
Yüncü, H. (1990). An experimental and theoretical study of density wave and pressure drop oscillations. Heat Transf. Eng. 11, 45–56. doi: 10.1080/01457639008939734
Zhang, L., Wang, Y., and Yu, Z. (2018a). Experimental study of flow boiling instabilities in horizontal tubes under gas-liquid stratification condition: effects of heat flux and inlet subcooling degree. Int. J. Heat Mass Transf. 118, 1040–1045. doi: 10.1016/j.ijheatmasstransfer.2017.11.032
Keywords: two-phase flow, tube boiling, vertical HRSG, natural circulation, dynamic instabilities, density-wave oscillation, pressure-drop oscillation
Citation: Temraz A, Alobaid F, Lanz T, Elweteedy A and Epple B (2020) Operational Flexibility of Two-Phase Flow Test Rig for Investigating the Dynamic Instabilities in Tube Boiling Systems. Front. Energy Res. 8:517740. doi: 10.3389/fenrg.2020.517740
Received: 05 December 2019; Accepted: 14 August 2020;
Published: 17 September 2020.
Edited by:
Antonio Cammi, Politecnico di Milano, ItalyReviewed by:
Edward P. Gatzke, University of South Carolina, United StatesCarolina Introini, Politecnico di Milano, Italy
Andrea Di Ronco, Politecnico di Milano, Italy
Copyright © 2020 Temraz, Alobaid, Lanz, Elweteedy and Epple. This is an open-access article distributed under the terms of the Creative Commons Attribution License (CC BY). The use, distribution or reproduction in other forums is permitted, provided the original author(s) and the copyright owner(s) are credited and that the original publication in this journal is cited, in accordance with accepted academic practice. No use, distribution or reproduction is permitted which does not comply with these terms.
*Correspondence: Ayman Temraz, YXltYW4udGVtcmF6QGVzdC50dS1kYXJtc3RhZHQuZGU=