 Kong Ling
 Shuai Zhang1,2
- 1Key Laboratory of Thermo-Fluid Science and Engineering of MOE, Xi'an Jiaotong University, Xi’an, China
- 2Xi’an ShuFeng Technological Information, Ltd., Xi’an, China
- 3CNNC Key Laboratory on Nuclear Reactor Thermal Hydraulics Technology, Nuclear Power Institute of China, Chengdu, China
- 4National Institute Corporation of Additive Manufacturing, Xi’an, China
This article presents a numerical simulation on subcooled flow boiling at a high-pressure condition. An interface tracking method, VOSET, was used to handle the moving interface, and conjugate heat transfer between the wall and the fluid was included in the numerical model. In order to consider the evaporation on the microlayer below a growing bubble, a depletable micorlayer model was employed. Our simulation illustrated typical processes of subcooled boiling flow including bubble sliding, coalescence, detachment and annihilation, and revealed many mechanisms in increasing the heat transfer coefficient. A transition in flow regime from isolated bubbly flow to elongated bubbly flow was reproduced by our simulations. The void fraction obtained by time-averaging the volume fraction of the vapor phase under various flow conditions was analyzed.
Introduction
Subcooled flow boiling has been known as an effective way of heat transfer between coolant and heating wall. It is a kind of complex process with evaporation and condensation occurring simultaneously. At a specific system pressure, the coolant flows at a temperature lower than the corresponding saturation point. The heat flux imposed on the wall produces a thermal layer around it in which bubbles may nucleate and grow. However, condensation occurs as a bubble migrates into the bulk liquid region with temperature under saturation point. Subcooled flow boiling can produce much higher heat transfer coefficient than single phase flows, which makes it playing an important role in the heat transfer process in the core of pressurized water reactor.
A considerable number of experiments have been conducted on subcooled flow boiling. Pradanovic et al. (2002) carried out a study on the size and lifetime of bubbles in subcooled flow boiling and analyzed the influences by the applied heat flux, the degree of subcooling, the mass flow rate and the system pressure. It was found by Okawa et al. (2018) that bubbles were accelerated to enter the bulk region after departing from the wall. Yuan et al. (2018) carried out a visualization experiment on subcooled flow boiling under various system pressures and found that, sliding bubbles on the heating surface grew faster than stationary ones. A flow boiling experiment in rectangular channel was performed by Kim et al. (2018), who suggested, as the wall heat flux increases, the flow regime transforms progressively from isolated bubbly flow to elongating bubbly flow. Recently, Lee Y. G. et al., 2019) carried out an experimental investigation to measure the local bubble parameters for subcooled boiling flow in a vertical tube at low pressure. By using optical fiber probes, Park et al. (2020) then measured the local distribution of void fraction and demonstrated its influences by flow conditions.
Taking advantage from the fast development of computers’ performance, computational fluid dynamics (CFD) has become an effective way for the study on multiphase flows. Various numerical methods have been developed for liquid-gas two phase flows. Among those methods, interface tracing method (ITM) such as volume of fluid (VOF) and level set (LS) is one class describing the interface between liquid and gas phases and tracking its movement with the fluid flow. Therefore, ITM method gives results with higher fidelity than other methods such as mixture model and two-fluid model, and can therefore provide more details for studying the mechanism of boiling flows.
Lal et al. (2015) simulated the growth and departure of a single bubble in a subcooled boiling flow. Using VOF method, Lee J. et al. (2019) simulated subcooled boiling flow of FC-72 and numerically predicted the heat transfer coefficient under different heat fluxes and mass flow rates. Yi et al. (2019) numerically studied the growth of a single bubble in subcooled liquid under microgravity, in which phase field method was used for handling the phase boundary. Their results show that, under specific conditions, evaporation and condensation in the bubble can reach balance.
In the present study, VOSET (Sun and Tao, 2010), a new ITM method, was adopted to study a subcooled flow boiling process, and the conjugation with heat conduction in the solid wall was taken into consideration. To fully describe the processes of bubble nucleation and its growth on the wall, models were introduced for bubble nucleation and microlayer evaporation.
The rest of this article is organized as follows. Problem Description introduces the subcooled flow boiling problem studied. Numerical Methods describes the governing equations and numerical methods. The numerical results are displayed and discussed in Results and Discussion; and finally some conclusions are summarized in Discussion. The purpose of the present study is to reveal more details in the process of subcooled flow boiling at high-pressure conditions by means of high fidelity numerical simulations.
Problem Description
Figure 1 describes the problem considered in the present study. The computational domain is composed of solid and fluid regions, in which heat conduction in solid and boiling heat transfer were considered simultaneously. The monocrystal silicon and water at 1.0 MPa were respectively considered as the materials of the solid and the fluid. Physical properties including density, viscosity, thermal conductivity and heat capacity are summarized in Table 1. At the considered system pressure, saturation temperature is 453 K, and the latent heat is 2.02 × 10⁶ J/kg. The liquid-vapor surface tension was specified as 0.042 N/m. The channel has a width of df = 5 mm and a length of l = 50 mm in the flow direction; a thickness of ds = 0.5 mm was specified for the solid wall. Liquid water having a subcooling of 20 K flows in from the bottom boundary with a velocity of 0.1 m/s (corresponding to a mass flow rate of 88.81 kg/m2s). The selected channel has no significant difference with the one in real rod buddle in terms of hydraulic diameter. Since pressurized water reactor usually works at pressure about 7–8 MPa, simulation should be done at some high pressure. And the pressure of 1 MPa is adopted here. It is our understanding that the interface tracking algorithms, such as VOF, Level set and VOSET, suffer from poor stability at large density difference between the liquid and the vapor phases. Hence if our method can get converged solution at 1 MPa, then it is easier to handle boiling simulations at higher pressure, except for the need of finer mesh for smaller departure diameter (Sakashita, 2011). That is why we select 1 MPa as the simulation condition. (Corresponding to Comment 1 by Reviewer #4); A wall heat flux was specified on the left boundary of the solid wall; symmetry condition was given on the right boundary of the fluid region. Uniform grids of 10 × 500 and 50 × 500 were respectively used for the domain discretizations of the solid and the fluid regions. In the present study, numerical investigation for the boiling flow was investigated on wall heat fluxes ranging from 100 kW/m2 to 500 kW/m2.
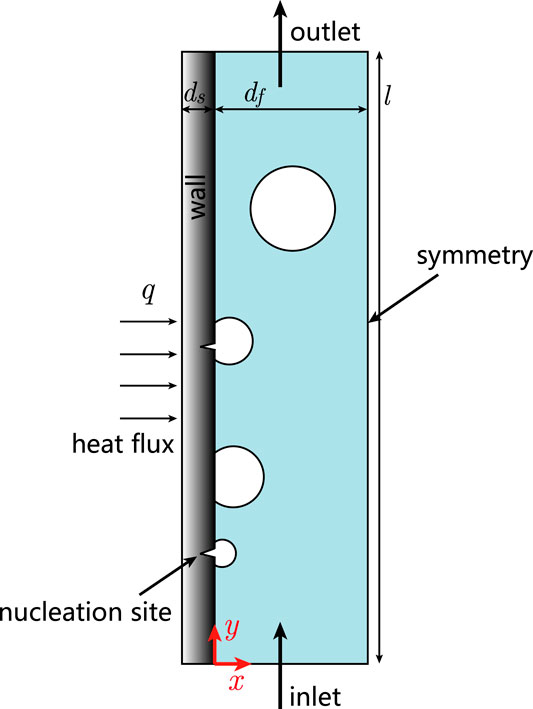
FIGURE 1. The subcooled flow boiling problem and applied boundary conditions.
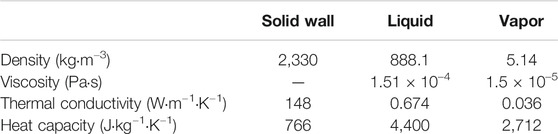
TABLE 1. Physical properties of the solid wall and the working fluid.
Numerical Methods
Governing equations
In the solid region, heat conduction is considered only, therefore, the temperature field satisfies
In the fluid region, the governing equation for temperature can be expressed as:
Considering the movement of the liquid-vapor phase boundary and the evaporation occurring on it, the equation for the vapor volume fraction, the continuity equation and the momentum equation can be respectively expressed as:
In Eqs 3–5, c is the volume fraction of the vapor phase, and fst denotes the surface tension.
in which
Microlayer Model
The existence of microlayer has been confirmed in many previous studies (Cooper and Lloyd, 1969; Koffman and Plesset, 1983; Utaka et al., 2013). As shown in Figure 2, beneath a growing bubble on the heating wall, there exists a thin liquid film usually having only several microns. The large temperature gradient in the microlayer can produce great amount of evaporation rate, which takes an important portion of the overall mass transfer rate. Since the film thickness is much smaller than the grid size used in the present study, it was solved by a depletable model form microlayer proposed by Sato and Niceno (2015). As Figure 2 shows, in the present study, we considered the microlayer evaporation in the fluid-region cells near the wall. As receding occurred at the contact line, an initial thickness was given for the microlayer.
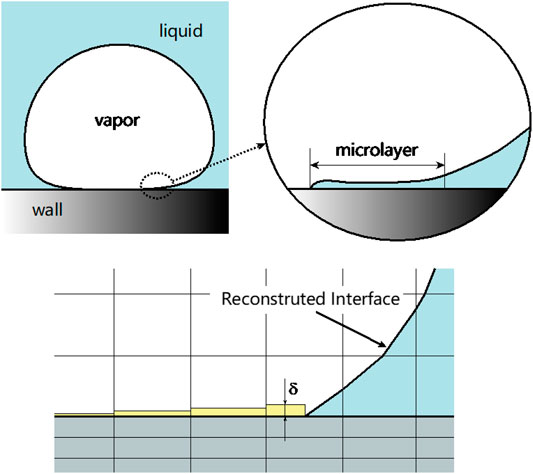
FIGURE 2. A depletable microlayer model used.
The heat flux through the microlayer was calculated as:
The microlayer thickness decreases due to the evaporation, and therefore,
As the microlayer thickness was reduced down to a threshold (δ < δmin = 10−10 m), the computational cell was then marked to be dry out, and microlayer is no longer considered there.
The initial thickness of the microlayer plays an important role in microlayer evaporation, However, there remains great uncertainty in experimental measurements. Recent experimental studies (Jung and Kim, 2014; Chen et al., 2020) suggests, the microlayer thickness of water varies from around 1–4 μm at low-pressure conditions under various heat fluxes. Urbano et al. (2018) performed a direct numerical simulation, where a small enough grid size, 0.5 μm, was used to capture the formation of the microlayer. The numerically obtained microlayer thickness varies between 2 and 3 μm, which is consistent with the experiments. Unfortunately, at the best knowledge of the authors, no experimental result is reported for microlayer thickness at high pressures such as 1 MPa. The parametric study by Urbano et al. (2018) suggests that the formation of microlayer results form a balance between the bubble growth rate, the capillary actions and liquid viscous dissipation. Owing to the large difference in vapor density, the bubble growth rate at high-pressure conditions may differ greatly from that at atmosphere pressure. Therefore, the microlayer thickness as well as whether or not the microlayer can form are unclear for system pressure and wall heat fluxes studied at present paper. As a first attempt using microlayer model for subcooled boiling flow at high-pressure conditions, we followed the existing experimental measurements at atmosphere pressure, and specified the initial microlayer thickness as δinitial = 2 μm in the present study. The influence by the parameters in the microlayer model is left as one of our future work.
(Corresponding to Comment 2 by Reviewer #4)
Bubble Nucleation Model
Bubble nucleation usually occurs at on the cavity on the solid surface, and the conditions required for the nucleation depends on the microstructure of the solid surface (Hibiki and Ishii, 2003). Since the CFD method used in the present study is based on continuum assumption, it cannot model the process of the bubble nucleation which may need to be considered from the perspective of molecular dynamics. To simulate the process of bubble growth using ITM, therefore, bubble seeds need to be given in prior. In this regard, we followed the nucleation model used by Sato and Niceno (2017). They randomly set a number of nucleation sites on the solid wall, and each of them has a certain nucleation activation temperature. In the present study, we specified 15 nucleation sites on the wall in the range y = 5–45 mm, and each of them corresponds to a specific nucleation superheat ranging from 5 to 20 K. In this model, a bubble seed can be generated only at the preset nucleation site, and it requires the liquid temperature exceeds the preset superheat. The locations and the required nucleation superheats are summarized in Table 2. It should to be noted that, since the microstructure of the solid surface cannot be fully considered in the present CFD study, the nucleation model is simply a description for the solid surface in terms of bubble nucleation. A different wall roughness usually requires another set of nucleation sites as well as another range of activation temperature.
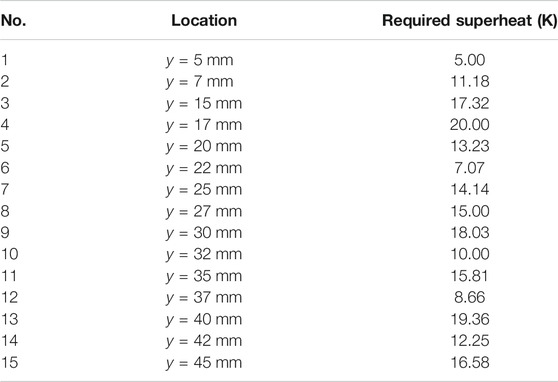
TABLE 2. Locations of nucleation sites and required superheat.
Results and Discussion
Subcooled Flow Boiling at Low Heat Flux
We first considered the subcooled flow boiling with the lowest wall heat flux of 100 kW/m2 and simulated the boiling process within 1.0 s. Figure 3 illustrates the evolution of phase distribution. From the figure at t = 0.05 one can see that bubbles continuously formed, grew and moved upwards at nucleation sites #1, #6 and #12, which indicates those sites were activated. It lies in that the preset nucleation superheats at those three sites were lower than the initial wall superheat (ΔT = 9 K). With the further progress of boiling heat transfer, the wall temperature was decreases, and bubbles nucleation occurred only at site #1. The numerical result suggested several ways of bubble departure from the heating wall. As a sliding bubble grew to a certain size, it departed from the wall and moved into the bulk region. Simultaneously, some smaller bubbles could depart due to the oscillation induced by coalescences. Overall, at the wall heat flux of 100 kW/m2, the subcooled boiling flow is located in a typical flow regime of isolated bubbly flow.
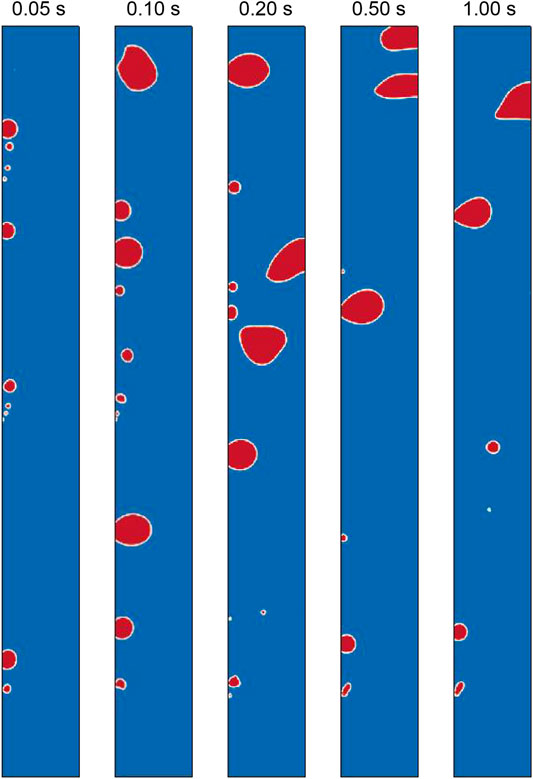
FIGURE 3. Evolution of phase distribution at low heat flux (q = 100 W/m2).
Figure 4 shows the temperature fields at some instances between 0.5 and 1.0 s, in which the boundary between the solid and the fluid regions is marked as a solid black line. We can clearly see the influences of the bubbles to the heat transfer process. The bubble induced turbulence greatly enhanced the fluid mixing between the near wall region and the subcooled bulk region. As a result, the solid temperature in boiling region (y > 5 mm) is evidently lower than that in single-phase region (y < 5 mm).
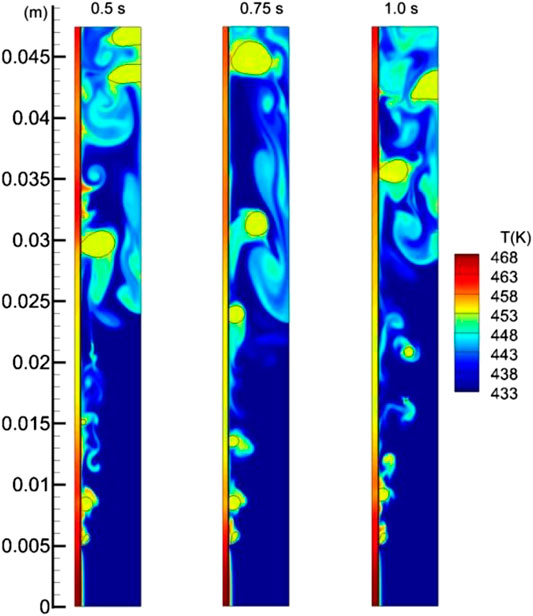
FIGURE 4. Temperature field at wall heat flux of 100 kW/m2.
Yuan et al. (2018) pointed out important influences by sliding bubbles in subcooled flow boiling. Figure 5 shows a bubble sliding on the wall, where the velocity and temperature fields around it are displayed. From the velocity field inside the bubble we can see the effect of the microlayer located at around 12 mm < y < 12.4 mm. Some vapor was produced by the microlayer evaporation, which contributed to the bubble growth. The wall temperature was plotted as Figure 5C, from which we can see the lowest temperature was located at the microlayer (around y = 12.2 mm). Furthermore, the wall temperature downstream the bubble was remarkably lower than that upstream. In summary, we can find the important influence of a sliding bubble. In the process of a single bubble along the wall, a bubble can continuously reduce the temperature of the solid, and absorb heat from the wall to support its growth.
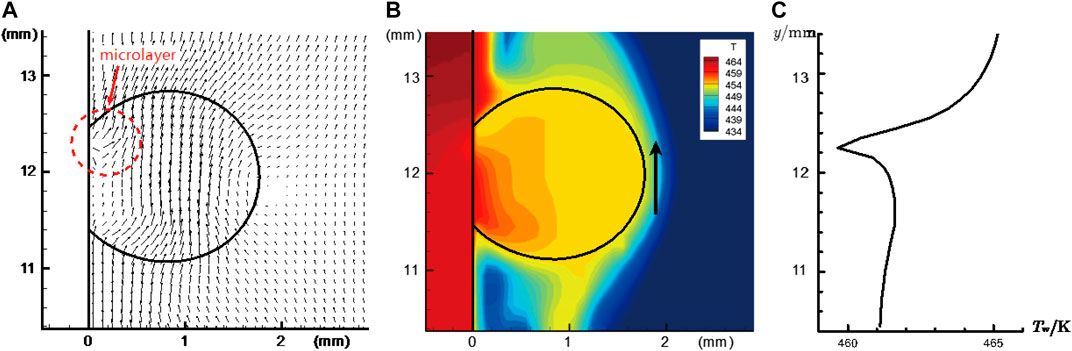
FIGURE 5. A bubble sliding on the heating wall: (A) local velocity vector; (B) local temperature field; (C) local wall temperature.
Figure 6 tracks a small bubble (marked by an arrow) after its departure from the wall. In spite of the boiling process around the heating wall, the liquid in the bulk region remained subcooled. As the bubble entered the bulk region, the condensation rate began to be greater than the evaporation rate, which made bubble reduced in size until eliminated.
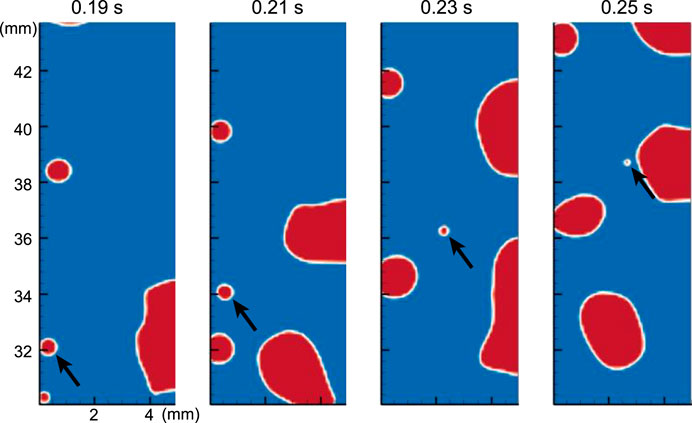
FIGURE 6. Condensation of a small bubble in the bulk region.
Subcooled Flow Boiling at Higher Heat Fluxes
The results for higher heat fluxes are presented in this subsection. Figures 7, 8 respectively show the evolutions of phase distribution at wall heat fluxes of 300 and 500 kW/m2. Compared with Figure 3, we can find some features of increased wall heat flux. Owing to the increased wall temperature, more nucleation sites were activated, and the bubble growth rate was increased. Interaction between vapor bubbles became more intensive. Some rising bubbles could absorb smaller bubbles to get larger. Under the wall heat flux of 300 kW/m2, the bubble size at the bulk region got remarkably larger, but the flow regime seems remained in the isolated bubbly flow (Figure 6). At wall heat flux of q = 500 kW/m2, due to the more frequent coalescences of vapor bubbles, the two-phase flow developed into a flow pattern of elongated bubbly flow. Also, we can see the formation of a liquid film between the elongated bubble and the heating wall. The transformation from dispersed bubbly flow to elongated bubbly flow has been reported by Kim et al. (2018), and it was successfully reproduced by the present numerical simulations.
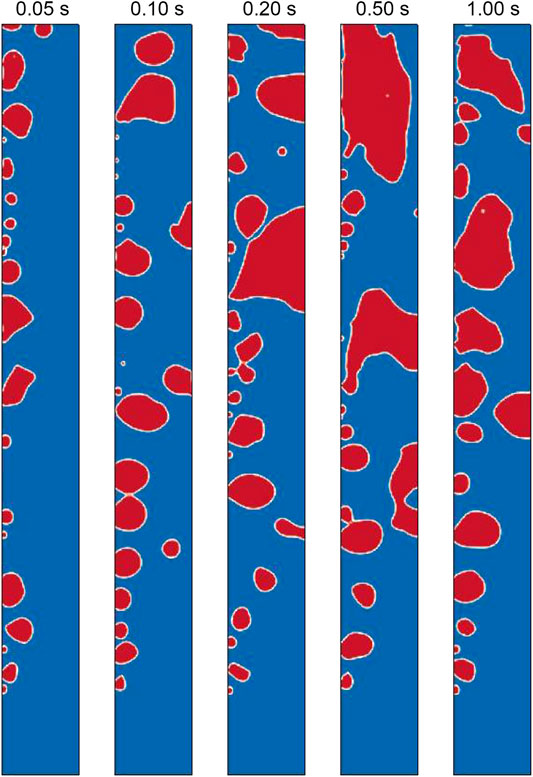
FIGURE 7. Evolution of phase distribution at wall heat flux of 300 kW/m2.
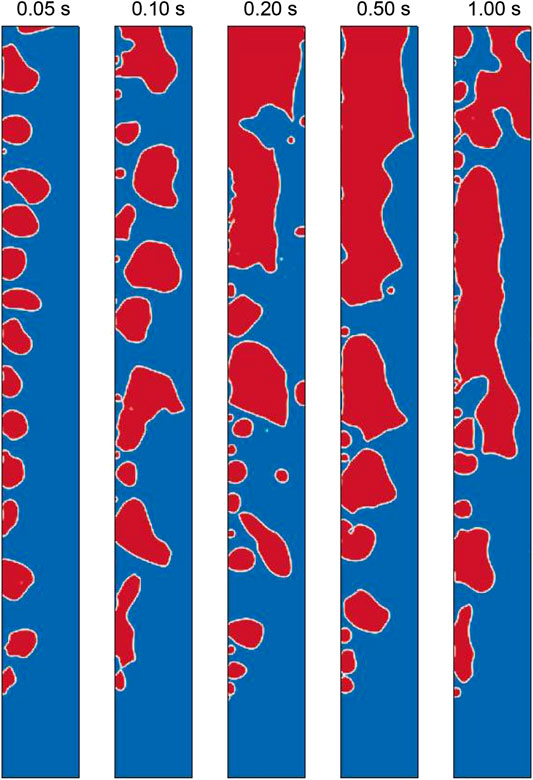
FIGURE 8. Evolution of phase distribution at wall heat flux of 500 kW/m2.
Average Wall Superheat
From the results discussed in Subcooled Flow Boiling at Low Heat Flux and Subcooled Flow Boiling at Higher Heat Fluxes, we can see many important influences of bubbles to the heat transfer process. The bubble growth, sliding and departure and condensation can continuously transfer heat from the heating wall to the bulk fluid region. In order to quantitatively analyze the heat transfer efficiency of subcooled flow boiling, we calculated a spatial average wall temperature for each case:
in which y1 = 5 mm and y2 = 45 mm.
Figure 9 plots the spatial average wall temperature calculated by Eq. 9 under the five cases with the wall heat flux ranging from 100 to 500 kW/m2. It can be seen that, for each of the five cases, the influence of initially given temperature had been eliminated at t = 0.4 s, after which the average wall temperature almost kept floating up and down around a constant value. We therefore consider quasi-steady states were reach at 0.4 s for all the five cases.
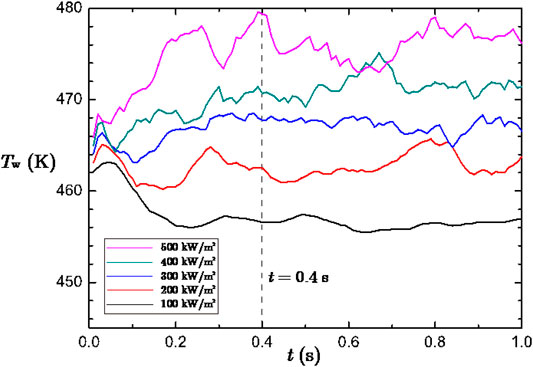
FIGURE 9. Spatial average wall temperature under various wall heat fluxes.
In order to evaluate the overall heat transfer coefficient, we then calculated the time average of the spatial average wall temperature, to obtain a time-space average wall temperature:
in which t1 = 0.4 s and t2 = 1.0 s.
Heat Transfer Coefficient
A considerable number of heat transfer correlations were previously reported for subcooled flow boiling, and the correlations by Shah (1977), Liu and Winterton (1991), and by Kandlikar (1998) are most widely used ones among them. Based on a database containing 500 data points from 18 independent experimental studies, Shah (1977) proposed a correlation for heat transfer coefficient of subcooled flow boiling. The two-phase heat transfer coefficient was expressed as a correction on that of single-phase forced convection:
Where ΔTsat is wall superheat defined as
In Eq. 11, ψ is the correction factor determined by:
where the boiling number Bo and the subcooling ΔTsub are defined as:
The single-phase heat transfer coefficient was calculated with the Dittus-Boelter correlation:
Liu and Winterton (1991) expressed the relationship between the heat flux and the wall superheat in a power form, which can be written as follows for subcooled water at the inlet.
where hsp is the single-phase heat transfer coefficient determined by Eq. 17, and hnb refers to the heat transfer coefficient for nucleate boiling calculated by Cooper correlation (Cooper, 1984; Ji et al., 2015), S is a factor considering the suppression factor given by:
Considering the effects of mass flow rate and the latent heat, Kandlikar proposed a correlation for fully developed subcooled boiling which can be expressed as follows for water.
in which hsp denotes convective heat transfer coefficient predicted by Gnielinski equation (Gnielinski, 1976).
For the validation purpose, the equations presented above were used for predicting the wall superheat of the problem studied here, in which the characteristic length (D) appearing in Eq. 17 was calculated as the hydraulic diameter, namely, D = 4df = 0.02 m. The wall superheats obtained by our simulations were evaluated by the time-space wall temperature (Eq. 10). The wall superheats are plotted in Figure 10. From the plotted results we can see, first, our simulation gives the same variation trend of wall superheat with heat flux. However, the predictions by the three correlations show large differences in predicting the wall superheat, even though they are selected owing to their superior accuracy (Chen et al., 2021). Compared with the correlation by Shah (1977), the present simulation gives under prediction of around 30% in wall superheat. This discrepancy seems a bit large. However, it is well-known in heat transfer textbook (Cengel, 2007; Bergman et al., 2011) that the Rohsenow equation for pool boiling heat transfer can be in error by 30% for a wall superheat by given a heat flux. Thus our prediction discrepancy is acceptable.
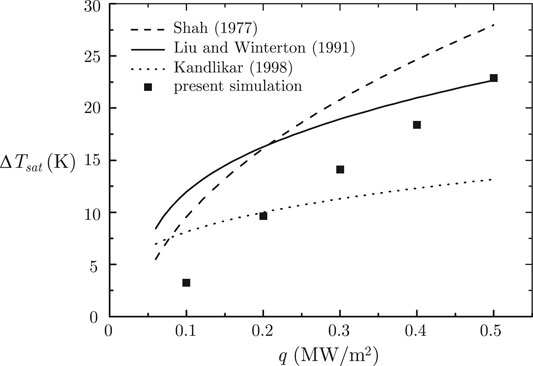
FIGURE 10. Comparison of wall superheats predicted by our simulation and by some reported correlations.
In subcooling boiling the bulk of fluid temperature is below saturated temperature. The disturbance of the generated bubbles enhances the fluid mixing, hence enhances heat transfer. In order to reveal this enhancement the definition of single phase convective heat transfer coefficients adopted here:
where Tw is the time-space average wall calculated by Eq. 10, and Tb refers to the time-space average liquid temperature calculated by:
To be consistent with the average wall temperature, Ω in Eq. 22, where the liquid temperature averaged was averaged, refers to the computational domain in the range 5 mm < y < 45 mm. Figure 11 plots the heat transfer coefficients calculate by Eq. 21. In the figure the single phase convective heat transfer coefficient predicted by Gnielinski equation (Gnielinski, 1976) at the same conditions is also presented. It can be seen that subcooled boiling has an appreciable effect on enhancing heat transfer. In addition we can clearly see greater heat transfer coefficient at higher wall heat flux, but the growth rate is decreasing. The result indicates that, for the cases studied, the boiling is in the stage of nucleate boiling where the increase of wall heat flux leads to enhancement of heat transfer.
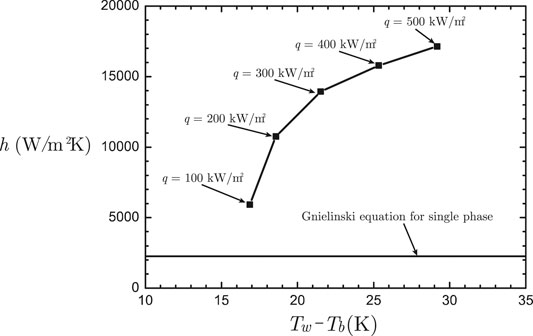
FIGURE 11. Heat transfer coefficient under various heat fluxes.
Void Fraction
The distribution of void fraction plays as a key role in heat transfer performance of flow boiling. We therefore evaluated the void faction by time-averaging the vapor volume fraction in the period when quasi-steady states were reached. Concretely, the void fraction was calculated by:
in which t1 = 0.4 s and t2 = 1.0 s.
The void fraction obtained under the five wall heat fluxes are displayed in Figure 12, and the average void fraction on the cross section of the tube is plotted in Figure 13. From the two figures one can clearly see the development of the void fraction along the flow direction. Obviously, higher wall heat flux resulted in faster generation of vapor, hence increased the void fraction. Under the highest wall heat flux (0.5 MW/m2), an average void fraction of around 0.8 was reached at the tube outlet. The void fraction distributed rather unevenly on the cross section. From Figure 12 we can see, even in higher wall heat flux where elongating bubbly flow was formed, there remains a thin liquid film around the heating wall, which avoids the occurring of critical heat flux. The existence of the thin liquid film is an important mechanism to prevent the heat transfer regime from film boiling. The distribution of void fraction further enhances our understanding the mechanism of flow boiling heat transfer.
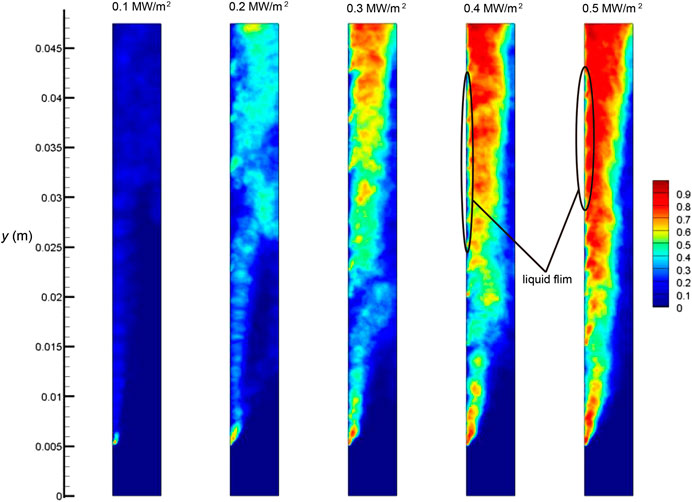
FIGURE 12. Void fraction obtained by time averaging the vapor volume fraction.
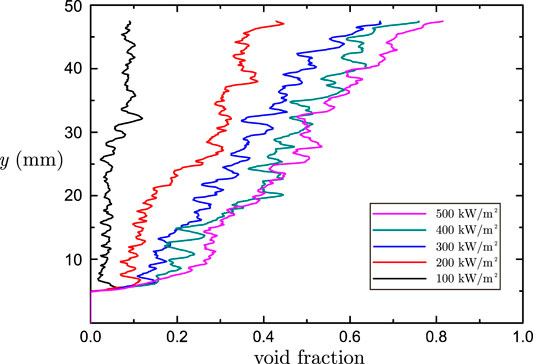
FIGURE 13. Average void fraction along the flow direction.
The experimental results reported by Park et al. (2020) show that, along the radial direction (from the wall to bulk region), the local void fraction first increases and then decreases, and the maximum value appears at a certain distance from the wall. Figure 14 plots the local profiles of the void fraction in the radial direction at y = 10, 20, 30, and 40 mm for wall heat flux of 300 kW/m2. Those curves show the same feature of the local distribution of the void fraction except for the one at y = 20 mm, where the local void fraction almost kept a constant value from x = 0.5 mm to x = 2 mm.
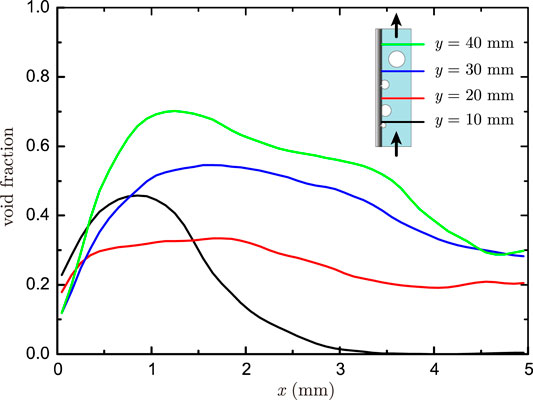
FIGURE 14. Local void fraction along the radial direction (q = 300 kW/m2).
Through some parametric studies, Park et al. (2020) demonstrated how the local void fraction is influenced by the flow conditions. In general, the void fraction at a specific cross section increases when the heat flux increase, the mass flux decreases and the inlet subcooling decreases. Simultaneously, the peak of its local profile along the radial direction is shifted toward the bulk region with the decrease of the inlet subcooling.
In the present study, we changed the mass flow rate and subcooling at the inlet on the basis of the case where q = 300 kW/m2 to study their effect on the void fraction. In terms of the mass flow rate, we carried out simulations with a smaller inlet velocity (0.05 m/s) and a greater one (0.15 m/s), and the obtained radial distributions of the void fraction at y = 30 mm are plotted in Figure 15. As a whole, we can find smaller mass flux resulted in greater average void fraction at the same cross section. Simulations on two more cases with a greater inlet subcooling (40 K) and a smaller one (10 K) was then conducted, and the obtained local void fractions at y = 30 mm are compared in Figure 16. It shows that, the void fraction in average was increased at lower inlet subcooling. Moreover, the peak of the local void fraction was shifted away from the wall. The peak values appear at around x = 1.2 mm, x = 1.8 mm, and x = 3 mm at subcoolings of 40, 20, and 10 K, respectively. As a whole, our interface-tracking simulations successfully reproduced the new findings of subcooled boiling flow in terms of the local distribution of the void fraction as well as its influences by the mass flow rate and the inlet subcooling.
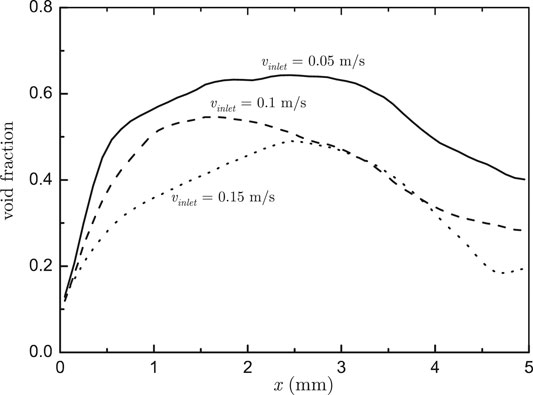
FIGURE 15. Local profile of void fraction at y = 30 mm under various inlet velocities.
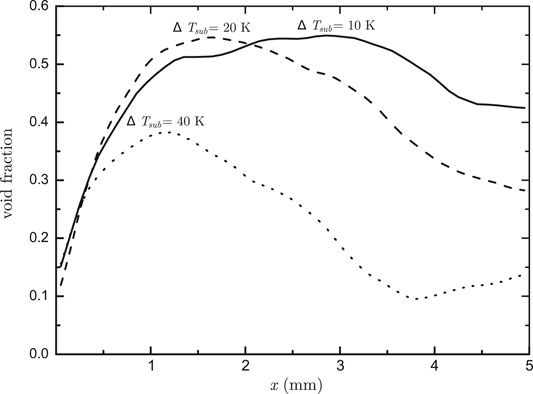
FIGURE 16. Local profile of void fraction at y = 30 mm under various inlet subcoolings.
Discussion
Subcooled boiling flow is the physical process occurring at various scales, and the influences of small-scale processes are not negligible compared with large-scale ones. Such multi-scale feature makes subcooled boiling being one of the most challenging problems in nuclear engineering. From the perspective of numerical simulation, the present study can only resolve the processes under the grid resolution, while the small-scale problems are left behind to be modeled. Concretely, the present study used models for bubble nucleation and microlayer evaporation for a smaller scale, and illustrated some features at larger scale such as the distribution of the void fraction. Indeed, the accurate simulation requires the influences by small-scale processes being accurately modeled. Due to the lake of small-scale data, especially at high-pressure conditions, there remain many uncertainties in the present simulations. From the validation we can see large discrepancy between the numerical simulation and existing correlations, which may lie in the 2D model used in our simulation, and various uncertainties such as wall roughness and the thickness of the microlayer. For this, the authors believe the following studies are of great help in providing more reliable micro-scale models for interface-tracking simulations for subcooled boiling flows: 1) measurement of microlayer thickness at various system pressures; 2) measurement of nucleation site density at various system pressures; 3) direct simulation for bubble nucleating using molecular dynamics simulation. Moreover, 3D simulations are necessary to make interface-tracking simulations approaching to what is occurring in real subcooled boiling flow, and it will be conducted by the authors in near future using 3D VOSET (Ling et al., 2015a).
Conclusion
In the present study, VOSET method was used as the interface tracking method for the simulation of subcooled flow boiling at high-pressure condition, and the conjugation with heat conduction in the solid wall was considered in the model. By means of numerical simulations at various flow conditions, many features of flow boiling were presented.
Results at the lowest wall heat flux demonstrated some mechanisms how bubbles enhance the heat transfer efficiency. Firstly, the bubble motions can greatly intensify fluid mixing between near wall region and bulk region. Owing to the microlayer, bubbles sliding on the wall can greatly increase the evaporation rate and reduce the local solid temperature.
In the range of wall heat flux investigated here, we found the flow pattern in the channel transforms from isolated bubbly flow to elongated bubbly flow with the increase of the heat flux. The heat transfer coefficient kept increasing. In the cases studied, there remains a thin liquid film around the heating wall, even in the flow regime of elongated bubbly flow, which prevented the occurring of critical heat flux.
The present study successfully replicated the features of the cross-sectional local void fraction in subcooled flow boiling. It first increase and then decrease from the near-wall region to the bulk fluid region. With the increase of the mass flow rate, the peak location was shifted away from the heating wall.
Data Availability Statement
All datasets generated for this study are included in the article/supplementary files.
Author Contributions
KL wrote the code needed for simulation and wrote the article submitted; WL designed the problem studied; SZ and XS conducted numerical simulations; WT supervised the analysis of the results.
Funding
The present work is supported by Project for Young Talents of China National Nuclear Corporation, the Key Project of National Natural Science Foundation of China (51836005), the Foundation for Innovative Research Groups of the National Natural Science Foundation of China (51721004) and 111 Project (B16038).
Conflict of Interest
Authors Kong Ling and Shuai Zhang were employed by Xi'an ShuFeng Technological Information, Ltd. Author Xiaowei Sui was employed by National Institute Corporation of Additive Manufacturing. The remaining authors declare that the research was conducted in the absence of any commercial or financial relationships that could be constructed as a potential conflict of interest.
References
Bergman, T. L., Lavine, A. S., Incropera, F. P., and DeWitt, D. P. (2011). Introduction to heat transfer. 6th Edn. New York, NY: John Wiley & Sons Inc., 628.
Cengel, Y. A. (2007). Heat and mass transfer, A practical approach. 3rd Edn. Boston, MA: McGraw-Hill, 569.
Chen, Z., Hu, X., Hu, K., Utaka, Y., and Mori, S. (2020). Measurement of microlayer characteristics in the whole range of nucleate boiling for water by laser interferometry. Int. J. Heat Mass Tran. 146, 118856. doi:10.1016/j.ijheatmasstransfer.2019.118856
Chen, Z., Li, W., Li, J., Zhou, K., and Feng, Z. (2021). A new correlation for subcooled flow boiling heat transfer in a vertical narrow microchannel. ASME Journal of Electronic Packaging 143, 014501. doi:10.1115/1.4046755
Cooper, M. G., and Lloyd, A. J. P. (1969). The microlayer in nucleate pool boiling. Int. J. Heat Mass Tran. 12, 895–913. doi:10.1016/0017-9310(69)90154-9
Cooper, M. G. (1984). Saturation nucleate pool boiling, a simple correlation. Int. Chem. Eng. Symp. Ser. 16, 157–239. doi:10.1016/s0065-2717(08)70205-3
Gnielinski, V. (1976). New equations for heat mass transfer in turbulent pipe and channel flows. Int. Chem. Eng. 8 (1), 359–368.
Hibiki, T., and Ishii, M. (2003). Active nucleation site density in boiling systems. Int. J. Heat Mass Tran. 46, 2587–2601. doi:10.1016/s0017-9310(03)00031-0
Ji, W., Zhao, C., He, Y., and Tao, W. (2015). Experimental validation of Cooper correlation at higher heat flux. Int. J. Heat Mass Tran. 90, 1241–1243. doi:10.1016/j.ijheatmasstransfer.2015.05.107
Jung, S., and Kim, H. (2014). An experimental method to simultaneously measure the dynamics and heat transfer associated with a single bubble during nucleate boiling on a horizontal surface. Int. J. Heat Mass Tran. 73, 365–375. doi:10.1016/j.ijheatmasstransfer.2014.02.014
Kandlikar, S. G. (1998). Heat transfer characteristics in partial boiling, fully developed boiling, and significant void flow regions of subcooled flow boiling. J. Heat Transfer 120, 395–401. doi:10.1115/1.2824263
Kim, S. H., Chu, I. C., Choi, M. H., and Euh, D. J. (2018). Mechanism study of departure of nucleate boiling on forced convective channel flow boiling. Int. J. Heat Mass Tran. 126, 1049–1058. doi:10.1016/j.ijheatmasstransfer.2018.05.105
Koffman, L. D., and Plesset, M. S. (1983). Experimental observations of the microlayer in vapor bubble growth on a heated solid, Int. J. Heat Mass Tran. 105, 625–632. doi:10.1115/1.3245631
Lal, S., Sato, Y., and Niceno, B. (2015). Direct numerical simulation of bubble dynamics in subcooled and near-saturated convective nucleate boiling. Int. J. Heat Fluid Flow 51, 16–28. doi:10.1016/j.ijheatfluidflow.2014.10.018
Lee, J., O'Neill, L. E., Lee, S., and Mudawar, I. (2019). Experimental and computational investigation on two-phase flow and heat transfer of highly subcooled flow boiling in vertical upflow. Int. J. Heat Mass Tran. 136, 1199–1216. doi:10.1016/j.ijheatmasstransfer.2019.03.046
Lee, Y. G., Park, I. W., Yoo, J. W., and Kim, S. (2019). Measurement of multi-dimensional distribution of local bubble parameters in a vertical annulus under subcooled boiling conditions. Int. J. Heat Mass Tran. 140, 992–1005. doi:10.1016/j.ijheatmasstransfer.2019.05.106
Ling, K., Li, Z., Sun, D., He, Y., and Tao, W. (2015a). A three-dimensional volume of fluid & level set (VOSET) method for incompressible two-phase flow. Comput. Fluids 118, 293–304. doi:10.1016/j.compfluid.2015.06.018
Ling, K., Son, G., Sun, D., and Tao, W. (2015b). Three dimensional numerical simulation on bubble growth and merger in microchannel boiling flow. Int. J. Therm. Sci. 98, 135–147. doi:10.1016/j.ijthermalsci.2015.06.019
Liu, Z., and Winterton, R. H. S. (1991). A general correlation for saturated and subcooled flow boiling in tubes and annuli based on a nucleate pool boiling equation. Int. J. Heat Mass Tran. 34, 2759–2766. doi:10.1016/0017-9310(91)90234-6
Okawa, T., Kaiho, K., Sakamoto, S., and Enoki, K. (2018). Observation and modeling of bubble dynamics in isolated bubble regime in subcooled flow boiling. Nucl. Eng. Des. 335, 400–408. doi:10.1016/j.nucengdes.2018.06.009
Park, I. W., Kim, S., and Lee, Y. G. (2020). The profiles of the local void fraction close to the heated wall in the subcooled flow boiling. Int. J. Heat Mass Tran. 151, 119438. doi:10.1016/j.ijheatmasstransfer.2020.119438
Prodanovic, V., Fraser, D., and Salcudean, M. (2002). Bubble behavior in subcooled flow boiling of water at low pressure and low flow rates. Int. J. Multiphas. Flow 28, 1–19. doi:10.1016/s0301-9322(01)00058-1
Sakashita, H. (2011). Bubble growth rates and nucleation site densities in saturated pool boiling of water at high pressures. J. Nucl. Sci. Technol. 48, 734–743. doi:10.1080/18811248.2011.9711756
Sato, Y., and Niceno, B. (2015). A depletable micro-layer model for nucleate pool boiling. J. Comput. Phys. 300, 20–52. doi:10.1016/j.jcp.2015.07.046
Sato, Y., and Niceno, B. (2017). Nucleate pool boiling simulations using the interface tracking method: boiling regime from discrete bubble to vapor mushroom region. Int. J. Heat Mass Tran. 105, 505–524. doi:10.1016/j.ijheatmasstransfer.2016.10.018
Shah, M. (1977). A general correlation for heat transfer during subcooled boiling in pipes and annuli. ASHRAE Trans. 81, 205–217.
Sun, D., and Tao, W. (2010). A coupled volume-of-fluid and level set (VOSET) method for computing incompressible two-phase flows. Int. J. Heat Mass Tran. 53, 645–655. doi:10.1016/j.ijheatmasstransfer.2009.10.030
Urbano, A., Tanguy, S., Huber, G., and Colin, C. (2018). Direct numerical simulation of nucleate boiling in micro-layer regime. Int. J. Heat Mass Tran. 123, 1128–1137. doi:10.1016/j.ijheatmasstransfer.2018.02.104
Utaka, Y., Kashiwabara, Y., and Ozaki, M. (2013). Microlayer structure in nucleate boiling of water and ethanol at atmospheric pressure. Int. J. Heat Mass Tran. 57, 222–230. doi:10.1016/j.ijheatmasstransfer.2012.10.031
Yi, T., Lei, Z., and Zhao, J. (2019). Numerical investigation of bubble dynamics and heat transfer in subcooling pool boiling under low gravity. Int. J. Heat Mass Tran. 132, 1176–1186. doi:10.1016/j.ijheatmasstransfer.2018.12.096
Keywords: subcooled boiling flow, wall heat flux, void fraction, interface tracking, volume of fluid and level set
Citation: Ling K, Zhang S, Liu W, Sui X and Tao W (2021) Interface Tracking Simulation for Subcooled Flow Boiling Using VOSET Method. Front. Energy Res. 8:526035. doi: 10.3389/fenrg.2020.526035
Received: 11 January 2020; Accepted: 28 October 2020;
Published: 22 January 2021.
Edited by:
Nejdet Erkan, The University of Tokyo, JapanReviewed by:
Ivo Kljenak, Institut Jožef Stefan (IJS), SloveniaDeqi Chen, Chongqing University, China
Yohei Sato, Paul Scherrer Institut (PSI), Switzerland
Copyright © 2021 Ling, Zhang, Liu, Sui and Tao. This is an open-access article distributed under the terms of the Creative Commons Attribution License (CC BY). The use, distribution or reproduction in other forums is permitted, provided the original author(s) and the copyright owner(s) are credited and that the original publication in this journal is cited, in accordance with accepted academic practice. No use, distribution or reproduction is permitted which does not comply with these terms.
*Correspondence: Ling Kong, bGluZ2tvbmdjc0BtYWlsLnhqdHUuZWR1LmNu