 Jiazi Zhang
 Omar J. Guerra
 Joshua Eichman
 Matthew A. Pellow
- 1National Renewable Energy Laboratory, Golden, CO, United States
- 2Electric Power Research Institute, Palo Alto, CA, United States
The integration of high shares of variable renewable energy raises challenges for the reliability and cost-effectiveness of power systems. The value of long-duration energy storage, which helps address variability in renewable energy supply across days and seasons, is poised to grow significantly as power systems shift to larger shares of variable generation such as wind and solar. This study explores the system-level services and associated benefits of long-duration energy storage on the 2050 Western Interconnection (WI). The operation of the future WI system with 85% renewable penetration is simulated using a two-stage production cost model. The impact of long duration energy storage on systemwide operations is examined for the 2050 WI system, using a range of round-trip efficiencies corresponding to four different energy storage technologies. The analysis projects the energy storage dispatch profile, system-wide production cost savings (from both diurnal and seasonal operation), and impacts on generation mix, and change in renewable generation curtailment.
1. Introduction
In recent years, the penetration of renewable energy in power systems has gradually increased worldwide. In the United States, Renewable Portfolio Standards (RPS) adopted by 33 states and territories facilitates the rapid growth of renewable energy integration over the next 30 years (RPS, 2018). In one prominent example, California signed Senate Bill 100 on September 10th, 2018, which requires 100% renewable penetration by 2045 (SB-100, 2018). Getting to such ultra-high shares of variable renewable energy (VRE) raises more challenges for power systems. To ensure reliable and cost-effective power system operations, more operational flexibility and backup generation capacity is required (Brouwer et al., 2014).
Energy storage is a highly flexible resource, and is a promising option to improve VRE integration. A range of studies have analyzed the potential for energy storage to facilitate higher shares of VRE generation (Denholm and Hand, 2011; Mileva et al., 2016; Denholm and Mai, 2019; Bistline and Young, 2020) Energy storage can provide a series of services to power systems, including energy arbitrage; transmission and distribution congestion relief; investment deferral; demand shifting and peak reduction; spinning and non-spinning reserves; and seasonal energy shifting (Sto, 2014; Akhil et al., 2016). Numerous cost assessments are available for energy storage technologies. For example, Schmidt et al. (2017) and Kittner et al. (2017) focus on future investment costs of energy storage technologies. Other assessments use the levelized cost of storage (LCOS) metric which quantifies the discounted cost per unit of discharged electricity for a specific energy storage technology and application has been proposed and applied to multiple energy storage cost studies (Battke et al., 2013; Pawel, 2014; Zakeri and Syri, 2015; Jülch, 2016; Lai and McCulloch, 2017; Obi et al., 2017; Schmidt et al., 2019; Ziegler et al., 2019).
This study focuses on quantitatively estimating the economic benefit that long duration energy storage can provide to the grid. Existing literature on this topic includes several approaches: 1) analysis of the net load, which is based on demand/supply balance equations used to estimate time periods with overgeneration or insufficient generation of variable renewable energy (Denholm and Hand, 2011; Converse, 2012; Weitemeyer et al., 2015); 2) Research grade mathematical models, which are sets of mathematical formulations coupled with solution algorithms based on hourly chronological basis (Craig et al., 2018) or the chronological system of states framework (Wogrin et al., 2016) used to evaluate the operational and capacity value of grid energy storage technologies (Dvorkin et al., 2018; Tejada-Arango et al., 2018); 3) Modeling platforms (model generators), which are software packages used for production cost modeling and strategic capacity expansion planning of power systems, e.g., PLEXOS (Brouwer et al., 2016), IMRES (de Sisternes et al., 2016), ReEDS (Sullivan et al., 2008), and Switch (Fripp, 2012). Both operational and capacity value associated with grid energy storage can be evaluated using these kinds of tools based either on one year (Cebulla et al., 2017; Scholz et al., 2017) or multi-year (Sullivan et al., 2008; Fripp, 2012) time frames. It is noteworthy that most of the aforementioned studies focus on short duration (12 h or less) energy storage applications. However, a recent study (Converse, 2012) has shown that in a high VRE penetration system, even with sufficient short-duration energy storage devices (generally, less than 10 h of discharge duration), there still will be curtailed energy left in the spring and fall while significant demand left in the summer. This study suggests that long-duration energy storage, which is generally defined as having more than 10 h of discharge duration at rated power, can potentially provide system-wide benefit from seasonal energy arbitrage. Thus, the role of long-duration and seasonal energy storages in large-scale power system operation needs to be fully studied.
In this paper, we focus on understanding the potential benefits that long-duration energy storage technologies can provide to the forecast 2050 Western Interconnection (WI). The operation of the 2050 WI is modeled with 85% renewable penetration level (including large hydro units). Long-duration energy storage technologies is modeled using a range of round-trip efficiencies that correspond to four different energy storage technologies, including hydrogen power-to-gas-to-power (
The contributions of this paper are as follows:
(1) Propose a two-stage optimization model to solve the UC of WI of the entire year in 2050, and hence, evaluate the system-wide benefits provided by long-duration energy storage.
(2) Demonstrate that the four tested long-duration energy storage technologies can all provide benefits and reduce curtailment in the 2050 WI system.
(3) Discuss all types of benefits that long-duration energy storage can provide to power system operations.
(4) Assess the potential types of benefits that can be provided by long-duration energy storage. Results indicate that the system-wide benefits will increase as the energy storage round-trip efficiency increases.
(5) Analyze the diurnal and seasonal economic benefits provided by long-duration energy storage. The findings demonstrate that the diurnal portion of energy storage value is higher than the seasonal portion and seasonal energy storage devices can benefit from both.
(6) Calculate the fraction of curtailed energy used to charge the storage device to distinguish the source of benefits from curtailed renewable energy and other resources. Results show that storage devices do not solely rely on curtailment for charging. Based on different round-trip efficiencies, curtailed energy makes up as low as 34% and up to 56% of the total charging energy.
This study may also benefit regulators, system planners, and investors in making energy storage investment decisions, and in improving the understanding of interactions between energy storage and other power system components.
The remainder of this paper is organized as follows. Section 2 describes the modeled 2050 WI system. Section 3 summarizes the long-duration energy storage model and technology assumptions. Section 4 discusses the types of system-wide benefits, diurnal and seasonal benefits comparison, and benefit sources assessment. Section 5 introduces the two-stage optimization approach to solve the production cost model for 2050 WI with addition long-duration energy storage. Section 6 presents the simulation results for 2050 WI system. Section 7 concludes the paper and proposes future research directions.
2. Western Interconnection Model and Renewable Scenarios
In this paper, we use the Regional Energy Deployment System (ReEDS) tool developed by the National Renewable Energy Laboratory (NREL) to model a simplified WI system which provides detailed generation and zonal-level transmission information. ReEDS is a capacity expansion and dispatch model that relies on system-wide least cost optimization to estimate the type and location of future generation and transmission capacity Eurek et al. (2016). It models scenarios of renewable energies from the target years 2010–2050. Figure 1 illustrates the regional structure of the entire U.S. modeled by ReEDS.
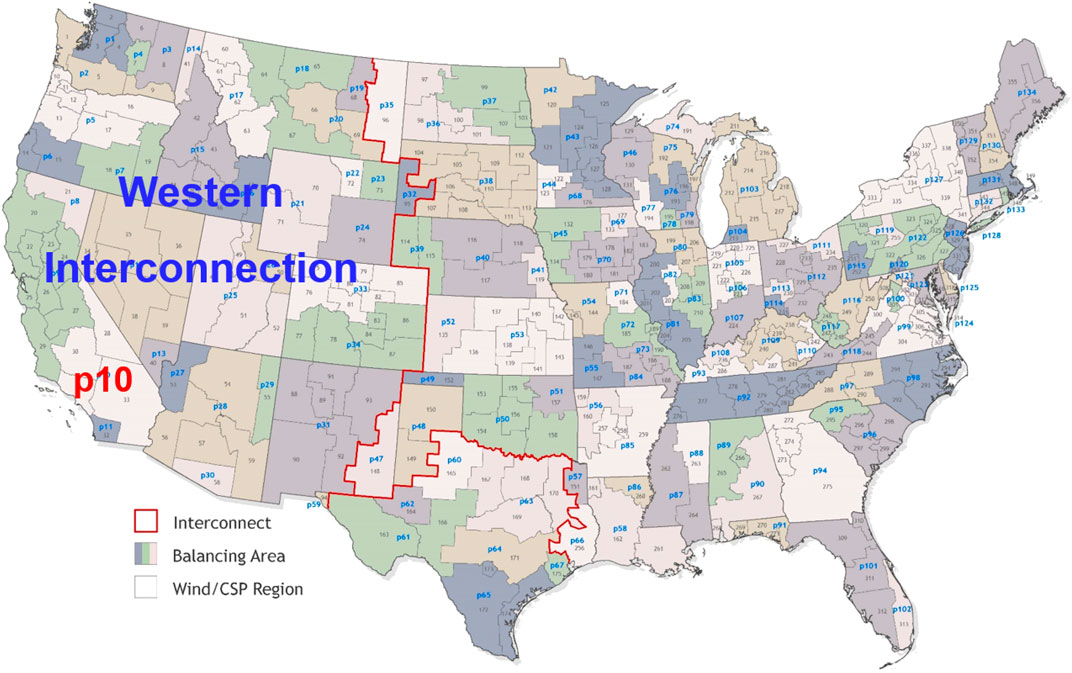
FIGURE 1. Map of regional Energy deployment system structure of the U.S.
In this study, we select the 2050 U.S. WI system with 85% renewable penetration. This model is generated with the 2018 Standard National RPS scenario (Cole et al., 2017; ATB, 2018). We remove regions in Eastern Interconnection and Texas from ReEDS while retaining the 37 regions in the WI, which is highlighted with blue text in Figure 1. We use PLEXOS medium-term (MT) and short-term (ST) schedules optimizations to chronologically solve the entire year UC problem of the 2050 WI system on an hourly basis. In the following sections, we denote this operation dispatch as the baseline scenario. Table 1 summarizes the total installed capacity, annual total and peak loads of the 2050 WI system as well as the renewable penetration, annual system operation costs (denoted as annual system costs hereinafter) and curtailment of the baseline scenario. The generation mix and installed energy storage capacity in 2050 are illustrated in Figures 2 and 3, respectively.

TABLE 1. Comparison of annual renewable penetration, load, system cost, and curtailment of the 2050 western interconnection system.
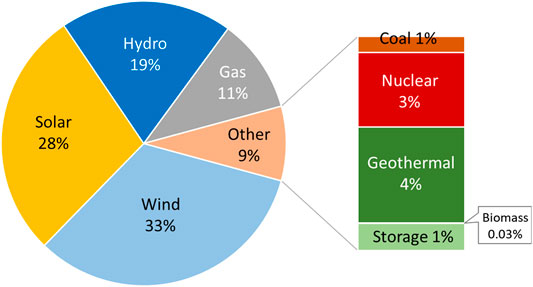
FIGURE 2. Generation mix of western interconnection (WI) in 2050.
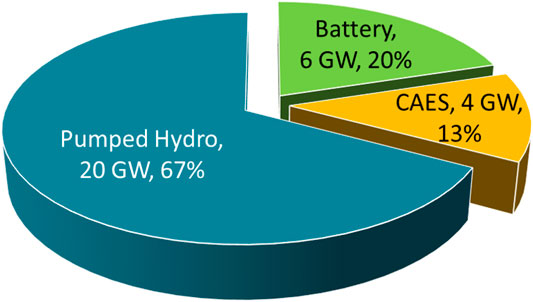
FIGURE 3. Installed energy storage capacity of WI in the 2050 baseline scenario.
3. Model of Long-duration Energy Storage
In this study, we install a long-duration energy storage device in the Southern California region (“p10” in Figure 1). The Southern California region has high electricity demands coupled with a significant deployment of VRE, substantial regional interconnection, and favorable policies for emerging technologies. Therefore, the opportunities for long-duration energy storage to provide multiple types of benefits in this region are higher.
Note that in this study, We use the pumped storage object model in PLEXOS, as shown in Figure 4, to model all the four types of long-duration energy storage technologies and only highlight the most important impact factor, i.e., the round-trip efficiency to distinguish them. The following components are included in a pumped storage object model:
• A lower elevation reservoir (denoted as tail storage). We use
• A higher elevation reservoir (denoted as head storage). The head storage volume at t and maximum head storage volume are represented with
• A generator with both generating and pumping modes connected to the two reservoirs. The generator will pump water from the tail storage to the head storage during the energy charging mode and release the stored water from head storage through turbines to tail storage to generate power in energy discharging mode. We let
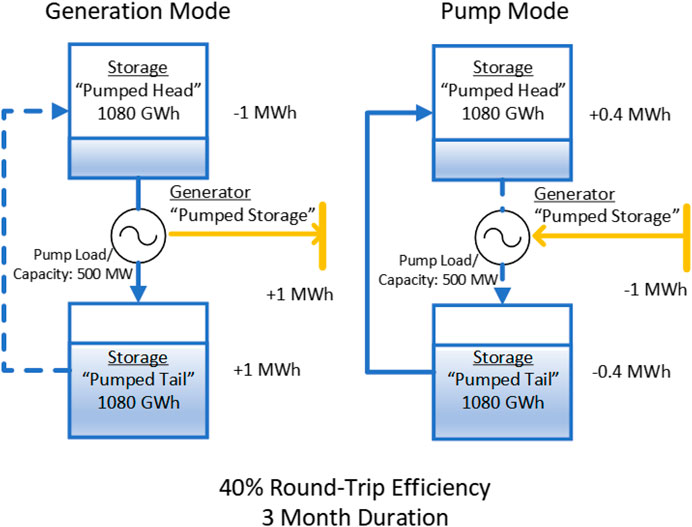
FIGURE 4. Pumped storage object model considering a 40% round-trip storage efficiency PLE (2018).
The constraints of long-duration energy storage model studied in this paper are as follows:
The relationship of head (or tail) volume with generator output and pump load is modeled in 1. Equation 2 ensures that the water is recycled between the two storages. In (3), we force the head storage volume to be balanced during the studied time period to avoid the impact of the initial volume to operation results.
In this paper, we model four long-duration energy storage technologies, including H2 P2G2P, CAES, FB, and PHS storages. The technology description, round-trip efficiency assumption, advantage, and disadvantage of each energy storage technology are summarized in Table 2.
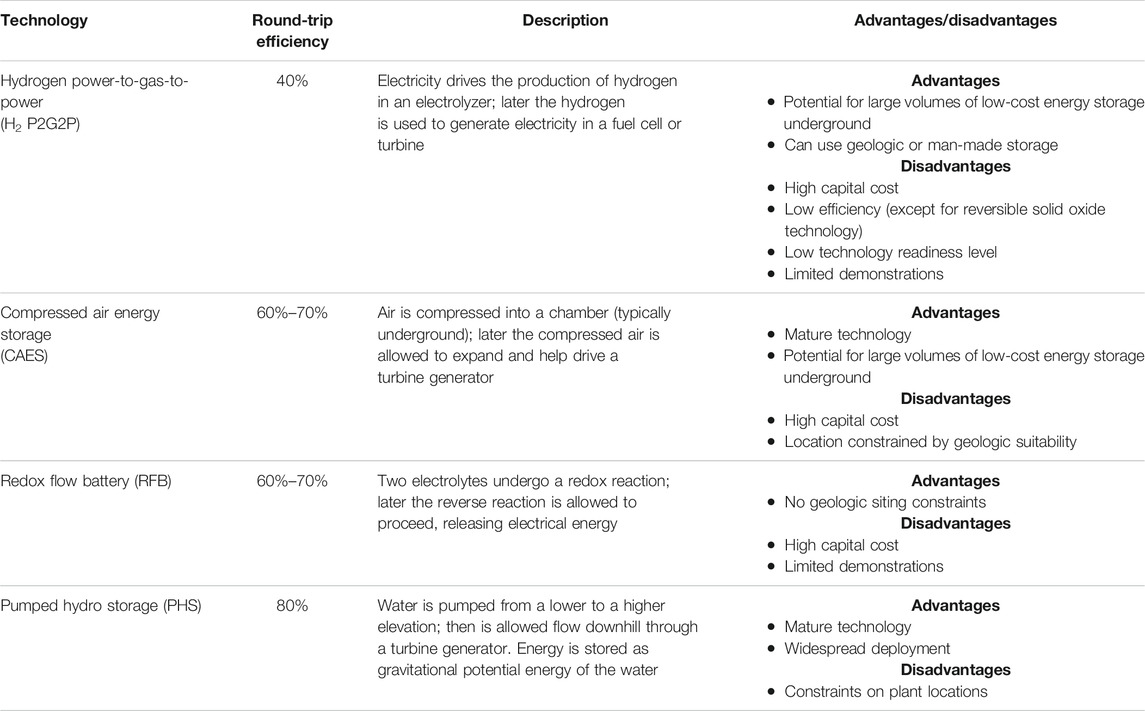
TABLE 2. Summary of long duration energy storage technologies considered in this study.
4. Potential Benefits Provided by Long-Duration Energy Storage
In this section, we discuss the potential benefits that long-duration energy storage can provide from three dimensions: 1) system-wide benefit components, 2) the comparison of diurnal and seasonal benefits, and 3) the comparison of benefits from mitigating curtailment of VRE and other sources.
4.1. System-Wide Benefits
Long-duration energy storage can provide multiple benefits to power systems, including time-shifting energy supply through price arbitrage, reducing startup and shutdown cost, improving generator efficiency, providing ancillary services, managing transmission congestion, providing firm capacity, deferring transmission or distribution investment, and providing resilience support. In this subsection, we will detail each component of system-wide benefits and highlight the unique advantages of long-duration energy storage technologies in providing such benefits.
4.1.1. Energy Arbitrage
Energy storage, which can serve as both generator and load, can arbitrage energy by charging during periods of low energy price (excess production) and generating during periods of high price (high demand). The impacts of energy arbitrage manifest themselves in a variety of ways, such as absorbing otherwise curtailed energy from VRE, shifting load from peak to off-peak periods, and taking advantage of price fluctuations.
For short-duration energy storage, this value occurs across several hours. It captures the characteristics of daily peak/off-peak load, as well as wind and solar production. Long-duration energy storage can shift energy over longer durations, such as from the weekend (low demand) to weekdays (high demand), or even seasonally from spring and winter (high renewable curtailment) to summer (high demand).
4.1.2. Generator Efficiency Improvements
Energy storage can improve the efficiency of gas generators by adjusting their operating setpoint. Conventional natural gas combustion-turbine (NGCT) and natural gas combined-cycle (NGCC) generators have an efficiency curve that rapidly falls for part-load conditions. Energy storage can be used to adjust the part-load point of these generators to reduce overall fuel usage and, in turn, the system-wide fuel cost.
4.1.3. Startup and Shutdown Cost Reduction
The startup and shutdown cost reduction comes from mitigating the startup or shutdown of a generator. A full plant startup or shutdown for gas, coal, and nuclear plants can be expensive. For the 2050 WI system, the average cost for all the installed units per start is $2,000 for NGCT generators, nearly $30,000 for NGCC generators, over $12,000 for coal units, and nearly $100,000 for nuclear units.
4.1.4. Ancillary Services
Energy storage can provide a variety of ancillary services including regulation, spinning, non-spinning, and supplemental reserves, voltage support, black start, load following/ramping support for renewable energy, and frequency response (Akhil et al., 2016; Balducci et al., 2018). Moreover, for a fossil fuel or nuclear generator to provide ancillary services, the generator must typically reduce its load point and leave additional capacity unused. The efficiencies of these generators can fall significantly for part-load operation; thus, there is a direct fuel cost for operating at part-load conditions, and there is an opportunity cost for electrons that could otherwise be generated. Energy storage has the potential to provide lower marginal cost for producing these services, and as a result, this represents an opportunity to reduce system costs.
4.1.5. Congestion Management
Transmission congestion occurs when the least-cost energy cannot be delivered due to insufficient transmission capacity for energy delivery. It may result in extremely high congestion costs in some cases. Energy storage, when installed at proper locations, can charge energy during non-congested time periods and serve as less expensive local resources to reduce peak transmission capacity requirements (Akhil et al., 2016). The potential high congestion costs can then be avoided. Besides serving as local resources, long-duration energy storage if installed at electrically congested upstream buses, can provide energy to demands via counter flow to further relieve congestion.
4.1.6. Transmission/Distribution Deferral
Energy storage can be used to provide the incremental capacity to defer the need for investment in both transmission and distribution equipment. Former study (Akhil et al., 2016) has shown that even installing a small amount of energy storage in some cases can delay or avoid investment in transmission upgrades for a few years. Besides the investment deferral, energy storage can also help extend the life of the existing equipment by reducing loading, especially for aging transformers and underground power cables (Akhil et al., 2016). With more available energy, long-duration energy storage can provide capacity to nearly overloaded systems for longer periods than short-duration storage and reducing the burden on existing equipment more frequently. Thus, it can potentially defer the transmission/distribution upgrade investment for even longer time periods.
4.1.7. Capacity Value of Energy Storage
Energy storage units are able to contribute to system capacity by discharging during peak load times. Long-duration energy storage is assumed to achieve a full capacity credit since the duration for most capacity events is several hours, and all of the energy storage devices explored can provide power for a sufficient amount of time to be eligible for the credit (Sioshansi et al., 2014; Denholm and Margolis, 2018).
4.1.8. Resiliency Support
With longer energy availability, there is a potential for long-duration energy storage to provide resilience support and mitigate unexpected extreme events lasting several days. Since the loss of load value is extremely high and continues to increase, the resilience benefit provided by long-duration energy storage can be significant.
4.2. Diurnal vs. Seasonal Benefits
As stated in Section 4.1, long-duration energy storage can provide system-wide benefits in both diurnal and seasonal manners due to longer energy availability. Inspection of projected hourly net load and LMP data across a full year can highlight opportunities for long-duration arbitrage. Figures 5A,B show the hourly net load and LMP data p10 of the baseline scenario (without long duration energy storage). From Figure 5A, we can observe that there are a large number of operation hours in spring and summer with negative net loads. That is, the VRE generation is greater than the actual load during this time period. The LMP curve in Figure 5B, where the zero LMP occurs mostly during the spring and summer seasons, also illustrates the times of negative net load. To better distinguish the diurnal and seasonal benefit opportunities, we summarize the statistical results of operation hours with negative net load and zero LMPs among different time periods in each day and each season in Table 3.
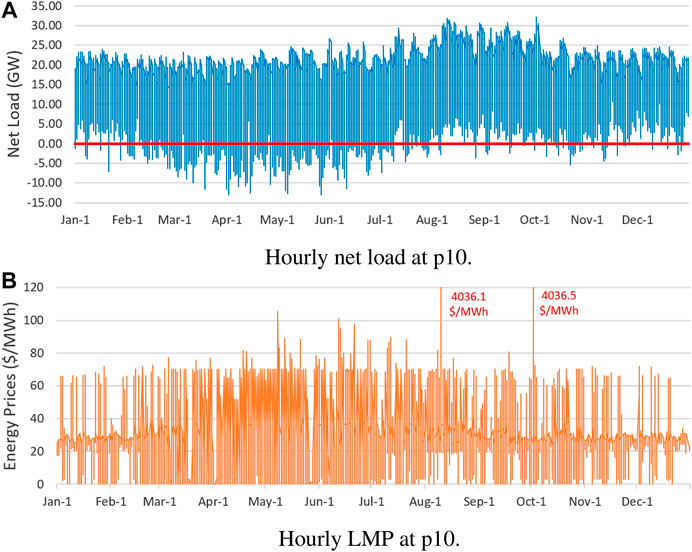
FIGURE 5. Illustration of the hourly net load and locational marginal prices at p10 of the baseline operation in the 2050 WI. The red line in (7a) indicates zero net load, i.e., the electricity demand is equivalent to variable renewable energy availability.
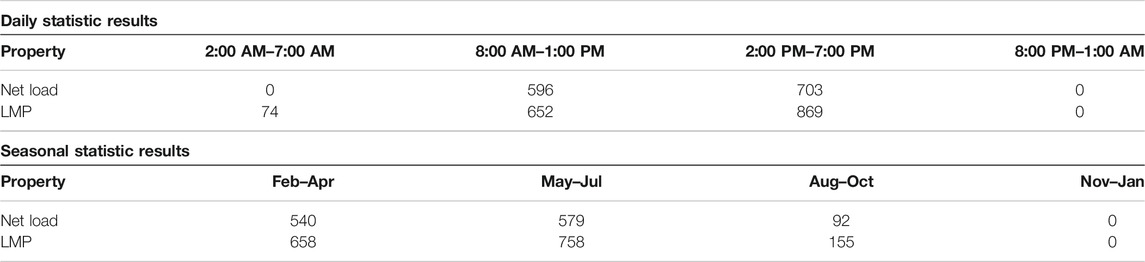
TABLE 3. Daily and seasonal statistic results of number of hours of negative net load and zero LMPs.
From the results, we can see that considering daily operation perspective, the excess renewable energy and zero LMPs occur more frequently during the morning and afternoon. While from seasonal operation perspective, they occur more often during spring and summer.
To distinguish between diurnal and seasonal benefits of long-duration energy storage, we introduce a series of short-duration energy storage scenarios where the storage power capacity and round-trip efficiencies are the same as that of the long-duration energy storage, but the energy duration is modeled as 8 h. We assume the short-duration energy storage scenario can approximately capture the diurnal benefits of the long-duration energy storage. The remaining system-wide benefit is taken as the marginal value of seasonal (rather than diurnal) energy storage system benefit values.
4.3. Benefits From Curtailment Mitigation vs. Other Sources
When discussing the potential for long-duration energy storage in a high renewable energy share system, it is often assumed that much of the charging energy would come from curtailed renewable energy because it is provided at a very low cost. While that argument makes intuitive sense, there are many other valuable uses for the energy storage, as stated in Section 4.1 that create sufficient value to warrant that the energy storage device charge from sources other than excess renewable generation.
To clearly distinguish between the long-duration energy storage benefits from mitigating VRE curtailment and other sources, we propose a metric called the curtailment capacity factor (denoted as γ) to evaluate the portion of absorbed curtailed energy compared to all charging energy.
This is computed as the total VRE curtailment reduction over the total additional long-duration energy storage charging load, see 4.
5. Methodology
To capture the necessary seasonal behavior, we use a production cost model to optimize the entire year day-ahead (DA) UC of WI in 2050 with hourly resolution. One of the main strengths of using a production cost model (PCM) to determine system benefit is the ability to capture many of the operational benefits that a device can provide. This typically represents the maximum value achievable. On a real system, devices may not be able to collect all the value identified by the production cost modeling. For instance, in a modeling environment, when an energy storage device added to a system mitigates a gas generator startup or shutdown event, we can track the change and attribute the impact to the storage device. However, on a real system, it is not always possible to attribute the value of that occurrence to the energy storage device. Even if the mitigation can be attributed to the energy storage resource, the system-wide production cost goes down, but the gas generator is not obligated to pay the energy storage. Rather, the system is minimizing the cost, as it should. The production cost includes a variety of potential system benefits. These value streams are calculated as the avoided production cost relative to a baseline scenario in which long-duration energy storage is added to the system. There is often overlap among categories and trade-offs that the optimization model must make between these categories to achieve the lowest cost.
The object of the PCM is to minimize the sum of fuel cost, startup and shutdown cost, and variable operation and maintenance (VO&M) cost subject to multiple power system physical, security, and reliability constraints. Solving WI UC across timescales ranging from one year to 1 h in a computationally efficient manner brings challenges. To address this problem, we adopt a two-stage optimization approach illustrated in Figure 6. The first stage is to optimize the energy storage operational profile over a year by using a fixed price optimization tool, i.e., the Revenue Operation and Device Optimization (RODeO) (Eichman et al., 2016) model. RODeO is an open-source tool developed by NREL that uses mixed-integer linear programming to maximize energy storage revenue by performing price arbitrage across the year. In this study, the locational marginal price (LMP) at p10 of the baseline scenario is used as the price arbitrage signal in RODeO. Note that the revenues from ancillary service, capacity, and demand response products are not considered here. The resulting optimal energy storage operation profile is decomposed to daily energy storage state of charge (SOC) targets and passed to the second stage. In the second stage, we use PLEXOS ST schedule to perform the entire year chronological UC under the constraints of daily SOC targets. The PLEXOS ST schedule solves the entire year UC chronologically as 365 steps. An additional one-day look-ahead is included in each step with a 4-h resolution.
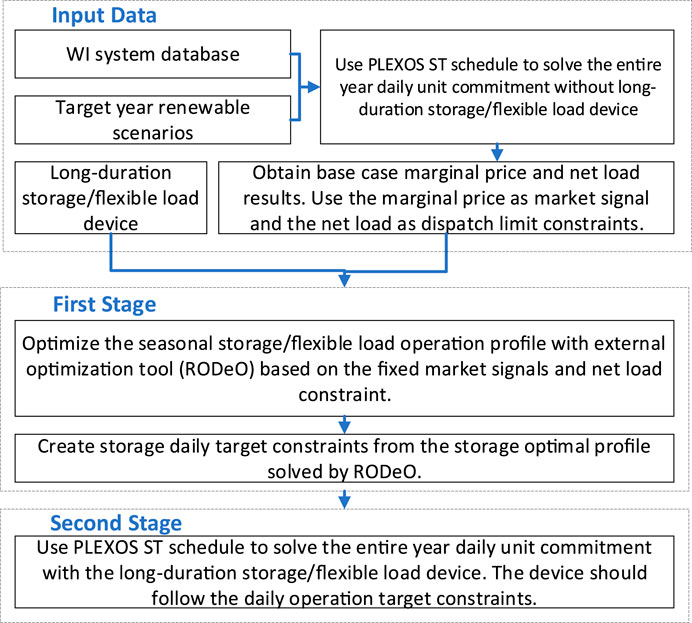
FIGURE 6. Simplified flowchart of the two-stage price-taker model.
One of the challenges with using a price-taker model in the first stage is that the model will try to maximize revenue without accounting for other system constraints. Testing has demonstrated that RODeO always over-optimizes the benefit by taking advantage of excess renewable energy but often will try to consume more excess renewable energy than is available. This issue results in an overly aggressive device dispatch profile. Such a profile will unnecessarily increase costs of generators in the PLEXOS ST schedule, which in turn, reduces the annual system benefits. To address this problem, we introduce an additional constraint 5) in the price-taker model to ensure that the energy storage only charges (pumping load) when there is excess renewable energy, i.e., the net load
This prevents the PCM from specifying an unrealistic situation in which the long duration energy storage resource charges using energy from a fueled generation source or another (short duration) energy storage resource. The result produces an energy storage profile that, while not yet optimal, has a shape that will maximize device benefit from absorbing curtailed energy (Figure 7A).
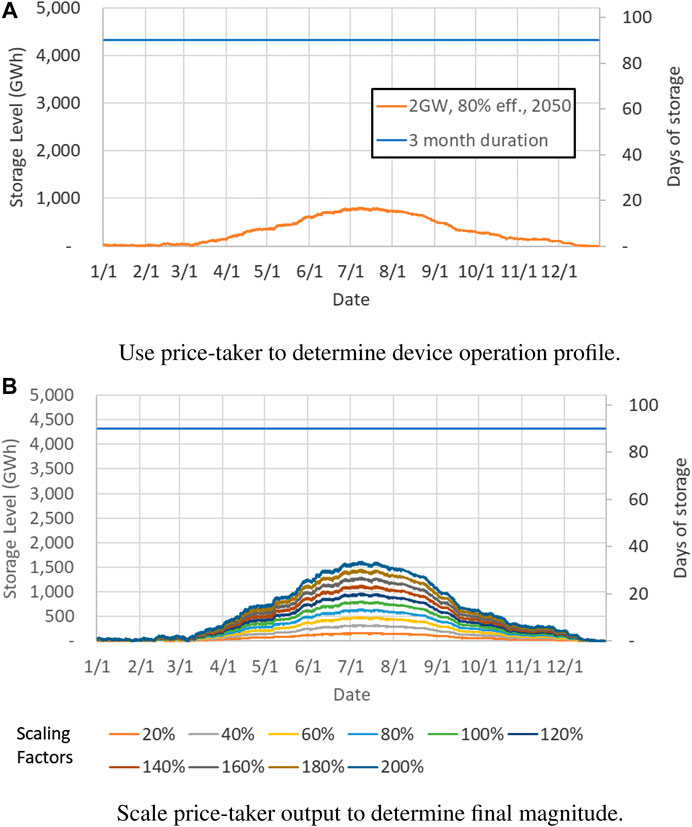
FIGURE 7. Illustration of the price-taker duration representation with scaling factors for the energy storage with 2 GW capacity and 80% efficiency.
With an appropriate shape, we then scale the device dispatch profile by multiplying by different scaling factors, see Figure 7B. The range of scaling factors are selected to ensure that a maximum value is found within the range. In this study, we consider the scaling factors from 10% to 120% for 40% round-trip efficiency energy storage, and 10–200% scaling factors for 60, 70, and 80% round-trip efficiencies energy storage with 10% increment. Note that, the scaling down factors (
The actual energy storage duration is re-computed after solving the second stage PLEXOS ST with the daily device targets decomposed from the scaling operation profile as follows:
where the
In addition, the schedules of dynamically dispatching hydroelectric generators can make it difficult to isolate the value of long-duration energy storage. To alleviate this issue, hydroelectric generation profiles are fixed to match the baseline scenario.
Note that this methodology has limitations. Therefore, not all system-wide benefits discussed in Section 4 can be accurately assessed here. The benefits that can be captured by this methodology are discussed here:
• Energy arbitrage: The system benefits resulting from energy arbitrage are the reduction of both fuel and VO&M costs in the production cost model. Note that since we only model day-ahead operation in the proposed production cost model, the energy arbitrage benefits from day-ahead to real-time price fluctuations are not considered in this study.
• Generator efficiency improvements: As with the energy arbitrage benefit, this benefit manifests as the avoided fuel cost.
• Startup and shutdown cost reduction: This benefit is captured by the reduction of startup and shutdown costs in the production cost model.
• Ancillary service: The two-stage methodology proposed here is used to solve the production cost model of the WI system with an hourly resolution for an entire year. Therefore, we only evaluate the energy storage benefits from flexibility, regulation, and spinning reserves. Since the reserve constraints are not included in the first-stage energy storage operation profile optimization, these benefits would be underestimated in this study.
Benefits from transmission congestion management, transmission or distribution deferral, capacity values, and system resiliency support cannot be assessed due to the following limitations:
• Transmission congestion management: Evaluating the congestion management benefits requires comparing the congestion costs of baseline and long-duration energy storage installed operation on a nodal-level test system. However, the transmission system of the 2050 WI system studied here is aggregated to the zonal level. Therefore, congestion management benefits cannot be evaluated in this study.
• Transmission or distribution deferral: In this study, this value stream is not included in the simulation results. System capacity expansion is performed by ReEDS, and the resulting ReEDS database is then run in PLEXOS. As a result, the transmission and distribution system expansion is not done in the proposed two-stage production cost model, meaning that the value for deferring transmission or distribution investment cannot be internalized using this method.
• Capacity values: This value cannot be captured by the production cost model. However, we have fully assessed the capacity values provided by long-duration energy storage in Guerra et al. (2020).
• Resilience support: In this study, we only simulate normal system operation conditions and scheduled system maintenance. Resilience support is computed as the avoided system loss considering extreme events. Therefore, the resilience support provided by long-duration energy storage is not captured in the results.
We use PLEXOS 7.4 R2 on a Windows workstation with 192 GB of RAM and 3.0-GHz processors to execute all scenarios. The solver utilized in PLEXOS is Xpress-MP.
6. Numerical Results
In this section, we examine the projected operation of long-duration energy storage in the 2050 WI system. The properties of all scenarios simulated in this section are summarized in Table 4. It details the 12-months state-of-charge profiles for a long-duration energy storage device determined by the grid simulation procedure described in Section 5.
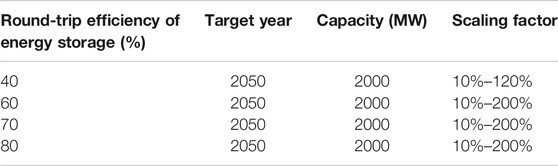
TABLE 4. Summary of tested scenarios.
Each deployment scenario models the impacts of a 2,000 MW energy storage resource (equivalently considered as multiple smaller resources with identical behavior), interconnected in the p10 region. This is not meant to represent a proposed realistic deployment but is rather an idealized scenario to provide an approach by which to incorporate grid interactions while probing the relative costs and benefit of various alternative technologies.
6.1. Two-Stage Model Validation
Here we validate the two-stage optimization structure proposed in Section 5. To this end, we illustrate the first stage energy storage SOC profile solved by RODeO and the second stage energy storage end volume curves provided by PLEXOS in Figure 8. The energy storage in this example has 40% round-trip efficiency and 2,000 MW capacity with 100% profile scaling factor.
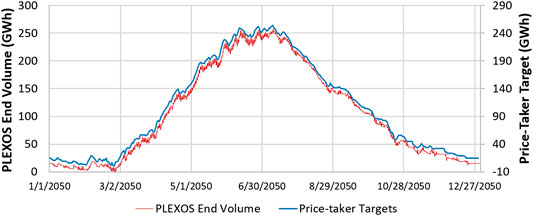
FIGURE 8. Price-taker targets and PLEXOS ST energy storage end volumes comparison for a 2,000 MW, 40% round-trip efficiency, and 1-month duration energy storage device in 2050.
It can be seen that the seasonal operation of the long-duration energy storage is determined in the first stage and then followed by the second stage. This result validates that within the two-stage optimization structure, long-duration energy storage can be dispatched optimally across the year by PLEXOS.
6.2. Device Operation Profile Associated with Maximum System Annual Benefits
In this subsection, we aim to understand the energy storage operation profiles that can result in the maximum annual benefits. The performance evolution of energy storage with different efficiencies are fully studied. These scenarios show the most valuable energy storage durations within the set of values tested.
First, we evaluated what energy storage duration (i.e., power-to-energy ratio) provides the greatest systemwide benefit. Durations ranging from one day to one month were analyzed (represented in the model using different scaling factors). This analysis is shown in Figure 9. The maximum benefit value is highlighted with a red circle. This figure highlights the reason for the method described in Section 5. It was not possible to predict the scaling value that results in the maximum benefit, and the range of system benefit for different scaling values is significant, so each value had to be examined.
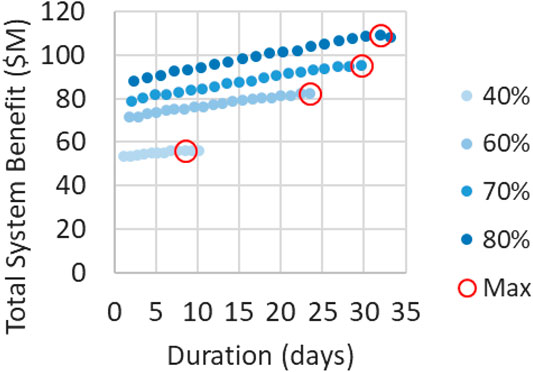
FIGURE 9. Summary of annual system benefits and durations associated with different energy storage round-trip efficiencies.
The maximum annual system benefit values and durations associated with each round-trip efficiency are summarized in Table 5. Note that we round the duration in days to the next integer values. Overall, both the annual system benefit and optimal duration for energy storage will increase with higher round-trip efficiency.
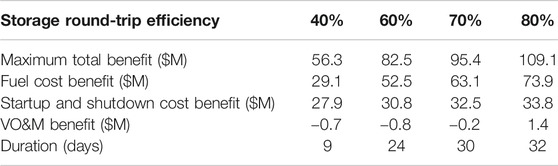
TABLE 5. Summary of energy storage maximum benefit and duration for each round-trip efficiency.
Next, we determined the dispatch profile for the long duration energy storage resource. Figure 10 demonstrates the fill profile for the energy storage resource with different round-trip efficiencies in 2050. Notice that the energy storage system fills during the spring when there is excess renewable generation, including hydro, and begins discharging during the summer months. This profile is similar to that of the underground storage of natural gas, which fills during the spring and summer and empties during the fall and winter: however, seasonal energy storage is shifted, so withdrawals occur earlier than for natural gas. Overall, the maximum usage of energy storage capacity increases as energy storage round-trip efficiency increases.
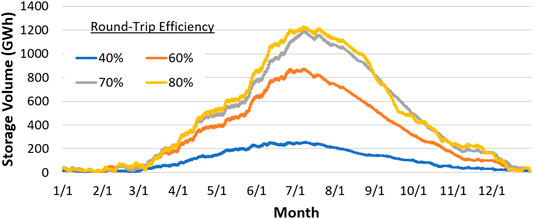
FIGURE 10. 12-month fill profile for a 2,000 MW energy storage resource with 40%, 60%, 70%, and 80% round-trip efficiencies and 9-day (0.43 TWh), 24-day (1.15 TWh), 30-day (1.44 TWh), and 32-day (1.54 TWh) discharging, respectively.
To more clearly show the daily and seasonal behavior of energy storage device and its relationship with received price, Figures 11 and 12 show the daily average and monthly average power profiles for the charging and discharging for a 2,000 MW energy storage system with 40% round-trip efficiency and 1-month of energy storage capacity, together with the average wholesale price experienced by the energy storage system.
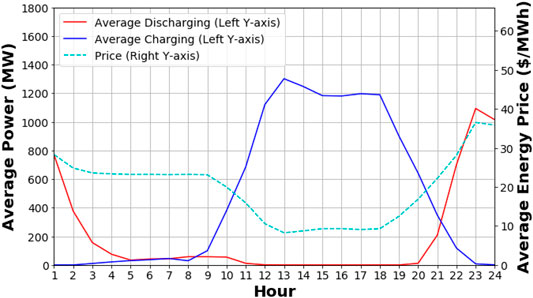
FIGURE 11. Average daily discharge (generation), charging, and received price profiles for a 2,000 MW, 40% round-trip efficiency, and 1-month duration energy storage device in 2050.
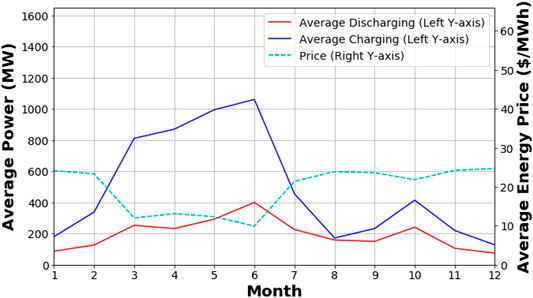
FIGURE 12. Average monthly discharge, charging, and received price profiles for a 2,000 MW, 40% round-trip efficiency, and 1-month duration energy storage device in 2050.
Figure 11 illustrates that the daily average energy price in the afternoon is lower than the rest of the day, largely due to the high solar production. Thus, the charging load is found to be concentrated during this period. In the evening and early morning hours, the average price is relatively higher, which in turn, results in the concentrated discharging behavior. Seasonally, the average energy price is lower during spring and higher during the other seasons (Figure 12). This is caused by relatively low demand and high production from wind, solar, and hydro in the spring. Therefore, the charging load is concentrated in the spring, and the discharging is concentrated in the winter. That does not mean that there is no need for generation in the spring or summer. Given the diurnal nature of solar and load, there are still needs in all seasons for the generation to reduce peak load, limit generator startups, etc.
6.3. System-Wide Benefit Analysis
In this subsection, the system-wide benefit components for each long-duration energy storage scenario are fully assessed. The energy arbitrage and generator efficiency improvement benefits are captured by the fuel and VO&M costs reduction. The startup and shutdown cost reduction demonstrates the startup and shutdown reduction benefits. These values are detailed in Table 5 and Figure 13. Overall, as the energy storage round-trip efficiency increases, both the total benefits and each benefit component increases. The round-trip efficiency increase has more impact on fuel cost reduction than startup and shutdown cost reduction.
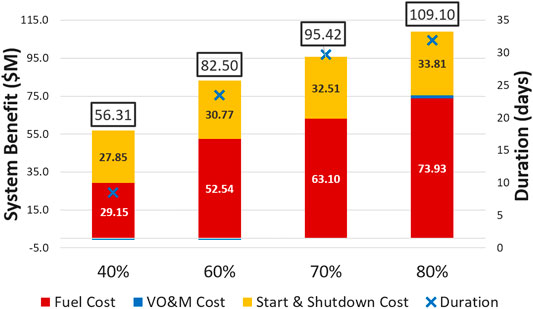
FIGURE 13. Annual system benefits including fuel, VO&M, and startup and shutdown cost reduction associated with the maximum benefit long-duration energy storage including energy storages with (A) 40% round-trip efficiency and 9-day duration, (B) 60% round-trip efficiency and 24-day duration, (C) 70% round-trip efficiency and 30-day duration, and (D) 80% round-trip efficiency and 32-day duration.
When long duration energy storage is introduced in the WI system, the overall generation mix changes. These generation mix changes are illustrated in Figure 14. Overall, the operation of the long-duration energy storage will reduce the generation from gas generators and existing short-duration energy storage units. The generation from geothermal, wind, solar, coal, and hydro generators increase with the operation of the long-duration energy storage. This trade-off between gas and coal results from the fuel price assumption in the model. The average fuel price for coal is $1.80/MMBtu ($1.71/GJ), while gas is $3.15/MMBtu ($2.99/GJ). That means even though gas units have higher efficiency and greater flexibility, if storage is able to accommodate the limited flexibility of coal, then the system will focus on using storage to support greater amount of lower fuel cost coal generation. This findings are consistent with former work (Eichman et al., 2015). It can be seen that the total generation increases as the round-trip efficiency increases.
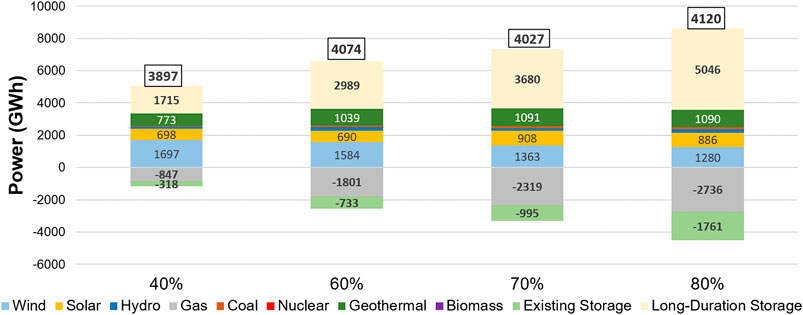
FIGURE 14. The annual generation mix changes associated with the maximum benefit long-duration energy storage including energy storages with (A) 40% round-trip efficiency and 9-day duration, (B) 60% round-trip efficiency and 24-day duration, (C) 70% round-trip efficiency and 30-day duration, and (D) 80% round-trip efficiency and 32-day duration.
The systemwide economic benefits from providing ancillary services, including flexibility, regulation, and spinning reserve, are summarized in Figure 15. To identify these values, we model a series of scenarios in which the energy storage capacity, round-trip efficiency, and operation profile (second-stage target constraints) remain the same, but allow the long-duration energy storage to provide flexibility, regulation, and spinning reserves in the second-stage production cost model. The reserve benefits can then be computed as the benefit difference between the scenario with long-duration energy storage providing reserve support and without providing reserve support. Comparing the results in Figures 13 and 15, it can be seen that the reserve benefits are much smaller than those of energy arbitrage, generator efficiency improvement, and startup and shutdown reduction. While not likely to change significantly, these values are underestimated in this study, as mentioned in Section 4.1, since the reserve constraints are not formulated in the first-stage of the optimization where the device operation profile optimization occurs. For future work, the first-stage price-taker model could be improved to take the ancillary service support constraints into consideration.
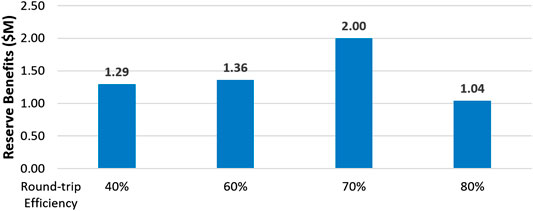
FIGURE 15. The annual benefits from providing ancillary services including flexibility, regulation, and spinning reserves associated with the maximum benefit long-duration energy storage with 40, 60, 70, and 80% round-trip efficiencies.
6.4. Diurnal vs. Seasonal Benefits Analysis
In this subsection, we compare the benefits provided by the diurnal operation of long duration energy storage (over periods of up to eight hours) compared to operation across longer time periods (9–32 days depending on round trip efficiency; see Table 5). As described in Section 4.1, we introduce a series of short-duration storage scenarios to identify the diurnal benefits. In these scenarios, the additional energy storage placed in p10 has a capacity of 2,000 MW and 8-h duration. The round-trip efficiencies are also modeled as 40, 60, 70, and 80%. The system-wide benefits are computed as the avoided costs from these scenarios compared with the baseline scenario. The seasonal benefits of the long-duration energy storage scenarios can then be considered as the remaining system-wide benefits apart from the diurnal values. The diurnal and seasonal benefits comparison results are shown in Figure 16.
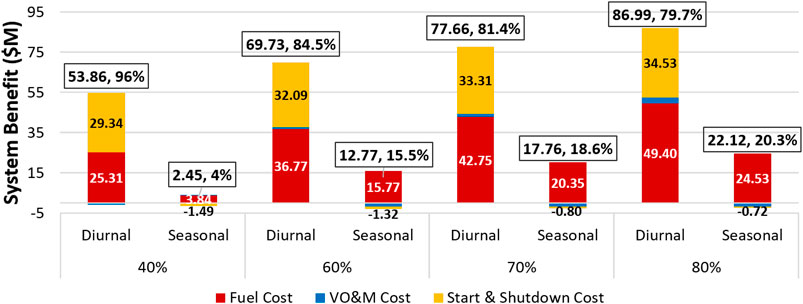
FIGURE 16. The annual diurnal and seasonal benefits comparison (value and percentage of the total system benefit) associated with the maximum benefit long-duration energy storage scenarios in 2050 WI system including energy storages with (A) 40% round-trip efficiency and 9-day duration, (B) 60% round-trip efficiency and 24-day duration, (C) 70% round-trip efficiency and 30-day duration, and (D) 80% round-trip efficiency and 32-day duration.
From these results, it can be seen that the energy storage device receives a large fraction of benefit from diurnal operation and only a small fraction from seasonal operation. In addition, most of the seasonal benefits come from fuel cost reduction. As the round-trip efficiency increases, both the diurnal and seasonal benefits increase. The portion of seasonal benefits in the total benefits gradually increases along with the round-trip efficiency increase. Notably, benefits from mitigating startup and shutdown costs can be achieved with short- or long-duration storage and thus the benefit shows in the diurnal benefit bars.
6.5. Curtailment Mitigation vs. Other Sources Benefits Analysis
In this subsection, we compare the portion of benefits result from renewable energy curtailment mitigation and other sources. Figure 17 shows the share of energy used to charge the long duration energy storage resource that comes from otherwise curtailed VRE, i.e., the curtailment capacity factor γ defined in Section 4.3. Figure 17 also shows the renewable energy curtailment reduction value for each scenario are illustrated. These results show that renewable energy curtailment reduction slightly reduces as the round-trip efficiency increases. While the total curtailment reduction slightly decrease with increasing efficiency, the share of charging energy from otherwise curtailed VRE decreases more significantly. This indicates that the storage resources are generally absorbing as much curtailment as possible, but higher efficiency resources are able to target more opportunities for arbitrage, and startup and shutdown cost reductions. This is supported by the increase in power generation by the long-duration resource for higher efficiencies shown in Figure 14. Also the resulting values for the share of charging energy from otherwise curtailed VRE show that, independent of the round-trip efficiency, long-duration energy storage operators should focus on more than just using otherwise curtailed energy.
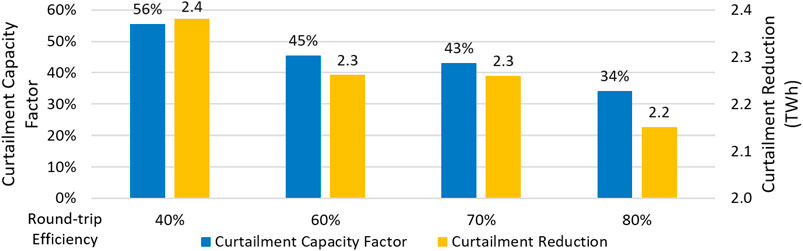
FIGURE 17. The share of charging energy from otherwise curtailed variable renewable energy and curtailment reduction values associated with the maximum benefit long-duration energy storages including energy storages with (A) 40% round-trip efficiency and 9-day duration, (B) 60% round-trip efficiency and 24-day duration, (C) 70% round-trip efficiency and 30-day duration, and (D) 80% round-trip efficiency and 32-day duration.
6.6. Impact of Long-duration Energy Storage on CO2 Emissions
The impact of the long-duration energy storage on reducing CO2 emissions are evaluated in this subsection. The objective of the production cost optimization is to minimize operating cost. Without a cost associated with emissions production, the system is not incentivized to reduce emissions; however, there is a natural reduction as the renewable penetration increases and less fossil generation is used. The CO2 emission reduction results associated with each energy storage scenarios is illustrated in Figure 18. Overall, as the energy storage round-trip efficiency increases, the entire system CO2 emission will reduce. These results are consistent with the generation mix change results in Figure 14.
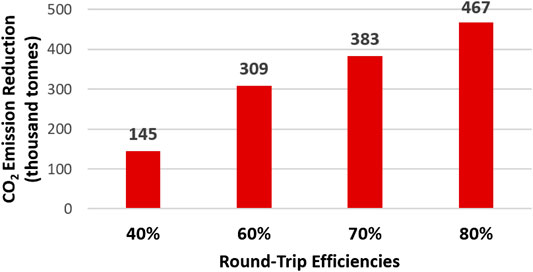
FIGURE 18. Annual CO2 emission reduction associated with the maximum benefit long-duration energy storage including energy storages with (A) 40% round-trip efficiency and 9-day duration, (B) 60% round-trip efficiency and 24-day duration, (C) 70% round-trip efficiency and 30-day duration, and (D) 80% round-trip efficiency and 32-day duration.
7. Conclusion
This analysis estimates the value of long duration energy storage to electric grid operations in a projected 2050 U.S. Western Interconnect system that has 85% renewable penetration. A range of energy storage round-trip efficiencies is considered, corresponding to a range of energy storage technologies (hydrogen power-to-gas-to-power; compressed air energy storage; redox flow batteries; pumped hydro storage). A two-stage optimization structure is proposed to optimize the entire year operation of the 2050 WI system with long-duration energy storage. The services that long-duration energy storage can provide to power system operation, as well as the associated system-wide economic benefits are fully studied.
Overall, the analysis projects that long duration energy storage can provide economic benefits to system-wide operation, resulting mainly from avoided fuel costs and avoided startup and shutdown costs for thermal generating units. Energy storage technologies with higher round-trip efficiency result in greater system-wide benefit, and also a higher share of this benefit that results from shifting energy across periods longer than eight hours.
The majority of benefits result from shifting energy across periods of eight hours or less (80–95%, depending on round trip efficiency). For an energy storage resource with 80% round trip efficiency, avoided fuel costs account for about 70% of economic benefit (avoided startup and shutdown costs account for the remainder), and 86% of benefits result from shifting energy across periods of eight hours or less.
The analysis also tested the common assumption that long duration energy storage operating in a grid with high renewable share will enable the use of renewably generated energy that would be curtailed (spilled) in the absence of such an energy storage resource. In contrast to this assumption, the hourly least-cost simulations in this analysis project that only a modest fraction of the energy used to charge a long-duration energy storage resource would come from renewable generation that would otherwise have been curtailed. For an energy storage resource with 80% round-trip efficiency (such as pumped hydro storage), 34% of total charging energy is projected to come from otherwise curtailed renewable generation. For an energy storage resource with 40% round-trip efficiency (such as hydrogen power-to-gas-to-power), the projected share is 56%.
Future work will include 1) provide a full cost-benefit analysis of long-duration energy storage technologies by comparing energy storage costs to the systemwide benefits reported here; 2) improve the first-stage price-taker model to capture the ancillary services provided by long-duration energy storage in the optimal device operation profile, and hence, achieve a better ancillary service benefits analysis; 3) assess the transmission congestion benefits of long-duration energy storage in a system with a nodal-level transmission network, and 4) evaluate the capacity value provided by long-duration energy storage.
Data Availability Statement
The raw data supporting the conclusions of this article will be made available by the authors, without undue reservation, to any qualified researcher.
Author Contributions
JE and MP conceived the study; JZ, OG and JE developed the analysis approach; JZ created the database and performed most of the simulation and results analysis; OG provided statistical analysis; JZ drafted the manuscript; JE and MP are the primary investigators of the project and provide approval for publication of the content; OG, JE and MP reviewed and revised the manuscript. All authors contributed to revising the manuscript.
Disclaimer
This work was authored by the National Renewable Energy Laboratory, operated by Alliance for Sustainable Energy, LLC, for the U.S. Department of Energy (DOE) under Contract No. DE-AC36-08GO28308, and by the Electric Power Research Institute. Funding provided by the Electric Power Research Institute and the U.S. Department of Energy Office of Energy Efficiency and Renewable Energy (EERE) Fuel Cell Technology Office under award number CRD-18-736. The views expressed in the article do not necessarily represent the views of the DOE or the U.S. Government. The U.S. Government retains and the publisher, by accepting the article for publication, acknowledges that the U.S. Government retains a nonexclusive, paid-up, irrevocable, worldwide license to publish or reproduce the published form of this work, or allow others to do so, for U.S. Government purposes.
Conflict of Interest
MP was employed by Pellow Energy Insights during the final stages of this work.
The remaining authors declare that the research was conducted in the absence of any commercial or financial relationships that could be construed as a potential conflict of interest.
References
Akhil, A. A., Huff, G., Currier, A. B., Hernandez, J., Bender, D. A., Kaun, B. C., et al. (2016). DOE/EPRI electricity storage handbook in collaboration with NRECA. Albuquerque, NM: Sandia National Laboratories.
ATB (2018). Data from: Annual technology baseline (ATB) data. Available at: https://atb.nrel.gov/electricity/data.html.
Balducci, P. J., Alam, M. J. E., Hardy, T. D., and Wu, D. (2018). Assigning value to energy storage systems at multiple points in an electrical grid. Energy Environ. Sci. 11, 1926–1944. doi:10.1039/C8EE00569A
Battke, B., Schmidt, T. S., Grosspietsch, D., and Hoffmann, V. H. (2013). A review and probabilistic model of lifecycle costs of stationary batteries in multiple applications. Renew. Sustain. Energy Rev. 25, 240250. doi:10.1016/j.rser.2013.04.023
Bistline, J. E. T., and Young, D. T. (2020). Emissions impacts of future battery storage deployment on regional power systems. Appl. Energy. 264, 114678–121009. doi:10.1016/j.apenergy.2020.114678
Brouwer, A. S., van den Broek, M., Seebregts, A., and Faaij, A. (2014). Impacts of large-scale intermittent renewable energy sources on electricity systems, and how these can be modeled. Renew. Sustain. Energy Rev. 33, 443466. doi:10.1016/j.rser.2014.01.076
Brouwer, A. S., van den Broek, M., Zappa, W., Turkenburg, W. C., and Faaij, A. (2016). Least-cost options for integrating intermittent renewables in low-carbon power systems. Appl. Energy. 161, 4874. doi:10.1016/j.apenergy.2015.09.090
Cebulla, F., Naegler, T., and Pohl, M. (2017). Electrical energy storage in highly renewable European energy systems: capacity requirements, spatial distribution, and storage dispatch. J. Energy Storage. 14, 211223. doi:10.1016/j.est.2017.10.004
Cole, W., Mai, T., Richards, J., Das, P., and Donohoo-Vallett, P. (2017). 2017 standard scenarios report: a U.S. electricity sector outlook. NREL, Technical Paper 6A20-68548.
Converse, A. O. (2012). Seasonal energy storage in a renewable energy system. Proc. IEEE. 100, 401–409. doi:10.1109/JPROC.2011.2105231
Craig, M. T., Jaramillo, P., and Hodge, B.-M. (2018). Carbon dioxide emissions effects of grid-scale electricity storage in a decarbonizing power system. Environ. Res. Lett. 13, 014004. doi:10.1088/1748-9326/aa9a78
de Sisternes, F. J., Jenkins, J. D., and Botterud, A. (2016). The value of energy storage in decarbonizing the electricity sector. Appl. Energy. 175, 368379. doi:10.1016/j.apenergy.2016.05.014
Denholm, P., and Hand, M. (2011). Grid flexibility and storage required to achieve very high penetration of variable renewable electricity. Energy Pol. 39, 18171830. doi:10.1016/j.enpol.2011.01.019
Denholm, P., and Mai, T. (2019). Timescales of energy storage needed for reducing renewable energy curtailment. Renew. Energy. 130, 388–399. doi:10.1016/j.renene.2018.06.079
Denholm, P. L., and Margolis, R. M. (2018). The potential for energy storage to provide peaking capacity in California under increased penetration of solar photovoltaics: report summary. NREL. Technical Paper 6A20-70905.
Dvorkin, Y., Fernandez-Blanco, R., Wang, Y., Xu, B., Kirschen, D. S., Pandzic, H., et al. (2018). Co-planning of investments in transmission and merchant energy storage. IEEE Trans. Power Syst. 33, 245–256. doi:10.1109/TPWRS.2017.2705187
Eichman, J., Denholm, P., Jorgenson, J., and Helman, U. (2015). Operational benefits of meeting California’s energy storage targets. NREL. Technical Paper 5400-65061.
Eichman, J., Townsend, A., and Melaina, M. (2016). Economic assessment of hydrogen technologies participating in California electricity markets. NREL. Technical Paper 5400-65856.
Eurek, K., Cole, W., Bielen, D., Blair, N., Cohen, S., Frew, B., et al. (2016). Regional energy deployment system (ReEDS) model documentation: version 2016. NREL. Technical Paper 6A20-72023.
Fripp, M. (2012). Switch: a planning tool for power systems with large shares of intermittent renewable energy. Environ. Sci. Technol. 46, 6371–6378. doi:10.1021/es204645c
Guerra, O. J., Zhang, J., Eichman, J., Denholm, P., Kurtz, J., and Hodge, B.-M. (2020). The value of seasonal energy storage technologies for the integration of wind and solar power. Energy Environ. Sci. 13, 1909–1922. doi:10.1039/D0EE00771D
Jülch, V. (2016). Comparison of electricity storage options using levelized cost of storage (LCOS) method. Appl. Energy. 183, 15941606. doi:10.1016/j.apenergy.2016.08.165
Kittner, N., Lill, F., and Kammen, D. M. (2017). Energy storage deployment and innovation for the clean energy transition. Nat Energy. 2, 17125. doi:10.1038/nenergy.2017.125
Lai, C. S., and McCulloch, M. D. (2017). Levelized cost of electricity for solar photovoltaic and electrical energy storage. Appl. Energy. 190, 191203. doi:10.1016/j.apenergy.2016.12.153
Mileva, A., Johnston, J., Nelson, J. H., and Kammen, D. M. (2016). Power system balancing for deep decarbonization of the electricity sector. Appl. Energy. 162, 1001–1009. doi:10.1016/j.apenergy.2015.10.180
Obi, M., Jensen, S. M., Ferris, J. B., and Bass, R. B. (2017). Calculation of levelized costs of electricity for various electrical energy storage systems. Renew. Sustain. Energy Rev. 67, 908920. doi:10.1016/j.rser.2016.09.043
Pawel, I. (2014). The cost of storage-how to calculate the levelized cost of stored energy (LCOE) and applications to renewable energy generation. Energy Procedia. 46, 6877. doi:10.1016/j.egypro.2014.01.159
RPS (2018). Data from: State renewable portfolio standards and goals. National Conference of State Legislatures. Available at: http://www.ncsl.org/research/energy/renewable-portfolio-standards.aspx
SB-100 (2018). Data from: SB-100 California renewables portfolio standard program: emissions of greenhouse gases. California legislative information. Available at: id=201720180SB100" title="https://leginfo.legislature.ca.gov/faces/billNavClient.xhtml?bill.
Schmidt, O., Hawkes, A., Gambhir, A., and Staffell, I. (2017). The future cost of electrical energy storage based on experience rates. Nat. Energy. 2, 17110. doi:10.1038/nenergy.2017.110
Schmidt, O., Melchior, S., Hawkes, A., and Staffell, I. (2019). Projecting the future levelized cost of electricity storage technologies. Joule. 3, 81100. doi:10.1016/j.joule.2018.12.008
Scholz, Y., Gils, H. C., and Pietzcker, R. C. (2017). Application of a high-detail energy system model to derive power sector characteristics at high wind and solar shares. Energy Econ. 64, 568582. doi:10.1016/j.eneco.2016.06.021
Sioshansi, R., Madaeni, S. H., and Denholm, P. (2014). A dynamic programming approach to estimate the capacity value of energy storage. IEEE Trans. Power Syst. 29, 395–403. doi:10.1109/TPWRS.2013.2279839
Sto (2014). Data from: Technology roadmap – energy storage. Available at: https://www.iea.org/publications/freepublications/publication/TechnologyRoadmapEnergystorage.pdf
Sullivan, P., Short, W., and Blair, N. (2008). “Modeling the benefits of storage technologies to wind power,” in American wind energy association (AWEA) wind power 2008, Houston, Texas, June 1–4, 2008.
Tejada-Arango, D. A., Domeshek, M., Wogrin, S., and Centeno, E. (2018). Enhanced representative days and system states modeling for energy storage investment analysis. IEEE Trans. Power Syst. 33, 6534–6544. doi:10.1109/TPWRS.2018.2819578
Weitemeyer, S., Kleinhans, D., Vogt, T., and Agert, C. (2015). Integration of renewable energy sources in future power systems: the role of storage. Renew. Energy. 75, 1420. doi:10.1016/j.renene.2014.09.028
Wogrin, S., Galbally, D., and Reneses, J. (2016). Optimizing storage operations in medium- and long-term power system models. IEEE Trans. Power Syst. 31, 3129–3138. doi:10.1109/TPWRS.2015.2471099
Zakeri, B., and Syri, S. (2015). Electrical energy storage systems: a comparative life cycle cost analysis. Renew. Sustain. Energy Rev. 42, 569596. doi:10.1016/j.rser.2014.10.011
Keywords: long-duration energy storage, storage benefits, variable renewable energy, production cost model, power system model, price-taker model
Citation: Zhang J, Guerra OJ, Eichman J and Pellow MA (2020) Benefit Analysis of Long-Duration Energy Storage in Power Systems with High Renewable Energy Shares. Front. Energy Res. 8:527910. doi: 10.3389/fenrg.2020.527910
Received: 18 January 2020; Accepted: 22 October 2020;
Published: 16 December 2020.
Edited by:
Yulong Ding, University of Birmingham, United KingdomReviewed by:
Rajagopalan Srinivasan, Indian Institute of Technology Madras, IndiaM. M. Faruque Hasan, Texas A and M University, United States
Seamus Garvey, University of Nottingham, United Kingdom
Copyright © 2020 Zhang, Guerra, Eichman and Pellow. This is an open-access article distributed under the terms of the Creative Commons Attribution License (CC BY). The use, distribution or reproduction in other forums is permitted, provided the original author(s) and the copyright owner(s) are credited and that the original publication in this journal is cited, in accordance with accepted academic practice. No use, distribution or reproduction is permitted which does not comply with these terms.
*Correspondence: Jiazi Zhang, SmlhemkuWmhhbmdAbnJlbC5nb3Y=
†ORCID: Jiazi Zhang, orcid.org/0000-0003-0440-8102; Omar J. Guerra, orcid.org/0000-0003-3740-7149; Joshua Eichman, orcid.org/0000-0002-3460-2857; Matthew A. Pellow, orcid.org/0000-0001-7276-0242