 Franco Canziani1,2
 José A. Gastelo-Roque
- 1Universitat Politècnica de Catalunya, Barcelona, Spain
- 2Universidad Científica del Sur, Lima, Perú
- 3Faculty of Mechanical Electrical Engineering, Pedro Ruiz Gallo National University, Lambayeque, Perú
Microgrids are autonomous systems that generate, distribute, store, and manage energy. This type of energy solution has the potential to supply energy to remote communities since they can integrate solar, wind, and back-up diesel generation. These systems are potentially beneficial in Peru, where there are approximately 1.5 million people without access to electricity. This paper studies the technical aspects of the implementation, operation, and social impact of a hybrid microgrid installed in Laguna Grande, Ica, Peru, a rural fishing community composed of about 35 families who have lived in this remote location for more than 40 years without access to electricity. The design of the microgrid comprised three main stages: assessment, sizing, and social management. According to resource assessment, this location has a very high wind potential with an average of 8 m/s and annual average irradiation of 6 kWh/m2/day. The microgrid was designed based on interviews with members of the community on energy use, social-economic aspects, and factors such as expected growth and available funds. The construction followed a participatory approach, involving the community in specific stages of the project. This hybrid microgrid is composed of a 6 kWp photovoltaic system and two wind turbines of 3 kW each. It has two coupled 4 kW inverters that deliver power to a 230 V AC distribution line to which all the community loads are connected. Energy is stored using a VRLA 800 Ah, 48 V battery bank, which is designed to work at 50% DOD. The installed microgrid has proven very effective in supplying the average daily demand of 23 kWh at an almost steady power of 1–1.2 kW. During almost 2 years of monitoring, it has presented a 10% loss of load due to peak increases in demand, technical problems, and occasional low solar and wind resources. PV/wind integration is very important since approximately 60% of the energy demand is nocturnal. The CAPEX of the project reached USD 36,000.00, obtaining a cost of energy levelized cost of energy of 0.267 USD per kWh. The project has a useful life of 20 years, with battery renewal every 3 years and wind turbines and electronics every 10.
Introduction
A fraction of the world population still has no access to electricity and its associated benefits. A total of 88.86% of the world population has access to electricity, but this number declines to 78.67% when only rural areas are taken into account (World Bank, 2019). The traditional approach to solve this situation has been, for decades, to extend the grid but different characteristics such as geographic location, accessibility, reduced consumption per household, and transportation infrastructure make this kind of undertaking difficult and unattractive for private investors (Ministerio de Energía and Minas, 2015). Consequently, communities are left isolated or may rely on expensive alternatives. For instance, the intermittent use of diesel generators is unsustainable and creates a strong dependence on fuel and spare supply (Kirubi et al., 2009; Loka et al., 2014).
Energy consumption across the world will grow by nearly 50% between 2018 and 2050, and renewable energy/electricity share growth will soon exceed fossil fuels (EIA, 2019). Moreover, the levelized cost of energy (LCOE) from different microgrids around the world is getting more competitive and could replace diesel generators in different scenarios (Rehman and El-Amin, 2015; IRENA, 2016; El-houari et al., 2019; Veilleux et al., 2020). The logical next step is to develop and invest in technologies and solutions that use renewable resources.
With the current state of technology, services such as lighting, battery charging, irrigation, refrigeration, and others can be provided not only for private use but for income generation (World Bank, 2019), and a reliable and sustainable energy supply is the fundamental first step in this process. Substantial development in PV technology, storage, and power electronics has boosted competitive microgrid design and development in many rural areas of the world (Gastelo-Roque and Morales-Acevedo, 2017; López-González et al., 2017; El-houari et al., 2019; Salihu et al., 2020). These autonomous energy systems integrate solar, wind, and back-up diesel generation along with battery storage and energy management constitute the best solution to the energy supply challenge for remote communities (Schnitzer et al., 2014; Louie, 2016). It is of great importance to conduct a proper resource assessment and energy demand evaluation (Zhou et al., 2010; Kobayakawa and Kandpal, 2015; Rehman et al., 2020).
In Peru, as of 2018, only 81.5% of the rural population has access to electricity (MINEM, 2020). Increasing coverage will require even more active government participation with renewable energy systems. This kind of project has elevated social revenue but for communities to improve and reach the goal of sustainable development, it is imperative to exceed the minimum power requirements that small isolated renewable energy systems have usually provided so that the productive use of energy is promoted (Canziani and Melgarejo, 2019).
This work explores the case study of the 12 kW Laguna Grande hybrid rural microgrid, undertaking an analysis of design, construction, and operation. Solar radiation, wind speed, power demand, and battery voltage are monitored to study the behavior of the system and develop an initial assessment of the relationship between renewable resource availability and its impact on the quality and availability of energy.
Methodology
Location of Study
This research was carried out in the “Muelle” sector of Laguna Grande, a rural fishing community founded in 1979, located in the Paracas National Reserve, a protected area for the conservation and sustainable use of desert and marine ecosystems, in the Ica region in the coast of Peru. The community is situated on the banks of a brackish lagoon of the same name, which is open to the Pacific Ocean through a channel, on coordinates 14°08′33.5″ S 76°15′43.6″ W. (Figure 1A). Currently, the entire population lives and works around fishing and related activities, and there are almost 90 residents in 35 homes.
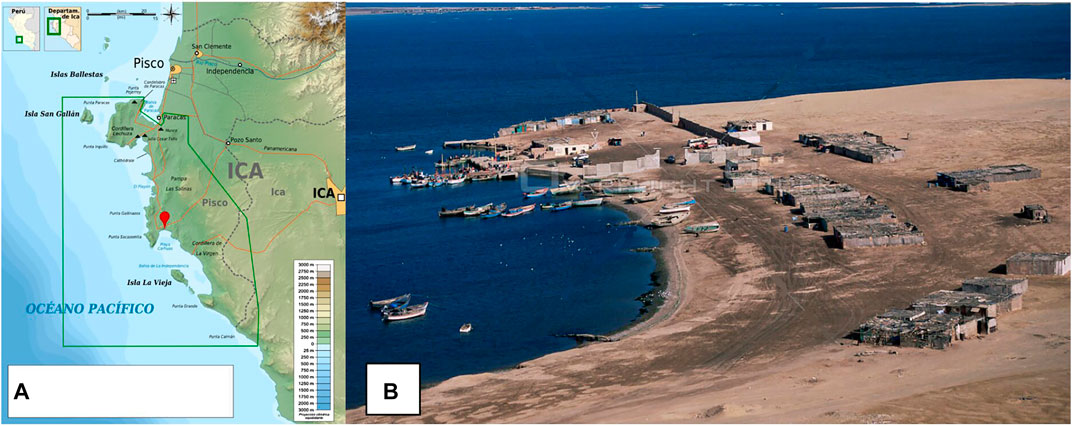
FIGURE 1. (A) Location of Laguna Grande in the Paracas National Reserve, (B) Picture of the community in 2018.
Due to its location within a national protected area and the impossibility of installing electrical networks, the community of Laguna Grande has never had access to conventional electricity. Having no connection to the electricity grid, some residents use kerosene, flashlights, and candles for lighting, and generators to charge cell phones and refrigerate food.
The climate of Laguna Grande is typical of the Peruvian coastal desert, usually warm with strong wind. The average annual temperature is 18°C, ranging between 22°C in February and 15°C in August. The rains are scarce and occur during winter (July–September). The nature of the terrain, the intensity of the irradiation, and the cold sea trigger famous dust storms known as “Paracas”.
Limitation of the Study
Due to the accuracy and uncertainty of both resource and consumption data and the absence of a comprehensive simulation model, the design method in the present research can be considered heuristic and experimental.
Resource Assessment
Two months of activity data were recorded and compared with solar and wind datasets from Peruvian meteorological institutions, NASA and NREL. Once validated, these datasets were used for the microgrid design and energy production estimation. Statistical tests were applied with the specialized software OriginPro (Martins et al., 2008).
Solar irradiance was measured as global horizontal irradiance (GHI) and recorded on-site with a Symphonie LI-COR LI-200/R-BL pyranometer. Wind direction and wind speed were recorded on-site with an NRG 200P wind vane and an NRG#40C anemometer, respectively at 4.5 m from the ground. All the data was stored in a SympohniePlus 3 datalogger.
The typical daily solar radiation curve and peak Sun hour values were obtained from the solar irradiance data. Wind speed data was processed into a Weibull cumulative statistical distribution. Finally, the Mean Bias Error (MBE) and the Root Mean Square Error (RMSE) were calculated to check the accuracy of the mentioned datasets.
Energy Demand Evaluation
Household and community energy demand were calculated following a three-step process. First, the team interviewed the interested families, then defined consumption profiles based on habits and economic activities. Finally, estimations for the growth rate of both consumption per household and new households were made for the next 5 years.
The total AC power of the system and daily energy consumption was defined according to the formulas below, adapted from the Peruvian Ministry of Economy and Finance (Ministerio de Economía and Finanzas, 2011).
where,
EAC (kWh): the community’s daily energy consumption.
CP1 (kWh): consumption for profile 1.
nP1: number of households with consumption profile 1.
GRCP1: consumption growth rate for profile 1.
CP2 (kWh): consumption for profile 2.
nP2: number of households with consumption profile 2.
GRCP2: Consumption growth rate for profile 2.
Y (years): number of years for growth projection.
PAC (kW): the community’s maximum power demand.
DP1 (kW): demand for profile 1.
GRDP1: demand growth rate for profile 1.
DP2 (kW): demand for profile 2.
GRDP2: demand growth rate for profile 2.
Sizing
The microgrid sizing was carried out in Microsoft Excel. It considered the validated wind and solar daily datasets (monthly average) for the location of the project; the estimated daily energy demand; equipment efficiency; electrical losses under normal operating conditions; and funding limits. There were no area restrictions. PV power and wind power, as well as their respective energy production, were calculated as a function of the demand, as shown below.
Photovoltaic nominal power, adapted from (Smets et al., 2016).
Where,
PPV (kWp): photovoltaic nominal power (kWp).
EAC (kWh): community’s daily energy consumption, covered by PV.
R (kWh/m2 d): daily solar radiation (Monthly average).
AkWp (m2): effective installed area of one kWp.
ηmod (%): PV module efficiency.
ηS (%): system efficiencies.
Wind Power (Swift and Walker 2015)
Where,
PW (kW): wind nominal power (kW).
EAC (kWh): the community’s daily energy consumption, covered by wind energy.
h: daily hours.
ηt (%): wind turbine efficiency.
ηg (%): generator efficiency.
ρa (kg/m3): air density.
Cp (%): wind turbine coefficient of performance (Model depending).
A (m2): wind rotor swept area.
Vh3 (m/s) hourly average wind velocity at which electricity is produced.
The battery design is considered energy for storage and depth of discharge (Smets et al., 2016). The bank was designed with VRLA AGM 100 Ah, 12 V, batteries.
Where,
NB: number of batteries
dA (day): days of autonomy.
EBS (kWh): energy for battery storage.
C20 (Ah): battery nominal capacity at a 20-h rate.
VB (V): battery voltage.
DoD (%): depth of discharge.
Construction Planning
The construction of the microgrid followed four stages:
Installation of PV modules and wind turbines.
Installation of power electronics (inverters, electrical control, and safety equipment).
Construction of the power distribution line and household meters connection.
Tests and commissioning.
Microgrid’s Parameters Measurement
To evaluate the initial performance of the microgrid after its construction and commissioning, five parameters are considered important: 1) Global Horizontal Irradiance (GHI), 2) Wind speed, 3) Wind direction, 4) Battery Voltage, and 5) Power demand.
The constant measurement and registration required a Symphonie LI-COR LI-200/R-BL pyranometer, an NRG 200P wind vane, and an NRG#40C anemometer, incorporated into a SymphoniePlus 3 datalogger. The operation parameters required AC and DC current meters, and voltage meters connected to an eGauge Pro datalogger.
Analysis and Results
Renewable Resources
Solar Radiation
Solar radiation measurements were performed for the correct sizing of the photovoltaic system. The radiation was measured for two months before installation and then continued throughout the operation of the system.
The database closest to the measured values was the NREL Database, which according to the MBE, overestimates the radiation by 1.76%. The NREL Database has an RMSE of 10.30% and a correlation factor of 0.943. Table 1 shows a comparison between main databases with the actual measured values (Liu et al., 2019; Manju and Sandeep, 2019).
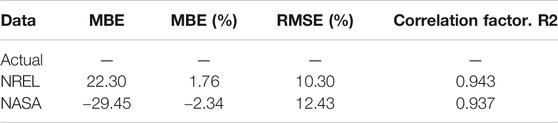
TABLE 1. Comparison between measured values and databases.
The radiation data shows that in Laguna Grande there is solar radiation from 06:00 am to 05:00 pm with peaks of up to 1100 W/m2, with an average total irradiance of 7 kWh/m2/day in the months of highest radiation (January, February, and March) and an average of 5 kWh/m2 during June, July, and August. Figure 2 shows an hourly profile of solar radiation in Laguna Grande. The annual average is 6.4 kWh/m2, which represents a high potential for photovoltaic systems according to OLADE (OLADE, 2017), being able to produce up to 1.25 kWh/m2/kWp of photovoltaic energy, positioning itself as one of the areas with the greatest potential in Peru.
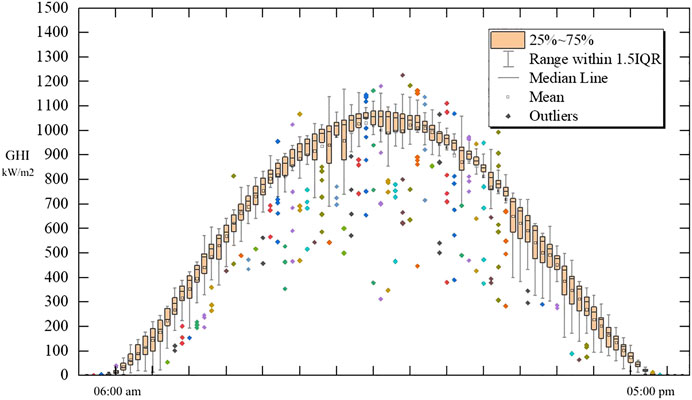
FIGURE 2. Hourly solar radiation in Laguna Grande.
Wind Potential
To assess the power generated by the wind turbine system and its relationship with the resource, wind speed and direction were measured.
The energy production is first expressed in terms of wind speed. Among the many mathematical models used in wind power studies, the cumulative statistical distribution of Weibull (Azad et al., 2019; Hulio et al., 2019; Khalid Saeed et al., 2019) is the most appropriate for describing wind speed variations. To do this, a frequency graph of wind speed was made.
From the frequency histogram shown in Figure 3, it was observed that the most frequent wind speed is 10 m/s, reaching peaks of up to 13.5 m/s. Figure 4 shows the average hourly wind speed, the hours with the highest wind speed range from 10:00 am to 03:00 pm, with a decrease in night hours. It is remarkable that the availability of night wind, on average 6 m/s, which as shown below is essential to provide energy at night to the community. Figure 5 shows that the wind direction in Laguna Grande is predominantly to the southeast.
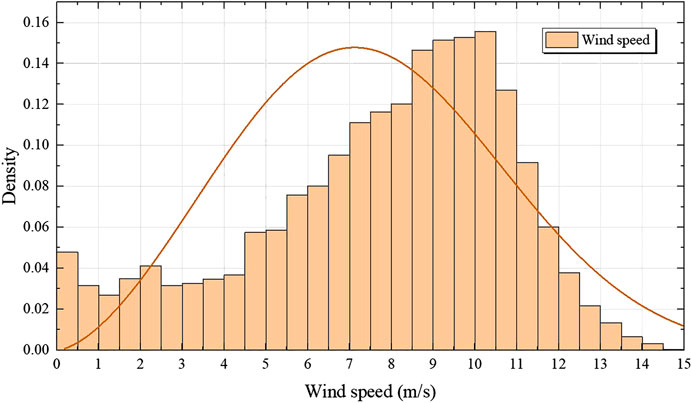
FIGURE 3. Wind speed frequency and Weibull distribution in Laguna Grande.
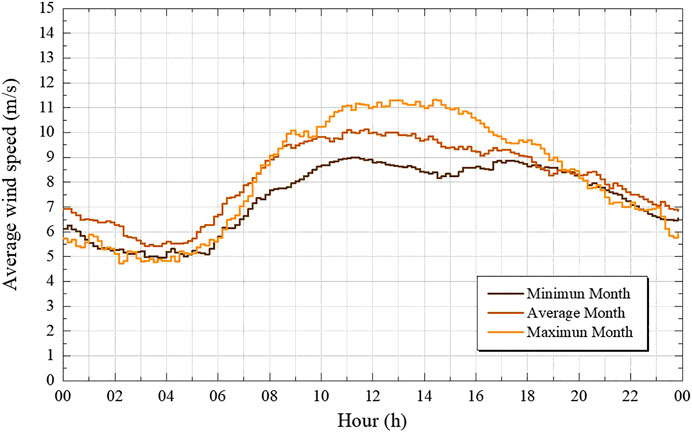
FIGURE 4. Daily average wind speed in Laguna Grande.
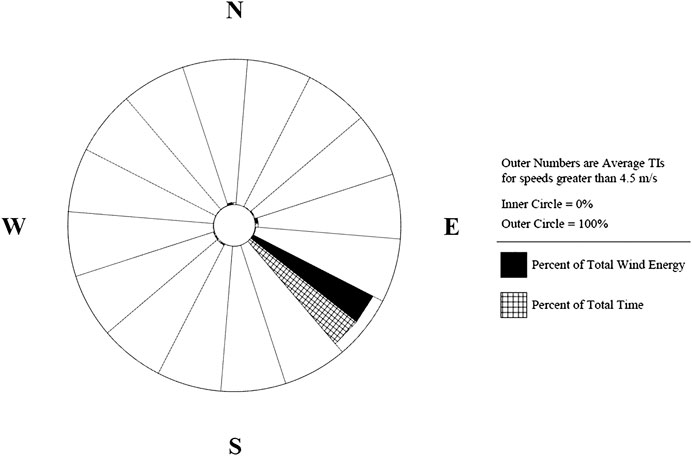
FIGURE 5. Wind levels in Laguna Grande.
Temperature
Temperature is an important parameter in the design of the photovoltaic system. The operating temperature of the photovoltaic modules is related to the room temperature. When there are low temperatures (below 25°C of temperature in the cell) the photovoltaic system operates at a voltage greater than the nominal one, which can cause overvoltage on the DC side and electrical risks in the system. On the other hand, high temperatures (higher than 25°C of temperature in the cell) cause the system to operate at lower than nominal voltages and low system efficiencies. As a result, we used room temperature to estimate the size of the photovoltaic and energy storage systems. Figure 6 shows the room temperature in Laguna Grande.
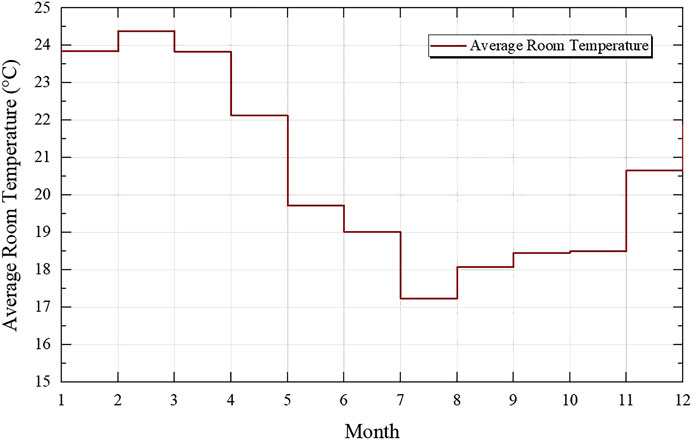
FIGURE 6. Temperature in Laguna Grande.
Energy Demand Estimation
Only two consumption profiles are found in the community: a household or domestic consumption profile and a commercial consumption profile. From the 35 registered users, 30 have a domestic profile which reaches a total of 18 kWh/month and five users have a commercial profile of 30 kWh/month (Ministerio de Economía and Finanzas 2011). The latter are businesses dedicated to the sale of food and groceries.
In order to maintain a controlled and continuous service, 2 A circuit breakers and 4 A circuit breakers were installed in households and businesses, respectively.
According to the consumption profiles, the number of registered users, and growth rates applied for the next 5 years after commissioning, the system must provide a total of 29 kWh/day.
Microgrid
Microgrid AC-DC Configuration
The microgrid was designed to power AC loads at 230 V. No DC load is covered in the project. PV, energy storage, and wind turbines were all connected to a 48 Vdc bus bar (Figure 7; Table 2) and two 48Vdc 4kW inverter/chargers (MPP Solar 4048 MS) dispatch 230 VAC to power all the 32 registered households and three businesses. Pictures of the implemented microgrid are shown in Figure 8.
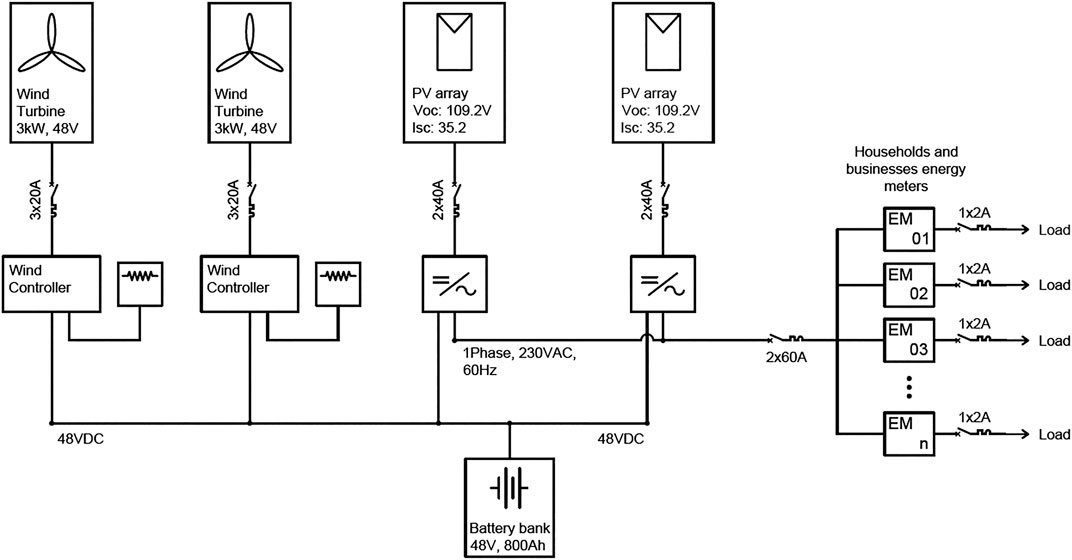
FIGURE 7. One-line diagram of Laguna Grande microgrid.
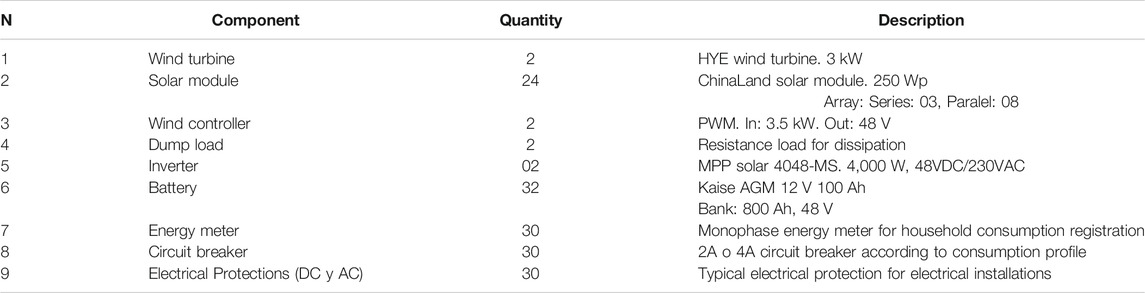
TABLE 2. Components of the Laguna Grande microgrid.

FIGURE 8. Pictures of Laguna Grande microgrid. (A) Battery bank and inverters, (B) Photovoltaic Array, (C) Wind turbines.
Each 3 kW wind turbine has its controller and dump load, and each 3 kWp solar array was assigned to an independent MPPT controller built into the inverter/charger unit.
Operation
It is important to monitor the operation of the system to ensure proper functioning and provide quality energy to the community. During the operation of the system the incident radiation, wind speed, battery voltage, and power demands were measured. The evaluations in this paper were based on measurements of about a year.
The system is autonomous and works exclusively with renewable energy (solar and wind energy), and stores the energy in the battery bank. We evaluated the relationship between energy production and the availability of renewable resources, as well as the quality of energy provided.
Power and Energy Production
The system has a peak power of 12 kWp between solar and wind, but it has an AC power of 8 kW, which is its installed capacity. Figure 9 shows that the system delivers an average of 1kW of power for most of the day. According to the data collected, the maximum historical demand of the community is 1.45 kW. This shows that due to the lack of access to electricity in recent years there is a corresponding lack of electrical appliances other than lamps, cell phones, and radios, as the community is not yet accustomed to consuming large amounts of energy. This current demand is significantly below the AC installed capacity and is expected to grow during the following years.
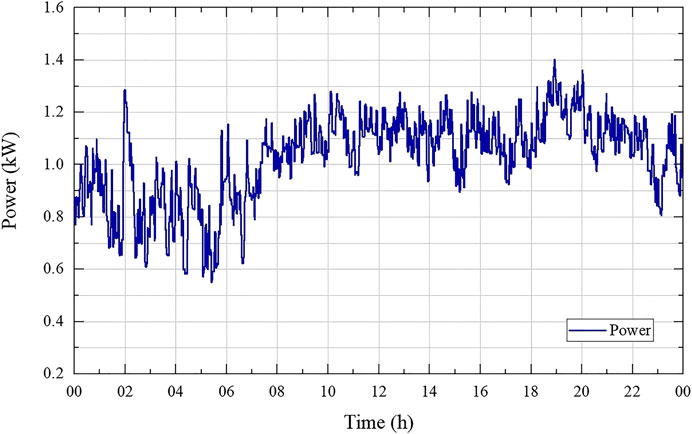
FIGURE 9. Hourly average power demand in Laguna Grande.
The system provides energy almost all day, on average it provides 23 kWh to the community on a typical day, which is less than the storage capacity of the batteries (800 Ah at 48 V, 38.4 kWh). The demand profile shows that the peak time occurs between 5:30 and 9:30 pm, decreasing a bit, but maintaining consumption of about 800 W during the night. The wind resource is very important here since there is good night wind speed and the battery bank does not run out and there are not too many interruptions in the micro network.
The battery voltage measurement results are used to know how the system storage behaves and the cuts that occur in the system since the battery bank is responsible for providing the network parameters to the micro network. When the voltage in the batteries is less than 44 V, the system disconnects and stops providing power to the community. Figure 10 shows a time-series of battery voltage during a week of operation. There is a voltage drop in the battery and a power outage in the system on days 27 and 28, while the other days show typical behaviors in which the system offered power without cuts. It is clear that the battery is discharged during the night and charged during the day.
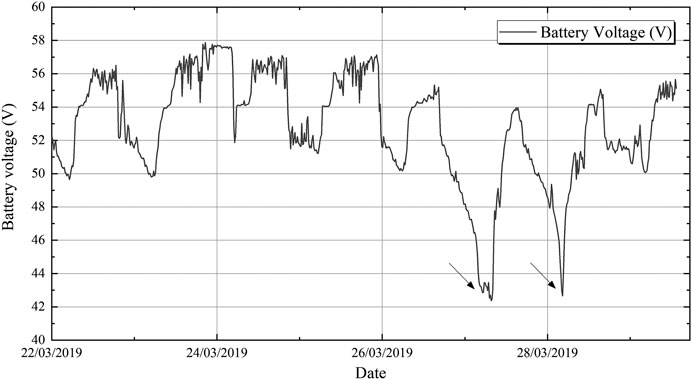
FIGURE 10. Time-series of battery voltage.
A database of resources and behavior of the microgrid can be found at Gastelo-Roque and Vargas (2020).
Economic and Social Impacts
Several benefits were identified at every stage of the project. For instance, before construction, residents’ sense of identity with the community was strengthened: even though some members were skeptical about the project, others signed up for the service because of curiosity, high expectations, and peer encouragement. The elderly were involved and people developed capabilities in terms of their knowledge of the construction and basic maintenance of the system. Finally, and most importantly, women got involved as leaders of the committee for the management of the system.
Every stage of the project required different types of interaction with the community to have an appropriate integration. For instance, before the execution of the project and, to assure viability, the community was required to have a minimum organizational structure and defined leaders; additionally, during this stage, the community had a more specific and direct conversation with the design team, resulting in important adjustments to the project to satisfy the real needs. Domenech et al. reported disagreements in rural communities that could have been solved with more communication to identify their needs more realistically (Léga et al., 2014). During construction, community involvement and support in undertaking different tasks was also required, and they assisted with low risk activities that do not require exposure to electrical hazards.
It is of great importance to address the responsibilities that arise when aiming for long term sustainability. The system implementation required the creation of a management program and committee as described by Canziani and Melgarejo, involving the owner of the system, the managing committee, the users, and a controller (Figure 11). The owner offers operational and maintenance services through a contract and receives payment. The committee assures that the service reaches the users and collects payments corresponding to each month of energy consumption according to the contract signed with each user, and the controller interacts with each of these three parties and settles any reclamation or dispute (2019). The committee in Laguna Grande is directed by Ms. Elsa Saravia and Mr. César García. There was initial resistance to registration since it implied accepting to pay a consumption tariff to a system that was not even commissioned, but the first registered users encouraged others to also be part of this program.

FIGURE 11. System management model adopted by the community.
For the system to be sustainable, the managing committee set a rate of 0.90 Peruvian Sol (PEN)/kWh (0.267 USD/kWh), plus a 3 USD fixed monthly fee. The community deposits the earnings into a bank account destined for general maintenance, replacement batteries, emergencies such as unexpected equipment failure, and other expenses. Though significantly higher than city energy rates (e.g. nearest city Ica: 0.56 PEN/kWh (Osinergmin 2019)), this microgrid rate allows the community to rely on a secure economic mechanism.
The CAPEX of the project amounted to USD 36,000.00 and the LCOE was estimated at 0.90 PEN/kWh or 0.267 USD/kWh; this is slightly less than the LCOE values from other microgrids for rural electrification. For instance, Sofimieari et al., 2019 reported values of around 0.486 USD/kWh and Veilleux et al. (2020), of around 0.274 USD/kWh. These numbers tend to go down as installed capacity rises (Chaurey and Kandpal, 2010; Singh et al., 2016; Sajed Sadati et al., 2018; Sofimieari et al., 2019).
Conclusion
According to the results and experiences from the project, it can be concluded that this is an effective, simple, and low-cost methodology for rural microgrid design. This method involves five stages from resource assessment, demand evaluation, construction and planning, to operation and system monitoring.
Laguna Grande has a very high wind potential with an average wind speed of 8 m/s and annual average irradiation of 6 kWh/m2/day. It is one of the few places in the world with such a high combined potential.
A hybrid microgrid composed of a 6 kWp photovoltaic system and two wind turbines of 3 kW each was implemented and has proven very effective in supplying an average daily demand of 23 kWh at an almost steady power of 1–1.2 kW. During almost 2 years of monitoring, the installed microgrid has presented 10% of power outages due to peak increases in demand, technical problems, and occasional low solar and wind resources. PV/wind integration is very important since approximately 60% of the energy demanded is nocturnal.
During the design process, data was collected with some uncertainty. It was considered that days of low solar radiation could be compensated by wind but when it came to the actual operation there were days where both the solar and wind resources were low, resulting in loss-of-load events not foreseen in the design, especially on winter days with low irradiation and wind speed.
The battery bank was designed with the assumption that there would be a constant pattern of charge and discharge cycles, however, during the actual operation, the charge and discharge cycles varied, with days where the batteries performed more cycles than those estimated.
The CAPEX of the project reached USD 36,000.00, obtaining a LCOE of 0.267 USD per kWh. The project estimated a life of 20 years use, with battery renewal every 3 years and wind turbines and electronics replaced every 10.
The human factor is a fundamental aspect in every stage of the project when aiming for a sustainable working model. It is of great importance to establish a direct, simple, and easy way of communicating with the community to know their real needs. The Laguna Grande 12 kW PV-wind hybrid microgrid has proven to be a successful example of community management but there cannot be sustainable development without social engagement.
This work is an evaluation of the Laguna Grande microgrid, and new equipment has been implemented that will measure the individual production of the photovoltaic and wind system. Work in the future will examine this data in further detail and explore the relationship between resources and the operation of the system as well as the quality of energy generated.
Data Availability Statement
The datasets generated for this study are available on request to the corresponding author.
Ethics Statement
Ethical review and approval was not required for the study on human participants in accordance with the local legislation and institutional requirements. Written informed consent from the participants was not required to participate in this study in accordance with the national legislation and the institutional requirements.
Author Contributions
All authors have made direct contributions to the work. FC drafted the proposal, grant application, microgrid implementation, literature review, and final revision of the manuscript. RV compiled the literature review, microgrid implementation, experimental setup, and proofread the manuscript. JG-R compiled the literature review, undertook the statistical analysis, and proofread the manuscript.
Funding
The engineering, provision, construction, and social management of the Laguna Grande hybrid microgrid was partially funded by the Interamerican Development Bank. This funder was not involved in the study design, collection, analysis, interpretation of data, the writing of this article or the decision to submit it for publication. The project was granted USD 98,000 by the “BID Ideas 2015” contest and was executed by the Peruvian company Waira Energía SAC. The current research and monitoring of the system are carried out with private funds.
Conflict of Interest
Waira Energía was hired as EPC company to build the microgrid. Waira Energía doesn’t contribute directly with the project.
The authors declare that the research was conducted in the absence of any commercial or financial relationships that could be construed as a potential conflict of interest.
Acknowledgments
The authors would like to thank the community of Laguna Grande, Sector Muelle, for their involvement, support, and collaboration with this project. Special acknowledgments to Esther Saravia, for her unconditional support and willingness to learn. Finally, the authors thank the IDB for the funding of the project.
References
Azad, K., Rasul, M., Halder, P., and Sutariya, J. (2019). “Assessment of wind energy prospect by Weibull distribution for prospective wind sites in Australia,” in Energy procedia, 2nd international conference on energy and power, ICEP2018–15, Sydney, Australia, 13–15 December 2018, Vol. 348, 13–55. doi:10.1016/j.egypro.2019.02.167
Canziani, F., and Melgarejo, Ó. (2019). “Design and implementation of rural microgrids,” En Microgrids design and implementation, editado por antonio carlos zambroni de souza y miguel castilla. Cham: Springer International Publishing, 477–504. doi:10.1007/978-3-319-98687-6_17
Chaurey, A., and Kandpal, T. C. (2010). A techno-economic comparison of rural electrification based on solar home systems and PV microgrids. Energy Pol. 38 (6), 3118–3129. doi:10.1016/j.enpol.2010.01.052
EIA (2019). International energy outlook 2019. Available at: https://www.eia.gov/outlooks/ieo/ (Accessed December 15, 2019).
El-houari, H., Amine, A., Rehman, S., Buker, M. S., Kousksou, T., Jamil, A., et al. (2019). Design, simulation, and economic optimization of an off-grid photovoltaic system for rural electrification. Energies 12 (24), 4735. doi:10.3390/en12244735
Gastelo-Roque, J. A., and Morales-Acevedo, A. (2017). “Design of a photovoltaic system using thermoelectric Peltier cooling for vaccines refrigeration”, in En 2017. IEEE MIT undergraduate research technology conference (URTC), Cambridge, MA, November 3‒5, 2017, 1–4. doi:10.1109/URTC.2017.8284211
Gastelo-Roque, J. A., and Vargas, R. H. (2020). Data base of hybrid PV-wind microgrid with battery storage for rural electrification: a case study in Perú. Available at: https://github.com/jgastelor/MicrogridWaira (Accessed December 15, 2019).
Hulio, Z. H., Jiang, W., and Rehman, S. (2019). Techno-economic assessment of wind power potential of Hawke’s Bay using Weibull parameter: a review. Energy Strategy Rev. 26, 100375. doi:10.1016/j.esr.2019.100375
IRENA (2016). Innovation outlook: renewable mini-grids. Available at: https://www.irena.org/publications/2016/Sep/Innovation-Outlook-Renewable-mini-grids (Accessed December 15, 2019).
Khalid Saeed, M., Salam, A., Rehman, A. U., and Abid Saeed, M. (2019). Comparison of six different methods of Weibull distribution for wind power assessment: a case study for a site in the northern region of Pakistan. Sustain. Energy Technol. Assess. 36, 100541. doi:10.1016/j.seta.2019.100541
Kirubi, C., Jacobson, A., Kammen, D. M., and Mills, A. (2009). Community-based electric micro-grids can contribute to rural development: evidence from Kenya. World Dev. 37 (7), 1208–1221. doi:10.1016/j.worlddev.2008.11.005
Kobayakawa, T., and Kandpal, T. C. (2015). Analysis of electricity consumption under a photovoltaic micro-grid system in India. Sol. Energy 116, 177–183. doi:10.1016/j.solener.2015.04.001
Léga, D., Bruno, L. F. M., Lillo, P., Moreno, R. P., and Chiroque, J. (2014). A community electrification project: combination of microgrids and household systems fed by wind, PV or micro-hydro energies according to micro-scale resource evaluation and social constraints. Energy Sustain. Dev. J. Int. Energy Initiative 23, 275–285. doi:10.1016/j.esd.2014.09.007
Liu, P., Tong, X., Zhang, J., Meng, P., Li, J., and Zhang, J. (2019). Estimation of half-hourly diffuse solar radiation over a mixed plantation in North China. Renew. Energy 149, 1360–1369. doi:10.1016/j.renene.2019.10.136
Loka, P., Moola, S., Polsani, K., Reddy, S., Shannon, F., and Skumanich, A. (2014). A case study for micro-grid PV: lessons learned from a rural electrification project in India. Prog. Photovolt. Res. Appl. 22 (7), 733–743. doi:10.1002/pip.2429
López-González, A., Domenech, B., Gómez-Hernández, D., and Ferrer-Martí, L. (2017). Renewable microgrid projects for autonomous small-scale electrification in andean countries. Renew. Sustain. Energy Rev. 79, 1255–1265. doi:10.1016/j.rser.2017.05.203
Louie, H. (2016). Operational analysis of hybrid solar/wind microgrids using measured data. Energy Sustain. Dev. 31, 108–117. doi:10.1016/j.esd.2016.01.003
Manju, S., and Sandeep, M. (2019). Prediction and performance assessment of global solar radiation in Indian cities: a comparison of satellite and surface measured data. J. Clean. Prod. 230, 116–128. doi:10.1016/j.jclepro.2019.05.108
Martins, F. R., Pereira, E. B., Silva, S. A. B., Abreu, S. L., and Colle, S. (2008). Solar energy scenarios in Brazil, Part 1: resource assessment. Energy Pol. 36 (8), 2843–2854. doi:10.1016/J.ENPOL.2008.02.014
MINEM (2020). Minem muestra en Alemania los avances del Perú en materia de energías renovables y los planes al 2021. Available at: https://www.gob.pe/institucion/minem/noticias/5959-minem-muestra-en-alemania-los-avances-del-peru-en-materia-de-energias-renovables-y-los-planes-al-2021 (Accessed December 15, 2019).
Ministerio de Economía and Finanzas (2011). Electrificación rural: Guía para la formulación de proyectos de inversión exitosos. Lima, Peru: Peru Government.
Ministerio de Energía and Minas (2015). Plan nacional de electrificación rural (PNER) 2016-2025. Available at: http://extwprlegs1.fao.org/docs/pdf/per153304anx1.pdf (Accessed December 15, 2019).
Osinergmin (2019). Pliegos Tarifarios aplicables al Cliente final. Available at: https://www.osinergmin.gob.pe/seccion/institucional/regulacion-tarifaria/pliegos-tarifarios/electricidad/pliegos-tarifiarios-cliente-final (Accessed December 15, 2019).
Rehman, S., and El-Amin, I. (2015). Study of a solar pv/wind/diesel hybrid power system for a remotely located population near arar, Saudi Arabia. Energy Explor. Exploit. 33 (4), 591–620. doi:10.1260/0144-5987.33.4.591
Rehman, S., Rahman Habib, H. U., Wang, S., Buker, M. S., Alhems, L. M., and Al Garni, H. Z. (2020). Optimal design and model predictive control of standalone HRES: a real case study for residential demand side management. IEEE Access 8, 29767–29814. doi:10.1109/ACCESS.2020.2972302
Sajed Sadati, S. M., Jahani, E., Taylan, O., and Baker, D. K. (2018). Sizing of photovoltaic-wind-battery hybrid system for a mediterranean island community based on estimated and measured meteorological data. J. Sol. Energy Eng. 140 (1), 011006. doi:10.1115/1.4038466
Salihu, T. Y., Akorede, M. F., Abdulkarim, A., and Abdullateef, A. I. (2020). Off-grid photovoltaic microgrid development for rural electrification in Nigeria. Electr. J. 33 (5), 106765. doi:10.1016/j.tej.2020.106765
Schnitzer, D., Lounsbury, D. S., Carvallo, J. P., Deshmukh, R., Apt, J., and Kammen, D. M. (2014). A critical review of best practices based on seven case studies. California: United Nations, 122.
Singh, S., Singh, M., and Chandra Kaushik, S. (2016). Feasibility study of an islanded microgrid in rural area consisting of PV, wind, biomass and battery energy storage system. Energy Convers. Manag. 128, 178–190. doi:10.1016/j.enconman.2016.09.046
Smets, A., Isabella, O., Jäger, K., van Swaaij, R., and Zeman, M. (2016). Solar Energy: the physics and engineering of photovoltaic conversion, technologies and systems. Cambridge, UK: UIT Cambridge Ltd.
Sofimieari, I., Mustafa, M. W. B., and Obite, F. (2019). Modelling and analysis of a PV/Wind/Diesel hybrid standalone microgrid for rural electrification in Nigeria. Bull. Electric. Eng. Inform. 8 (4), 1468–1477. doi:10.11591/eei.v8i4.1608
Swift, A., and Walker, R. (2015). En wind Energy Essentials, Conversion of power in the wind to electricity. New York, NY: John Wiley & Sons, 71–99. doi:10.1002/9781119040934.ch4
Veilleux, G., Potisat, T., Pezim, D., Ribback, C., Ling, J., Adam, K., et al. (2020). Techno-economic analysis of microgrid projects for rural electrification: a systematic approach to the redesign of Koh Jik off-grid case study. Energy Sustain. Dev. 54, 1–13. doi:10.1016/j.esd.2019.09.007
World Bank (2019). Access to electricity, rural (% of rural population)|data. Available at: https://data.worldbank.org/indicator/EG.ELC.ACCS.RU.ZS?end=2016&locations=PE-CO-UY-BR-AR-CL-BO&start=1990&view=chart (Accessed December 15, 2019).
Keywords: solar energy, wind energy, microgrid, energy storage, rural electrification, Perú (Min5-Max 8)
Citation: Canziani F, Vargas R and Gastelo-Roque JA (2021) Hybrid Photovoltaic-Wind Microgrid With Battery Storage for Rural Electrification: A Case Study in Perú. Front. Energy Res. 8:528571. doi: 10.3389/fenrg.2020.528571
Received: 30 January 2020; Accepted: 13 November 2020;
Published: 18 February 2021.
Edited by:
Jeffrey Hardy, Imperial College London, United KingdomReviewed by:
Shafiqur Rehman, King Fahd University of Petroleum and Minerals, Saudi ArabiaPu Li, Technische Universität Ilmenau, Germany
Copyright © 2021 Canziani, Vargas and Gastelo-Roque. This is an open-access article distributed under the terms of the Creative Commons Attribution License (CC BY). The use, distribution or reproduction in other forums is permitted, provided the original author(s) and the copyright owner(s) are credited and that the original publication in this journal is cited, in accordance with accepted academic practice. No use, distribution or reproduction is permitted which does not comply with these terms.
*Correspondence: José A. Gastelo-Roque, amdhc3RlbG9yQHVucHJnLmVkdS5wZQ==