 Rafael Castro-Amoedo*Theodoros DamartzisJulia GranacherFrançois Maréchal
- Industrial Process and Energy Systems Engineering (IPESE), École Polytechnique Fédérale de Lausanne, Lausanne, Switzerland
Wastewater treatment and sludge disposal are responsible for considerable costs and emissions in a global scale. With population and urbanization growing, tackling the rational and efficient use of energy while fulfilling the desired effluent standards are imperative. In this work, a superstructure-based approach is designed to incorporate alternative treatments for wastewater. In particular, technologies like hydrothermal liquefaction and gasification, coupled with technologies for CO2 conversion to value-added products are studied. Multi-objective optimization is applied as a way to generate multiple solutions that correspond to different system configurations. From a reference treatment cost of almost
1. Introduction and State of the Art
With increasing population growth, urbanization and industrialization, wastewater treatment plants (WWTPs) are of vital importance. Not only do they directly impact the aquatic ecosystem, but they also play a pivotal role in guaranteeing water security in a world scenario of hydric stress (OECD, 2012). Primarily focused on removing impurities from wastewater, practitioners used to pay little attention to both energy and environmental bill of their facilities. However, due to unavoidable legalization and even public perception, the water-energy nexus has become a key topic in the field (Gu et al., 2017), with the scientific community working to manage both, wastewater treatment quality and energy efficiency. WWTPs are generally the facilities with the highest energy bill in a municipality. This refers up to 5% of the total electrical energy load (Chen and Chen, 2013), while the energy consumption is responsible for up to 40% (Panepinto et al., 2016) of the operating costs in such plants.
Low quality feedstocks are inherently difficult to valorize, one of the main reasons being typically the high amount of water they contain. Water can be removed by means of filtration and thermal drying, but that usually comes to a tremendous energetic (and economic) cost. Particular technologies have been developed to lead with this setback, profiting from the abundant availability of feedstocks as well as its price (typically free of charge).
In a study developed by Ang et al. (2019), the overall efficiency, costs, and impact are tackled, while introducing multiple input treatment options as well as several disposal scenarios. However, it does not consider different conversion pathways for wastewater, but it rather focuses on the conventional system configuration.
WWTP that rely only on biogas production and use it as heat and power source face a problem particularly difficult in summer and in southern latitudes. Indeed, with practically no storage of biogas being done industrially, biogas has to be burnt and the heat evacuated. This results in tremendous energetic losses as the demand in those periods is low. To this end, the production of biocrude and synthetic natural gas (SNG) as representative liquid and gaseous fuels, respectively, seems an interesting alternative. This is due to the fact that apart from the simultaneous production of fuels, it also offers storage options and thus is able to provide additional flexibility to the energy system.
Hydrothermal treatment coupled with WWTP has been already studied in the literature. Elliott (2020) considered the valorization of the plant’s effluent for the production of biocrude using hydrothermal liquefaction (HTL). Similarly, Chen et al. (2014) focused their study on the feasibility of converting a mixed-culture algal biomass, and thus the exploitation of the contained carbon and the subsequent production of biocrude. On the other hand, hydrothermal gasification of sewage sludge has gained a prominent attention as well. Mainly focused in the production of SNG (Gassner et al., 2011), or even targeted in hydrogen (He et al., 2014), it offers an interesting alternative CO2.
CO2 removal from gaseous effluents and subsequent upgrading to value-added products has led to a growing number of publications in this field (Olajire, 2010). Indeed captured CO2 can be transformed from a waste to a raw material and act as the building block molecule for the synthesis of organic compounds, with the primary focus of synthesizing biofuels but also biochemicals. A number of different processing routes have been proposed including the catalytic hydrogenation of CO2 to methanol and olefins (Pérez-Fortes et al., 2016), SNG (Gorre et al., 2019), diesel (Dimitriou et al., 2015), and jet fuels (Willauer et al., 2012), to name a few. However, capturing CO2 in industrial processes is responsible for around 75% of the overall cost of carbon capture and storage (Olajire, 2010).
Concerning mathematical approaches, a large majority of the publications focus either on environmental impact or economic implications of adopting a given configuration or treating a specific amount of wastewater. However, this approach is unable to capture the required trade-offs that decision-makers (DM) are looking for—solutions that are a compromise between sound environmental benefit and low to moderate economic costs. Sometimes DM look also for high efficiencies as objective, which might result to unbearable investment costs.
Indeed, most of the existing studies deal with the processing of the WWTP effluents in a straightforward rather than a systematic and explorative way. To the best of the authors’ knowledge, there is no research addressing systematically the competition between the three main pathways, namely the benchmark system for biogas production, and the valorization through HTL and gasification for biocrude and SNG production respectively, exploring the synergies and opportunities of material, energy and economic integration.
The work developed in this publication utilizes system optimization as a solution generator. Thus costs, impacts and efficiencies of different system configurations of treatment options integrated in a WWTP are revealed. Consequently, system flexibility is increased to address challenging environmental regulations by means of multi-objective optimization (MOO) coupled with a superstructure-based approach.
The structure of this work is as follows: In Section 2, a superstructure-based approached is depicted and the main building blocks of the system are described; Section 3 shows the methodology followed as well as the key performance indicators (KPI) chosen to characterize the competing configurations. In Section 4, results are presented and discussed and finally in Section 5, conclusions are drawn and summarized.
2. Process Description and Modeling
A superstructure-based approach is the design methodology followed in this work to assess different wastewater thermochemical conversion routes, corresponding to the use and/or combination of different technologies. A similar approach has been proposed and used by several authors (Maronese et al., 2015; Santibañez-Aguilar et al., 2015). All process units are represented as black-box models, built by assessing the conversion features, either from extensive literature review or real, operating, units. Flowsheeting software (e.g., Belsim Vali) is used to describe the complex processes and is the base for the linearization of the mass and energy flows, based on a reference size (typically the inlet mass flow). The linear nature of the approach is kept by assuming linear operating and investment costs, as well as process efficiency. Flows entering and leaving a model boundaries allow connections between different technologies, granting a simple and fast integration and connection between them.
The superstructure proposed (Figure 1) tackles the challenge of wastewater treatment coupled with sludge handling, disposal and valorization.
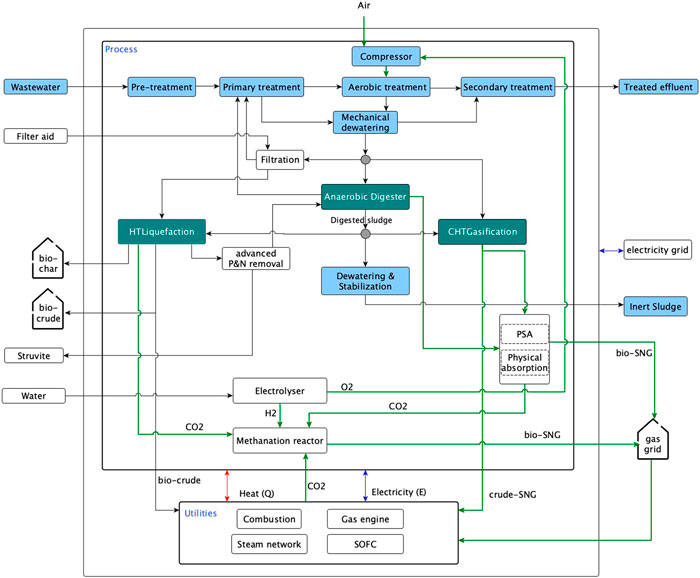
FIGURE 1. Wastewater superstructure.
The relevant units are described below, where only the most important assumptions will be discussed. All assumed parameters, ranging from economic (Tables 1 and 2), environmental (Table 3) and thermodynamic/operating (Table 4) are to be found in the end of this section. For environmental considerations, only the most impactful units/flows were considered.
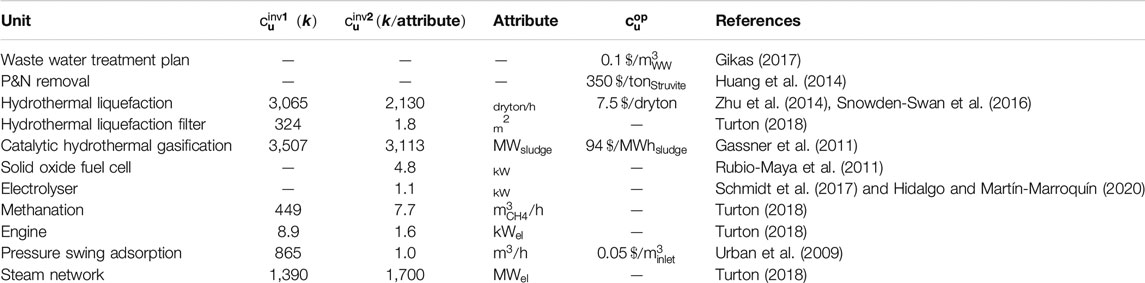
TABLE 1. Investment and operating costs for current and potential technologies.
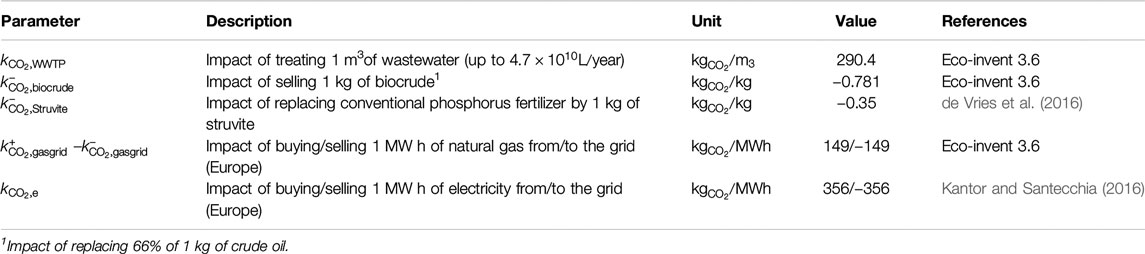
TABLE 2. Reference environmental impacts of main activities.
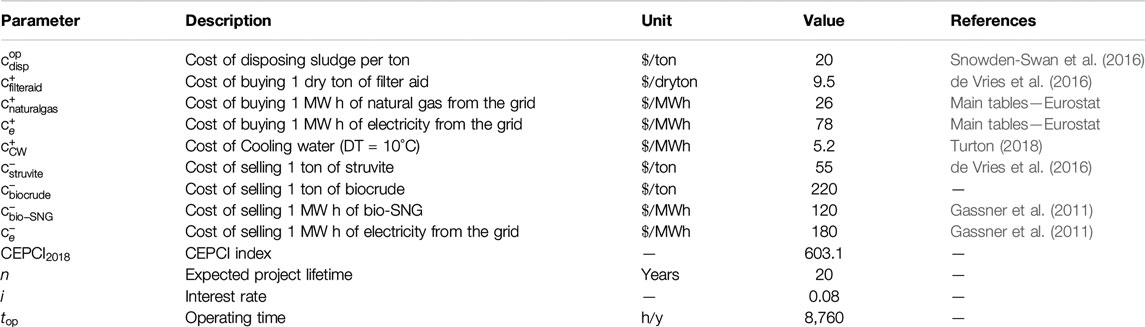
TABLE 3. Utilities operating costs and general economic assumptions.

TABLE 4. General assumptions and operating conditions.
2.1. Wastewater Treatment Plant
WWTP are considered sources of CO2, CH4, and N2O, due to the unavoidable leaks of biological processes taking place (aerobic and anaerobic treatments). According to Molinos-Senante et al. (2018) who modeled wastewater energy intensity for a large spectrum of facilities, WWTPs are energy intensity facilities. Average energy demand profiles were taken and incorporated in the model.
The light blue boxes (Figure 1) contain the backbone units of a classic, state-of-the-art WWTP. Wastewater is cleaned from contaminants and carbon-rich substances and leaves as a treated effluent that can be safely discharged in a receiving body. In the process, sludge is formed (primary and secondary), dewatered and sent to anaerobic digestion for biogas production, which is used to supply local energy needs. The remaining solid digestate is a major liability that needs drying and stabilization and imposes a cost for disposal in the overall WWTP system.
2.2. Hydrothermal Liquefaction
HTL is a thermochemical conversion process that makes use of water present in the feedstock to produce biocrude, a raw material for liquid transportation fuels, thus fully replacing crude oil. It mainly consists of a thermal degradation step to break down the large carbon chains contained in the biomass feedstock, the dissolution of useful materials in water and a recombination (polymerization) step for the synthesis of the final products (Gollakota et al., 2018). As such, it is able to handle feedstocks with high moisture level (up to 90% content), avoiding the drying step that is needed for other kinds of technologies (Snowden-Swan et al., 2016). Wet wastes (like sludge) are usually readily available, thus dismissing preprocessing and preparation steps associated with lignocellulosic based feedstocks (He et al., 2014); Four products are obtained from HTL: i) biocrude, which is the main desirable product, ii) aqueous co-products (ACP) accounting for up to 75% of weight in product distribution, iii) biochar, which is a solid residue rich in carbon, retaining up to 45% of inlet carbon content, and iv) a gaseous stream, mainly constituted by CO2 and H20.
Albeit little attention has been given to the aqueous effluent, a great deal of carbon and other nutrients need treatment and valorization. A recent publication on the characterization of the aqueous stream compares several feedstocks with different operating conditions; in particular primary, secondary, and digested sludges are analyzed (Maddi et al., 2017). The authors conclude that higher lipid content results in increased biocrude yields, while more proteic substrates (present in high amounts in secondary sludge) are associated with higher (more than double) carbon amount in aqueous phase. For this reason it is suggested to use HTL either directly in digested sludge or in pre-digested sludge as a mixture of primary and secondary sludges. Bauer et al. (2018) also analyzed different feedstocks for HTL. They concluded that pre-digested as well as digested sludge show higher biocrude yields compared to other sources of waste. This study focuses also in evaluating the quantity and quality of the ACP. It is also reported that the ACP of liquefaction is far more noxious than common industrial wastewaters, requiring treatment before discharge. This might compromise the economic viability of stand-alone HTL units. It is, however, a decisive incentive to couple HTL in a WWTP, in order to benefit from process symbiosis.
HTL works at temperatures ranging from 250 up to 380°C and pressures up to 30 MPa, with residence times spanning from 5 to 60 min (Mørup et al., 2012). Oxygen removal is of critical importance, as lower concentrations allow higher heating values of bio-oil (around 35 MJ/kg). When compared with competing processes, like gasification and pyrolysis systems, HTL has a lower energy penalty as it avoids the water vaporization step.
Filtration followed by hydrothermal co-liquefaction has recently proved to be particularly efficient for wastewater sludge with different solids content (Biller et al., 2018; Anastasakis et al., 2018), and thus is included as an option for the superstructure. Indeed, higher performances are achieved, and operating costs are reduced, due to the avoided catalyst in the main reaction step. A schematic representation for a reference flow of 1,000 kg/h of inlet sludge is depicted in Figure 2. Different feedstocks compositions are handled by conversion to a generic layer, according to experimental results given by Snowden-Swan et al. (2016) and Bauer et al., (2018).
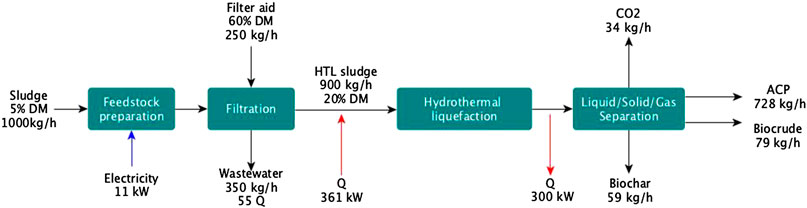
FIGURE 2. Hydrothermal liquefaction schematic representation.
2.3. Catalytic Hydrothermal Gasification
Similarly to HTL, Catalytic hydrothermal gasification (CHTG) is able to valorize intrinsically difficult low quality feedstocks, being particularly suitable for those with more than 80% water content. The water evaporation step is by-passed as water is kept in the liquid phase under the imposed supercritical conditions, thus avoiding supplying the heat of vaporization. SNG or bio-SNG can be produced if upgraded from a methane rich gas leaving the catalytic reactor. The process diagram, Figure 3, shows the main steps including the upgrading, energy, and material needs.
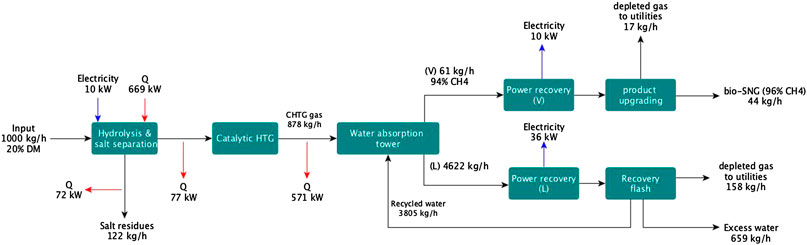
FIGURE 3. Catalytic hydrothermal gasification schematic representation.
Operating conditions and process description were the ones reported elsewhere (Gassner et al., 2011; Mian et al., 2015), using 20% solids content as input.
2.4. Phosporous and Nitrogen Recovery/Struvite Formation
Besides Sun, water, and CO2, minerals are a crucial nutrient for crops growth; in particular phosporous (P), nitrogen (N), and potassium (K) are the most relevant. Crop yields may be increased up to 100% by increasing the amount of nutrients in the soil, according to a recent report on struvite recovery (de Vries et al., 2016).
Mineral fertilisers (phosphate rock) are a non-renewable resource. Struvite (MgNH4PO4·6H2O) is a fertiliser that can be obtained from wastewater with high concentrations of both P and N; it can be precipitated by the addition of magnesium salts under basic conditions. Despite a lower solubility in water struvite is able to replace mineral fertilisers on a P2O5 basis (Degryse et al., 2017), including some cases where it performs statistically better (Li et al., 2019).
In a review of struvite from several feedstocks (Kataki et al., 2016), six different recovery technologies were described. Applied to municipal wastewater and with industrial applicability, only chemical precipitation is used. Fluidized bed reactors are the most deployed reactor for chemical precipitation (Li et al., 2019) and they were used as the modeling base in the present work. High P recovery (up to 90%) is reported, despite the addition of some P and/or NH4 salts, that accounts for a large share (up to 90%) of operating costs (Ye et al., 2020).
In a recent review focusing on bottlenecks and challenges of struvite formation, Li et al. (2019) have shown that implementing struvite precipitation as a post-treatment technology (as implemented in Figure 1) for both P and N recovery helps reducing the burden associated with hydrothermal treatments. Furthermore, it reduces the volume that needs treatment in a WWTP.
From the cost perspective, several authors (Mayer et al., 2016; Kataki et al., 2016) agree on the non-profitability of recovering struvite by means of chemical precipitation, due to the low market value motivated by low market cost of rock phosphate. Struvite market prices are not consensual; 55 €/ton was taken as a reference (de Vries et al., 2016), which is the closest to commercial P fertilizers. Concerning operating costs, 350 €/ton of struvite were considered (Huang et al., 2014), coherent with the values reported in Mayer et al. (2016), and accounting for average values of chemical compounds added in a wastewater treatment environment. Complementary, Li et al. (2019) report that a selling price close to 430 $/ton of struvite would be enough to guarantee the investment on a plant in Belgium. The same reference asks for more research on the economics, with a focus on the reagents promoting struvite crystallization.
In addition, Rahimi et al. (2020) points economics as the major hinder to industrial deployment, mostly due to the need of magnesium salts to promote struvite precipitation. However, it sheds some light on the potential for magnesium oxide (MgO) as a cheap and abundant source of magnesium, that is expected to help changing the overall economics.
However, all of them agree on the lower environmental impact, as well as the need to reduce phosphorous discharges in receiving bodies. Thus, there is a direct environmental benefit of recovering struvite of
2.5. CO2 Removal and Upgrading
On the one hand, the positive impact of CO2 removal from environment can be supported by economic incentives. On the other hand, if used and upgraded as a carbon source it can yield useful products, thus creating an economic off-set.
For moderate to high partial pressures (up to 40%), physical absorption processes might be used for CO2 capture, as the gas is absorbed according to Henry’s law (Olajire, 2010). Selexol process (Gassner et al., 2011) is implemented in CHTG to purify CH4 up to gas grid quality. Pressure swing adsorption (PSA), a discontinuous process that removes CO2 by cycles of adsorption and regeneration is also commonly used and implemented. For both processes, the mechanical power to be used has been estimated between 600 and 800 kJ/kgcrudegas. For PSA, temperature swing adsorption precedes to ensure drying over aluminium-oxide to ensure a dried feed (Gassner and Maréchal, 2009); the process consumes
Both methanol and methane formation from CO2 require expensive H2 to work; the former has the advantage of consuming less H2 and having an higher energy density (at standard conditions), being simultaneously easier to store. The latter has the main advantage of integration in the existing natural gas infrastructure. Miguel et al. (2015) have shown that from a thermodynamic point of view the valorization of CO2 to methane (SNG) is easier and requires less harsh conditions. Methanation is also among the systems expected to contribute to a low-carbon economy, with chemical methanation showing the greatest potential to be implemented on large scale compared with the biological counterpart, not only due to economics but also to technical aspects (Hidalgo and Martín-Marroquín, 2020).
Conversion of CO2 to valuable products is thus conditioned in this superstructure to SNG. The underlying principle is the Sabatier reaction, taking place in a (catalytic) methanation reactor and by making use of electrolysis as H2 provider. The model is adapted from (Wang et al., 2018), making use of an alkaline electrolysis cell; high level of market maturity and utilization, coupled with the lowest investment costs among the electrolysis cells (Hidalgo and Martín-Marroquín, 2020), motivated the selection.
Hidalgo and Martín-Marroquín (2020) reviewed the current state of power-to-methane technologies with a forecast for the next 30 years, up to 2050. In the analysis, heavier deployment coupled with mass production are expected to drive both electrolysis and methanation prices down. The same reference points at hydrogen production as the major cost, with the range of current investment on alkaline electrolysis cell between 800 and 1,500 €/kW, in line with values from other sources (Schmidt et al., 2017).
2.6. Utilities
The utilities section consists of technologies used to close the thermal and energy balance of the process section. It includes a combustion unit, equivalent to a boiler, a gas engine, a steam network (SN), and a solid oxide fuel cell (SOFC). Operating conditions were not object of optimization. Efficiencies were taken as the most common values in the literature and steam temperature levels were chosen to fit the thermal profiles. The SOFC unit was modeled based on the work of (Facchinetti et al., 2011). SN investment cost was taken as the turbine cost.
3. Methodology
3.1. Key Performance Indicators
A number of KPI are used to compare different scenarios and to validate models taking into account an extensive literature review on the topic Table 5.
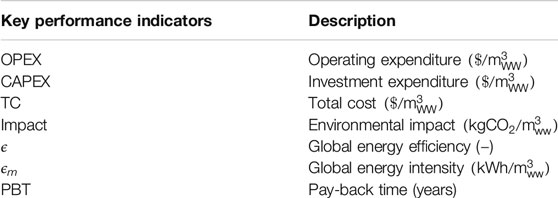
TABLE 5. Key performance indicators.
The thermodynamic performance of different system configurations is assessed based on the total conversion efficiency. This allows, besides characterizing chemical conversion, to evaluate the process integration quality based on both energy and mass efficiencies. Energy efficiency (Eq. 1) is defined as the ratio between the amount of energy leaving the system (either biocrude, SNG or biogas) and entering (besides wastewater, also electricity, natural gas, and filter aid biomass). For mass efficiency (Eq. 2) the ratio between the net energy input (defined as energy flows entering subtracted by flows leaving) and the total amount of wastewater entering the system is taken. When used,
Environmental impact (Eq. 3) was calculated in terms of CO2 emissions using the global warning potential 100a method, corresponding to the Intergovernmental Panel on Climate Change 2013 global warming potential impact method and considering a time-range of 100 years. It was chosen due to its widespread use and easiness of comparison with other studies. It is computed as the ratio between the impact of operating the system (given as the impact sum of units, resources, and electricity) and the inlet flow of wastewater.
For both Eqs 2 and 3 only one of the electricity flows is non-zero, which means that the system is either a net importer or exporter. Pay-back time is a metric targeting investment decisions and is defined as the ratio between the investment and the difference in operational expenditures accounted by the investment (Eq. 4).
3.2. Mathematical Formulation
The problem is formulated as a mixed-integer linear programming problem. The material and energy flow models contain relevant information concerning physical properties used to define both mass and energy requirements. The approach presented in Maréchal and Kalitventzeff (1998) is used to satisfy the minimum energy requirements. It combines heat cascade generation (Eqs 9–11) with pinch analysis to obtain the optimal utility network with respect to minimum cost, while satisfying both electricity (Eq. 12) and mass balances (Eqs. 13–15). Solutions are generated by considering a weighted sum of both objectives (Eq. 5), Operating expenditures (OPEX) (Eq. 6) and Capital expenditures (CAPEX) (Eq. 7). Constraints are also placed in the minimum and maximum capacity of each unit (Eq. 8).
with:
Heat cascade:
Electricity balance:
Resources mass balance:
Units mass balance:
The mixed-integer linear programming problem is written in AMPL (2013) and solved by IBM ILOG CPLEX Optimization Studio (Cplex, 2009). Table 6 explain the Indices, sets, variables, and parameters used in the formulation.
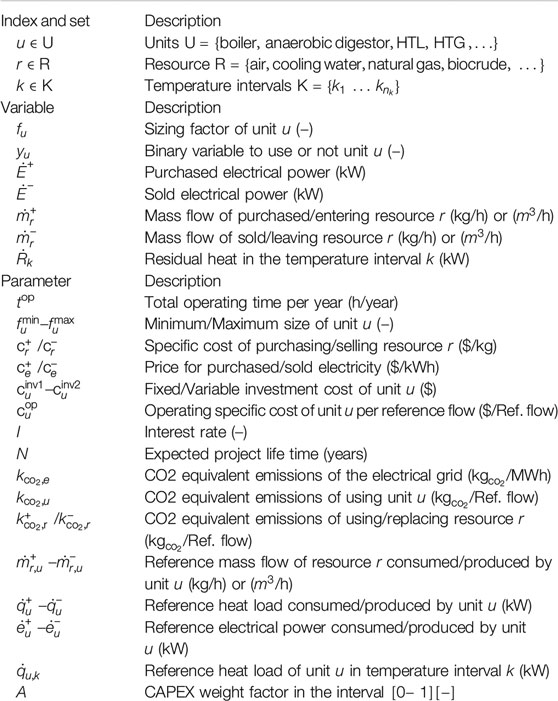
TABLE 6. Index, sets, variables and parameters in the MILP formulation.
3.3. Multi-Objective Optimization
Single objective optimization is often not enough for decision making, as there are typically conflicting objectives. MOO provides an efficient way of generating optimal solutions forming a Pareto front. A Pareto front represents a set of non-dominated solutions—meaning none of the objectives can be improved without degrading another one (Cui et al., 2017). MOO has been widely studied and applied in a multitude of research fields, among which biomass and waste conversion (Fazlollahi et al., 2012; Celebi et al., 2017). In this work, MOO is introduced in the objective function itself, by making use of a CAPEX weight factor (α in Eq. 5), that is allowed to change between 0 and 1. This guarantees the generation of a set of different solutions that in the end correspond to different system configurations. Steps of 0.005 were used.
4. Results and Discussion
The optimization procedure yields a Pareto front (Figure 4) that can be translated into a set of different system configurations and optimal values for the decision variables (Table 7). Due to the nature of mathematical formulation used, the configuration and thus the set of decision variables is the same for different (albeit similar) values of CAPEX weight factor (α)—leading to overlapping solutions. Wastewater input corresponds to 25,000 ton/h which is translated to approximately 116 MW in the reference scenario. Sludge is anaerobically digested producing biogas, which is internally used to co-generate heat and electricity. Nevertheless, extra natural gas and electricity must be supplied resulting in a global energy efficiency of almost 5% and an impact close to
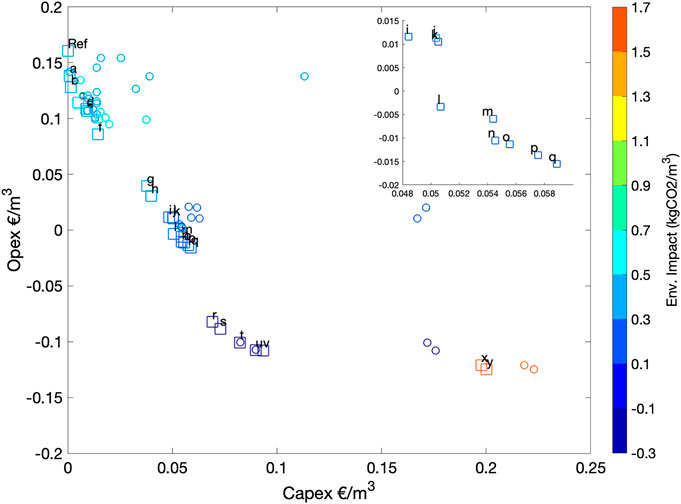
FIGURE 4. Solution set (circles and squares); Pareto points are the ones represented by squares and contain the same reference as in Table 7. Color shows the interval gap of environmental impact. Subplot is a zoom for points between i and q.
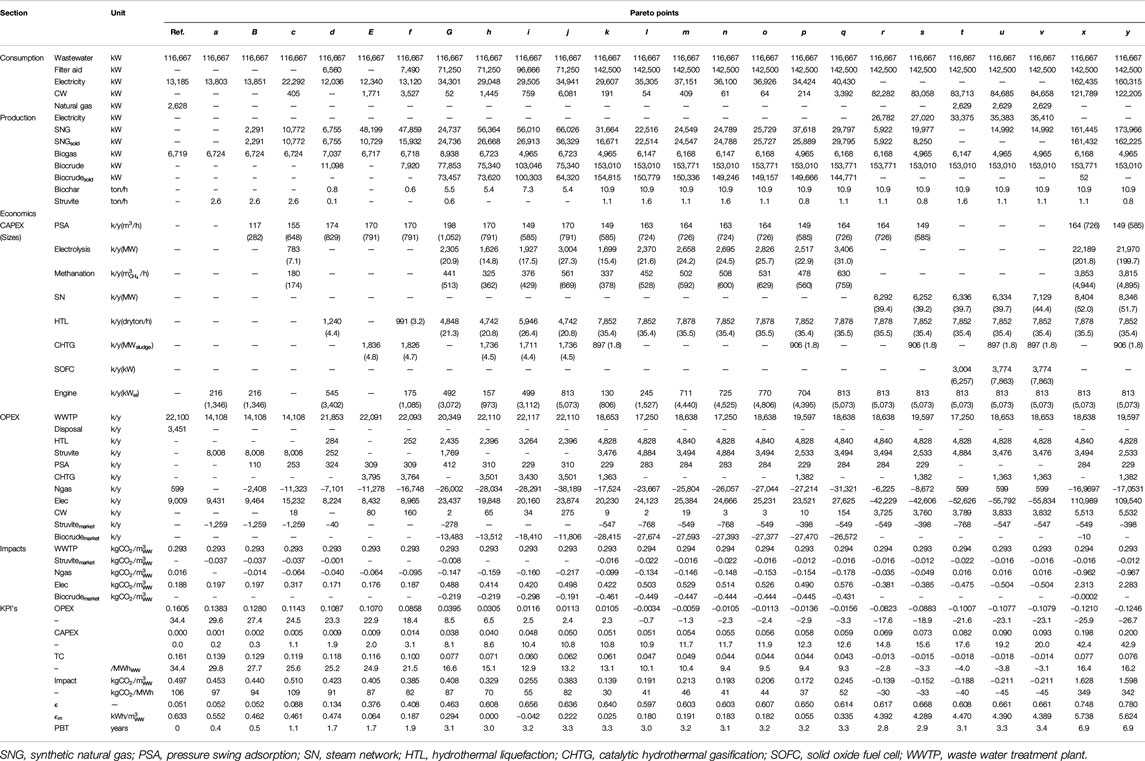
TABLE 7. Detailed energy, costs, sizes, and KPIs for Pareto points.
Generated solutions and in particular Pareto points, are able to provide an interesting trade-off not only between operating and investment costs, but also taking into consideration other KPI’s, such as impact and efficiencies, as defined in Table 5. With increasing investment, the reduction of OPEX is mainly driven by increasing SNG and biocrude export and for some configurations, by electricity production.
From the reference cost of
A second Pareto region corresponds from point g to q. It is mainly characterized by CO2 recovery and upgrade to gas grid compatibility by investing in both electrolysis and methanation units. Together with CHTG, production and export of SNG are increased reaching values of 36 MW and economic benefits of 38 M$/y. At the same time, higher investment in HTL allows for biocrude injection in the market, yielding as well significant operating benefits (up to 28.4 M$/y). TC is reduced up to 73% and impact goes as low as 0.139 kgCO2/
A third Pareto section, from points r to v, provides a net economic benefit (negative TC), arising mainly from electricity production, complemented by an investment in the SN. At the same time biocrude is internally consumed, producing steam and electricity.The SNG production is reduced and for certain configurations reverted, meaning natural gas is imported from the grid. Electricity production is thus both an economic and environmental driving force. Indeed, the environmental impact is negative for all the section configurations which is equivalent to a net environmental benefit, with a global energy efficiency up to 66%. On the other hand, the need for importing natural gas and the internal use of biocrude justify energy intensities as high as seven times the reference case.
The last set of Pareto, corresponding to points x and y are the ones with the lowest OPEX but the highest investment. There is maximization of SNG export by means of CO2 conversion to CH4 through H2 production via electrolysis, corresponding to heavy electricity consumption (up to 162 MW). Indeed, the incentive to control investment is practically vanished in these cases and extremely expensive technologies are chosen even if the marginal operating benefit compared to the third Pareto region is small. However, both Pareto points present considerable environmental impact (three times the reference case) and a high energy intensity due to the need of importing electricity. In spite of it, TC is able to be reduced by 50% compared to the reference case. Lastly, the pay-back time, an important measure for investors, is close to 7 years which represents a liability due to the investment in technologies with reducing industrial implementation.
Figures 5A,B as well as Figure 6 graphically represent the information contained in Table 7 for all the Pareto front solutions. Figure 5A shows how biocrude and SNG are the major economic driving forces up to point q, after which electricity exports lead the economic benefit. Similarly, global energy intensity is reduced up to point q, after which by means of exporting electricity the export of biocrude is eliminated. This leads to energy intensity values up to seven times higher than the reference. Figure 5B graphically displays investment decisions as stacked bars, TC as a line and pay-back time as numbers above the stacks. For almost all the configurations HTL and PSA are chosen technologies as they are able to produce biocrude and SNG respectively. The use of electrolysis is also frequent as a way to produce H2 for CO2 upgrading. In the most expensive configurations the investment in electrolysis accounts for up to 50% of the total investment, leading inclusively to negative TCs as the production of electricity is maximized.
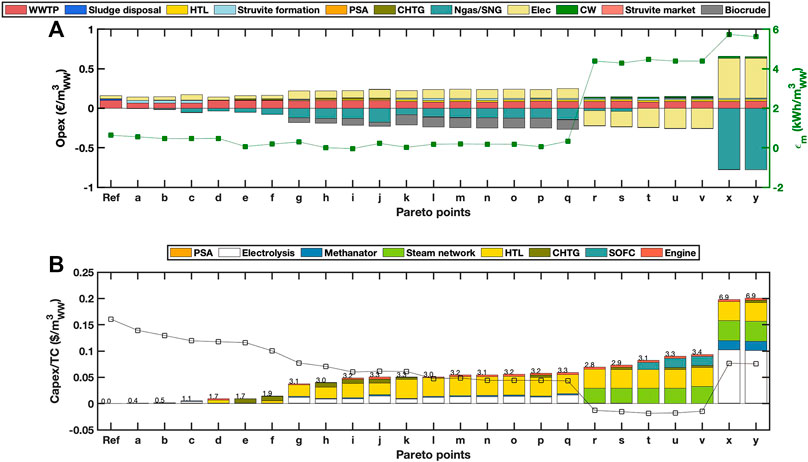
FIGURE 5. Pareto optimal configuration; (A) stacked bars represent OPEX, line with markers represent
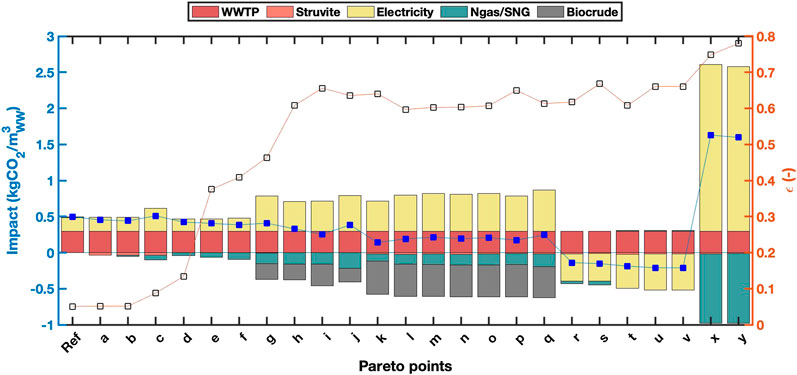
FIGURE 6. Pareto optimal configuration with stacked bars corresponding to Impact partition, blue markers and line to the overall impact; orange line and axis correspond to ϵ.
On the environmental impact and energy efficiency, Figure 6 shows that up to the second Pareto region (point q) only a small to moderate reduction of the reference impact takes place. For the third region (from point r to v), exporting electricity and replacing an equivalent amount of CO2 (the grid carbon intensity) renders those configurations negative equivalent emissions systems. The last two options (points x and y), which include maximizing electricity use to supply the production of SNG, show a considerable increase in impact. For all the configurations the energetic recovery of wastewater has drastically increased. However, as it is demonstrated it might not be a synonym of sound environmental performance. In particular, configurations x and y achieve the highest efficiencies despite a considerable increase in impact.
Total inlet wastewater (in weight or volume) is an important parameter that is likely to affect decision-making. In reality, although WWTPs tend to grow in area and equivalent people managed, the average wastewater in urban centers is rather small. To account for it a parametric analysis on the amount of inlet wastewater and thus the size of the facility was performed. It was changed between the reference amount of 25.000 ton/h, equivalent to 1.7 M inhabitants and 2.500 ton/h, corresponding to 0.17 M inhabitants, in steps of 2.500 ton/h. The results are shown in Figure 7. OPEX and CAPEX have a consistent decreasing and increasing tendency, respectively, regardless of the Pareto point or the inlet flow of wastewater. Concerning TC, the first points are more likely to be less competitive for small flows, which means a TC closer to the reference value.
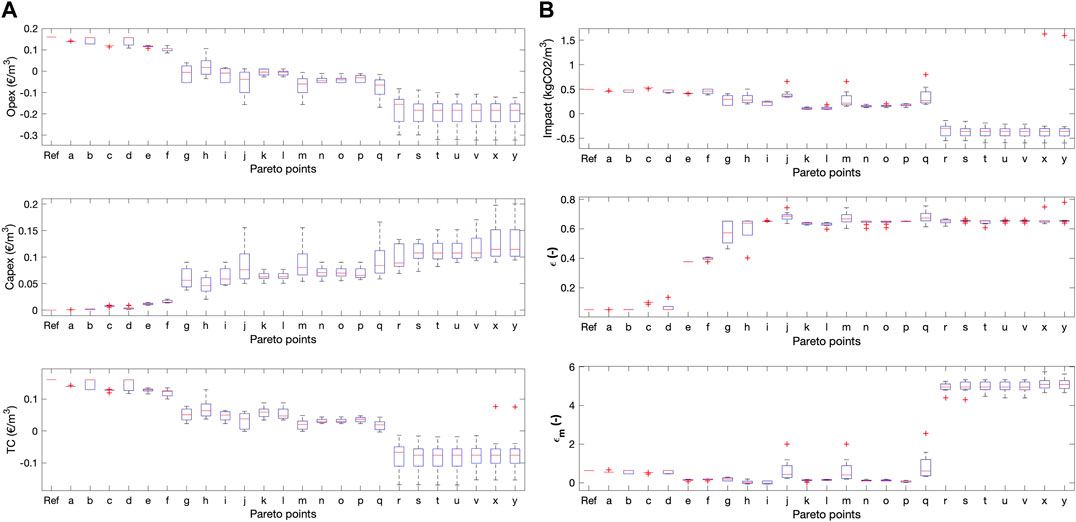
FIGURE 7. Box plots for parametric analysis on inlet wastewater flow: (A) economic key performance indicators, (B) impact and efficiencies key performance indicators.
In the first region, between points a and f, size plays a role with TC for some configurations being similar to the reference value. This aspect however, might hinder the feasibility of the configuration purposed. In the same way, impacts and both efficiencies have values that come close to that of the reference for low inlet flows.
For the second region, between points g and q, solutions provide consistently lower TC than the reference despite some extreme values in investment notably points j, m, and q. For those points, lower OPEX and negative TC are achieved. The consequence is immediate in terms of environmental impact, with values closer to those of the reference case. Similarly, the higher impact corresponds in this situation to a higher global energy intensity
The third region, between points r and v, shows the highest variability in TC. In this region, smaller flows achieve lower values compared to bigger ones due to an increasing investment in technology, but providing a considerably lower OPEX. By exploring new opportunities, the impact is also considerably reduced as export of both electricity and SNG are maximized. Nevertheless, the energy efficiency seems to be stable around 60%, and the energy intensity high regardless of the size, which is again due to the fact of internally using biocrude as an energy provider.
The fourth and last region, of points x and y, shows a curious behavior. The higher inlet flows corresponding to the main results shown (Figure 5) are outliers of the parametric analysis-observed in the TC box plot. Indeed the huge amount of wastewater and its intrinsic energetic content motivated the investment in technologies that make use of electricity to produce SNG (electrolysis and methanation units). However, with a reduced flow the system converges to a configuration very similar to those of the third region, amidst the corresponding reduction in global energy efficiencies. By changing system configuration the investment is reduced and TC shifts toward negative values, indicating a net economic profitable solution.
5. Conclusions
The production of biogas and its use for internal WWTP purposes is only able to explore 5% of the total intrinsic energetic content of wastewater. In order to minimize costs, technologies that allow handling and valorizing not only biogas, but also sludge (with variable water content) were studied. MOO was used to generate a set of competing solutions to be analyzed and discussed by DM.
HTL is chosen in almost all the configurations analyzed, which is the result of exploring system synergies for its aqueous by-product whose further treatment can be explored within a typical WWTP configuration. For investment costs of up to
When higher investments are allowed, and because all economic results are extremely dependent on the economic assumptions, in particular electricity and (synthetic) natural gas prices as well as their ratio, investment in a SN coupled with a SOFC make use of the internally generated biocrude to maximize either electricity or SNG. In the end this provides substantial economic benefits. Actually, within the current assumptions framework the system’s TC can go below 0, transforming it in a net economic profitable system. Simultaneously, environmental impact can also change to negative values as the electrical grid carbon intensity is considerably high. Obeying economic motivations, there are also two configurations that albeit reducing operating cost at the expense of higher investment have a considerable impact (three times higher the reference case) which hinders their application.
Parametric analysis was performed on the inlet wastewater flow, changing it between 10 and 100% of its nominal value. The results show that for lower investments, smaller flows endanger the conclusions, with TCs in line with the reference values. However, for higher investments the adopted configurations perform systematically better.
This work paves the way for cheaper and more sustainable wastewater industrial clusters, showing how well new conversion routes can be interconnected to generate new system configurations.
Data Availability Statement
All datasets presented in this study are included in the article.
Author Contributions
RA—Formulation and model developed, results generation, analysis, and discussion. TD—Literature review and manuscript review. JG—Catalytic hydrothermal gasification model adaption and manuscript review. FM—Supervision results and conclusions discussion. All authors contributed to the article and approved the submitted version.
Conflict of Interest
The authors declare that the research was conducted in the absence of any commercial or financial relationships that could be construed as a potential conflict of interest.
Funding
This project has received funding from the European Union’s Horizon 2020 research and innovation program under the Marie Skłodowska-Curie Grant Agreement No 754354 and under Grant Agreement No 818011.
Abbreviations
WWTP, Wastewater treatment plant; WW, Wastewater; HTL, Hydrothermal liquefaction; CHTG, Catalytic hydrothermal gasification; TS, Total solids; VS, Volatile solids; OPEX, Operating expenditures; CAPEX, Capital expenditures; TC, Total cost; SNG, Synthetic natural gas; SOFC, Solid oxide fuel cell; SN, Steam network.
References
AMPL (2013). Encyclopedia of operations research and management science, Editors Gass, S. I., Fu, M. C. (Boston, MA: Springer US), 52.
Anastasakis, K., Biller, P., Madsen, R., Glasius, M., and Johannsen, I. (2018). Continuous hydrothermal liquefaction of biomass in a novel pilot plant with heat recovery and hydraulic oscillation. Energies 11 (10), 2695. doi: 10.3390/en11102695
V. Andreoli, M. von Sperling, and F. Fernandes (Editors) (2007). “Sludge treatment and disposal,” in Biological wastewater treatment series. London, UK: IWA Publication, Vol. 6.
Ang, M. S., Duyag, J., Tee, K. C., and Sy, C. L. (2019). A multi-period and multi-criterion optimization model integrating multiple input configurations, reuse, and disposal options for a wastewater treatment facility. J. Clean. Prod. 231, 1437–1449. doi: 10.1016/j.jclepro.2019.05.246
Bauer, S. K., Reynolds, C. F., Peng, S., and Colosi, L. M. (2018). Evaluating the water quality impacts of hydrothermal liquefaction assessment of carbon, nitrogen, and energy recovery. Bioresour. Technol. Rep. 2, 115–110. doi: 10.1016/j.biteb.2018.04.010
Biller, P., Johannsen, I., dos Passos, J. S., and Ottosen, L. D. M. (2018). Primary sewage sludge filtration using biomass filter aids and subsequent hydrothermal co-liquefaction. Water Res. 130, 58–68. doi: 10.1016/j.watres.2017.11.048
Celebi, A. D., Ensinas, A. V., Sharma, S., and Maréchal, F. (2017). Early-stage decision making approach for the selection of optimally integrated biorefinery processes. Energy 137, 908–916. doi: 10.1016/j.energy.2017.03.080
Chen, S., and Chen, B. (2013). Net energy production and emissions mitigation of domestic wastewater treatment system: a comparison of different biogas-sludge use alternatives. Bioresour. Technol. 144, 296–303. doi: 10.1016/j.biortech.2013.06.128
Chen, W.-T., Zhang, Y., Zhang, J., Yu, G., Schideman, L. C., Zhang, P., et al. (2014). Hydrothermal liquefaction of mixed-culture algal biomass from wastewater treatment system into bio-crude oil. Bioresour. Technol. 152, 130–139. doi: 10.1016/j.biortech.2013.10.111
CPLEX (2009). IBM ILOG CPLEX V12.1: User’s Manual for CPLEX. Armonk, NY: International Business Machines Corporation.
Cui, Y., Geng, Z., Zhu, Q., and Han, Y. (2017). Review: multi-objective optimization methods and application in energy saving. Energy 125, 681–704. doi: 10.1016/j.energy.2017.02.174
Daniel, R. C., Billing, J. M., Luna, M. L., Cantrell, K. J., Peterson, R. A., Bonebrake, M. L., et al. (2009). Characterization of filtration scale-up performance. Tech. Rep. PNNL-1811. Richland, WA: Pacific Northwest National Lab, Vol. 962841.
de Vries, S., Postma, R., van Scholl, L., Blom-Zandstra, G., Verhagen, J., and Harms, I. (2016). “Economic feasibility and climate benefits of using struvite from the Netherlands as a phosphate (P) fertilizer in West Africa,” in Plant production systems, PPO/PRI AGRO water-en biobased economy, PPO/PRI AGRO multifunctioneel landgebruik. Wageningen, NL: Wageningen Plant Research.
Degryse, F., Baird, R., da Silva, R. C., and McLaughlin, M. J. (2017). Dissolution rate and agronomic effectiveness of struvite fertilizers-effect of soil pH, granulation and base excess. Plant Soil. 410 (1), 139–152. doi: 10.1007/s11104-016-2990-2
Dimitriou, I., García-Gutiérrez, P., Elder, R. H., Cuéllar-Franca, R. M., Azapagic, A., and Allen, R. W. K. (2015). Carbon dioxide utilisation for production of transport fuels: process and economic analysis. Energy Environ. Sci. 8 (6), 1775–1789. doi: 10.1039/c4ee04117h
Elliott, D. C. (2020). “Hydrothermal liquefaction of sludge and biomass residues,” in Wastewater treatment residues as resources for biorefinery products and biofuels. New York, NY: Elsevier, 117–131.
Facchinetti, E., Favrat, D., and Marechal, F. (2011). Innovative hybrid cycle solid oxide fuel cell-inverted gas turbine with CO2 separation. Fuel Cells 11 (4), 565–572. doi: 10.1002/fuce.201000130
Fazlollahi, S., Mandel, P., Becker, G., and Maréchal, F. (2012). Methods for multi-objective investment and operating optimization of complex energy systems. Energy 45 (1), 12–22. doi: 10.1016/j.energy.2012.02.046
Gassner, M., and Maréchal, F. (2009). Thermo-economic process model for thermochemical production of synthetic natural gas (SNG) from lignocellulosic biomass. Biomass Bioenergy 33 (11), 1587–1604. doi: 10.1016/j.biombioe.2009.08.004
Gassner, M., Vogel, F., Heyen, G., and Maréchal, F. (2011). Optimal process design for the polygeneration of SNG, power and heat by hydrothermal gasification of waste biomass: thermo-economic process modelling and integration. Energy Environ. Sci. 4 (5), 1726. doi: 10.1039/c0ee00629g
Gikas, P. (2017). Towards energy positive wastewater treatment plants. J. Environ. Manag. 203, 621–629. doi: 10.1016/j.jenvman.2016.05.061
Gollakota, A., Kishore, N., and Gu, S. (2018). A review on hydrothermal liquefaction of biomass. Renew. Sustain. Energy Rev. 81, 1378–1392. doi: 10.1016/j.rser.2017.05.178
Gorre, J., Ortloff, F., and van Leeuwen, C. (2019). Production costs for synthetic methane in 2030 and 2050 of an optimized power-to-gas plant with intermediate hydrogen storage. Appl. Energy 253, 113594. doi: 10.1016/j.apenergy.2019.113594
Grobelak, A., Grosser, A., Kacprzak, M., and Kamizela, T. (2019). Sewage sludge processing and management in small and medium-sized municipal wastewater treatment plant-new technical solution. J. Environ. Manag. 234, 90–96. doi: 10.1016/j.jenvman.2018.12.111
Gu, Y., Li, Y., Li, X., Luo, P., Wang, H., Robinson, Z. P., et al. (2017). The feasibility and challenges of energy self-sufficient wastewater treatment plants. Appl. Energy 204, 1463–1475. doi: 10.1016/j.apenergy.2017.02.069
He, C., Chen, C.-L., Giannis, A., Yang, Y., and Wang, J.-Y. (2014). Hydrothermal gasification of sewage sludge and model compounds for renewable hydrogen production: a review. Renew. Sustain. Energy Rev. 39, 1127–1142. doi: 10.1016/j.rser.2014.07.141
He, W., Li, G., Kong, L., Wang, H., Huang, J., and Xu, J. (2008). Application of hydrothermal reaction in resource recovery of organic wastes. Resour. Conserv. Recycl. 52 (5), 691–699. doi: 10.1016/j.resconrec.2007.11.003
Heidrich, E. S., Curtis, T. P., and Dolfing, J. (2011). Determination of the internal chemical energy of wastewater. Environ. Sci. Technol. 45 (2), 827–832. doi: 10.1021/es103058w
Hidalgo, D., and Martín-Marroquín, J. M. (2020). Power-to-methane, coupling CO2 capture with fuel production: an overview. Renew. Sustain. Energy Rev. 132, 110057. doi: 10.1016/j.rser.2020.110057
Huang, H., Xiao, D., Zhang, Q., and Ding, L. (2014). Removal of ammonia from landfill leachate by struvite precipitation with the use of low-cost phosphate and magnesium sources. J. Environ. Manag. 145, 191–198. doi: 10.1016/j.jenvman.2014.06.021
Kantor, I., and Santecchia, A. (2016). D5.7—report on LC assessment tools based on the results of MORE and EPOS, 27.
Kataki, S., West, H., Clarke, M., and Baruah, D. C. (2016). Phosphorus recovery as struvite from farm, municipal and industrial waste: feedstock suitability, methods and pre-treatments. Waste Manag. 49, 437–454. doi: 10.1016/j.wasman.2016.01.003
Li, B., Boiarkina, I., Yu, W., Huang, H. M., Munir, T., Wang, G. Q., et al. (2019). Phosphorous recovery through struvite crystallization: challenges for future design. Sci. Total Environ. 648, 1244–1256. doi: 10.1016/j.scitotenv.2018.07.166
Maddi, B., Panisko, E., Wietsma, T., Lemmon, T., Swita, M., Albrecht, K., et al. (2017). Quantitative characterization of aqueous byproducts from hydrothermal liquefaction of municipal wastes, food industry wastes, and biomass grown on waste. ACS Sustain. Chem. Eng. 5 (3), 2205–2214. doi: 10.1021/acssuschemeng.6b02401
Main tables—Eurostat (2018). Available at: https://ec.europa.eu/eurostat/web/energy/data/main-tables (Accessed November 9, 2019).
Maréchal, F., and Kalitventzeff, B. (1998). Energy integration of industrial sites: tools, methodology and application. Appl. Therm. Eng. 18 (11), 921–933. doi: 10.1016/s1359-4311(98)00018-0
Maronese, S., Ensinas, A. V., Mian, A., Lazzaretto, A., and Maréchal, F. (2015). Optimum biorefinery pathways selection using the integer-cuts constraint method applied to a MILP problem. Ind. Eng. Chem. Res. 54 (28), 7038–7046. doi: 10.1021/acs.iecr.5b01439
Mayer, B. K., Baker, L. A., Boyer, T. H., Drechsel, P., Gifford, M., Hanjra, M. A., et al. (2016). Total value of phosphorus recovery. Environ. Sci. Technol. 50 (13), 6606–6620. doi: 10.1021/acs.est.6b01239
Mian, A., Ensinas, A. V., and Marechal, F. (2015). Multi-objective optimization of SNG production from microalgae through hydrothermal gasification. Comput. Chem. Eng. 76, 170–183. doi: 10.1016/j.compchemeng.2015.01.013
Miguel, C. V., Soria, M. A., Mendes, A., and Madeira, L. M. (2015). Direct CO2 hydrogenation to methane or methanol from post-combustion exhaust streams-a thermodynamic study. J. Nat. Gas Sci. Eng. 22, 1–8. doi: 10.1016/j.jngse.2014.11.010
Molinos-Senante, M., Sala-Garrido, R., and Iftimi, A. (2018). Energy intensity modeling for wastewater treatment technologies. Sci. Total Environ. 630, 1565–1572. doi: 10.1016/j.scitotenv.2018.02.327
Mørup, A. J., Christensen, P. R., Aarup, D. F., Dithmer, L., Mamakhel, A., Glasius, M., et al. (2012). Hydrothermal liquefaction of dried distillers grains with solubles: a reaction temperature study. Energy Fuels 26 (9), 5944–5953.
OECD (2012). Water quality and agriculture: meeting the policy challenge. OECD studies on water. Paris: OECD Publishing.
Olajire, A. A. (2010). CO2 capture and separation technologies for end-of-pipe applications-a review. Energy 35 (6), 2610–2628. doi: 10.1016/j.energy.2010.02.030
Panepinto, D., Fiore, S., Zappone, M., Genon, G., and Meucci, L. (2016). Evaluation of the energy efficiency of a large wastewater treatment plant in Italy. Appl. Energy 161, 404–411. doi: 10.1016/j.apenergy.2015.10.027
Pérez-Fortes, M., Schöneberger, J. C., Boulamanti, A., and Tzimas, E. (2016). Methanol synthesis using captured CO2 as raw material: techno-economic and environmental assessment. Appl. Energy 161, 718–732. doi: 10.1016/j.apenergy.2015.07.067
Rahimi, S., Modin, O., and Mijakovic, I. (2020). Technologies for biological removal and recovery of nitrogen from wastewater. Biotechnol. Adv. 43, 107570. doi: 10.1016/j.biotechadv.2020.107570
Rubio-Maya, C., Uche-Marcuello, J., Martínez-Gracia, A., and Bayod-Rújula, A. A. (2011). Design optimization of a polygeneration plant fuelled by natural gas and renewable energy sources. Appl. Energy 88 (2), 449–457. doi: 10.1016/j.apenergy.2010.07.009
Santibañez-Aguilar, J. E., Martinez-Gomez, J., Ponce-Ortega, J. M., Nápoles-Rivera, F., Serna-González, M., González-Campos, J. B., et al. (2015). Optimal planning for the reuse of municipal solid waste considering economic, environmental, and safety objectives. AIChE J 61 (6), 1881–1899. doi: 10.1002/aic.14785
Schmidt, O., Gambhir, A., Staffell, I., Hawkes, A., Nelson, J., and Few, S. (2017). Future cost and performance of water electrolysis: an expert elicitation study. Int. J. Hydrogen Energy 42 (52), 30470–30492. doi: 10.1016/j.ijhydene.2017.10.045
Snowden-Swan, L. J., Zhu, Y., Jones, S. B., Elliott, D. C., Schmidt, A. J., Hallen, R. T., et al. (2016). Hydrothermal liquefaction and upgrading of municipal wastewater treatment plant sludge: a preliminary techno-economic analysis. Tech. Rep. 25464, 1258731.
Turton, R. (2018). Analysis, synthesis and design of chemical processes. 5th Edn. Boston, MA: Prentice-Hall.
Tzanetis, K. F., Posada, J. A., and Ramirez, A. (2017). Analysis of biomass hydrothermal liquefaction and biocrude-oil upgrading for renewable jet fuel production: the impact of reaction conditions on production costs and GHG emissions performance. Renew. Energy 113, 1388–1398. doi: 10.1016/j.renene.2017.06.104
Urban, W., Girod, K., and Lohmann, H. (2009). Technologien und kosten der biogasaufbereitung und einspeisung in das erdgasnetz. Oberhausen, DE: Fraunhofer UMSICHT.
Wang, L., Pérez-Fortes, M., Madi, H., Diethelm, S., Herle, J. V., and Maréchal, F. (2018). Optimal design of solid-oxide electrolyzer based power-to-methane systems: a comprehensive comparison between steam electrolysis and co-electrolysis. Appl. Energy 211, 1060–1079. doi: 10.1016/j.apenergy.2017.11.050
Willauer, H. D., Hardy, D. R., Schultz, K. R., and Williams, F. W. (2012). The feasibility and current estimated capital costs of producing jet fuel at sea using carbon dioxide and hydrogen. J. Renew. Sustain. Energy 4 (3), 033111. doi: 10.1063/1.4719723
Ye, Y., Ngo, H. H., Guo, W., Chang, S. W., Nguyen, D. D., Zhang, X., et al. (Forthcoming 2020). Nutrient recovery from wastewater: from technology to economy. Bioresour. Technol. Rep. 100425. doi: 10.1016/j.biteb.2020.100425
Keywords: wastewater treatment plants, hydrothermal liquefaction, catalytic hydrothermal gasification, sustainability, efficiency
Citation: Castro-Amoedo R, Damartzis T, Granacher J and Maréchal F (2020) System Design and Performance Evaluation of Wastewater Treatment Plants Coupled With Hydrothermal Liquefaction and Gasification. Front. Energy Res. 8:568465. doi: 10.3389/fenrg.2020.568465
Received: 01 June 2020; Accepted: 19 August 2020;
Published: 23 September 2020.
Edited by:
Antonio Espuña, Universitat Politecnica de Catalunya, SpainReviewed by:
Mariano Martín, University of Salamanca, SpainAthanasios I. Papadopoulos, Centre for Research and Technology Hellas (CERTH), Greece
Copyright © 2020 Amoedo, Damartzis, Granacher and Marechal. This is an open-access article distributed under the terms of the Creative Commons Attribution License (CC BY). The use, distribution or reproduction in other forums is permitted, provided the original author(s) and the copyright owner(s) are credited and that the original publication in this journal is cited, in accordance with accepted academic practice. No use, distribution or reproduction is permitted which does not comply with these terms.
*Correspondence: Rafael Castro-Amoedo, cmFmYWVsLmFtb2Vkb0BlcGZsLmNo