 Wang Xiuli1Xu Wei1Wang Hongliang2Zhu Rong Sheng1*Zhao Yuan Yuan1Zhong Hua Zhou1
- 1National Research Center of Pumps, Jiangsu University, Jiangsu, China
- 2School of Aeronautical and Mechanical Engineering, Changzhou Institute of Technology, Jiangsu, China
In order to study the transient characteristics of a nuclear reactor coolant pump in coast-down process under power failure condition, a transient test device for the nuclear reactor coolant pump is set up. This study investigates the effects of the rotor of the nuclear reactor coolant pump and the circuit characteristics on the nuclear reactor coolant pump during the coast-down process by changing the rotary inertia of the flywheel and the resistance of the pipe system. The results show that the greater the moment of inertia is, the more slowly rotational speed, flow, and lift get down in the same coast-down period. The change in the pipe resistance has little effect on the rate of decline in the coast-down process, but it has a great influence on the descent speed of the flow rate and lift. When the pipe resistance is small, the corresponding flow rate decreases faster, but it is slower for the corresponding lift. The results are of great significance in controlling the stability and reliability of the nuclear reactor coolant pump in the coast-down process.
Introduction
With the continuing increase in economy in today’s society, the demand for energy keeps growing, corresponding to the shortage of fossil fuel supplies and restrictions on greenhouse gas emissions. Research shows that China’s nuclear power will step into a period of rapid development in the coming decades (Zeng et al., 2016; Yue et al., 2018). While nuclear power projects are under development, the safety and reliability of nuclear power plants are of vital importance. Although the frequency of nuclear accidents is really low, the severity of it is enormous (Wheatley et al., 2016). As one of the most important equipment in the nuclear power plants, the stability and reliability of the nuclear reactor coolant pump will be related to the safe and stable operation of the whole nuclear power plant (Ni et al., 2016).
In recent years, scholars at home and abroad have done a lot of researches on the safety and reliability of the nuclear reactor coolant pump. Stability researches of the nuclear reactor coolant pump mainly center on the factors causing vibration and noise, which include pressure fluctuation, flow instability, influence of speed on cavitation characteristics of the nuclear reactor main pump, critical wall roughness, and so on (Long et al., 2014; Fu et al., 2016; Ni et al., 2017; Yun et al., 2017; He et al., 2020). Some scholars have also conducted studies on the stability of the nuclear reactor coolant pump in the start-up. Su et al. (2017) studied the changes in pressure pulsation and radial force during the start-up of the nuclear reactor coolant pump. Gao et al. (2013) investigated the transient performance of the nuclear reactor coolant pump during start-up and analyzed the change in torque during the start-up. By establishing a mathematical start-up model for the primary circuit cooling system, Farhadi (Farhadi et al., 2007; Farhadi, 2011a; Farhadi, 2011b) studied the effects of the ratio between the inertial energy of the unit and the fluid mass inertia energy of the pipe coolant during the start-up process of the nuclear reactor coolant pump.
Research studies on the safety of the nuclear reactor coolant pump under extreme accident conditions are listed as follows. Zhu et al. (2016, 2017) studied the characteristics of gas-liquid two-phase flow and cavitation of the nuclear main pump in an accident condition. Jian et al. (2012) studied the change in the flow state of the nuclear reactor coolant pump during the coast-down process in the small break loss of coolant accident. Alatrash et al. (2015) conducted a test and analyzed the coast-down process of the nuclear reactor coolant pump and verified the consistency of the simulation prediction and the experiment by comparing the simulation results with the experimental data. Farhadi (2010) proposed an analytical model which can be used to calculate the flow velocity of the nuclear reactor coolant pump during the coast-down process and found the detailed flow characteristic of the nuclear reactor coolant pump. Gao et al. (2011) deduced the pump speed transient equation of the nuclear reactor coolant pump in the coast-down process based on the moment balance equation of the nuclear reactor coolant pump and verified the equation through a test. Han et al. (2009) explored the effect of cooling performance for KALIMER-600 caused by the nuclear reactor coolant pump with the flywheels of various moments of inertia in a power failure condition. Jiang et al. (2014) proposed a calculation model for the preliminary design calculation of the nuclear reactor coolant pump and validated the analysis. Xu and Xu (2011) proposed and verified a new calculation model of coast-down rotational speed and concluded the change rule of coast-down time when the nuclear reactor coolant pump reached half flow in different moments of inertia. Xiajie et al. (2009) verified the potential hazard of the nuclear reactor coolant pump in the coast-down period through a power failure test. Zhong et al. (2017) proposed a design method for coast-down characteristics in consideration of the inertial influence of loop fluid to increase the flexibility of the main pump design without affecting nuclear safety.
As we can see from the researches above, the present studies mainly focus on the prediction of rotational speed and performance in the coast-down period, but there are few studies on the effects of the rotor of the nuclear reactor coolant pump and the circuit characteristics on the nuclear reactor coolant pump during the coast-down process. It is necessary to follow Eq. 1 when calculating the rotating speed of the nuclear reactor coolant pump rotor during the coast-down process (Guo, 1995).
where
In the field of fluid machinery, some scholars use pure simulation methods to study its performance index (Shi et al., 2020a; Shi et al., 2020b; Wang et al., 2020a; Wang et al., 2020b), some scholars adopt the method of combining simulation methods with experiments (Wang et al., 2018; Shi et al., 2020), and this study adopts the method of direct experiment.
In order to explore the influence of rotational inertia and pipe resistance on the nuclear reactor coolant pump during the coast-down period, the following two aspects are mainly discussed: 1) the effect of the flywheel of different rotational inertias on the coast-down process with rated flow and 2) the effect of different valve openings on the coast-down process with the flywheel of the same moment of inertia. The results are of great significance in controlling the stability and reliability of the nuclear pump in the transition process.
Test Object
The Test Pump
This study used the model pump as the test pump to test the nuclear reactor coolant pump during the coast-down process in Figure 1. The hydraulic model of the nuclear reactor coolant pump has enough precision to test the nonlinear coast-down transient process under normal temperature and pressure. The size factor between the prototype pump and the test pump is 5.56, and the main performance parameters are shown in Table 1.

TABLE 1. Comparison of main performance parameters between the prototype pump and the test pump of the nuclear reactor coolant pump.
Flywheel
Due to power failure, the nuclear reactor coolant pump works in the coast-down transition condition, and the flow of coolant through the reactor core decreases continuously. It will lead to rise in temperature in the reactor, which is liable to cause a safety accident. Increasing the moment of inertia of the nuclear reactor coolant pump by adding a flywheel can prolong the coast-down time of the pump and avoid accidents. The inertial energy provided by the flywheel not only ensures sufficient heat removal capacity of the cooling loop system during the coast-down period, but also helps establish subsequent natural cycles. In addition, a larger moment of inertia can also effectively control the accelerated rate of the nuclear reactor coolant pump during start-up, which is very important for the reactor in the transition period from natural circulation to forced circulation. Equation 2 is the one to calculate the flywheel moment of inertia and the flywheel energy storage. From the equation, it can be seen that the rotary inertia is proportional to the mass and the outer diameter of the flywheel. The energy storage can be regulated by changing the diameter and thickness of the flywheel.
In order to find the influence of different rotational inertias on the coast-down process, four groups of flywheels of different rotary inertias as shown in Figure 2 were designed and manufactured. The size of the flywheels are 0.15, 0.3, 0.5, and 0.75 kg m2, and A, B, C, and D are numbered from small to large, respectively. The rotating inertia of the flywheel can also increase the moment of inertia by the bolt combination.
where E is the energy storage by the moment of inertia of the flywheel, J; ρ is the flywheel material density, kg/m3; and R1 and R2 are the flywheel diameter of the axle and outer, respectively, m; and h is the height of the flywheel, m.
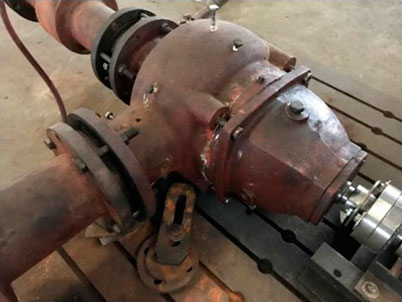
FIGURE 1. Test pump physical map.
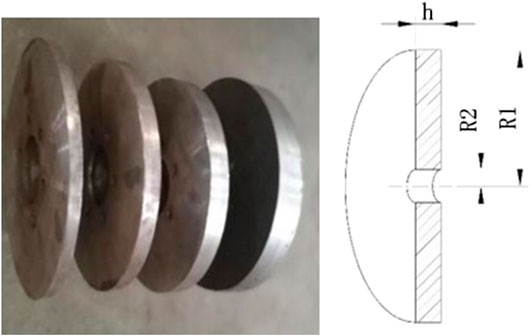
FIGURE 2. Flywheel structure and physical map.
Test Device Introduction
The Test System
The transient measurement device for the nuclear reactor coolant pump during the coast-down period is shown in Figure 3, and it is a closed loop test system. The system is mainly made up of a test pump, surge tank, valve, turbine flowmeter, motor, torque sensor, a flywheel, etc.
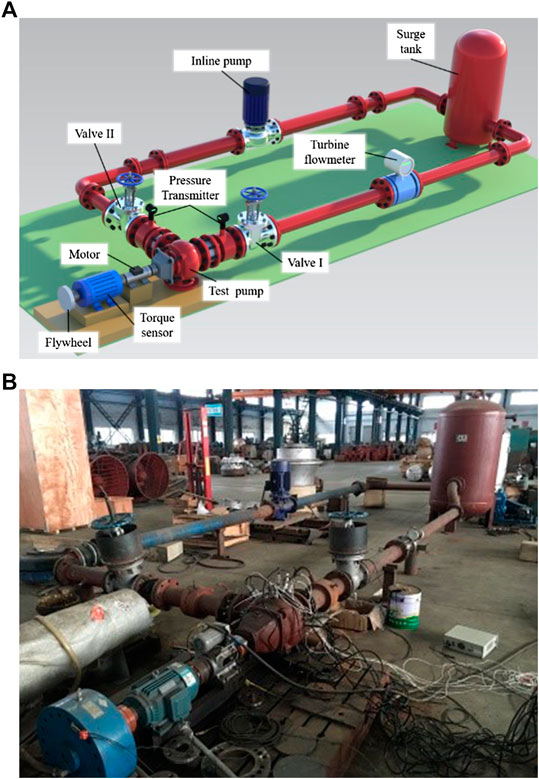
FIGURE 3. Experimental set-up. (A) Schematic diagram. (B) Testing site.
Data Acquisition Device
Flow Measurement
The LWGY turbine flowmeter (as shown in Figure 4) with a DN125 is selected as the test device. It can directly display the flow and, at the same time, output 4–20 mA pulse current signal with 0.5 sampling accuracy. The flowmeter should meet the requirement of the length of the straight pipe installed at both the front and back to make sure the measurement accuracy is achieved. The length of the straight pipe installed in the front is 25 times the diameter of the flowmeter, and the counter installed back is 10 times the diameter of the flowmeter. While the flow rate of the coast-down process keeps changing, it cannot be read directly through the flowmeter. In order to get the transient flow, the pulse current signals during the coast-down period need to be collected by the data acquisition card (USB3200 data acquisition card manufactured by Beijing Altay Technology Development Co. Ltd.). The data acquisition card is usually used to collect voltage signals. Therefore, it is necessary to use a conversion module (as shown in Figure 5) to convert the current signal into a voltage signal. The relationship between flow and time can be found during the coast-down process.
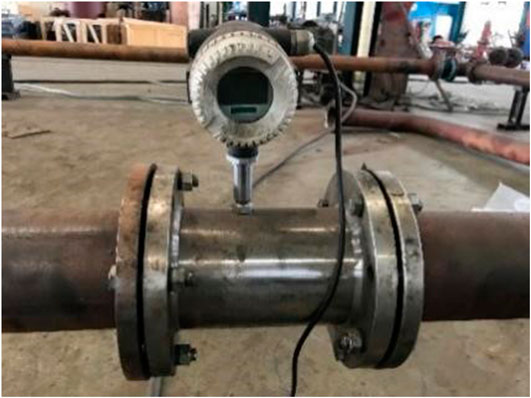
FIGURE 4. Turbine flowmeter.

FIGURE 5. Data acquisition and conversion equipment.
Measurement and Collection of Head
The head is energy difference between the inlet and outlet of a pump of the unit weight liquid. The test pump’s inlet and outlet are at the same level. The diameter of the measuring pressure section for the inlet and outlet is the same. The friction of the measuring tube can be neglected. Therefore, the head can be calculated directly according to the pressure difference between the inlet and outlet of the measuring pressure section. The pressure of the inlet and outlet of the test pump can be collected using the WT2000 intelligent pressure sensor, as shown in Figure 6. The pressure sensor which measures the inlet static pressure is located upstream of the inlet, and the one in the outlet is located downstream of the pump outlet. The inlet and outlet pressure sensors are 0.1 and 0–0.5 MPa, respectively, and the measurement accuracy is 0.2%. Pressure data are collected by the 285–20 digital data acquisition, as shown in Figure 7, and then entered into the computer.
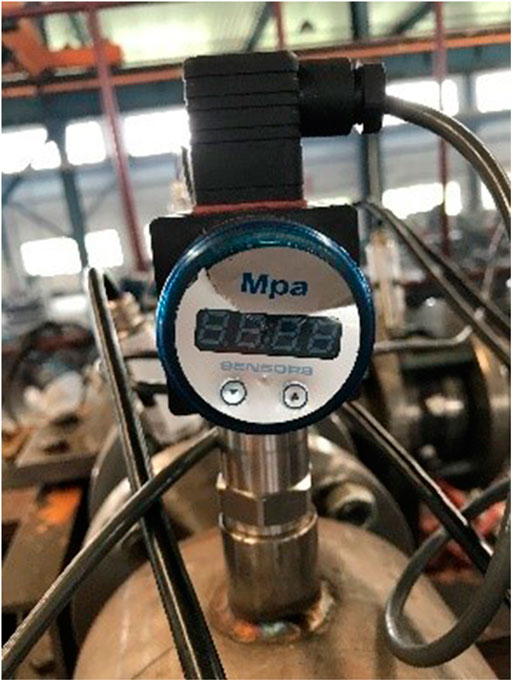
FIGURE 6. Pressure sensor.
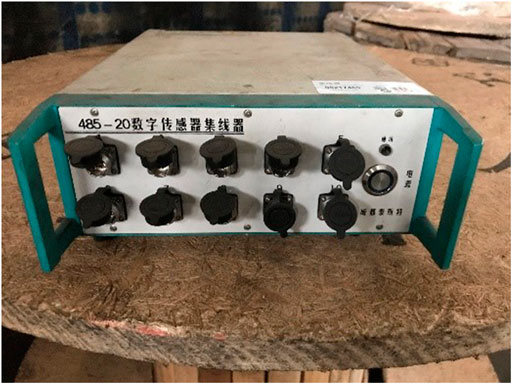
FIGURE 7. Data acquisition.
Measurement and Collection of the Transient Rotation Speed
In this study, the transient speed of the motor is collected by the ZJ torque sensor shown in Figure 8, and its measurement accuracy is 0.1. Its working principle is based on the principle of magneto-electric conversion and phase difference. The sensor converts the mechanical energy into two circuits’ electrical signal with a certain phase difference, and measures the transient speed through collecting the electrical signals. The sensor should have a load because it cannot measure the motor speed separately. In order to ensure high accuracy of measurement, good concentricity of the motor, pump, and sensor should be met during the installation period. As shown in Figure 9, the WJCG dynamometer which supports the ZJ torque sensor is used for collecting the electrical signals from the sensor, and it can collect data per 0.02 sec. In the WJCG, the meaning of W is metal with slight gauge, and the J is 40 μm, and the C stands for reduced pressure range, and the G represents gauge. The transient electrical signal during the coast-down period is collected by the sensor and transmitted to the dynamometer. Then, the relationship between rotational speed and time is obtained during the coast-down period.
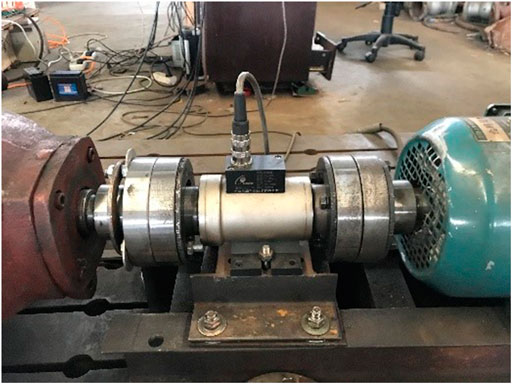
FIGURE 8. Torque sensor.
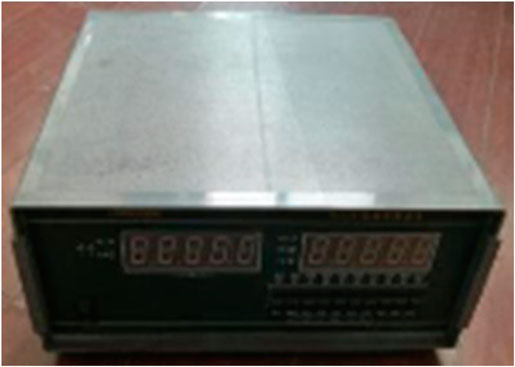
FIGURE 9. Dynamometer.
Testing Procedure
Collection of Pump Characteristic Curve Before and After Optimization and the Coast-Down Process Test
After regulating the valve to the maximum, open the pump and wait for its stable operation. Collect the characteristic parameters through the data acquisition device after adjusting the valve and wait for the system to operate stably under the condition of 120% of the rated flow rate. (The following is described as 1.2Q.) After that, collect each characteristic parameter under the condition of 0–110% of the rated flow rate and then repeat the test three times. After collecting a set of data, replace the flywheel and collect the characteristic data of the pump optimized according to the above steps.
Coast-Down Transient Process Test for the Flywheel With Different Rotational Inertias Under Rated Flow
Turn on the power switch to start the pump (the mixed flow pump start-up has no specific requirements for the valve’s opening and closing). Adjust the outlet valve to keep the pump stable at the rated flow point and adjust each device to make sure they can operate properly and accurately. Turn off the power switch and wait for the pump to stop without operating the valve. The tests are conducted with five different flywheels: A, B, C, D, and AD, respectively. In the first place, open the pump and wait for its stable operation. Then, turn on the data acquisition device and turn off the pump power to stop the pump, and the data acquisition device will collect the characteristic data during the pump stop, which is the coast-down process. A set of test measurement and data collection is accomplished by repeating the test three times. The tests are carried out with other four different sets of flywheels following the above steps.
Test on the Coast-Down Process Under Different Pipe Resistances
After the above tests, the influence of different pipe resistances on the coast-down process is studied by using the pump with D flywheel. At first, turn on the pump and wait for its stable operation in 80% of the rated flow rate condition (the following is described as 0.8Q) by adjusting the outlet valve. Then, turn on the data acquisition device and turn off the pump power to stop the pump, and the data acquisition device will collect the characteristic data during the coast-down process. A set of test measurement and data collection in 0.8Q condition is accomplished by repeating the test three times. The test data on the effect of pipe resistance on the coast-down process are collected as the above steps under the condition of 0.9Q, 1.1Q, and 1.2Q, which are adjusted by the valve.
Test Results and Analysis
Influence of Rotational Inertia on the Coast-Down Process
Figure 10 shows the characteristics curve of the nuclear reactor coolant pump in different moments of inertia during coast-down transition for five sets of different flywheels with moment of inertia in T2 (T2 = 11 sec). It can be seen from Figure 10 that the relation of rotation speed, flow rate, head, and time is nonlinear in the coast-down transition process. The steepness of each characteristic curve corresponding to different rotational inertias is different. The change in the rate of decline of each characteristic in the coast-down process decreases and then becomes constant afterward. As shown in Figure 10, the change in time–rotational speed, time–flow, and time–head characteristic curves in the coast-down process of the flywheel with different rotational inertias is different, and it is the same for the curve of the characteristic decrease speed. The smaller the moment of inertia is, the faster the speed of each characteristic drops, and the steeper the decline of each characteristic curve is. The greater the moment of inertia is, the slower the decrease speed of each characteristic is, and the gentler the decline of each characteristic curve is. It can be seen comparing Figures 10A–C that the descend range of rotational speed, flow, and head is different during the same time. And it can be seen from Figure 10 that the curve of the head drops the fastest, and the flow characteristic curve drops the slowest. From the decrease speed curve of each characteristic, we can see that the initial value of the decrease speed of the head is greater than that of the decrease speed of rotational speed and flow in five sets of coast-down tests. Therefore, the head drops most. The initial value of the decrease speed of rotational speed is greater than that of the decrease speed of flow, so the extent of the rotational speed drop is greater than that of the flow drop. According to the square relationship between the head and the rotational speed of the pump, the decrease speed of the head is faster than the decrease speed of the rotational speed. Because of the linear relationship between flow and rotational speed, the flow and rotational speed should be the same in theory. However, as the flowmeter is generally located in the inlet pipeline to measure the flow rate, the decrease speed of flow lags behind the decrease speed of rotational speed.
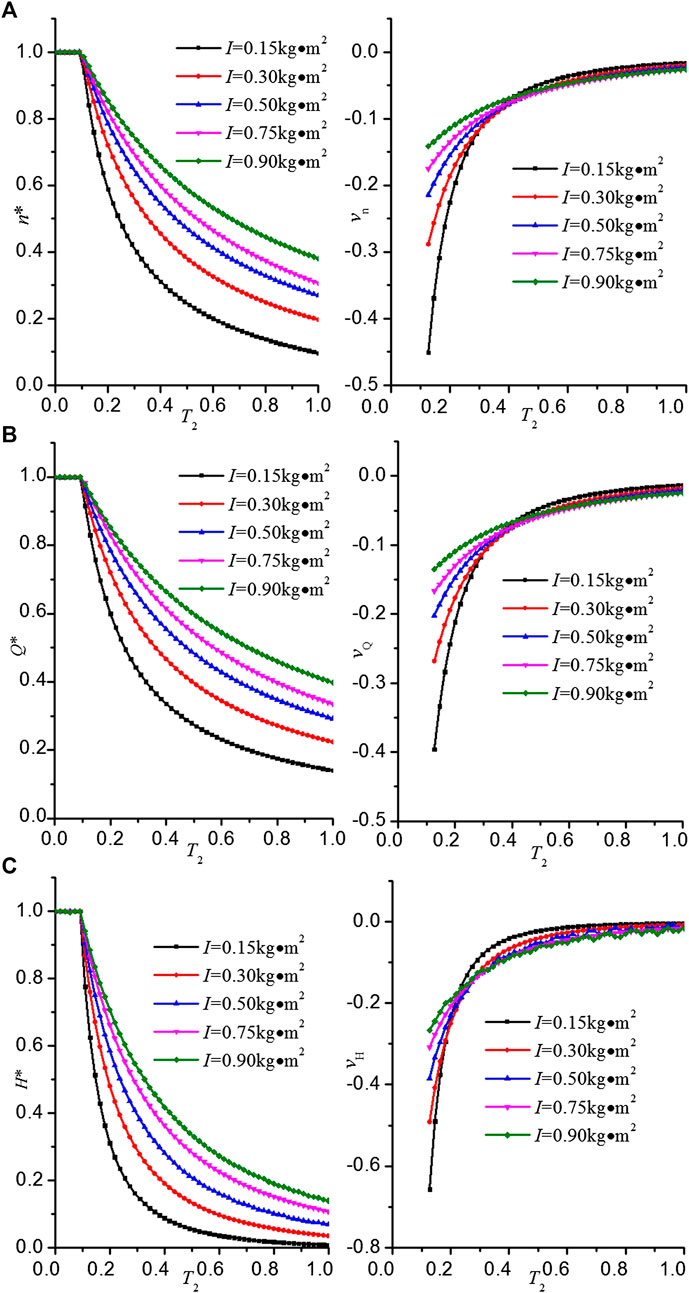
FIGURE 10. Characteristics of the nuclear reactor coolant pump for different moments of inertia during coast-down transition. (A) The characteristic curve of the rotational speed and acceleration during coast-down transition. (B) The characteristic curve of the flow and flow decrease speed during coast-down transition. (C) The characteristic curve of the head and head decrease speed during coast-down transition.
Effect of Pipe Resistance on the Coast-Down Process
Figure 11 shows the characteristics curve of the nuclear reactor coolant pump during coast-down transition for five sets of different pipe resistances in T2. It can be seen from the figure that the relationship between each characteristic and time in the coast-down process is nonlinear for the flywheel with the same rotational inertia, and different valve openings correspond to different characteristic curves. The rate of change for the decrease speed of each characteristic in the coast-down process decreases and becomes constant afterward. In Figure 11, the changes in time–rotational speed, time–flow, and time–head characteristic curve in the coast-down process of the flywheel with different valve openings are different, and the same applies for the curve of characteristic decrease speed. As can be seen in Figure 11A, the initial value of the rotational descent speed is large and the rotational speed drops rapidly during the coast-down period under the condition of 0.8Q. But in the condition of 1.2Q, the initial value of the descent speed is small and the decrease speed is slow during the coast-down period. As shown in Figure 11B, the initial value of the flow decreases is small and the decrease speed of the flow is slow during the coast-down period under the condition of 0.8Q. But in the condition of 1.2Q, the initial value of the flow decreases is large and the decrease speed falls rapidly during the coast-down period. In Figure 11C, the initial value of the head decreases is large and the decrease speed of the head is rapid during the coast-down period under the condition of 0.8Q. But for the condition of 1.2Q, the initial value of the head decreases is small and the decrease speed is slow during the coast-down period.
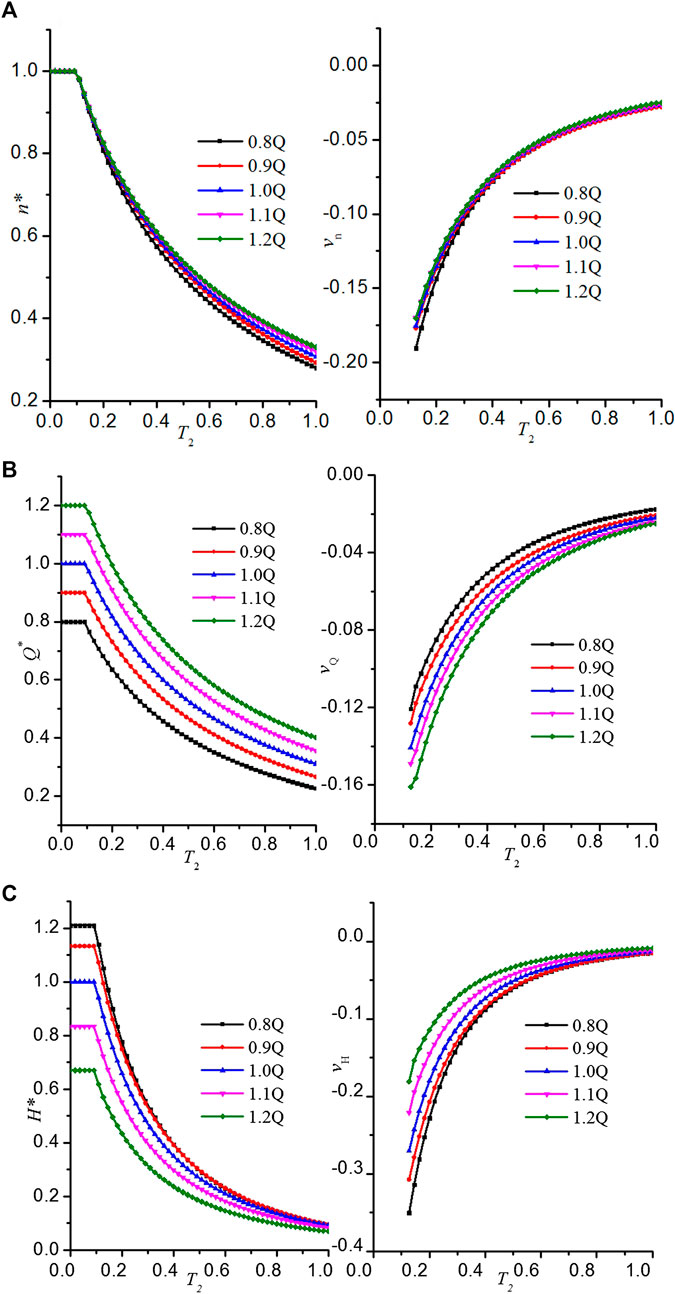
FIGURE 11. Characteristic curves of the nuclear reactor coolant pump with different resistances during coast-down transition. (A) The characteristic curve of the rotational speed and acceleration during coast-down transition. (B) The characteristic curve of the flow and flow decrease speed during coast-down transition. (C) The characteristic curve of the head and head decrease speed during coast-down transition.
Comparing A, B, and C in Figure 11, we can get the relationship between each characteristic decrease speed is vH > vn > vQ. And it means that the head drop is the fastest, the decrease of the flow is the slowest, and the speed decrease is between those two in different working conditions. The changes in each characteristic at the same time under the adjacent working conditions are different during the coast-down period under different conditions. As shown in Figure 11, the change in the head is the largest, the change in the rotational speed is the smallest, and the flow change is between those two in different working conditions. The results show that the effect in different conditions on rotational speed in the coast-down period is nonsignificant. However, it has a major influence on the head, and the effect of the flow is between them. The following are the reasons for the difference in the flow, rotational speed, and head in descending process. Although the rotational inertia of the fluid in the initial stage of the coast-down period changes due to the change in pipe resistance, the moment of inertia of the rotor is much larger than that of the fluid. Therefore, the effect in different conditions on rotational speed in the coast-down period is very little. The initial values of flow and head are different with different pipe resistances in the coast-down period. The decline range of the corresponding rotational speed is almost the same under different pipe resistances. The initial speed of the flow decrease is large and that of the head decrease is small in small pipe resistance. The initial speed of the flow decrease is small and that of the head decrease is large in large pipe resistance.
Conclusion
In this study, the influence of rotary inertia and tube resistance on the coast-down process of the nuclear reactor coolant pump was studied by constructing a transient test device for the nuclear reactor coolant pump, and the results show the following:
(1) The test researches for the effect of moment of inertia on coast-down process are conducted by changing the moment of inertia of the rotor. The results show that the greater the moment of inertia is, the slower the drop rate of the rotational speed, the flow, and the head is in the same time. In the same moment of inertia, the head drops fastest, the flow decreases most slowly, and the drop rate of the rotational speed is between the above two.
(2) The effects of pipe resistance on the coast-down process are tested and analyzed by changing the pipe resistance of the loop system. The results show that the influence of the change in pipe resistance on the rotational speed decrease in the coast-down process is slight, but it has a great influence on the decrease speed of flow rate and the head. For a smaller pipe resistance, the decrease speed of flow rate is fast and the decrease speed of the head is slow.
Data Availability Statement
All datasets presented in this study are included in the article.
Author Contributions
XW, provided methods; WX, writing the manuscript; HW, set up test bed and make experiments; ZS, planning the experimental process; ZY, data processing; ZH, operating the experiment.
Funding
This study was supported by the foundation program of the National Youth Natural Science Foundation of China (51509112); Natural Science Foundation of Jiangsu Province of China (BK20171302); key R&D programs of Jiangsu Province of China (BE2018112); National Key R&D Program of China (2018YFB0606105); Postgraduate Research & Practice Innovation Program of Jiangsu Province (4061440011); and Changzhou Sci & Tech Program (Grant No. CJ20190048).
Conflict of Interest
The authors declare that the research was conducted in the absence of any commercial or financial relationships that could be construed as a potential conflict of interest.
References
Alatrash, Y., Kang, H. O., Yoon, H. G., Seo, K., Chi, D. Y., and Yoon, J. (2015). Experimental and analytical investigations of primary coolant pump coastdown phenomena for the Jordan Research and Training Reactor. Nucl. Eng. Des. 286, 60–66. doi:10.1016/j.nucengdes.2015.01.018
Farhadi, K. (2010). Analysis of flow coastdown for an MTR-pool type research reactor. Prog. Nucl. Energy 52, 573–579. doi:10.1016/j.pnucene.2010.01.004
Farhadi, K. (2011a). The effect of retarding torque during a flow transient for Tehran research reactor. Ann. Nucl. Energy 38, 175–184. doi:10.1016/j.anucene.2010.11.013
Farhadi, K. (2011b). Transient behaviour of a parallel pump in nuclear research reactors. Prog. Nucl. Energy 53, 195–199. doi:10.1016/j.pnucene.2010.05.001
Farhadi, K., Au, A., and D’Auria, F. (2007). A model for the analysis of pump start-up transients in Tehran research reactor. Prog. Nucl. Energy 49, 499–510. doi:10.1016/j.pnucene.2007.07.006
Fu, Q., Zhang, B., Zhu, R., and Cao, L. (2016). Effect of rotating speed on cavitation performance of nuclear reactor coolant pump. J. Drain. Irrig. Mach. Eng. 34 (8), 651–656. doi:10.3969/j.issn.1674-8530.15.0170
Guo, Y. J., Zhang, J. L., Qiu, S. Z., Su, G. H., Jia, D. N., and Yu, Z. W. (1995). A calculation model of flow characteristic of coolant pump for nuclear reactor system. J. Nucl. Sci. Eng. 15 (2), 220–225.
Gao, H., Gao, F., Zhao, X., Chen, J., and Cao, X. (2011). Transient flow analysis in reactor coolant pump systems during flow coastdown period. Nucl. Eng. Des. 241, 509–514. doi:10.1016/j.nucengdes.2010.09.033
Gao, H., Gao, F., Zhao, X., Chen, J., and Cao, X. (2013). Analysis of reactor coolant pump transient performance in primary coolant system during start-up period. Ann. Nucl. Energy 54, 202–208. doi:10.1016/j.anucene.2012.11.020
Han, J. W., Lee, T. H., Eoh, J. H., and Kim, S. O. (2009). Investigation into the effects of a coastdown flow on the characteristics of early stage cooling of the reactor pool in KALIMER-600. Ann. Nucl. Energy 36, 1325–1332. doi:10.1016/j.anucene.2009.07.004
He, X., Zhang, Y., Wang, C., Zhang, C., Cheng, L., Chen, K., et al. (2020). Influence of critical wall roughness on the performance of double-channel sewage pump. Energies 13, 464. doi:10.3390/en13020464
Jian, Y., Tian, F., Ma, M., and Wang, F. (2012). Numerical simulation of the nuclear main pump in the SBLOCA. Adv. Mater. Res. 455–456, 314–319. doi:10.4028/www.scientific.net/amr.455-456.314
Jiang, M.-H., Zou, Z.-C., Wang, P.-F., and Ruan, X.-D. (2014). Coast-down model based on rated parameters of reactor coolant pump. Atom. Energy Sci. Technol. 48 (8), 1435–1439. doi:10.7538/yzk.2014.48.08.1435Google Scholar
Long, Y., Zhu, R., Fu, Q., and Yuan, S. (2014). Numerical analysis on unstable flow of reactor coolant pump under small flow rate condition. J. Drain. Irrig. Mach. Eng. 32 (4), 290–295. doi:10.3969/j.issn.1674-8530.13.0024
Ni, D., Yang, M., Gao, B., Zhang, N., and Li, Z. (2016). Flow unsteadiness and pressure pulsations in a nuclear reactor coolant pump. Stroj. Vestn. J. Mech. Eng. 62 (4), 231–242. doi:10.5545/sv-jme.2015.3192
Ni, D., Yang, M., Gao, B., Zhang, N., and Li, Z. (2017). Numerical study on the effect of the diffuser blade trailing edge profile on flow instability in a nuclear reactor coolant pump. Nucl. Eng. Des. 322, 92–103. doi:10.1016/j.nucengdes.2017.06.042
Shi, L., Zhang, W., Jiao, H., Tang, F., Wang, L., Sun, D., et al. (2020a). Numerical simulation and experimental study on the comparison of the hydraulic characteristics of an axial-flow pump and a full tubular pump. Renew. Energy 153, 1455–1464. doi:10.1016/j.renene.2020.02.082
Shi, L., Zhu, J., Tang, F., and Wang, C. (2020b). Multi-disciplinary optimization design of axial-flow pump impellers based on the approximation model. Energies 13 (4), 779. doi:10.3390/en13040779
Su, S., Wang, P., Xu, Z., and Ruan, X. (2017). Study on maximum speed setting standard during speed up process of reactor coolant pump. Nucl. Power Eng. 38 (5), 101–105. doi:10.13832/j.jnpe.2017.05.0101
Wang, C., Chen, X., Qiu, N., Zhu, Y., and Shi, W. (2018). Numerical and experimental study on the pressure fluctuation, vibration, and noise of multistage pump with radial diffuser. J. Braz. Soc. Mech. Sci. Eng. 40, 481. doi:10.1007/s40430-018-1355-6
Wang, H. L., Long, B., Yang, Y., Xiao, Y., and Wang, C. (2020a). Modelling the influence of inlet angle change on the performance of submersible well pumps. Int. J. Simul. Model. 19 (1), 100–111. doi:10.2507/ijsimm19-1-506
Wang, H. L., Qian, Z., Zhang, D., Wang, T., and Wang, C. (2020b). Numerical study of the normal impinging water jet at different impinging height, based on Wray-Agarwal turbulence model. Energies 13, 1744. doi:10.3390/en13071744
Wheatley, S., Sovacool, B. K., and Sornette, D. (2016). Reassessing the safety of nuclear power. Energy Res. Soc. Sci. 15, 96–100. doi:10.1016/j.erss.2015.12.026
Xiajie, L., Dezhong, W., Jige, Z., Junsheng, L., and Zhe, Y. (2009). Test study on safety features of station blackout accident for nuclear main pump. Atom. Energy Sci. Technol. 43 (5), 448–451.
Xu, Y. M., and Xu, S. M. (2011). Numerical simulation of interior flow field of nuclear coolant pump under station blackout accident. Dalian, China: Dalian University of Technology.
Yue, Q., He, J., Zhi, S., and Dong, H. (2018). Fuel cycles optimization of nuclear power industry in China. Ann. Nucl. Energy 111, 635–643. doi:10.1016/j.anucene.2017.09.049
Yun, L., Dezhong, W., Junlian, Y., Yaoyu, H., and Hongjuan, R. (2017). Numerical investigation on the unsteady characteristics of reactor coolant pumps with non-uniform inflow. Nucl. Eng. Des. 320, 65–76. doi:10.1016/j.nucengdes.2017.04.027
Zeng, M., Wang, S., Duanau, J., Sun, J., Zhong, P., and Zhang, Y. (2016). Review of nuclear power development in China: environment analysis, historical stages, development status, problems and countermeasures. Renew. Sust. Energ. Rev. 59, 1369–1383. doi:10.1016/j.rser.2016.01.045
Zhong, Y., Xia, D., and Zhou, W. X. (2017). Investigation on methodology of coastdown analysis and design for reactor coolant pump. Nucl. Power Eng. 38 (4), 84–88. doi:10.1115/ICONE25-66311
Zhu, R., Chen, Z., Wang, X., and Cao, L. (2016). Numerical study on cavitation characteristics of CAP1400 nuclear main coolant pump. J. Drain. Irrig. Mach. Eng. 34 (6), 490–495. doi:10.3969/j.issn.1674-8530.15.0124
Keywords: nuclear reactor, coolant pump, power failure condition, moment of inertia, coast-down process, transient characteristics
Citation: Xiuli W, Wei X, Hongliang W, Sheng ZR, Yuan ZY and Zhou ZH (2020) An Experimental Study on Transient Characteristics of a Nuclear Reactor Coolant Pump in Coast-Down Process Under Power Failure Condition. Front. Energy Res. 8:579291. doi: 10.3389/fenrg.2020.579291
Received: 02 July 2020; Accepted: 20 August 2020;
Published: 25 September 2020.
Edited by:
Zhanjie Xu, Karlsruhe Institute of Technology (KIT), GermanyReviewed by:
Keyou S. Mao, Oak Ridge National Laboratory (DOE), United StatesLuteng Zhang, Chongqing University, China
Copyright © 2020 li, Wei, sheng, yuan and zhou. This is an open-access article distributed under the terms of the Creative Commons Attribution License (CC BY). The use, distribution or reproduction in other forums is permitted, provided the original author(s) and the copyright owner(s) are credited and that the original publication in this journal is cited, in accordance with accepted academic practice. No use, distribution or reproduction is permitted which does not comply with these terms.
*Correspondence: Zhu Rhong Sheng, dWpzX3pyc0AxNjMuY29t