 E. K. Hussain
 Philipp R. Thies
 Jon Hardwick
 Peter M. Connor
- Renewable Energy Department, SERSF Building, College of Engineering, Mathematics and Physical Sciences, Penryn Campus, University of Exeter, Penryn, UK
This paper presents a methodology for the reliability and power flow analysis of islands or off-grid power networks for situations of scarce data and information. It offers a new and pragmatic approach to derive the required power network information, including the power cable parameters and the load at each power node. The paper aims to present the developed methodology, and to illustrate its application, using Ushant Island as a case study. The assessment of the current power network status and the reliability analysis are presented. Grid performance parameters are further compared for conventional diesel generator operation and renewable energy generation scenarios, demonstrating the advantages of replacing the existing diesel units with renewable energy sources in terms of system reliability. The analysis shows that by introducing renewable energy systems to the island’s grid, the reliability of the grid increases by up to 50% and cable capacity usage reduces by up to 30%. Furthermore, this work suggests that it would not be necessary to modify the grid cables when substituting the diesel generator. The paper will be of interest to network planners, community stakeholders, project developers and decision-makers concerned with renewable energy investment on islands and in remote rural areas.
Introduction
Many islands and remote communities have no connection to wider electricity distribution systems and are dependent on imported energy supplies, typically fossil fuels. The energy systems that isolated communities depend on tend to be less reliable, more expensive and have higher per-capita associated greenhouse gas (GHG) emissions than mainland grid systems. The European Commission’s White Paper on Renewable Energy Sources and United Nations Conference on Islands and the Small Island States highlights the need to provide the islands with an outline strategy for the development in renewable energies (European Commission 1997).
Moving from fossil fuel to renewable energy and thus increasing the penetration of renewable energy generation in the island’s power grid is a research topic of interest. Existing literature explores the transition from diesel-based generation to renewable energy by studying the energy demand and the available renewable energy sources combination, offering a range of approaches and tools, briefly summarized in the following.
Several detailed studies report the impacts of integrating renewable energy on the island power grid (Yue and Yang 2007; Surroop and Raghoo 2018; Kougias et al., 2019; Rikos and Perakis 2020). In Kougias et al. (2019) an energy modeling exercise is developed employing the HAS (Harmony Search Algorithm). It investigates whether the deployment of renewable energy sources could lead to a sustainable system, reducing required subsidies and supporting local supply chains. HAS offers optimization process to offer less costly energy sources systems including renewable energy sources combinations or hybrid systems. The PRISMI (Promoting RES Integration for Smart Mediterranean Islands) tool is proposed in Rikos and Perakis (2020). This tool is used to assess the impact of selected renewable energy sources on island grids. The tool is e interface allows the selection of test grids, variable time frames for the load flow calculation, operating voltage and capacity limit assessments. The present electrification situation in some African island states is presented in Surroop and Raghoo (2018), highlighting the critical lack of electricity in some islands due to political instability and high cost in diesel. Renewable energy could form part of the solution. The advantages of utilizing geographic information system for resource assessment, cost analysis and analysis of return as an investment as is presented in Yue and Yang (2007).
The advantages of connecting two or more grids islands are presented in Bertheau and Cader (2019), Alves et al. (2020). The impact of the interconnection of two islands to achieve 100% renewable energy of the whole energy system is assessed in Alves et al. (2020). They employed EnergyPlan simulation software which simulates the operation of the energy system to supply a given set of energy demand, a scenario tool that can be combined to create a scenario of multiple years. In Bertheau and Cader (2019) the feasibility of submarine cable interconnection and renewable energy-based systems is compared. The results indicate that renewable energy is most feasible for the majority of island and submarine cable interaction and considerably more promising for larger islands.
A range of software solutions to assess and plan renewable energy generation potentials for islands is presented in Pfeifer et al. (2017), Ramakumar et al. (1995), Duić et al. (2008), Kanase-Patil et al. (2010), Esmaeli et al. (2016), Sukerayasa et al. (2014), and Uddin et al. (2020). IRES-KB (Integrated Renewable Energy Systems Knowledge-Based) is a user-interactive software and one of the early tools to estimate the amount of renewable energy to supply off-grid networks (Ramakumar et al., 1995). The RenewIslands methodology is based on mapping an island’s energy requirements and resources and subsequently models the grid (Duić et al., 2008). A tool designed to make build and solve Linear, Nonlinear, and Integer optimization models is presented in the LINGO software (Kanase-Patil et al., 2010). The HOMER software was employed to model several scenarios (Pfeifer et al., 2017). GPSO-GM (Guaranteed convergence Particle Swarm Optimization with Gaussian Mutation) algorithms for power flow analysis is presented in Sukerayasa et al. (2014), Esmaeli et al. (2016), and Pfeifer et al. (2017). A decision-tree-based peak shaving algorithm to operate the microgrid power system efficiency is presented in Uddin et al. (2020) employing Matlab SIMULINK.
The combination of different renewable energy source scenarios is presented in Ramakumar et al. (1995), Yue and Yang (2007), Kanase-Patil et al. (2010), and Chopin et al. (2019). The number of seasons per year and a combination of distinct resources and energy demands are the study inputs (Ramakumar et al., 1995). In Kanase-Patil et al. (2010) different scenarios of combined renewable energy sources are considered for seven villages in India. The study considered the consistency of renewable energy sources to supply the load, total system cost and cost of energy for integrating the renewable energy sources. The paper also presents a comparison study, based on the Energy Index Ratio (EIR) and Expected Energy Not Supplied (EENS) by employing LINGO software. The author in this paper considers only the ability of renewable energy sources to supply the load and theexisitng grid capacity is not considered. The HOMER software was employed to model several island sustainability scenarios in Pfeifer et al. (2017). It based on four steps, namely mapping the island’s needs, mapping its resources, devising scenarios and modeling potential scenarios.
Steps to move from diesel to renewable energy sources are presented in Suhas Shirbavikar et al. (2010), Esmaeli et al. (2016), Römer et al. (2017), Diane et al. (2019), Escalera et al. (2019), and Tzanes et al. (2019). The Caribbean island of Montserrat is considered as a case study for transfer from diesel to 100% renewable energy in Römer et al. (2017). The steps to transfer from diesel-based generation to geothermal and PV are presented, outlining the cost benefits of replacing the diesel units. Methods to find the optimum location of the renewable energy source depending on the minimum total losses in the network and the impact of disconnecting the renewable energy sources, fault and unbalanced voltage are presented in Suhas Shirbavikar et al. (2010). In Tzanes et al. (2019) the development of smart energy solutions for the small and most remote island regions is considered. To overcome the shortage in conventional power flow analysis for variable frequency and voltage system GPSO-GM algorithm for power flow analysis is presented in Esmaeli et al. (2016). Energy planning software is employed in Diane et al. (2019) to increase the renewable energy penetration of the local energy grid by assessing the environmental constraints and energy consumption of the island. Reliability is a fundamental parameter to evaluate in the planning of the distribution network. A technique for evaluation of energy storage contributions to the distribution network reliability is presented in Escalera et al. (2019).
There are two main issues that are underrepresented in the published literature, to which this paper makes an original contribution:
(1) The primary focus in the literature is to replace fossil fuels with renewable energy sources without considering the role and capacity of existing power networks of individual island grids. This is important to inform any extension or modifications that may be required as part of the energy transition process. This is a crucial step in the analysis and energy transition, as the grid infrastructure (or lack thereof) will be critical in assessing and evaluating the feasibility of potential energy transition scenarios. Often this is due to a lack of publicly available information regarding the grid infrastructure.
(2) The second issue is that it is often difficult to obtain the necessary information or data regarding the island power system to enable power flow or reliability analysis. A common cause is a lack of support from the grid operators or provided data is subject to confidentiality agreements. While the transition to renewable generation sources will be of benefit to the island residents, this may not be profitable for the existing energy supplier. If the interests of different stakeholders conflict then it is likely that data and support will be harder to acquire.
This paper offers a new pragmatic approach to overcome the two main issues mentioned above. The proposed approach derives some of the required power network information and presents a network analysis method that informs the assessment of energy transition scenarios. This approach fulfills the shortage in the published works to estimate the grid parameters and carry out the power flow and reliability assessments. The proposed approach is based on the available data and information, comprising of commonly available power network data, component and hardware datasheets. A situation with limited or restricted access to data is a common occurrence for the island and isolated communities, where the full documentation and detailed energy usage profiles may not be readily accessible. The focus of the analysis is to perform a relative comparison between the current power networks, supplied by traditional power generation units, and sustainable energy supply through renewable generation units. Control, stability and connection topologies of the microgrid are out of the scope of this paper.
The paper is organized as follows. Section 1 presents the proposed grid parameters estimation, load profile, renewable energy assessment and grid reliability. In section 2, Ushant Island is considered as a case study. The load at each node is estimated, the complete power follow and reliability assessments for the current grid are presented. The effect of introducing renewable energy sources to the grid in term of system reliability and power cable capacity is shown.
Materials and Methods Proposed Grid Parameters Estimation and Renewable Energy Assessment Technique
The essential parameters for the reliability and power flow analysis such as grid components/units parameters; load profile, renewable energy assessment and grid components reliability can be delivered or estimated as follows:
Grid Components Parameters
Grid components parameters can often be obtained from the supplier or local operator, depicting a basic diagram of the network, which shows the main network lines and connections. An additional physical site visit allows for visual identification of the main networks components, including network components such as transformers, generators, circuit breakers. The cable length can be inferred by employing geographic information systems, for example, Google map, in conjunction with the network diagram and connection diagrams. This allows estimation of the cable length, and depending, on the core materials and the size of the cable the equivalent inductance, resistance and capacitor values. For any missing data, the standard parameters or these data can be obtained from a well know or reported network that has a similarity in term of voltage and power can be used.
Using the GIS data, the cable length between load nodes can be estimated. When using a non-digitized map, software such as the PlotDigitizer (SourceForge, 2001), can be used to estimate individual cable length. The geographical map is loaded into the software and the user selects the coordination system limit (X and Y) according to the geographical map scale. The software scales each point (pixel) on the map. Therefore, the length of the cable is estimated by the cable route. Depending on the length, core materials and the size of the cable the equivalent inductance, resistance and the capacitor can then be inferred.
The cable parameters (capacitance, inductance and resistance) can then be estimated according to the following equations.
where
Load Profile
The active and reactive power of the load at each node can be estimated or obtained from the energy supplier. An approximate estimate can be based on the number of end-users supplied from the same node. In conjunction with average user load profiles, a reasonable load estimate can be made for each node. If the total load of the network is known, the load at each node can also be estimated based on the percentage of the total users/houses/buildings connected This estimation is more complicated where there are commercial or industrial energy users within the network, due to their load profiles.
Renewable Energy Assessments
Well documented RE resource constraints, such as variable and/or intermittent generation, have to be modeled in detail for the island network in question, with the exception of biomass generation which is dependent on reliable supplies of the raw material (Badal et al., 2019). Determining the resource will usually involve a combination of numerical modeling and in-situ data collection. More intermittent resources, such as solar, wind and wave energy, require long-term datasets to accurately calculate the resource availability, while tidal and geothermal energy are more predictable resources. Another technical constraint is the operational restriction, for example, unsuitable terrain or lack of grid access. Areas that have the best availability of raw resource may not be suitable for technology deployment, for example, if they are remote or lack appropriate infrastructure. Similarly, urban areas are likely to have practical limitations due to existing infrastructure. If there is insufficient demand for on-site energy usage, any electricity-generating renewable technology will require a grid connection of sufficient capacity or an alternative mechanism to enable the offtake, such as electrical storage. All deployment sites will require suitable access for construction and maintenance. Environmental and heritage considerations are other constraints where many sites with appropriate levels of raw resource fall within. Social and political aspects are also potential constraints where the installation of electricity generation technology may affect local stakeholders including residents, visitors and businesses, for example through visual impact, noise or loss of amenity.
Solar radiation can be inferred from equipment, satellite data, widely available through commercial software packages. For a known latitude, the number of daylight hours and the relative path of the Sun is inherently predictable. Weather models and historical data can also be used to inform the likely amount of cloud cover, temperature and weather conditions, considered in radiation estimates. Tides are caused by the forces of gravitational attraction and relative motions between the Earth, Moon and Sun. The key resource parameters in determining the suitability of a site for tidal stream energy are the flow velocity and its variability over a tidal cycle. Wind power is generated by airflow through turbines, which can range in size from the small domestic-scale to multi-MW commercial-scale structures. The mean wind speed at turbine hub height will provide a basic assessment of the feasibility of a site to support wind generation. A more detailed analysis should examine the consistency of wind speed, storm frequency, directionality, wind shear, turbulence and whether there is any regularity to the wind system, for example, regular occurrences of stronger winds in the afternoon. The ideal site will have a consistent wind speed close to the rated velocity for the proposed turbine. Again commercial software packages are available for the detailed analysis (GL).
Grid-scale biomass or waste conversion plant is a thermal power station. The availability of biomass/waste resource and its cost, whether produced locally or imported, are important considerations in predicting whether a plant is viable in a remote community. An assessment of price risk for the fuel and continued fuel access over the lifetime of the project is a specific requirement specific for this technology. In this paper, the renewable energy resource assessment is not considered, the study relies instead on the resource and generation scenarios of the resource assessment presented in [13].
Grid Components Reliability
The failure rate data for the reliability analysis can be sourced from published work/reports, stating extensive failure rate data for the most common power system components. A particularly useful source for the reliability data is IEEE 493 (IEEE, 2007) which shows reliability Data of Industrial Plants, for transformers, breakers, cables and other electrical components. An overview of typical failure rate data for power network components is shown in Table 1. The average data is derived and summarized from (Nemati et al., 2015; AME, 1992; Gill, 2011; Pascoe, 1978; Jeyapalan, 2007; SINTEF, 1984; Ammirato et al., 2006; Zhou et al., 2012; YARD, 2019).
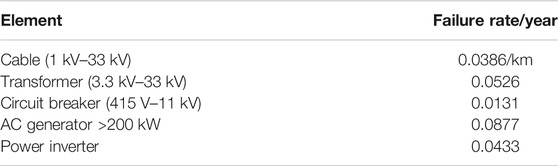
TABLE 1. The failure rate of the main power network (Nemati et al., 2015; AME, 1992; Gill, 2011; Pascoe, 1978; Jeyapalan, 2007; SINTEF 1984; Ammirato et al., 2006; Zhou et al., 2012; YARD, 2019).
All the failure rates of the mechanical system of the renewable energy sources such as turbine, diesel generator mechanical parts and gearbox are regarded as out of scope for this analysis, as the focus lies on the electrical infrastructure and network, rather than on the mechanical system. The reliability block diagram is built for each load node, modeling the AC generators, power cables, a transformer at the node and a circuit breaker connecting the load to the grid. Figure 1 shows the building blocks of each load node: the power network consists of an AC generator and cable connection configuration according to the network schematic diagram. An example of a load node reliability block diagram is shown in Figure 1.
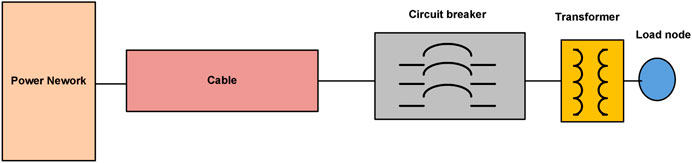
FIGURE 1. Connection components of the load node.
The cable reliability depends on the length of the cable. According to the cable length
Now, all the main grid components for reliability assessment are estimated. Based on the schematic diagram of the grid and the reliability values, the reliability block diagram for each load node can be implemented by ReliaSoftSim software. Static reliability for each main grid component is selected in the software option.
Grid Components Parameters Flowchart
A flowchart illustrating and summarizing the proposed technique to find/estimate the grid parameters for reliability and power flow analysis is shown in Figure 2.
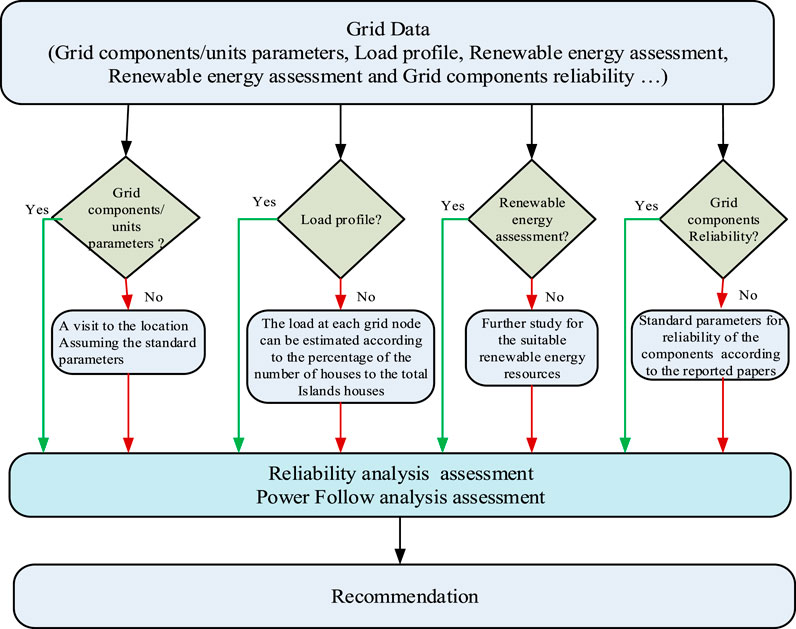
FIGURE 2. Flow chart for the proposed methodology.
According to this flow chart, all the possible and available data are collected. Then these data are classified into four parts; grid components parameters, load profile, renewable assessments and grid components reliability. If these all required data for the power flow and reliability assessments are presented, the next step is run the power flow and reliability analysis software. If the required information not available, a visit to the location or assuming the stranded parameters can be employed for grid components parameters. For the load profile, the load at each node can be estimated based on the percentage of the house number for each node or an average house consumption can be assumed. Further study for the suitable energy sources can be carried out for renewable energy assessments. For grid components reliability, standard reliability of the components according to the reported papers. Based on the power flow and reliability assessments results, a recommendation for the grid planning can be presented.
Case Study: Ushant Island
The outlined methodology will be applied and demonstrated in the following, using a specific case study. Ushant (French: Ouessant), an island off the coast of Brittany in North West France, as shown in Figure 3, is analyzed as an example to demonstrate the methodology and to outline the assessment of replacing the traditional generator units with renewable energy sources. The island has a permanent population of 850 residents. However, a large number of temporary visitors (holidaymakers, second-home owners and day-trippers) are also a regular occurrence, making the population variable with the seasons. The population peaks during the summer season, when it can reach 3,000 people. Energy demand on the island is dominated by domestic use and is strongly correlated to heating requirements. Despite the remote location, energy users on the island benefit from access to the same electricity tariffs as all French residents, subsidized by a small levy on all French electricity bills (Hardwick et al., 2018). As this subsidy does not apply to other fuels, electricity is used for nearly all energy needs, including heating and cooking. This means that there is a high per household electricity consumption relative to many small European islands.
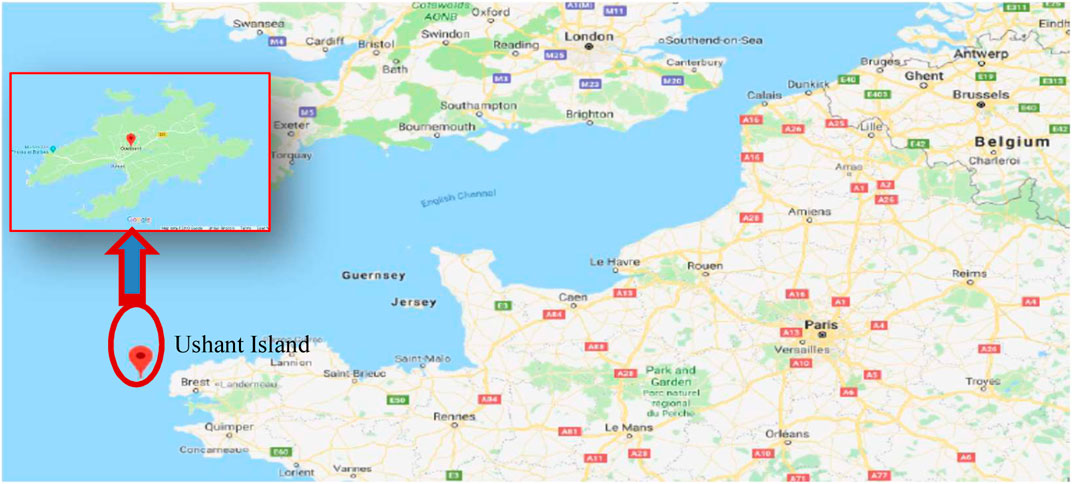
FIGURE 3. Map showing the location of Ushant [Google map].
Since 2015, the island has been the site of an experimental tidal energy converter (TEC). A Sabella ‘D10’ tidal turbine with a maximum power rating of 1.1 MW, was installed in the Fromveur Passage, close to the South East of Ushant and with a grid connection to the island (Sabella, 2003).
Ushant Island
Ushant is currently off-grid in terms of electrical energy and heating, thus relies on expensive and CO2 emitting diesel generation to meet its energy requirements. The overall cost of generation through fossil fuels is currently over twice as high as the French national average electricity cost of €0.169/kWh (£0.149/kWh, in 2019) (EDF 2016). Due to the price volatility of fossil fuels, the generation cost is also subject to significant fluctuations over time, leading to unpredictable future prices that may substantially raise the yearly expenditure on generation. The local government of Ushant seeks to shift away from fossil fuels toward more sustainable sources of energy, reflecting the wishes of islanders [13]. However, any change must not undermine the security of supply. The situation with the socialization of electricity costs means that there is less of an imperative to switch to reduce costs than might be expected since this will not be passed to consumers. By diversifying the island’s energy mix with a greater percentage of renewable energy (RE) generators, Ushant could exploit more of its natural energy sources that are available in the area. In addition to the Sabella, tidal turbine the island has installed small solar power projects (45 kW) on municipal buildings in 2017. Additionally, a 1 MW, 0.5 MWh Li-Ion battery system is installed at the main power station which is used to balance the load from the diesel generators and potentially the tidal turbine. The island has substantial wind resources and typical solar potential for its longitude. While wind and solar energy are increasingly economic, they are still intermittent and relatively unpredictable. Tidal power has the advantage of complete predictability, however; the times of generation will often not synchronize with demand. Consequently, for more RE to be installed on Ushant, it would be necessary to implement strategies to balance generation and demand, such as further energy storage or demand response.
For the solar energy assessment, data from the PVGIS-CMSAF (Photovoltaic Graphical Information System- Climate Monitoring Satellite Application Facility) (Huld et al., 2012) solar radiation model suggests that Ushant can expect to receive 1,256 kWh/m2/year of direct normal irradiation (DNI) and 1,295 kWh/m2/year of global horizontal irradiation (GHI). The mean variation in irradiance over every 24 h per month is shown in Figure 4, illustrating the variation due to the number of daylight hours. The resource is sufficient to provide a large quantity of electricity to the island during the summer months. However, the energy demand is greatest during the winter months when solar will be limited in the amount of energy which can be produced; for example, there is five times more solar radiation in July than in December, yet the consumption is only half as much. The daily demand profile in winter will not fit well with solar generation, the largest usage peaks in winter occur after dark when there is no solar generation.
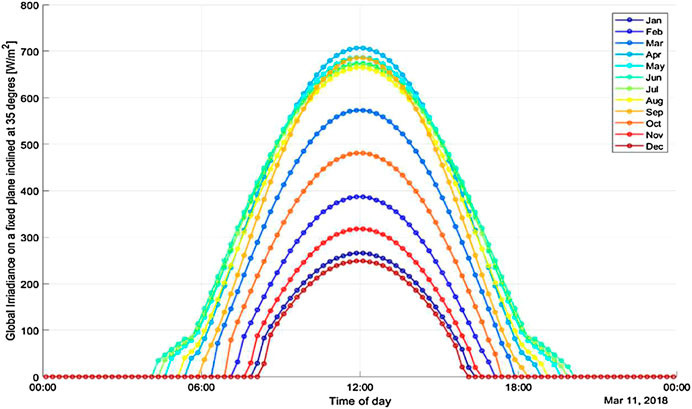
FIGURE 4. Mean solar radiation throughout the day for each month of the year on Ushant
For the wind energy assessment, over the 10 years from 2007–2017 the NOAA (National Oceanic and Atmospheric Administration, a US government agency) measured data show an average wind speed for the island of 7.7 ms−1 and a maximum sustained speed of 32.4 ms−1 (Information, National Centres for Environmental, 2018). As wind turbines are tall structures with a hub height of between 50–200 m it is necessary to scale the wind speed to represent the values at a higher level. Wind speed at 100 m is typically used as a starting point for a wind resource assessment (Brower 2012). Average monthly values scaled to 10 m and 100 m are shown in Figure 5. The available data are constrained to hourly averages of wind speed, therefore maximum gust speeds are not available; these data should be examined if they become available in the future (DNV Gl, 2008). The wind speed shows seasonal variation, with higher values on average throughout the winter months, coinciding with the island’s increased electrical demand.
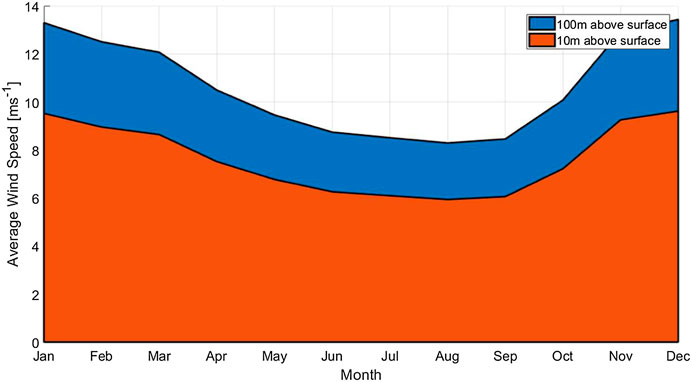
FIGURE 5. Average monthly wind speed at 10 m and 100 m above sea level.
Mahmood et al. (2019) present an optimization and energy management of renewable energy to replacing the Ushant Island diesel generators with renewable energy sources. The Ushant power network is modeled as a single large load, without consideration of the Ushant current grid and reliability/capacity of individual load nodes.
The local network operator SDEF manages the power network of Ushant Island. The Ushant grid consists of two main networks; 1) a high voltage network (HT in French), 5.5 kV, and 2) a low voltage network/distributed network (BT in French), 400 V. The schematic diagram of the HT Ushant Island network is shown in Figure 6. The present generation portfolio comprises four 1.2 MW diesel generators and a 0.5 MW diesel generator. Together with the 0.045MWp Solar PV array installed on the roof of the community sports hall in 2017 gives a total peak generating capacity of 5.345MWp. The annual power demand in 2016 is shown in Figure 7 (EDF 2016). There is significant seasonal variation in the electrical demand on the island. Electricity consumption is much higher during the winter as the majority of buildings on the islands rely on electrical heating (Consultants 2009).
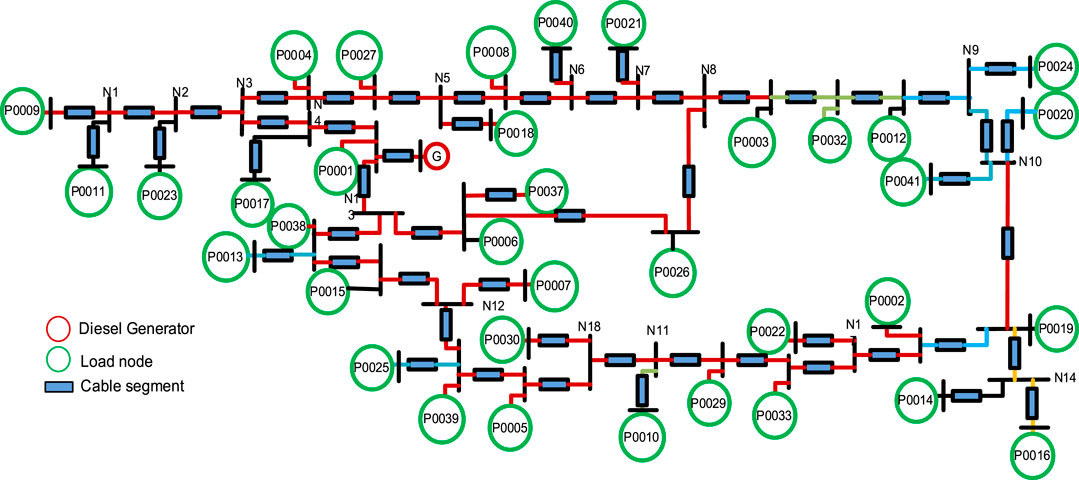
FIGURE 6. Schematic of the power network for the island of Ushant where P refers to the load number and N refers to the node number.
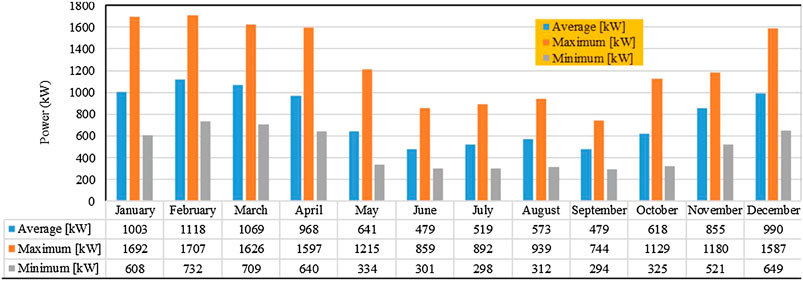
FIGURE 7. Average, maximum and minimum power demands over a year (2016) for the island of Ushant.
Ushant Power Network Parameters Estimation
There is limited information available regarding the Ushant power network. A schematic diagram and the total load power were supplied, however more detailed data were considered confidential and therefore were not made available by the network operator. Without access to the full data set, it was necessary to estimate the power load at each node in the network to perform reliability and power flow assessment to understand the capacity and ability of the grid to enable any energy transition plans. Assumptions were also made for the power cable parameters (the type of cable, length, and diameter) and the equivalent inductance, resistance and capacity of the cable calculated based on these assumptions.
(1) Cable Parameters: From the cable manufacturer’s datasheet, for a 5.5 kV cable, the typical insulation thickness is 2.25 mm. A cross-linked Polyethylene (XLPE) type cable is assumed, having a low dielectric constant of 2.3. The correction factor is 1.5. These specifications are chosen to emulate the worst conditions. The core material of the cable is Aluminum. Based on this information, the cable resistance, inductor and capacitor are estimated.
(2) Load at each node: The load can be estimated by establishing a catchment area for each node and then counting the number of houses/buildings in this area as shown in
(3) Figure 8, using a reference model for each load demand. The catchment area is drawn based on the nearest building to the node. The base model of the house is chosen to be a base house of 70 m2. The total number of buildings is 1,105, which is greater than the number of people living on the island permanently (850 (Hardwick et al., 2018)), assuming a typical household of 2.5 suggests that about 2/3rd of the buildings are likely to be a holiday or second homes serving tourism. Once the system parameters of the cable and power network are established, a Simulink model, using Matlab-Simulink, is developed to study the power flow of the network. Matlab Simulink programmable current control is employed to simulate the load active and reactive power based on the load voltage. The cable is modeled as PI section transmission line. The diesel generator is represented as a three-phase voltage source. The renewable energy sources are modeled by programmable current sources. There is a dump resistance to dissipate the energy mismatch. Once this essential network data are established, the power network can be assessed regarding reliability and power flow.
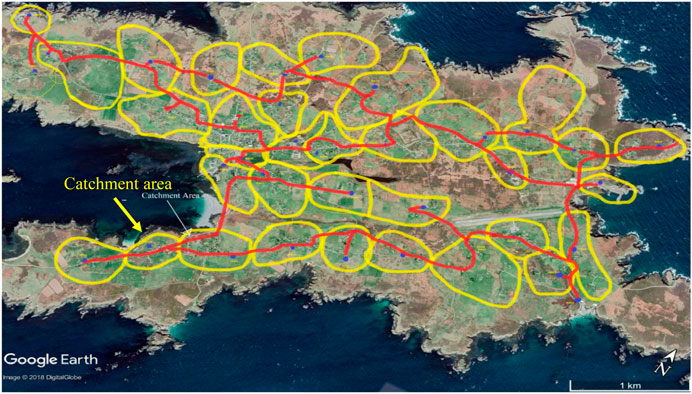
FIGURE 8. Ushant schematic power network diagram.
Power Flow Analysis of the Ushant Power Network
An initial study was conducted into the Ushant power network without introducing the renewable energy sources to the network. This provides an understanding of the capacity usage of the network and the possibility of the grid to accept new renewable energy without modifying the infrastructure of the power network. This analysis can then inform the selection of the most suitable locations for renewable energy deployments from a power network perspective. It indicates the potential rated power of renewable energy generation and location, which the existing network can support without requiring network upgrade investments.
The peak power demand recorded throughout the six years of available data is 2.08 MW, in March 2013 (EDF 2016). The peak demand of 2.08 MW is employed for the power flow analysis of the Ushant network. The power factor of the load node is assumed to be 0.7 which is normally the lower power factor of the grid (Papathanassiou and Santjer 2006). Based on this peak load, the load demand at each node is calculated as the percentage of the number of the building at each node, as shown in Figure 9 (the map in the following figures displays the location of each load node of cable segments) where the maximum load demand occurs at the town center (188 kW) and apart from the city center, the load demand nearly between 17 kW and 79 kW which is half of the load at the city center.
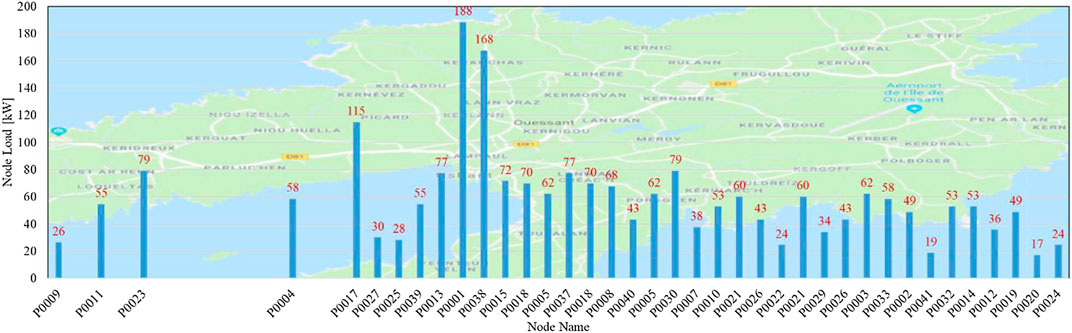
FIGURE 9. Power load at each node for the peak load demand (March 2013).
An analysis of the cable current capacity was undertaken under the highest load demand. Matlab/Simulink platform is employed as a software to perform the power flow analysis (Singh and Agrawal 2018). The outputs from the power flow analysis are the current in the cable and the voltage at each load node. Based on the cable current and cable size, the percentage of cable current capacity usage under the highest load demand (2.08 MW) as shown in Figure 10. The highest cable capacity usage is at the town center (58%). The Ushant power network is capable of adding further load or more generation units. The cable capacity analysis indicated that as much as 2.7 MVA (1.87 MW at 0.7 pf) could be added as power generation capacity.
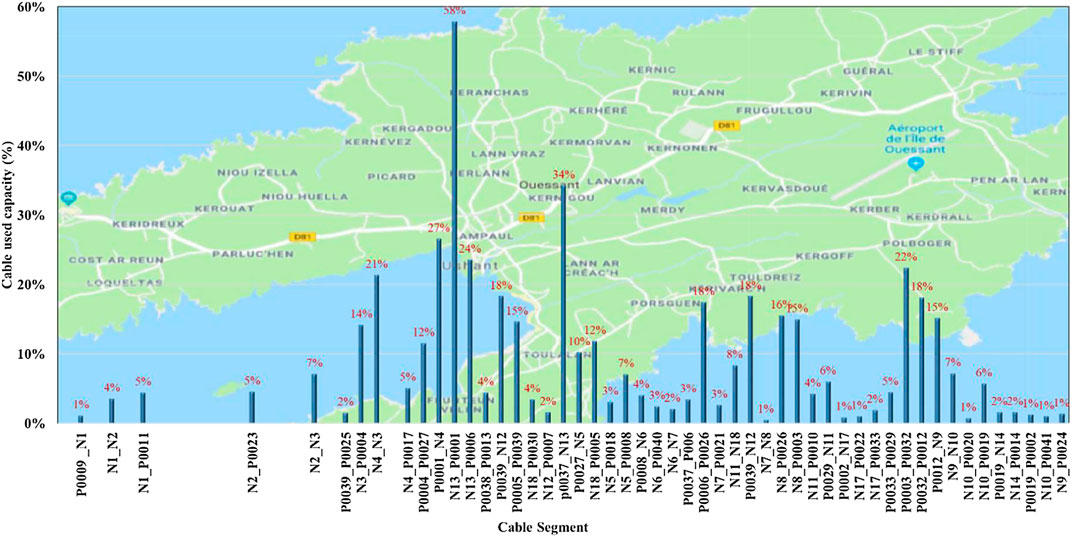
FIGURE 10. Cable capacity usage under maximum load demand.
Based on the voltage values from the power flow at each load node and the grid rated voltage, the percentage voltage drops at each node are shown in Figure 11. The percentage of the voltage drop is calculated based on the nominal high voltage network (5.5 kV). The further away the load nodes are located from the generation units, the higher the voltage drops at the load node. The range of the load node voltage drops is between 0.5 and 2% depending on their distance from the diesel generators units. This voltage drop range is lower than the maximum voltage variation ranges according to France grid regulations, 6–8% (Gazette of the French Republic, 2003). This means that there is no problem in the load node voltage.
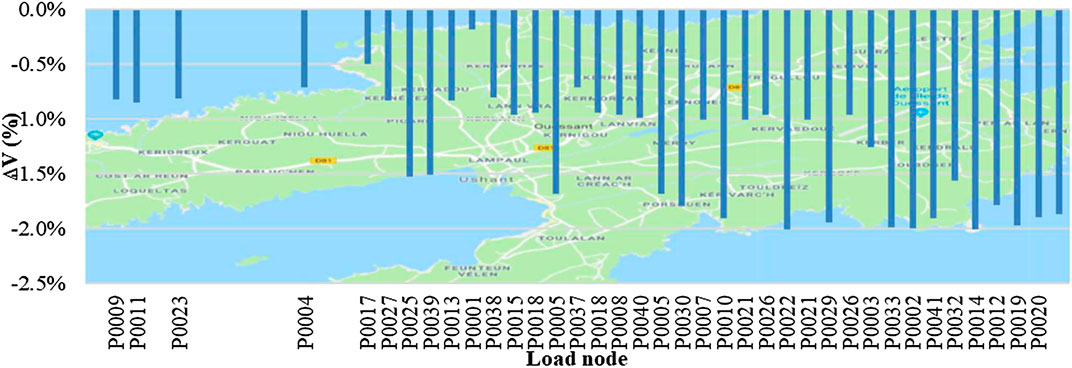
FIGURE 11. Voltage drop under maximum demand.
To study the effect of introducing new renewable energy sources to the island, a renewable energy scenario has been developed to provide examples of distributed renewable energy generation on Ushant Island. In this scenario, 800 kW WT, extensive PVs panels installed on 20% of rooftops (3889 MWh/annum) and 1.1 MW tidal turbine (100 kW) are considered to supply the load demand. There are many scenarios. This paper employed one scenario as an example to show the proposed topology.
This scenario has the highest power generation during the winter and incorporates generation from three power sources, which increases the system reliability. The exact location of the wind turbine is not specified. According to power flow and reliability assessment as paper proposed, two locations are suggested, shown in Figure 12. These positions are selected based on locations where the network will have the highest voltage drop (1.019–1.5%), highest failure rates (0.0837–0.0974 failure/year) and the connection node has lower cable capacity usage (2–3%) which means the cable can handle the generated power from the wind turbine. This supports the main idea of the proposed topology to find the best location for renewable energy. To assess the contribution of the renewable energy for the Island, two worst operation modes are considered according to the recorded data for Ushant in 2016 (Hardwick et al., 2018), the grid at maximum load demand condition and maximum generation output from the renewable energy sources are shown in Table 2.
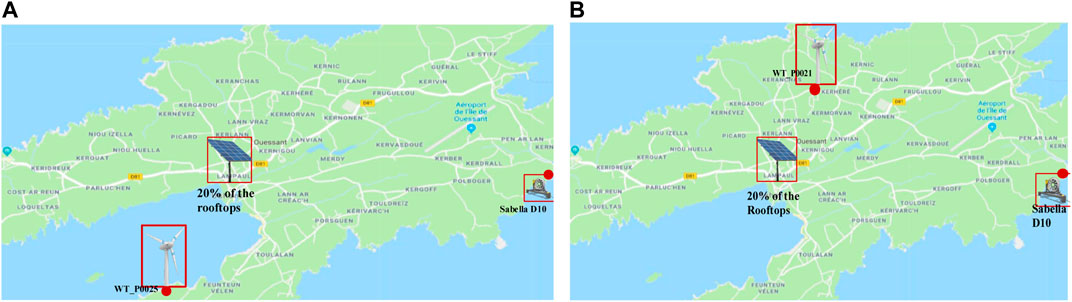
FIGURE 12. Locations of the renewable energy generation units (A) Location 1,WT_P0025 (B) Location 2, WT_P0021.
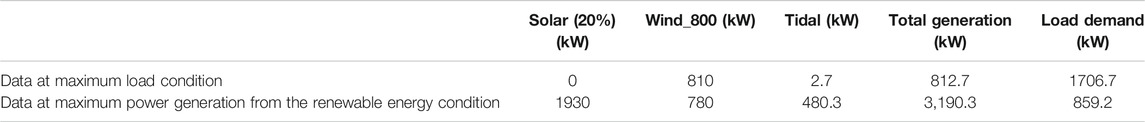
TABLE 2. Power demand and generation modes.
It is assumed that there is a battery storage system or alternative energy storage system, which is capable of storing the surplus of the generated energy and inject the shortage in energy demand. Two cases are considered here according to the WT locations; location 1 and location 2 respectively. For each case, two conditions are considered; maximum load and maximum output power from renewable energy.
Case 1: Wind Turbine at Location WT_P0025
The extensive PV model assumes 20% of the rooftops on the island have PV installed. Even distribution is considered at each load node by adding an energy source at each node. The power of this additional energy source is related to the percentage of the number of buildings at the node and the total PV generated power. For example, if the total power generated from PV is 1000 kW and the percentage of the number of buildings at a node is 10%. Therefore, the injected power at this node is 100 kW. According to these data, the cable capacity usages under two load cases are shown in Figure 13. It can be seen that under maximum power generation (3.2 MW) the cable capacity usage is high especial at the town center where the storage system located (58%). This is due to the surplus in power generation (2.3 MW) which is transferred to the battery storage unit. Moreover, the PV power is concentrated at the town center. Under the maximum load demand, the cable capacity usage is no more than 40% at the town center. The rest of the cable capacity usage is small (1–20%).
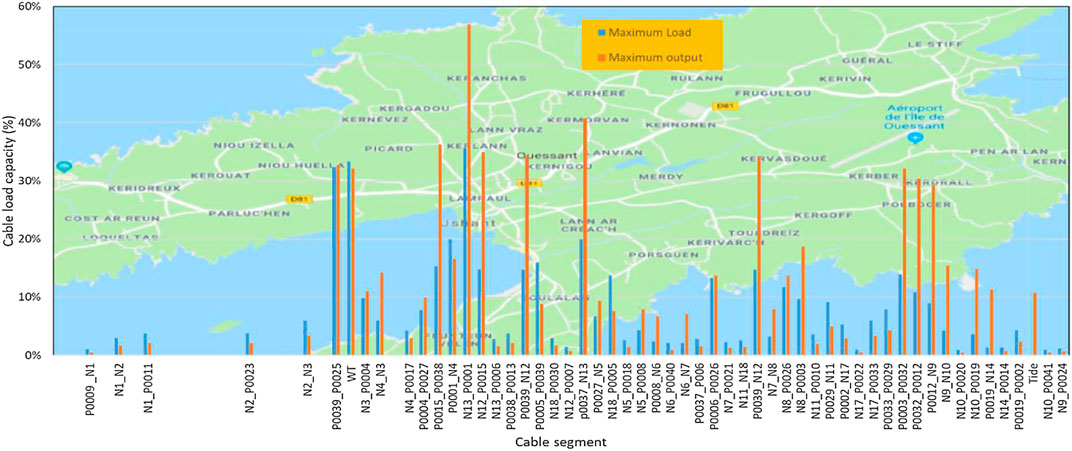
FIGURE 13. Cable used capacity under maximum load demand and maximum renewable energy generation power output (case 1).
The percentage of the voltage drop (∆V) under two load cases is shown in Figure 14. The voltage drop range is −0.5–3%. This voltage drop range is lower than the maximum voltage variation ranges according to France grid regulations, 6–8% (Gazette of the French Republic, 2003).
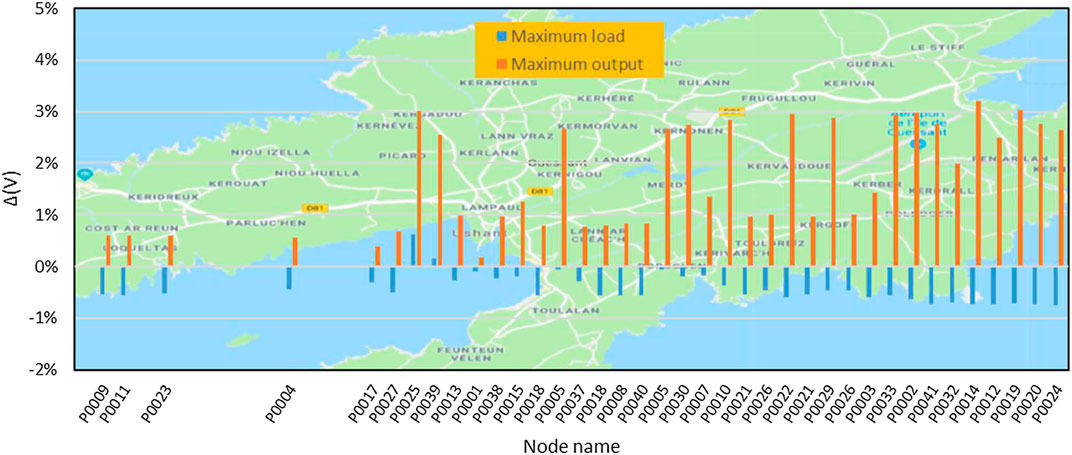
FIGURE 14. Voltage drop at each load node under maximum load demand and maximum renewable energy generation power output (case 1).
Under the maximum load, the voltage drops are small in most of the load node (<0.8%). However, the voltage drops at load node P0025 and P0039 are positive which means the voltage at these nodes are higher than the network nominal voltage (5.5 kV). These nodes have the closest proximity to the wind turbine where the power is injected and the existence of the cable capacitors equivalent which boost the node voltage. Moreover, there are no controls modeled in the power flow. This phenomenon happens at the maximum power generation case where each node acts as a current source to inject power to the network. This is because the generated power from PV is higher than the demand load power at each node.
Case 2: Wind Turbine at Location WT_P0021
In this load case, the cable capacity usage under two cases is shown in Figure 15.
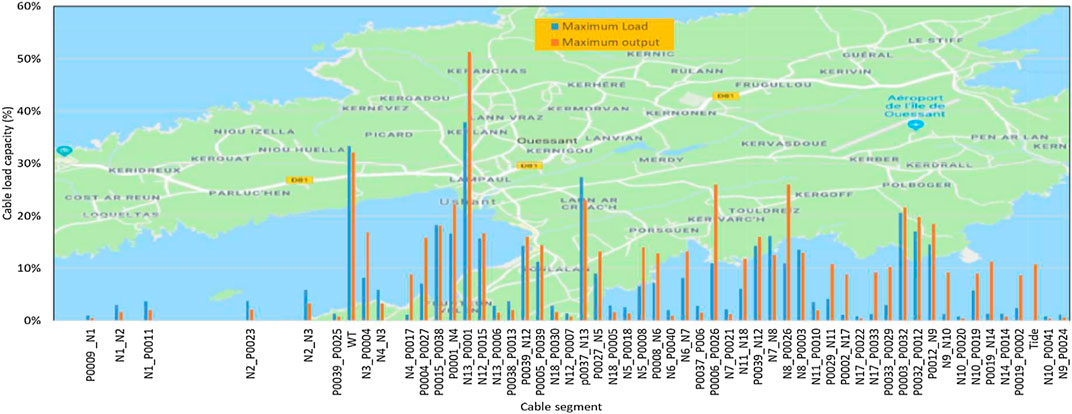
FIGURE 15. Cable used capacity under maximum load demand and maximum renewable energy generation power output (case 2).
Overall, there is little difference in the cable capacity usage throughout the network between the two cases with varying wind turbine location. At the location of the wind turbine, the cable capacity increases due to generated power injected to the grid. The city center still the highest cable capacity. However, the wind turbine location at P0021 (case 2) provides a little less in the cable capacity usage with a maximum of 52% which is around 10% less in case 1 due to the nearest to the city center.
Figure 16 shows the voltage drop at each load node. Under maximum load demand, the voltages drop is a little higher than scenario 1. Here, the maximum voltage drop is more than 1% ant all nodes. This voltage drop range is lower than the maximum voltage variation ranges according to French grid regulations, 6–8% (Gazette of the French Republic, 2003). Under the maximum generation example, the voltage drops at the load nodes which are positive as in case 1 are nearly the same as in case 1 but with different variation across the load nodes.
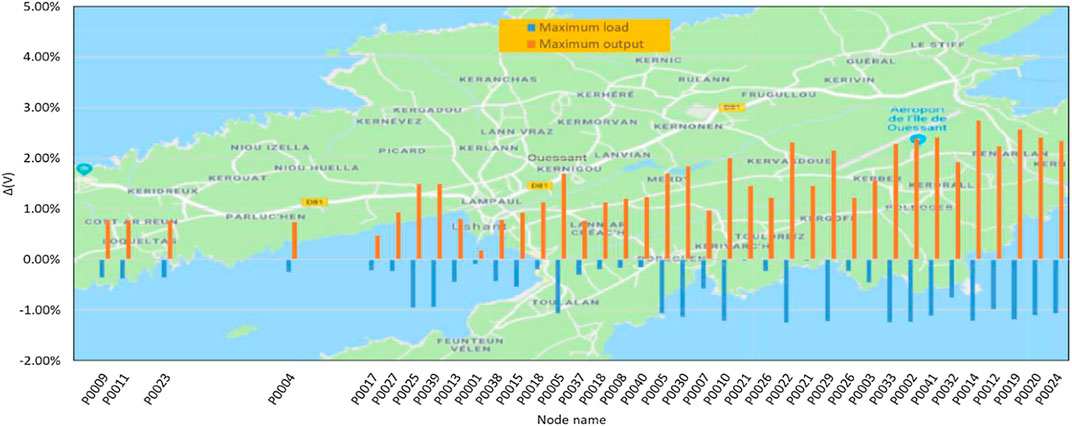
FIGURE 16. Voltage drop at each load node under maximum load demand and maximum renewable energy generation power output (case 2).
Under the maximum load demand example, the cable capacity usage is no more than 40% at the town center. The rest of the cable capacity usages are small (1–20%), as shown in Figure 17. There is not much difference between the two positions of the wind turbine in term of cable capacity usage. In the second wind turbine location (Figure 17), the cable capacity usage is slightly lower; in this case, the maximum is 52%.
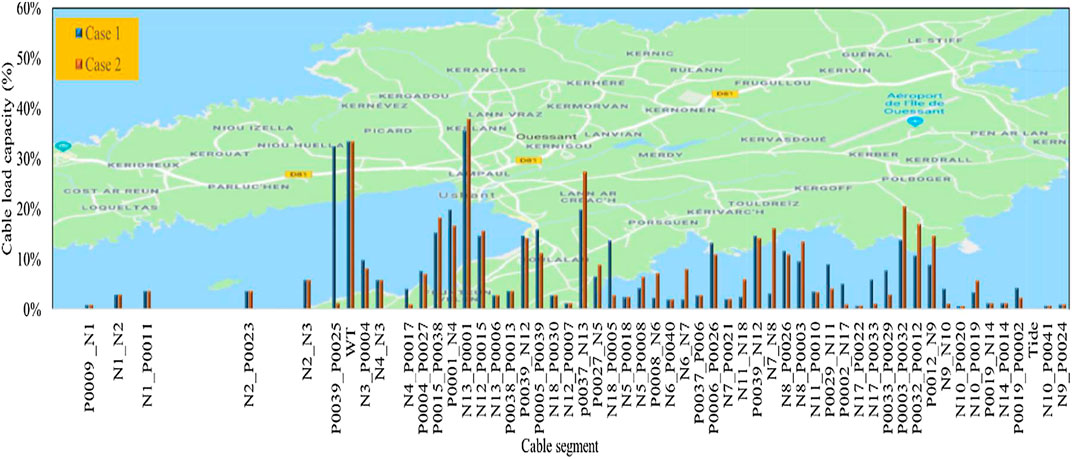
FIGURE 17. Cable capacity usage under two cases of the WT locations.
The cable capacity usage under renewable energy compared with the diesel generator are shown in Figure 18. Employing renewable energy reduces the cable capacity usage at the city center by 25% and increases eat the far of the city center compared to the diesel generators supply. This leads to well distribute the cable usage across the island power cables.
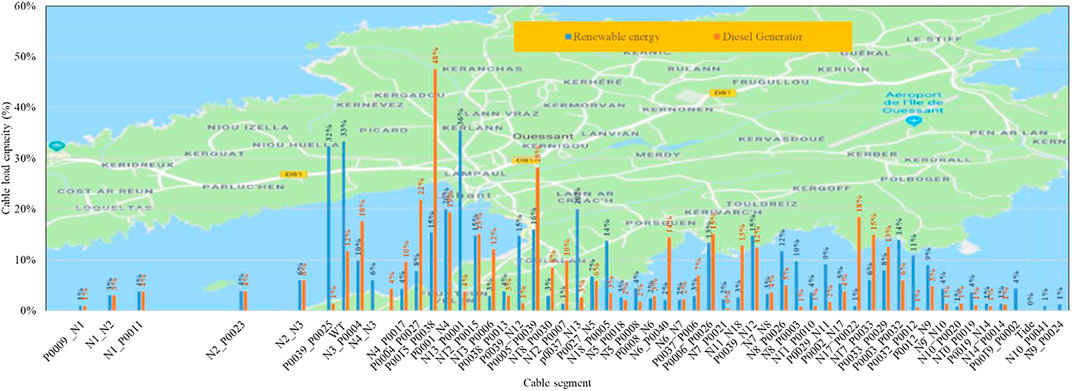
FIGURE 18. Cable capacity usage under renewable energy sources and diesel generators.
Reliability Analysis of the Ushant Power Network
Reliability analysis of the current Ushant network indicates the failure rate/per year of each node. Defined as, number of occurrences per year where there is no power at a specific load node. Moreover, it provides a general estimate of the power network reliability. For Ushant Island, there are no available data of the cables, transformers, generator and circuit breaker failure rates. Published papers and literature can be used to estimate the failure rate of the most common network elements (Nemati et al., 2015; Gill, 2011; Pascoe, 1978; Jeyapalan, 2007; SINTEF 1984; Ammirato et al., 2006; Zhou et al., 2012; YARD, 2019), Table 1. Based on the reliability data Table 1, the load node connection Figure 1 and Eqs. 4–7, the reliability block diagram for each load node can be implemented in ReliaSoftSim software environment as shown in Figure 19 for one load node (P0002) as an example. There is a reliability block diagram for each load node.
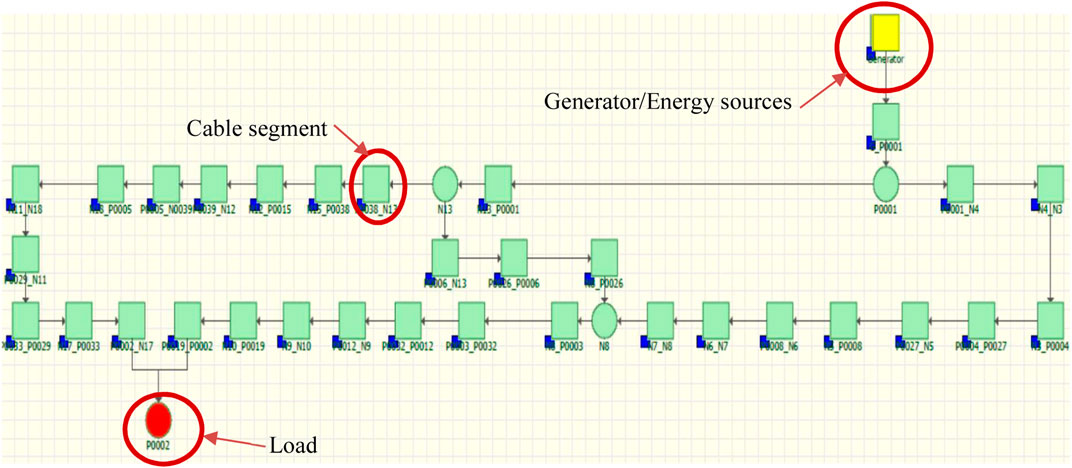
FIGURE 19. Load node P0002 reliability block diagram.
A comparison of the failure rate of the Ushant grid under the existing (diesel generator) operation and the proposed renewable energy powered operation was undertaken. Figure 20 shows the failure rate of the load node under renewable energy sources compared with the diesel network operation. As can be seen from Figure 20, the failure rates of the load nodes decrease according to their closeness to the renewable energy sources. In the case of renewable energy, the failure rate of the wind turbine, PV and a tidal turbine is the failure rate of an AC generator connected with an inverter.
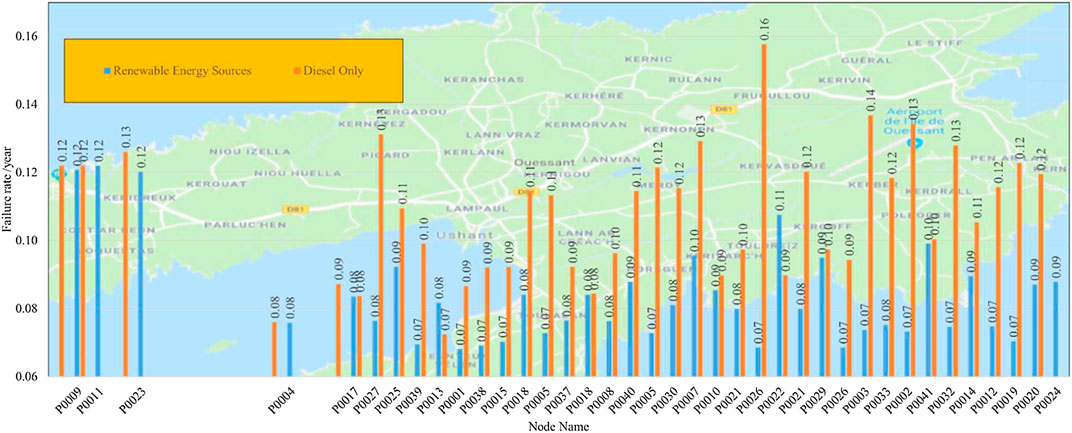
FIGURE 20. Load node failure rate under diesel and renewable energy sources.
The renewable energy sources reduce the failure rate of the load nodes (1–47%). The failure rate of the load node at town center reduced significantly (up to 37%). This is because the PV that is mainly at the town center has higher reliability compared to the AC generator.
Discussion
Moving to replace the fossil fuel to renewable energy sources is the target for the research and the government institutions on islands or remote areas. Many reported works did a great effort to study the nature of renewable energy sources and optimize the grid size and renewable energy sources. There is less attention to the current gird assessment. Do we need to replace, modified the infrastructure of the current grid? This the question which the paper tray to answer. The problem on the study the current grid is the less available necessary data to do the assessments. This due to the confidently and the age of the grid, these data cannot be access or obtained. This paper proposed a topology to find these data. The accuracy of the data and grid parameters estimation depends on the available data of the gird. The most important data are the grid generation units, cable parameters and total load profile. Ushant island is considered as a case study. Based on the power follow and reliability assessment, it may not need to do infrastructural for the grid. Moreover, the analysis of the grid helps to find a suitable location for renewable energy sources based on the power follow and reliability assessments. The proposed topology can be implemented in any island or remote area. This will be a tool to help the decision-maker for replacing fossil fuel with renewable energy sources.
Conclusion
In this paper, a topology for the reliability and power flow analysis is presented based on a proposed methodology to find and estimate the required data of the power network for the analysis. Two main Ushant power network modes are considered and compared with each other. The first mode is the current power network utilizing centralized diesel generators and the second one is the replacing the diesel generators with a selection of distributed renewable energy sources. For the power network operated by diesel generators, the power network cables can support an additional average of 1.8 MW load/power generation units and the failure rate of the load node is less than 0.13/year. The load node at the town center has a high cable capacity usage 58% and lower failure rate <0.07/year. The voltage drops at the load nodes are within the French grid regulations.
By introducing renewable energy, the cable capacity usage reduces up to 30% and the failure rate of the power network is decreased up to 50% reduction. Furthermore, there is excess energy generated from the renewable energy sources which need a huge battery storage system and proper control to handle the power among the loads and renewable energy sources. This work suggests that the Ushant power network infrastructure will not need to be modified if the move to renewable energy sources is undertaken.
The demonstrated analysis of power networks is useful to identify available grid capacity (or shortfalls) within existing power networks. This directly informs the potential and suitability to install and connect renewable energy capacity to existing networks. The demonstrated approach is also able to quantify and evidence the effect on network voltage drop and the reliability of energy supply to evaluate the effect of additional renewable energy installations for island networks. Therefore, analysis of the reliability and power flow of the current grid will help the decision-maker for planning to move from diesel generators to renewable energy sources.
Data Availability Statement
The original contributions presented in the study are included in the article/Supplementary Material, further inquiries can be directed to the corresponding author.
Author Contributions
EH did the analysis and wrote the paper draft and he is the corresponding author. PT did the paper review and supported the reliability assessment. JH did some analysis and wrote some paragraphs. PC reviewed the paper and did some editing. MA edited some parts of the paper, reviewed the paper, provided some data and figures, and supported to replay to the reviewers’ comments.
Conflict of Interest
The authors declare that the research was conducted in the absence of any commercial or financial relationships that could be construed as a potential conflict of interest.
Acknowledgments
The authors wish to acknowledge the support of this work by the INTERREG Channel funding stream through the Intelligent Community Energy (ICE) project, Grant Agreement Number 5025.
References
Alves, M., Segurado, R., and Costa, M. (2020). On the road to 100% renewable energy systems in isolated islands. Energy 198, 117321. doi:10.1016/j.energy.2020.117321
AME (1992). Reliability and availability of wave energy devices. Harwell: Advanced Mechanics and Engineering.
Ammirato, V. J., Silecchia, J., and Fairechio, W. (2006). “Predicting lead sheath cable failures,” in IEEE international symposium on electrical insulation.
Badal, F. R., Das, P., Sarker, S. K., and Das, S. K. (2019). A survey on control issues in renewable energy integration and microgrid. Prot. Control Mod. Power Syst. 4, 8. doi:10.1186/s41601-019-0122-8
Bertheau, P., and Cader, C. (2019). Electricity sector planning for the Philippine islands: considering centralized and decentralized supply options. Appl. Energy 251, 113393. doi:10.1016/j.apenergy.2019.113393
Brower (2012). Wind resource assessment: a practical guide to developing a wind project. New Jersey: John Wiley and Sons.
Chopin, P., Guindé, L., Causeret, F., Bergkvist, G., and Blazy, J.-M. (2019). Integrating stakeholder preferences into assessment of scenarios for electricity production from locally produced biomass on a small island. Renew. Energy 131, 128–136. doi:10.1016/j.renene.2018.06.031
Consultants (2009). Etude de faisabilite d’une operation de maitrise de l’energie et de developpement des energies renouvelables sur les îles de Molene at Ouessant. Lyon, France: SOGREAH.
Diane, C., Erika, M., Evangelos, R., Christoforos, P., Antun, P., Daniele, G., et al. (2019). “A methodology for energy planning in small mediterranean islands, the case of the gozo region,” in 2019 1st international conference on energy transition in the mediterranean area, 1–6.
DNV Gl (2008). Wind resource assessment software–WindFarmer: analyst. Available at: https://www.dnvgl.com/services/wind-resource-assessment-software-windfarmer-analyst-3766 (Accessed August, 2016).
Duić, N., Krajačić, G., and Carvalho Mda, G. (2008). RenewIslands methodology for sustainable energy and resource planning for islands. Renew. Sustain. Energy Rev. 12, 1032–1062. doi:10.1016/j.rser.2006.10.015
EDF (2016). The EDF open data platform on the ponan islands. Available at: https://opendata-iles-ponant.edf.fr/pages/home/ (Accessed August, 2016).
Escalera, A., Prodanović, M., and Castronuovo, E. D. (2019). Analytical methodology for reliability assessment of distribution networks with energy storage in islanded and emergency-tie restoration modes. Int. J. Electr. Power Energy Syst. 107, 735–744. doi:10.1016/j.ijepes.2018.12.027
Esmaeli, A., Abedini, M., and Moradi, M. H. (2016). A novel power flow analysis in an islanded renewable microgrid. Renew. Energy 96, 914–927. doi:10.1016/j.renene.2016.04.077
European Commission (1997). Energy for the future: renewable sources of energy. White Paper for a community strategy and action plan’, COM, 599. Communication from the commission. Available at: https://europa.eu/documents/comm/white_papers/pdf/com97_599_en.pdf (Accessed April, 2016).
Gazette of the French Republic (2003). “Relatif aux prescriptions techniques générales de conception et de fonctionnement auxquelles doivent satisfaire les installations en vue de leur raccordement au réseau public de transport de l'électricité,” in Décret n 2003-588 du 27 juin 2003 (Paris: Journal Officiel De la Republique Francise), 11110–11115.
Gill, Y. (2011). Development of an electrical cable replacement simulation model to aid with the management of aging underground electric cables. IEEE Electr. Insul. Mag. 27, 31–37 doi:10.1109/mei.2011.5699445
Hardwick, J., Zheng, S., Helen, C., Smith, M., Fitch-Roy, O., Williams, J., et al. (2018). A community specific assessment of local energy. UK: Exeter University, 113.
Huld, T., Müller, R., and Gambardella, A. (2012). A new solar radiation database for estimating PV performance in Europe and Africa. Sol. Energy 86, 1803–1815. doi:10.1016/j.solener.2012.03.006
IEEE (2007). “IEEE std 493-2007 (revision of IEEE std 493-1997),” in IEEE recommended Practice for the design of reliable industrial and commercial power systems, 1–383.
Information, National Centres for Environmental (2018). National oceanic and atmospheric administration. Available at: https://www.ncdc.noaa.gov/data-access/land-based-station-data. (Accessed April, 2018)
Jeyapalan, J. K. (2007). “Making remaining life predictions for power cables using reliability analyses,” in International conference on power insulated cables (France: Versailles).
Kanase-Patil, A. B., Saini, R. P., and Sharma, M. P. (2010). Integrated renewable energy systems for off grid rural electrification of remote area. Renew. Energy 35, 1342–1349. doi:10.1016/j.renene.2009.10.005
Kougias, I., Szabó, S., Nikitas, A., and Theodossiou, N. (2019). Sustainable energy modelling of non-interconnected Mediterranean islands. Renew. Energy 133, 930–940. doi:10.1016/j.renene.2018.10.090
Mahmood, H., Hussain, E., Xu, J., Abusara, M., Thies, P. R., Nerenzi, E., et al. (2019). Analysis of smart grid and storage options in a demand side assessment context. Penryn,Uk: University of Exeter, 74.
Menčík, J. (2016). Concise reliability for engineers. IntechO/pen. Available at: https://www.Concise Reliability for Engineers (Accessed October, 2018).
Nemati, A. S. A., Hassan, M., and Nowaczyk, S. (2015). “Reliability evaluation of underground power cables with probabilistic models,” in Int. conf. data mining, DMIN'15 las vegas (Las Vegas: DMIN'IS).
Papathanassiou, S. A., and Santjer, F. (2006). Power-quality measurements in an autonomous island grid with high wind penetration. IEEE Trans. Power Deliv. 21, 218–224. doi:10.1109/tpwrd.2005.848723
Pfeifer, A., Bošković, F., Dobravec, V., Matak, N., Krajačić, G., Duić, N., et al. (2017). “Building smart energy systems on Croatian islands by increasing integration of renewable energy sources and electric vehicles,” in 2017 IEEE international conference on environment and electrical engineering and 2017 IEEE industrial and commercial power systems europe (Milan: IEEE), 1–6.
Ramakumar, R., Abouzahr, I., Krishnan, K., and Ashenayi, K. (1995). Design scenarios for integrated renewable energy systems. IEEE Trans. Energy Convers. 10, 736–746. doi:10.1109/60.475847
Rikos, E., and Perakis, C. (2020). The PRISMI proposal for a user-friendly load-flow tool for analysis of island grids. Renew. Energy 145, 2621–2628. doi:10.1016/j.renene.2019.08.017
Römer, B., Aldonza, K., Julliard, Y., and Lewis, O. (2017). Planning 100% renewable energy islands: the case of the Caribbean island of Montserrat. CIRED Open Access Proc. J. 2017, 2488–2492. doi:10.1049/oap-cired.2017.0728
Sabella (2003). Ushant showcase OF tidal energy worldwide. Available at: https://www.PowerPoint Presentation (sabella.bzh) (Accessed September, 2016).
Singh, B., and Agrawal, G. (2018). Enhancement of voltage profile by incorporation of SVC in power system networks by using optimal load flow method in MATLAB/Simulink environments. Energy Rep. 4, 418–434. doi:10.1016/j.egyr.2018.07.004
SINTEF (1984). Offshore reliability data handbook. Available at: https://www.nri.ac.ir/Portals/0/images/Technology/OandM/document/OREDA.pdf (Accessed August, 2018).
SourceForge (2001a). Plot Digitizer. Available at: http://plotdigitizer.sourceforge.net (Accessed June, 2018).
Suhas Shirbavikar, S., Ashok, M., and Babu Narayanan, M. (2010). “Dynamic analysis of renewable energy systems and their impact on smart grid,” in 16th National power systems conference, India, 15th–17th December, 2010.
Sukerayasa, I. W., Giriantari, I. A. D., and Prawira, Y. M. A. (2014). “Load flow and suplly security analysis of power system in Tiga Nusa; before and after the application of 20kV submarine cable,” in 2014 international conference on smart green technology in electrical and information systems (ICSGTEIS) (Kuta: IEEE), 28–31.
Surroop, D., and Raghoo, P. (2018). Renewable energy to improve energy situation in African island states. Renew. Sustain. Energy Rev. 88, 176–183. doi:10.1016/j.rser.2018.02.024
Tzanes, G., Zafeiraki, E., Papapostolou, C., Zafirakis, D., Konstantinos, M., Kavadias, K., et al. (2019). Assessing the status of electricity generation in the non-interconnected islands of the aegean sea region. Energy Procedia 159, 424–429. doi:10.1016/j.egypro.2018.12.065
Uddin, M., Romlie, M. F., Abdullah, M. F., Tan, C. K., Shafiullah, G. M., and Bakar, A. H. A. (2020). A novel peak shaving algorithm for islanded microgrid using battery energy storage system. Energy 196, 117084. doi:10.1016/j.energy.2020.117084
Yue, C.-D., and Yang, G. G.-L. (2007). Decision support system for exploiting local renewable energy sources: a case study of the Chigu area of southwestern Taiwan. Energy Pol. 35, 383–394. doi:10.1016/j.enpol.2005.11.035
Keywords: load flow, microgrid, power system planning, power system reliability, renewable energy
Citation: Hussain EK, Thies PR, Hardwick J, Connor PM and Abusara M (2021) Grid Island Energy Transition Scenarios Assessment Through Network Reliability and Power Flow Analysis. Front. Energy Res. 8:584440. doi: 10.3389/fenrg.2020.584440
Received: 17 July 2020; Accepted: 21 December 2020;
Published: 19 February 2021.
Edited by:
Behnam Mohammadi-ivatloo, University of Tabriz, IranReviewed by:
Taskin Jamal, Ahsanullah University of Science and Technology, BangladeshG. M. Shafiullah, Murdoch University, Australia
Copyright © 2021 Hussain, Thies, Hardwick, Connor and Abusara. This is an open-access article distributed under the terms of the Creative Commons Attribution License (CC BY). The use, distribution or reproduction in other forums is permitted, provided the original author(s) and the copyright owner(s) are credited and that the original publication in this journal is cited, in accordance with accepted academic practice. No use, distribution or reproduction is permitted which does not comply with these terms.
*Correspondence: E. K. Hussain, ZXNfa19hQHlhaG9vLmNvbQ==