 Gratitude Charis
 Gwiranai Danha1
 Edison Muzenda
- 1Department of Chemical, Materials and Metallurgical Engineering, Botswana International University of Science and Technology, Palapye, Botswana
- 2Department of Chemical Engineering Technology, University of Johannesburg, Johannesburg, South Africa
This simulation study explores sustainable improvements that could be made to a pine dust pyrolysis system to eliminate total dependence on external electrical energy supply and improve the yield of high-quality dry bio-oil. The components, stoichiometric yield and composition of oil, char and gas were modeled in ChemCAD using data from literature and results from biomass characterization and pyrolysis. A fast pyrolysis regime was used to increase the overall yield of dry oil fraction recovered and the char by-product was utilized to make the system energy self-sufficient. The optimization study focused on the condensation system whose parameters were varied at the provided optimum pyrolysis temperature. The recommended temperature for the primary condenser was 96–110°C which yielded 23.3–29.8 wt% dry oil with 2.4–4.4 wt% water content. The optimum temperature for the secondary condenser was 82°C whose bio-oil (∼2.92 wt%) had a moisture content of 7.5–10 wt% at constant primary condenser temperature between 96–110°C. The third condenser could be operated at ambient temperature. The results were validated using both information reported in literature and results from the previous experimental study. Such a simple model built by careful selection of the model bio-oil components is useful in estimating the optimal parameters for the biomass pyrolysis staged condensation system.
Introduction
General Introduction
There has been a drive toward higher value conversion alternatives for biomass wastes such as sawmill waste. Waste lignocellulosic biomass has become an attractive source of renewable solid, liquid and gaseous fuels for heating, power and transportation (Guedes et al., 2018). Although thermochemical technologies for biomass to biofuel conversions such as gasification and methanol synthesis and lignocellulosic ethanol production are at the brink of commercialization, they are characteristically large investment projects requiring high technical expertize and could take another decade to fully reach developing countries (Charis et al., 2018). Pyrolysis has been identified as a low investment technology that is less technically complex than other thermochemical methods and could be a short to medium-term answer to the energy poverty in developing regions like Southern Africa. It also has advantages of high efficiency and effective utilization of feedstock over biological conversion methods, with high yields of a liquid fuel or intermediate referred to as “bio-oil”. The target for this particular study is lower value applications of bio-oil. One of the appealing avenues is the substitution of heavy fuel oil (HFO) in the power generation and marine industries, since pyrolysis oil has compatible properties with the HFO (Kass et al., 2018). Characterization and blending tests with HFO showed the bio-oil to be miscible with HFO, improving overall efficiency and reducing energy requirements for heating and pumping HFO in a flowable state (Kass, 2019a). The motivation for this study is therefore to provide an alternative power generation source, especially for remote areas detached from the grid, where timber sawmills are mostly located.
The energy-dense bio-oil is convenient to handle and transport, but has shortcomings including high moisture and oxygen contents, low pH, instability, solid residues and low calorific value (Bridgwater, 2018). These properties contribute to bio-oil’s corrosive and erosive tendencies; aging and phase separation, immiscibility with hydrocarbon fuels, engine problems due to injector blockage by solids, high pumping costs, poor atomization and overall low fuel quality (Bridgwater, 2011). To get better value from bio-oils, they require some form of upgrading to alter various properties before their final use. Upgrading the bio-oil to transport fuels using rigorous downstream processes is capital intensive and still an area under research and development (IRENA, 2016). The alternative is to obtain semi-upgraded bio-oil for applications such as furnace, boilers and substitution of HFO in marine and power generation applications. This can be done using methods such as staged or fractional condensation and catalytic pyrolysis, to increase the heating value, lower pH, decrease the moisture content and overall, improve the quality and shelf life of the oil. There has been a rising interest in catalytic pyrolysis (CP) in which the feedstocks are mixed with the catalyst (in-situ CP) or made to interact with the pyrolysis vapors (ex-situ CP). The catalyst promotes the secondary reactions of intermediates by removing oxygen from them to produce carbon and hydrogen oxides, considerably improving the conversion and selectivity to desirable hydrocarbon components in the product oil. The product would then have a higher calorific value, more stability and be more amenable to subsequent upgrading at a lower cost for higher quality fuels (Liu et al., 2014).
Staged or fractional condensation is an alternative in-process method of improving the quality of the bio-oil which does not require much extra investment (Gooty, 2012; Papari and Hawboldt, 2018). This is because condensers are already a vital part of the pyrolysis system, for the recovery of condensable fractions. Staged condensation only differs from the conventional methods in that the temperature profiles of the cascading units are optimized for the recovery of defined fractions at those points (Charis et al., 2020b). The temperature profile normally decreases from the first to the last stage. In such an arrangement, the heavier organics (“dry oil”) are mostly recovered at the first condenser, while water and acids are relegated to the last stages. This makes it possible to have a bio-oil fraction of higher stability and low water content, typically <1 wt%–7.45 wt% in the first condensers where temperatures usually kept above 80°C. At such conditions, the composition of acids is 2–3 wt% for these recovered bio-oil fractions compared to 10–15% in unfractionated bio-oil. The HHVs of the ‘dry’ oils depend on the original feedstock, the most promising ranging from 22.6 MJ/kg–36 MJ/kg compared to 40 MJ/kg for HFO (Papari and Hawboldt, 2018; Charis et al., 2020b). This cheap bio-oil could potentially substitute HFO in slow marine or power generators designed for such residual fuels with high viscosity and considerable compositions of solids and moisture.
Although catalytic upgrading offers advantages of higher selectivity for specified compounds for fuel or chemical applications, it comes with extra costs of catalysts, conditioning and the regeneration process, compared to fractional condensation (Liu et al., 2014; Yildiz et al., 2016). Moreover, catalysts are specific to a fraction of the many pyrolysis decomposition intermediates and are frequently deactivated through coke formation which clogs active sites (Yildiz et al., 2016). There are further challenges on up-scaling from laboratory to pilot or industrial scale in terms of processing mode and reactor technology. The choice of catalytic or fractional condensation routes or a hybrid can be made by considering the cost vs. benefit derived in terms of the quality of oil required by the downstream process application.
Base Case, Gaps and the Prospective Model
A simple bench-scale system based on the intermediate pyrolysis regime presented by Charis et al. (2020b) yielded some promising results with a dry oil of 36 MJ/kg heating value. However, the system was not sustainable due to its total dependence on external electrical energy supply and small recoveries of high-quality dry oil. This study sought to identify strategies toward improving the sustainability of this pyrolysis system with regards to the system’s energy requirement and target product (dry oil) yield and quality. ChemCAD, a process simulation software, was used to model the pyrolysis in the fast pyrolysis (FP) regime with a high overall liquid recovery and a corresponding high dry oil fraction. The other improvement was on utilizing the char by-product to energize the system and make it self-sufficient. Even after obtaining an optimum pyrolysis temperature, a wrong temperature profile at the condensers can still lead to imbalances in the recoveries of the dry oil with waste streams still having a considerable amount of oil. The ChemCAD simulation model can be used to optimize the staged condensation units with the right temperature profile by varying the parameters of the condensation system at the optimum pyrolysis temperature.
ChemCAD has the advantage of being a cheaply available software with competitive process simulation equipment and background algorithms designed to handle most basic chemical engineering processes. Its use reduces the cost and time requirements for further laboratory analyses, especially in cases where it is expensive to get all the relevant equipment. Overall, this modeling study aimed to optimize the system to recover bio-oil of acceptable quality and quantities in the first two condensers, with results that are comparable to literature.
A general survey shows that most modeling and simulation researches have covered entire pyrolysis systems from technical and techno-economic viewpoints (Onarheim et al., 2015; Shemfe et al., 2015; Bashir et al., 2017; Carrasco et al., 2017), with a few having focused on the optimization of staged condensation systems for biomass pyrolysis. One research that focused on such systems was done by Krzywda and Wrzesińska (2020). They modeled a pyrolysis system for waste plastics using a rectification column as the pyrolysis reactor and a series of condensers arranged differently. They claimed that the design of the staged condensation unit influences the quantity and quality of liquid fractions obtained. They also mentioned that it was better than the conventional, unfractionated condensation since it enabled the separate recovery of oil fractions with desired properties such as high heating value. Perhaps, what also made their simulation approach easier was the fact that plastic pyrolysis oil can be characterized entirely and has fewer compounds, whose properties are largely available in process simulation packages, compared to the complex bio-oil. There were no similar simulation researches found focusing on condensation and fractionation for biomass pyrolysis.
Materials and Methods
Building the Simulation Model
General Concept and Flow
Novel concepts from the cited literary works were innovatively fused to come up with a simple model that can be used to predict the combined effect of condenser temperatures on the quantity and quality of oil fractions recovered. The yield and relative amounts of some individual products from the pyrolysis reaction are factored into the stoichiometric reaction. This is akin to the use of the Aspen RYield reactor alone, espoused by Onarheim et al. (2015), except that the equilibrium reactor that was used in ChemCAD does not factor in temperature dependence. Therefore the yield at one selected pyrolysis temperature could only be modeled at the optimum point. Three units were simulated as flash condensation stages that used the inbuilt Vapour-Liquid-Liquid equilibrium data to determine dew points for the components in the mixture. The first (primary) and second (secondary) condenser temperatures were varied separately while keeping the other two constant, using a sensitivity study. Normally, the primary condenser is meant to recover the heavy organic compounds which would constitute the high calorific value oil fraction, therefore a higher condensation temperature (>100 C) was used. The second condenser would then take a lower value, usually between 50 and 90°C to cater for water and organics of lower molar mass such as acids (Papari and Hawboldt, 2018). Once the optimum temperatures were established using the sensitivity analysis, the ChemCAD simulation was run at those constant values to evaluate the overall performance of the simulation. A char combustor was also included to recover energy from the char and use it to preheat the biomass before or after entering the pyrolysis reactor, depending on the design. Figure 1 is a simplified flow diagram illustrating the process concept.
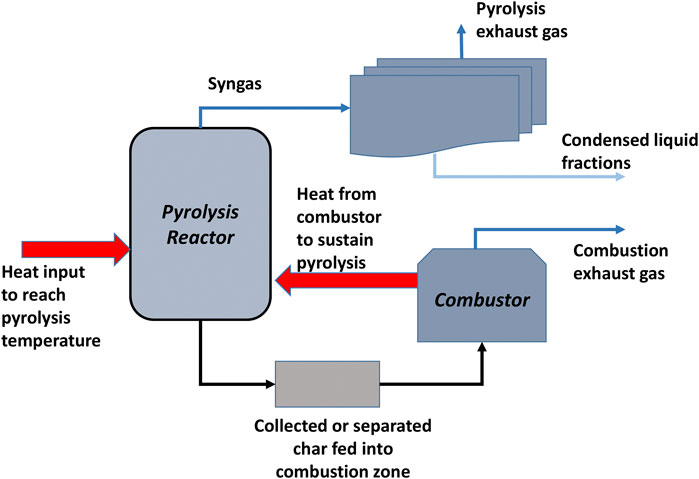
FIGURE 1. General flow sheet for the pyrolysis process.
Components and Reactions
A brute chemical formula (C138.4H176.6O63) for the biomass was obtained using both proximate analysis results and literature (Table 1), while simultaneously achieving the right stoichiometric balance of the pyrolysis reaction. This balanced reaction took into account the approximate yields of the bio-oil, char and fuel gas from the pyrolysis experiments. The formula adopted had to fall within the range of the empirical formulae from both literature and this research. Nitrogen and sulphur were not factored into the empirical and molecular formulae due to the negligible composition and also to simplify the model. Ignoring these two would have a negligible effect on the quantity or quality of bio-oil recovered since these would largely report to the fuel gas stream. These two would however be important to account for when an overall flow or environmental analysis is to be done.
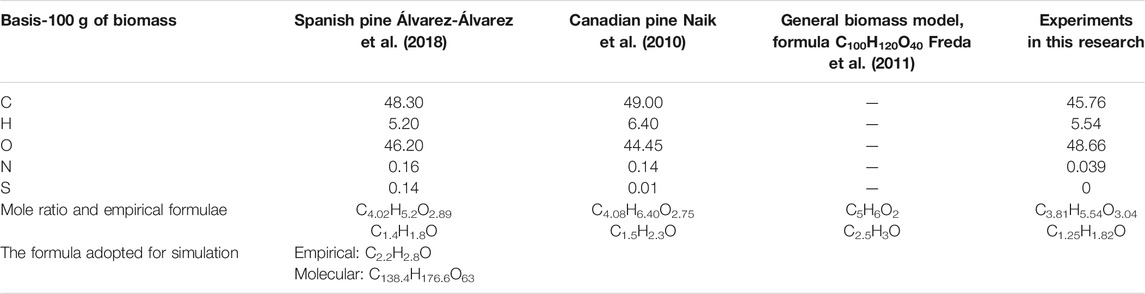
TABLE 1. Determination of empirical and hecular formula using literature, experimental data and stoichiometric balance.
The C/O and H/O ratios of 2.2 and 2.8 fall in the ranges of 1.25–2.5 and 1.8–3 that are given in the literature and by the characterization data.
Two main stoichiometric reactions were formulated similarly as modeled by Freda et al. (2011). The model assumes methane to be the dominant hydrocarbon gas constituent, along with carbon monoxide, carbon dioxide and hydrogen. Other gases such as C2H2, C2H6 and C3H6, which are usually in small amounts in the pyrolysis vapor, were not included in the equation due to the component limit. The char is represented by pure carbon. Eq. 1 is the main pyrolysis equation, while Eq. 2 accounts for the formation of hydrogen indirectly, through the slight reformation of methane.
The Excel stoichiometric mass balance for the primary reaction (Eq. 1) is shown in Table 2.
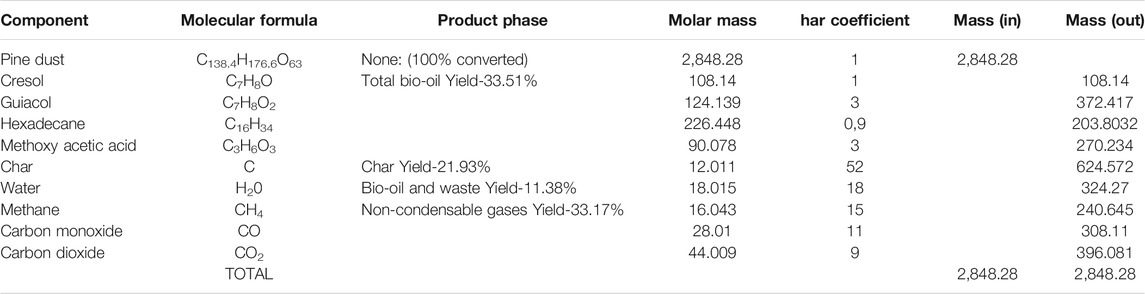
TABLE 2. The Excel stoichiometric mass balance.
The stoichiometric model in Excel was adjusted to satisfy most of the feasible constraints or acceptable results from literature and the experiments previously done. For instance, the char yield can be between 12–40 wt% for intermediate-fast pyrolysis regimes. Literature on these regimes has also reported on gas yields from as low as 13 wt% to as high as 33 wt% (Bridgwater, 2018; Reza et al., 2019).
According to Bridgwater. (2018), the moisture content (MC) in the FP bio-oil can be between 15 wt% and 50 wt% of the bio-oil. At higher levels, especially beyond 50 wt%, the water in the oil induces phase separation. Such high water compositions are typical of intermediate regimes of pyrolysis, while FP typically produces higher yields of better quality oils (Charis et al., 2020b). In this simulation, the total amount of water obtained from the reaction was considered to be 25 wt% of the total liquid yield (∼45 wt%). This total yield used is a conservative figure considering the maximum of 46.1 wt% that was obtained by Charis et al. (2020b) for the pine bio-oil and the 75 wt% threshold possible with FP (Bridgwater, 2018). Four compounds were used to represent the organic bio-oil due to the constraints on the number of compounds that can be placed in a stoichiometric reaction in ChemCAD (i.e., 10). The GCMS results showed a high peak area percentage of phenols (up to 48%) and up to 30% hydrocarbons, showing that these compounds were concentrated in the dry oils. It was necessary to further confirm with actual weight compositions from literature. Lu et al. (2017) classified the compounds in bio-oil as hydrocarbons (aromatics, alkanes, alkenes and alkynes), oxygenated compounds (furans, esters, ketones, aldehydes, alcohols, ethers and carboxylic acids) and hetero-atomic species. They reported that bio-oil typically has a composition of 16–40 wt% of straight chain and cyclic hydrocarbons; at least 40 wt% of oxygenated compounds; 15–30 wt% sugars and 1–3 wt% of hetero-atomic species. Using both experimental and literature results, four compounds were selected to represent bio-oil: two phenols, Cresol and Guaiacol; Hexadecane, an averagely chained hydrocarbon; and Methoxy-acetic acid, a carboxylic acid. This adopted model comprises 58.7% oxygenated compounds (phenols and carboxylic acid) and 21.4% hydrocarbons. A model with both polar and non-polar compounds is also good in terms of approximating the dew point profile of the compounds in the oil, which determine the amount of liquid recovered at the condensers.
The Process Flow Model
The ChemCAD flow sheet for the proposed model is shown in Figure 2. The pine dust feedstock used was assumed to comprise 4.33 wt% of moisture content (MC), which is represented separately from the main feedstock as a 6.50 kg/h stream This MC is an attainable for longer periods of air drying (>3 weeks) in dry and hot conditions, or by kiln or over drying (Simpson, 1999; Charis et al., 2020a) A mass flow of 143.5 kg/h of feedstock and 0.003 kg/h of inert nitrogen gas is introduced into the reactor. Although the actual bench-scale reactor used for the experiments required external heating (Charis et al., 2020b), a self-sustaining pyrolysis process design was used. In this more sustainable case, grid electrical energy is required to initialize the reaction, thereafter we recover enough energy from the char to energize the process. Consequently, the feed stream passes through a heat exchanger, preheater 1, where its temperature is raised to 500°C before being introduced in the reactor. The reactor is maintained at this provided temperature (500°C), the optimum obtained for the pine dust pyrolysis at atmospheric pressure. The heat exchanger system has the theoretical capacity to raise the feedstock temperature to ∼650°C, therefore, it can be regulated according to the required temperature.
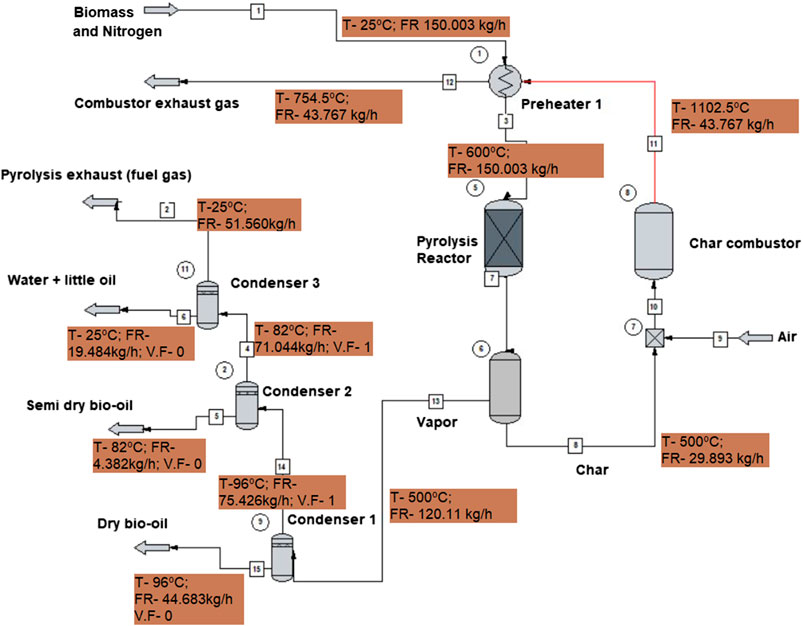
FIGURE 2. The ChemCAD flow diagram.
From the reactor, the char is separated into a combustor. A simple separator is used to denote a 95 wt% recovery of all the carbon rather than an actual screen or cyclone separator since the particles size distribution was not available. The char is then combusted to provide the heat required for the pyrolysis.
According to Crombie and Mašek (2014), various literature have stipulated that biomass pyrolysis requires 6–15% of the HHV in the original feedstock, with actual values falling in the range 1.1 and 1.6 MJ/kg, depending on the feedstocks. For the purpose of this study, the upper limit was used to determine the amount of energy that could be required to kick-start the pyrolysis. This implies that 229.60 MJ/h of energy is required for the feed of 143.5 kg/h. Three hours were considered sufficient to generate enough char to perpetuate the pyrolysis. Meanwhile, the energy required in that period (688.8 MJ/kg) is supplied through an electrical system delivering heat through coils wound around the reactor. After that, the process would be self-sustained.
The char produced in the first hour (31.47 kg) should have enough energy to supply for the next hour, even if the lower values of HHV from literature and experiments such as 29 MJ/kg were to be used to calculate the energy potential of that char (912 MJ/h) (Bridgwater, 2011; Crombie and Mašek, 2014; Charis et al., 2019). However, it is necessary to allow a good inventory of char to accumulate first and give room for contingencies and inefficiencies. The detail on the kind of combustor and its heat efficiency would have to be provided in future studies as the project pilot is launched, beyond this preliminary study. The pumping power for circulating the coolant is not accounted for at this stage.
The rest of the gaseous components pass through condensers 1–3 where the dry bio-oil is recovered in the first condenser, a semi-dry oil in the second and water + little oil mixture in the third. The UNIFAC thermodynamic package was selected to carry out vapor/liquid/solid simulation, which estimates activity coefficients more accurately for a wider range of molecule sizes.
Optimization Studies on Condensation System
The sensitivity of the total flow rate and purity of oil to the variation of the primary condenser temperature was tested from 80° to 120°C. The overall stream mass flow rate and its water composition were the primary parameters used as indicators of the quantity and quality of bio-oil respectively. Higher stream flow rates implied higher yields, while high water compositions denoted a low quality of oil (low HHV). The aim was to strike a good tradeoff between these two. The acid composition was also used as a secondary indicator of the quality of oil, a higher content denoting low, undesirable pH.
After obtaining an optimum range for the primary condenser, it was fixed at the least value in the range (96°C) while the secondary condenser was varied from 60°–100°C to find the optimal operation point. When this optimal point was found, a separate sensitivity study was carried out to determine how the stream yield and composition from the secondary condenser would respond to a variation of the primary condenser temperature from 80° to 120°C.
Results and Analysis
The results of the sensitivity studies on temperature variations are presented first, so that the mass and energy balances, flow stream quantities and compositions are based on the optimum parameters.
Optimal Primary and Secondary Condenser Temperatures
The result of varying temperature in the primary condenser is shown in Figure 3. Hexadecane and Cresol flow rates are not shown since the platform for the sensitivity analysis only allowed a limited number of components.
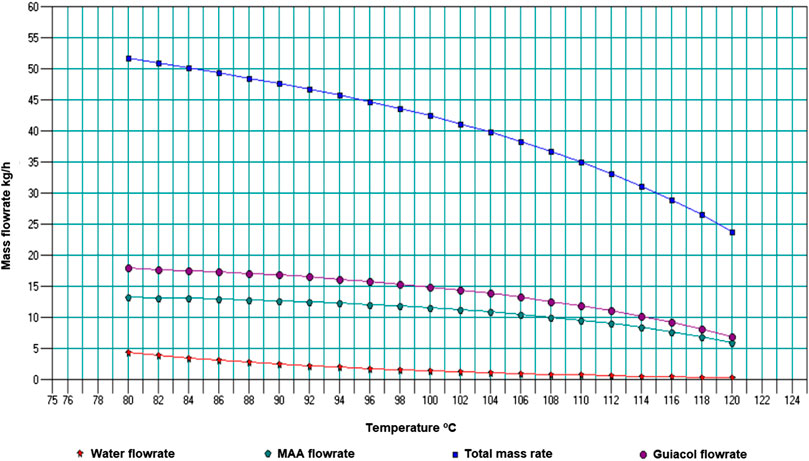
FIGURE 3. Product component flow rates from primary condenser with temperature variation.
The water content in the primary condenser oil is higher at lower temperatures (maximum ∼9.4 wt% at 80°C) and reduces with increase in temperature. However, since the objective was to recover most of the dry oil at the primary condenser, it was critical to choose a point with a good yield quantity and acceptable quality of the oil. A temperature point of 96°C was selected as an optimum, producing bio-oil with water content around 4.4 wt%. A lower water composition, such as 2.4 wt% at a temperature of 102°C could be opted for. Those preferences will, however, depend on the quality of oil that can be used efficiently by the HFO generator. The final range of temperature is discussed later, by also considering the yield and quality of oil that will be obtained from the secondary condenser.
Figure 4 shows the variation of total product flow and flow rates of selected components (including water) with temperature for the secondary condenser, with primary condenser fixed at 96°C.
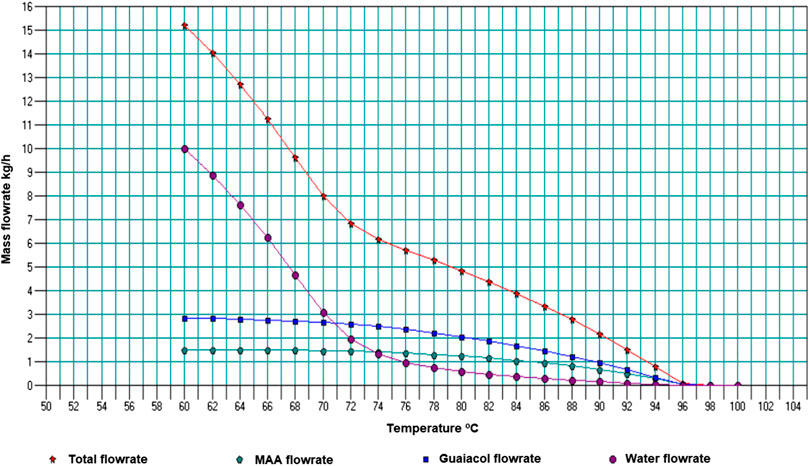
FIGURE 4. Product component flow rates with variation of secondary condenser temperature.
From this analysis temperature of 82°C was selected, with a water content of 7.5 wt% and total flow rate of 4.38 kg/h, giving a total flow rate for the two condensers of ∼49 kg/h. Papari and Hawboldt (2018) discussed pine bio-oil samples which had a water composition of 2.5 and 7.35 wt% and HHVs of 24 MJ/kg and 23.5 MJ/kg respectively; indicating minor variations of the HHV. Therefore, the water content of 7.5 wt% is expected not to significantly vary the HHV. Figure 4 also shows that below a temperature of 78°C in the secondary condenser, higher water compositions (>13 wt%) are obtained. This was reflected in the actual pyrolysis system, where the second and third condensers were all at 25°C; with high total flow recoveries, but high percentage compositions of water as well.
Figure 5 shows the results from the separate sensitivity study to determine how the stream yield and composition from the secondary condenser would respond to a variation of the primary condenser temperature.
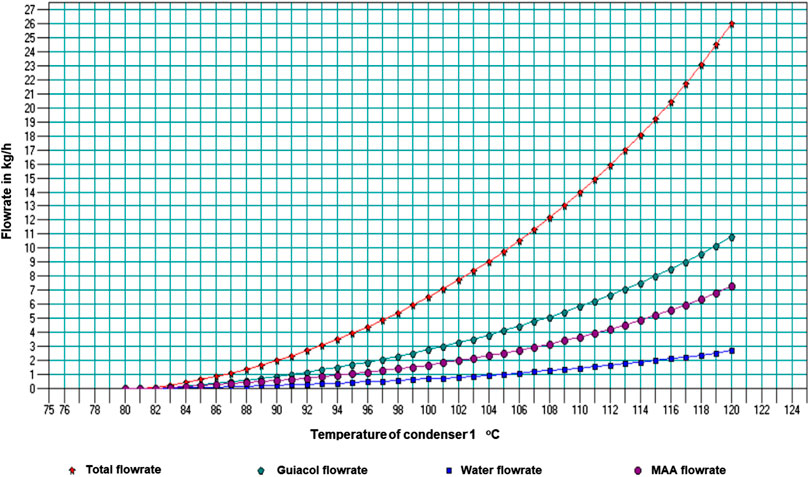
FIGURE 5. Stream yield and composition from the secondary condenser with variation of the primary condenser temperature.
From this graph, a range of water composition from 7.5 to 10 wt% can be obtained in condenser 2 at 82°C, when condenser 1 is kept between 96°C and 110°C. The recommended outlet vapor temperature by Charis et al. (2020b) was 110°C for the primary condenser, which gave the pine bio-oil with the highest HHV. This resonates well with the simulation results.
Model Validation
Before presenting the rest of the simulation results, the optimization results were analyzed to validate the model. The actual pyrolysis runs with all the conditions stipulated in the simulation could not be performed without modifying the existing equipment, therefore experimental validation was not possible. There was also no similar simulation study of a biomass pyrolysis system for comparative assessment of the results. However, there has been a good number of staged condensation experimental studies for fast pyrolysis conditions, which have published the sensitivity of key performance indicators to the variation of mostly the first and secondary condenser temperatures. The key performance indicators were the yield (quantity) of the obtained product stream and its water composition (quality). The results of these studies were compared to literary findings as presented in Table 3.
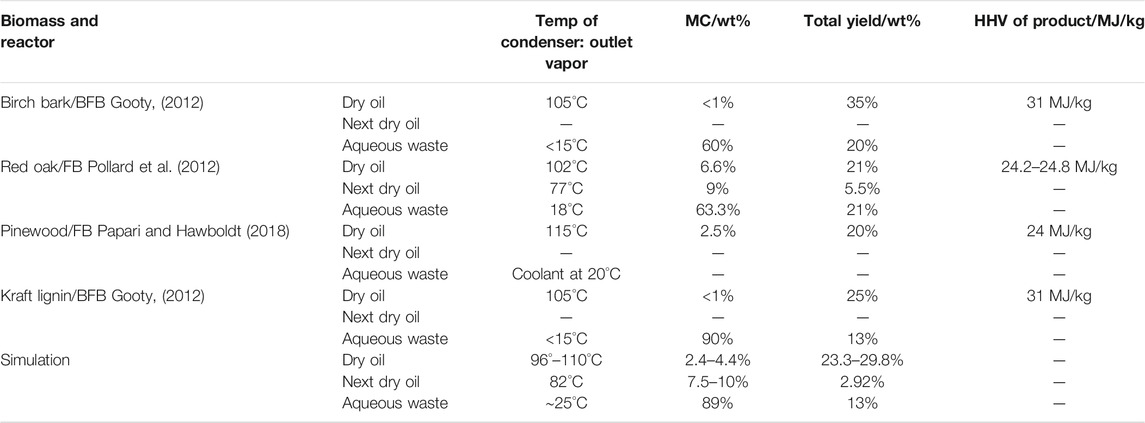
TABLE 3. Comparison of simulation results to literary cases of staged fraction condensations.
The sensitivity analysis indicated that the primary condenser should be operated within a range of 96°–110°C. The secondary condenser should be maintained at 82°C, while the third is maintained at 25°C or ambient conditions. Meanwhile, the primary condensers in the cited literature used temperatures in the range 102°–115°C, obtaining dry oil with <1–6 wt% water. The recommended temperature range between 96°–110°C under this present study produced a dry oil of 2.4–4.4 wt% water content. Pollard et al. (2012)‘s results on red oak pyrolysis, whose second condenser dry oil had a water composition of 9 wt%, are consistent to the simulation findings under this study whose secondary condenser bio-oil had 7.5–10 wt% water content for the primary condenser temperature range of between 96° and 100°C. Therefore model results can be trusted as they are consistent with findings from other studies in literature.
Flows Streams, Mass and Energy Balances
The overall energy and mass balances of the process at the optimal operating parameters are given in Table 4. Table 5 shows the properties of all the flow streams according to the simulation.
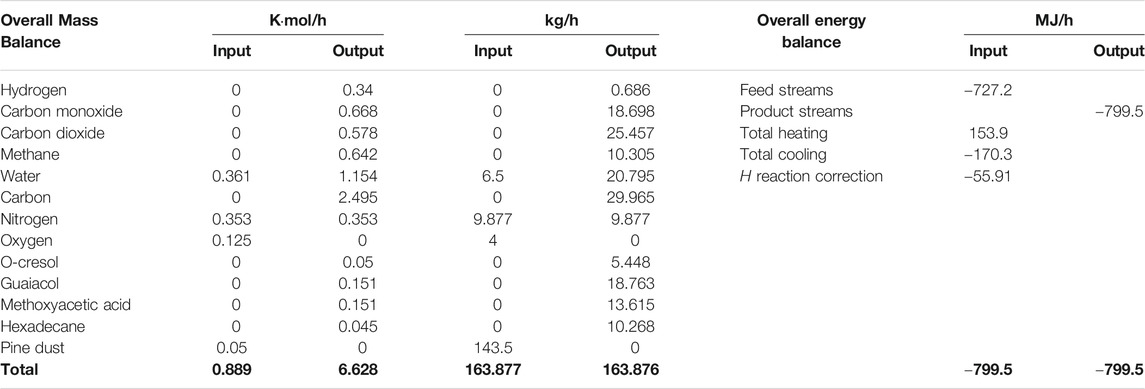
TABLE 4. Overall energy and mass balances of the process.
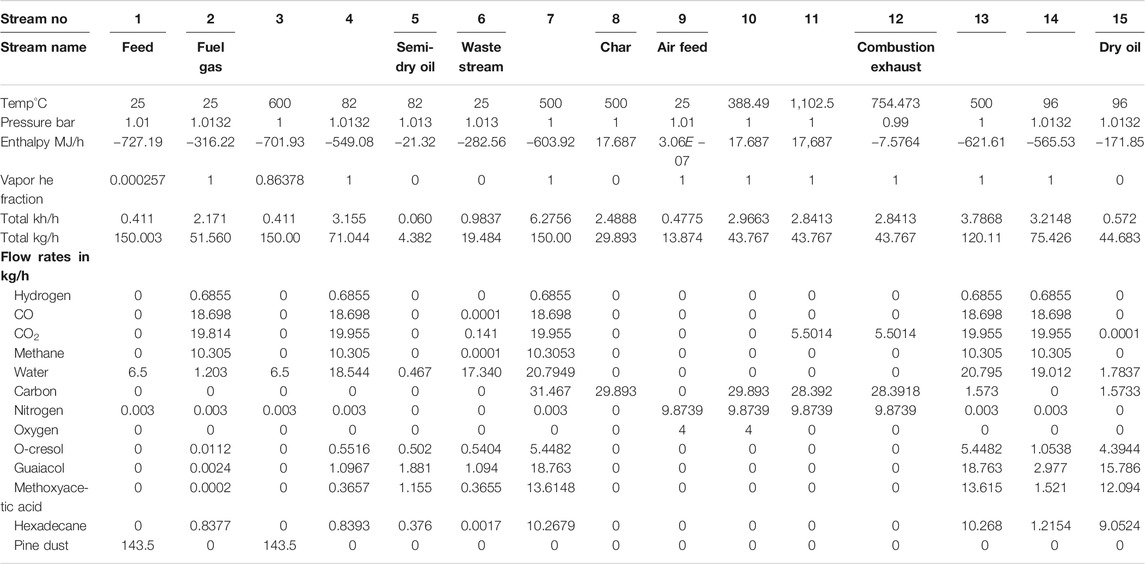
TABLE 5. Properties of all flow streams (from Excel).
Table 4 shows that the pine dust (143.5 kg/h) is completely decomposed to new compounds including additional water (14.3 kg/h), non-condensable gases (55.15 kg/h), condensable organics (48.09 kg/h) and a residual char (26.97 kg/h). The nitrogen is inert, helping with the transportation of biomass, therefore it does not get consumed. The model assumes no losses or leakages from other places apart from the designated outlets.
Table 5 shows that temperature depended properties such as enthalpy have the widest variations. The mainstream from the inlet (stream 1) to the main outlet (stream 2-pyrolysis exhaust) assumes four temperatures: 25°, 600°, 500° and goes back to 25°C after passing through the condensers. The side product streams adopt the temperature used in the adjacent condensers. The pressure is almost constant throughout the process, at the atmospheric level. The combustion of char actually generates a very hot stream (1,102.5°C) which is used to preheat the biomass to the pyrolysis temperature giving an exhaust flue gas at 754.47°C.
A Preliminary Economic Analysis
In order to assess the economic feasibility of having such a productivity and yield of bio-oil, a preliminary economic calculation was done. It factors in all the major costs of harvesting, beneficiating and transporting the biomass and the power requirements for initiating the pyrolysis. Table 6 shows the calculations for the cost of producing 1 L of bio-oil using the model.

TABLE 6. A preliminary cost analysis for the production of bio-oil within the local context.
The calculations show that the cost of producing bio-oil will be around $0.10/L compared to a standard selling price of ∼$0.36/L of bio-oil (Kass, 2019b). In the future, the economic analysis will have to extend to include actual power production to find the cost of producing electricity using the bio-oil or its blends with HFO. HFO sells at ∼$0.45/L and is used in the marine and power generation industry. It is reasonably assumed that, since HFO is already very competitive as a fuel for power generation against diesel and coal, substituting it with cheaper bio-oil would reduce the cost of producing electricity even further (Kass, 2019b). This analysis therefore shows that the recovered fraction of oil gives a competitive cost of production.
Overall Discussion
This work presents a way to simplify the simulation and optimization of a staged condensation system within a biomass pyrolysis unit. Due to the current limitation of modeling a temperature-dependent yield, separate simulations can be done for the other temperatures and biomasses by specifying the yields and relative compositions of the components obtained. The methodology demonstrated in this article can then be used to determine the optimal condenser temperatures. The brute chemical formula, yield and stoichiometry for any new biomass species have to be defined using the recommended procedure, however, the process flow and methodology for optimizing the condenser temperatures would be the same. As such, the process flow template is reproducible for any other biomass pyrolysis system.
Several authors such as Kabir et al. (2015); Krzywda and Wrzesińska (2020); Miccio (2015); Onarheim et al. (2015); Humbird et al. (2016) have attempted modeling biomass fast pyrolysis (FP), which is a challenging task due to the complexity of such systems. This is due to the variability and heterogeneous nature of biomass feedstocks which makes it difficult to model the input streams, reaction kinetics and potentially more than a thousand species that could be produced from permutations of such a system. When one tries to factor in the effect of process variables such as temperature and feedstock particle size to such a system, many outcomes are possible (Humbird et al., 2016). This explains why predictive models using reaction kinetics are rarely applied in overall process simulations. There are a few kinetic FP kinetic models since these are difficult to derive from first principles given the factors mentioned. Consequently, most large process simulations employed for techno-economic analysis avoid the kinetics in modeling reactors and commonly specify the product yields. Onarheim et al. (2015) echoed these views, adding that the reaction mechanisms for the FP of wood are still poorly understood. They used RYield block in Aspen which performs calculations on the output streams and conditions based on the yield specifications. Their FP model was a general representation for lignocellulosic biomass, therefore, they used several sources in specifying yields, feedstock and product characteristics. However, the variability of biomass characteristics means that the model was not accurate for some biomass. Several authors such as Kabir et al. (2015); Lestinsky and Palit (2016) ; Jaroenkhasemmeesuk et al. (2020) used the RYield in combination with a RGibbs reactor, which is useful when the reaction kinetics and stoichiometry are not known. The RGibbs reactor minimizes the Gibbs free energy for the products from the RYield reactor. However, the Gibbs reactor requires many equations and well-defined compounds and their properties to increase reliability (Jaroenkhasemmeesuk et al. 2020). It is important to note that ChemCAD does not have a yield reactor like Aspen, however, it does have a Gibbs reactor. A good model should factor in temperature dependence in both the yield and Gibbs reactor and in some cases, authors used the yield reactor alone (Onarheim et al. 2015). Modeling the temperature dependence of the pyrolysis into a Gibbs reactor alone is not easy, especially for biomass compounds such as pine dust whose properties are not fully characterized. However, this was not to be a problem as the main focus was to optimize the condensation system. This could still be done for a fixed optimum pyrolysis temperature with known yields and relative compound compositions, obtained from experimental results.
This stoichiometric model used in this simulation is better than that which was used by Freda et al. (2011), who represented bio-oil as propanol in Eq. 3. They also had other equations including the reformation of methane (Eq. 2).
The model suited their application since they were targeting to use the “bio-oil” as an energy source to sustain the pyrolysis and propanol’s HHV matches that of bio-oil. However, using propanol as a model compound for the bio-oil presents problems for the staged condensation process because it has a lower boiling point, therefore lower dew point than water. This means that water condenses first, which is the reverse of the actual process in the fractional condensation.
The energy recovery feature from the char by-product is useful and the fuel gas can also be channelled into the reactor for co-combustion. ChemCAD shows the theoretical possibility of recovering heat from the char. In practice, it will be important to use an efficient design for the heat exchanger compatible with the particular reactor to be used. The heat can be transferred through a jacket around the reactor or directly by introducing the hot gases into the reactor. The choice of method has to be done by considering the advantages and disadvantages of each. In the unlikely event that the char energy falls short of the energy requirements, the fuel gas can also be fed into the combustor.
As mentioned in the introduction, the target use of the high-quality oil is in HFO marine engines or power generators. The use of bio-oil to substitute HFO as a maritime fuel is a partly proven application that has received attention due to its great potential (Kass, 2019a). Power generation would be a better priority application in the Southern African region due to the energy poverty in the region, with most countries below 50% electrification (Blimpo and Cosgrove-Davies, 2019). The compatibility of bio-oil with HFO has been tested at up to 25 wt% blend ratios and found to lower the overall viscosity of the mixture, reducing pumping and heating energy requirements (Kass, 2019a). If bio-oils with better fuel properties such as heating value, viscosity flash point can be obtained, blending ratios could be increased in favor of the bio-oil and there could be a possibility of substituting the HFO entirely. Blending with bio-oil would also lower the sulphur and carbon black emissions from HFO, which is facing stiffer regulatory controls due to these two pollutants.
Conclusion
The possibility of running an energy self-sufficient FP process with a total yield of at least one-third of the feedstock weight was explored and proven in this study. More importantly, the study showed the optimum parameters that can be used to recover high quantity quality of dry oil fractions in the first two condensers. For the throughput used in the simulation, for instance, it is possible to recover 49 kg/h (∼40 L/h for specific gravity 1.2) of good quality oil ready for use in the fuel oil generators. The plant can then be operated at a stipulated number of hours per day that meets the required fuel ration for powering the generator for the small power grid. Although it is even possible to obtain MCs below 1 wt% at higher condenser temperatures, there has to be a good trade-off between quantity and quality of the oil obtained. It would be important to experiment, in the long run, on the effects of MCs of up to 10 wt% in the fuel oil generator and the maximum MC threshold for sustainable operability. On the other hand, the stability indexes of the oils at these MC levels also need to be established to determine the shelf life of the bio-oil before use and the necessary amounts of stabilizers (e.g., propanol) that can be added. With all these issues addressed, there is a good case for power generation using moderately upgraded bio-oil from biomass pyrolysis with staged condensation.
Conflict of Interest
The authors declare that the research was conducted in the absence of any commercial or financial relationships that could be construed as a potential conflict of interest.
Data Availability Statement
The original contributions presented in the study are included in the article/Supplementary Material, further inquiries can be directed to the corresponding author.
Author Contributions
GC, the main author conceptualized the paper and simulation model. He also wrote the article. TN checked on the technical soundness and structuring of the paper. GD and EM took part in the supervision, review and revision process.
Acknowledgments
We acknowledge the assistance of Arpad Imre and Leticia Petrescu from the University of Babes Bolyai for the useful insights shared during lectures around modeling and design using Chemical engineering simulation software. We also acknowledge Botswana International University of Science and Technology and the University of Johannesburg for all the support they have offered for this research work.
References
Álvarez-Álvarez, P., Pizarro, C., Barrio-Anta, M., Cámara-Obregón, A., María Bueno, J. L., Álvarez, A., et al. (2018). Evaluation of tree species for biomass energy production in northwest Spain. Forests 9 (4), 1–15. doi:10.3390/f9040160
Bashir, M., Yu, X., Hassan, M., and Makkawi, Y. (2017). Modeling and performance analysis of biomass fast pyrolysis in a solar-thermal reactor. ACS Sustain. Chem. Eng. 5 (5), 3795–3807. doi:10.1021/acssuschemeng.6b02806
Blimpo, M. P., and Cosgrove-Davies, M. (2019). Electricity access in Sub-Saharan Africa: uptake, reliability, and complementary factors for economic impact. Washington, DC: The World Bank.
Bridgwater, A. V. (2011). Review of fast pyrolysis of biomass and product upgrading. Biomass Bioenergy 38, 68–94. doi:10.1016/j.biombioe.2011.01.048
Bridgwater, T. (2018). Challenges and opportunities in fast pyrolysis of biomass: Part I. Johnson Matthey Technol. Rev. 62 (1), 118–130. doi:10.1595/205651318x696693
Carrasco, J. L., Gunukula, S., Boateng, A. A., Mullen, C. A., DeSisto, W. J., and Wheeler, M. C. (2017). Pyrolysis of forest residues: an approach to techno-economics for bio-fuel production. Fuel. 193, 477–484. doi:10.1016/j.fuel.2016.12.063
Charis, G., Danha, G., and Muzenda, E. (2018). “The socio-economic implication of 2nd generation biofuels in southern Africa : a critical review,” In Proceedings of the international conference on industrial engineering and operations management, Paris, France, July 26–27, 2018 (Paris, France: IEOM), 1373–1385.
Charis, G., Danha, G., Muzenda, E., and Nkosi, N. P. (2019). “Bio-Oil from pine residues-yields, quality and potential applications A case study on the valorization of Zimbabwe’s timber residues,” Proceedings of 2019 7th international renewable and sustainable energy conference, Agadir, Morocco, November 27–30, 2019 (Morocco: IRSEC). doi:10.1109/irsec48032.2019.9078324
Charis, G., Danha, G., and Muzenda, E. (2020a). Characterizations of biomasses for subsequent thermochemical conversion: a comparative study of pine sawdust and Acacia tortilis. Processes 8 (5), 546. doi:10.3390/pr8050546
Charis, G., Danha, G., and Muzenda, E. (2020b). Optimizing yield and quality of bio-oil: a comparative study of Acacia tortilis and pine dust. Processes 8 (5), 551. doi:10.3390/pr8050551
Crombie, K., and Mašek, O. (2014). Investigating the potential for a self-sustaining slow pyrolysis system under varying operating conditions. Bioresour. Technol. 162, 148–156. doi:10.1016/j.biortech.2014.03.134
Freda, C., Braccio, G., and Sharma, V. K. (2011). Simulation of olive pits pyrolysis in a rotary kiln plant. Therm. Sci. 15 (1), 145–158. doi:10.2298/tsci090901073b
Guedes, R. E., Luna, A. S., and Torres, A. R. (2018). Operating parameters for bio-oil production in biomass pyrolysis: a review. J. Anal. Appl. Pyrol. 129, 134–149. doi:10.1016/j.jaap.2017.11.019
Humbird, D., Trendewicz, A., Braun, R., and Dutta, A. (2016). One-dimensional biomass fast pyrolysis model with reaction kinetics integrated in an aspen plus biorefinery process model. ACS Sustainable Chem. Eng. 5 (3), 2463–2470. doi:10.1021/acssuschemeng.6b02809
Jaroenkhasemmeesuk, C., Tippayawong, N., Ingham, D. B., and Pourkashanian, M. (2020). Process modelling and simulation of fast pyrolysis plant of lignocellulosic biomass using improved chemical kinetics in aspen Plus®. Chemical Engineering Transactions 78, 73–78. doi:10.3303/CET2078013
Kabir, M., Chowdhury, A., and Rasul, M. (2015). Pyrolysis of municipal green waste: a modelling, simulation and experimental analysis. Energies 8 (8), 7522–7541. doi:10.3390/en8087522
Kass, M., Abdullah, Z., Biddy, M., Drennan, C., Hawkins, T., Jones, S., et al. (2018). Understanding the opportunities of biofuels for marine shipping. Oak Ridge, TN: Oak Ridge National Laboratory, 26.
Kass, M. (2019a). Evaluation of bio-oils for use in marine engines. Oak Ridge, TN: Oak Ridge National Laboratory.
Kass, M. (2019b). Evaluation of bio-oils for use in marine engines. 3.5.5.1. Oak Ridge, TN: Oak Ridge National Laboratory.
Krzywda, R., and Wrzesińska, B. (2020). Simulation of the condensation and fractionation unit in waste plastics pyrolysis plant. Waste and Biomass Valorization 10, 1–14. doi:10.1007/s12649-020-00994-7
Lestinsky, P., and Palit, A. (2016). Wood pyrolysis using aspen plus simulation and industrially applicable model. GeoScience Engineering 62 (1), 11–16. doi:10.1515/gse-2016-0003
Liu, C., Wang, H., Karim, A.M., Sun, J., and Wang, Y. (2014). Catalytic fast pyrolysis of lignocellulosic biomass. Chem. Soc. Rev. 43 (22), 7594–7623. doi:10.1039/c3cs60414d
Lu, Y., Li, G. S., Lu, Y. C., Fan, X., and Wei, X. Y. (2017). Analytical strategies involved in the detailed componential characterization of biooil produced from lignocellulosic biomass. Int. J. Anal. Chem. 2017, 1–19. doi:10.1155/2017/9298523
Miccio, M. (2015). An aspen plus® tool for simulation of lignocellulosic biomass pyrolysis via equilibrium and ranking of the main process variables. Int. J. Math. Models Methods Appl. Sci. 9:71–86.
Naik, S., Goud, V. V., Rout, P. K., Jacobson, K., and Dalai, A. K. (2010). Characterization of Canadian biomass for alternative renewable biofuel. Renew. Energy 35 (8), 1624–1631. doi:10.1016/j.renene.2009.08.033
Onarheim, K., Solantausta, Y., and Lehto, J. (2015). Process simulation development of fast pyrolysis of wood using aspen plus. Energy Fuels 29 (1), 205–217. doi:10.1021/ef502023y
Papari, S., and Hawboldt, K. (2018). A review on condensing system for biomass pyrolysis process. Fuel Process. Technol. 180, 1–13. doi:10.1016/j.fuproc.2018.08.001
Pollard, A. S., Rover, M. R., and Brown, R. C. (2012). Characterization of bio-oil recovered as stage fractions with unique chemical and physical properties. J. Anal. Appl. Pyrol. 93, 129–138. doi:10.1016/j.jaap.2011.10.007
Reza, S., Ahmed, A., Caesarendra, W., Abu Bakar, M. S., Shams, S., Saidur, R., et al. (2019). Acacia holosericea : an invasive species for bio-char, bio-oil , and biogas production. Bioengineering 6 (2), 33. doi:10.3390/bioengineering6020033
Shemfe, M. B., Gu, S., and Ranganathan., P. (2015). Techno-economic performance analysis of biofuel production and miniature electric power generation from biomass fast pyrolysis and bio-oil upgrading. Fuel. 143, 361–372. doi:10.1016/j.fuel.2014.11.078
Simpson, W. T. (1999). General technical report FPL; GTR-113. “Chapter 12 drying and control of moisture content and dimensional changes.” Wood Handbook—Wood as an Engineering Material. (Madison, WI: USDA Forest Service, Forest Products Laboratory, 12.1–12.20, 463.
Keywords: biomass, model, optimization, pyrolysis, staged condensation
Citation: Charis G, Danha G, Muzenda E and Nhubu T (2021) Modeling a Sustainable, Self-Energized Pine Dust Pyrolysis System With Staged Condensation for Optimal Recovery of Bio-Oil. Front. Energy Res. 8:594073. doi: 10.3389/fenrg.2020.594073
Received: 12 August 2020; Accepted: 16 December 2020;
Published: 04 February 2021.
Edited by:
Dinh Duc Nguyen, Kyonggi University, South KoreaReviewed by:
Khursheed Badruddin Ansari, Aligarh Muslim University, IndiaAbd El-Fatah Abomohra, Chengdu University, China
Copyright © 2021 Charis, Danha, Muzenda and Nhubu. This is an open-access article distributed under the terms of the Creative Commons Attribution License (CC BY). The use, distribution or reproduction in other forums is permitted, provided the original author(s) and the copyright owner(s) are credited and that the original publication in this journal is cited, in accordance with accepted academic practice. No use, distribution or reproduction is permitted which does not comply with these terms.
*Correspondence: Gratitude Charis, Z3JhdGl0dWRlLmNoYXJpc0BzdHVkZW50bWFpbC5iaXVzdC5hYy5idw==