 Claire Beurey1*
 Bruno Gozlan1
 Martine Carré1
 Thomas Bacquart2Abigail Morris2Niamh Moore2
 Karine Arrhenius3
 Heleen Meuzelaar4
 Stefan Persijn4Andrés Rojo5Arul Murugan2
- 1Innovation Campus Paris, Air Liquide, Les Loges en Josas, France
- 2National Physical Laboratory, London, United Kingdom
- 3Research Institutes of Sweden (RISE), Borås, Sweden
- 4VSL, Delft, Netherlands
- 5Centro Español de Metrología, Tres Cantos, Spain
Gaseous hydrogen for fuel cell electric vehicles must meet quality standards such as ISO 14687:2019 which contains maximal control thresholds for several impurities which could damage the fuel cells or the infrastructure. A review of analytical techniques for impurities analysis has already been carried out by Murugan et al. in 2014. Similarly, this document intends to review the sampling of hydrogen and the available analytical methods, together with a survey of laboratories performing the analysis of hydrogen about the techniques being used. Most impurities are addressed, however some of them are challenging, especially the halogenated compounds since only some halogenated compounds are covered, not all of them. The analysis of impurities following ISO 14687:2019 remains expensive and complex, enhancing the need for further research in this area. Novel and promising analyzers have been developed which need to be validated according to ISO 21087:2019 requirements.
Introduction
Fuel cell electric vehicles (FCEV) together with electric vehicles are a more eco friendly alternative to the current vehicles with combustion engines. The momentum of FCEV is rising, with a development of more than 350 hydrogen refueling stations (HRS) worldwide. In 2020, the three main areas are Europe with 130 open stations in February 2020 (H2.LIVE: Hydrogen Stations in Germany & Europe, 2018), the USA with 48 open stations, mainly in California (US Department of Energy–Energy Efficiency and Renewable Energy, 2020) and Asia with 178 stations, mainly in Japan, South Korea and China (FuelCellsWorks 2020). Automotive manufacturers (i.e. Toyota, Hyundai et al.) increase the number of FCEVs manufactured each year (Toyota increases from 3,000 in 2017 to 30,000 FCEVs equivalent by 2020s (Toyota Europe, 2018) or Hyundai increases to 500,000 by 2030 (Hyundai 2018)). Moreover, new applications arise in heavy duty FCEV with Hyundai offering FCEV trucks to European, USA and Asian markets (i.e. 1,600 Hyundai FCEVs in Switzerland by 2025 (Hyundai 2019)).
The development of heavy-duty applications, extension of passenger car FCEVs will require the HRS infrastructure to provide hydrogen fuel quality compliant with the end user expectations and the automotive manufacturers requirements. The quality of hydrogen delivered by an HRS is crucial since several impurities may impact the performance and lifetime of the proton exchange membranes (PEM) in FCEVs and the whole FCEVs infrastructure. For example, trace amounts of several impurities such as carbon monoxide or hydrogen sulfide severely poison PEMs. Adsorption by carbon monoxide instead of hydrogen on platinum catalyst of PEM is reversible whereas poisoning of catalyst by hydrogen sulfide is irreversible (Jacques et al., 2014; Cheng et al. 2007). Other impurities, such as helium, only dilutes hydrogen. The presence of impurities in hydrogen fuel depends on the production process. Carbon monoxide can be found in hydrogen coming from steam methane reforming process whereas oxygen can be found in hydrogen coming from chlor-alkali or water electrolysis processes. A risk assessment has been performed in 2018 to determine the probability of occurrence of impurities in hydrogen fuel (Bacquart, Murugan, et al. 2018).
Thus normative bodies have issued quality standards for hydrogen at the dispenser nozzle, including the international standard ISO 14687, updated in 2019, giving maximal specifications for hydrogen quality for road vehicles (ISO/TC 197, 2019), detailed in Table 1. An European standard, EN 17124, has been approved in 2018 (CEN/TC 268, 2018), with the same maximal levels of impurities as in ISO 14687. SAE, an international association issuing standards for mobility, has also developed a standard for hydrogen for FCEVs, applicable in the USA. It has been updated in 2020, also with the same maximal levels of impurities than in ISO 14687 (SAE Fuel Cell Standards Committee, 2020). According to the European Alternative Fuels Infrastructure Directive (AFID) 2014/94/EU (European Union 2014) there is a requirement in Europe for hydrogen supplied to FCEV to be of a suitable quality corresponding to EN 17124 (CEN/TC 268, 2018). Regulations are enforced in Europe to ensure hydrogen quality for FCEV and level of contaminants in hydrogen fuel. It became a requirement for hydrogen producers or suppliers to ensure and demonstrate the quality of hydrogen fuel.
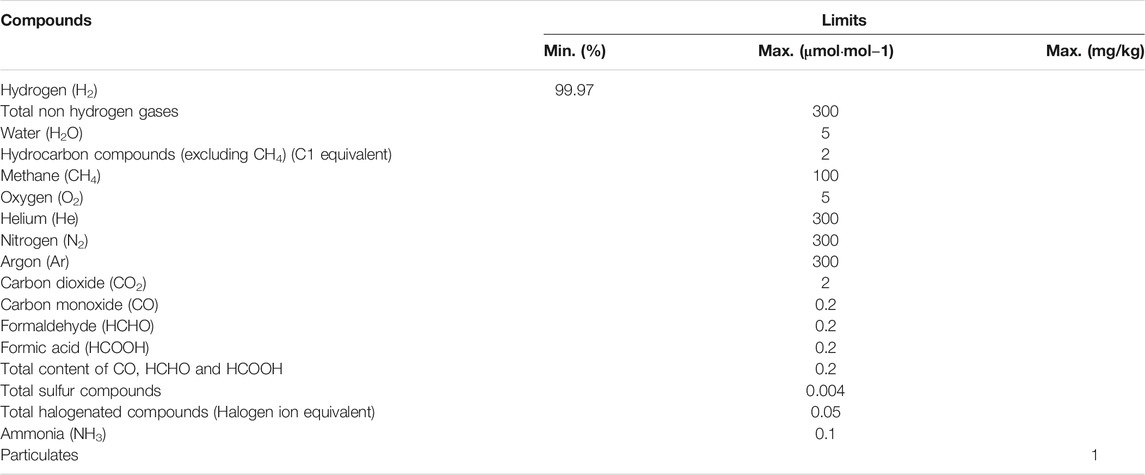
TABLE 1. Hydrogen quality requirements specified in ISO 14687:2019, EN 17124 and SAE J2719 standards (ISO/TC 197 2019) (CEN/TC 268 2018) (SAE Fuel Cell Standards Committee, 2020).
A quality insurance system has to be developed in order to assess the compliance of hydrogen fuel delivered by the HRS to ISO 14687:2019, EN 17124, or SAE J2719 when commissioning an HRS, in operation and/or in case of a customer complaint. It involves the development of sampling systems at the nozzle and of analytical methods suitable to the low levels of impurities specified in ISO 14687:2019 and validated following ISO 21087, a standard which has been issued in 2019, specifying the minimum requirements of method validation for hydrogen purity analysis with criteria on detection limit, working range, trueness, precision, uncertainty, etc. For example, the quantification limit of a method with its uncertainty must be below the control threshold (ISO/TC 158 Analysis of Gases, 2019). As any emerging sector, it is important to evaluate the current state of the art of analytical methods suitable to hydrogen quality and evaluate the gap between the current knowledge and the policy requirements.
In 2014, Murugan and Brown published the first review of hydrogen purity analytical methods based on the literature review and on in-house methods developed by National Physical Laboratory (Murugan and Brown, 2015), followed by a review by Haloua et al. (Haloua et al. 2018). Recently, a significant number of new methods for performing hydrogen purity analysis (D03 Committee, 2019d; D03 Committee 2015a; Arrhenius, 2020; Ap2e, n.d.; D03 Committee, 2018b; ION-GAS 2020) were developed to comply with the new standards ISO 14687, EN17124 and SAE J2719. A number of hydrogen purity methods have also been developed and validated by European laboratories as part of the European project EMPIR MetroHyVe (Metrology for Hydrogen Vehicles, 2017). It is also useful to review the published analytical methods with the new requirements of ISO 21087:2019.
As defined by Murugan and Brown (Murugan and Brown, 2015), offline methods are those that are used in a laboratory (away from the refueller). In order to perform offline analysis a sample of hydrogen is usually taken from the hydrogen refueller using a sampling vessel and transported directly to the laboratory. In the previous reviews, the sampling was not discussed. In the analysis of hydrogen quality, it is critical to consider the whole analytical sequence that requires a representative sampling point (the refueller nozzle as stated in the international standards), representative sampling, the type sample (gas cylinder), the transport of the samples, the choice of analytical instruments and methods, the quality control of the measurement and the reporting.
This paper will update the reviews presented by Murugan and Brown in 2014 and by Haloua et al. (Haloua et al. 2018) and provide an updated review of all the analytical methods available for hydrogen fuel quality analysis together with a discussion of the sampling. The objective is to provide the state of the art of analytical techniques to perform quality assurance of FCEVs. Moreover, the article will provide feedback on the current analytical methods used by hydrogen purity laboratories. It will highlight the implementation of analytical methods into hydrogen purity laboratories in 2020 with a survey of laboratories performing hydrogen analysis. The review together with the survey results will enable to establish an inventory of current analytical capacities available to perform analysis according to ISO 14687:2019. The review will address only gaseous impurities, the particulates analysis will not be reviewed.
Sampling
The implementation of quality assurance on the new market of hydrogen mobility relies on the capacity of analytical laboratories to perform accurate analyses. To ensure the reliability of the analyses, the sampling step is critical as it determines the sample representativity.
Firstly, as analysis of hydrogen for mobility is offline and performed in a laboratory, the samples have to be stored in a sampling vessel or a cylinder which has to be compliant with local regulations. Double warhead capacities (Swagelok® type) are accepted for sampling but only if there is no transportation on public grounds because of transport regulations (United Nations Economic Commission for Europe, 2018), analysis has to be carried out onsite. Indeed the transport regulations (United Nations Economic Commission for Europe, 2018) require that the storing device meets the regulations for pressure vessels (container and closing valves, pressure tests, material compatibility with hydrogen etc.). These requirements involve the use of cylinders, not sampling vessels.
Transport regulations of dangerous goods (United Nations Economic Commission for Europe, 2018) also require labeling, a transport declaration with documentation (material safety data sheets for example) and over packaging for transportation. All these considerations apply for whole round trips: even cylinders with a small pressure (1 bar relative) have to comply with these regulations. Only packages at atmospheric pressure are not concerned by pressure vessels requirements.
If flexibles are used to connect the cylinders to the station, these flexibles have also to meet regulations: expiration date, maximum working pressure (European Industrial Gases Association AISBL, 2016).
Secondly, cylinders require a traceability system based on cylinders and samplings. Thus, in case of any abnormal result during analysis, it is possible to trace back the used cylinder and any potential event from sampling to analysis. It implies the identification of each cylinder, an operating procedure, technical specification and scheme of examination and maintenance.
Thirdly, cylinders have to be chosen with a suitable surface treatment and qualified to ensure that there is no retaining of impurities, for example by adsorption of sulphur compounds. Several types of metal cylinders are used involving stainless steel with surface coating (i.e. SilcoNert), manganese steel or aluminium (Arrhenius et al., 2018). Thus cylinders may require stability evaluation for compounds to be analyzed. For example, cylinders can be filled with gas standards containing the targeted impurities. The stability study will involve immediate analysis and analysis time coherent with transport time between sampling site and analysis laboratory.
The purging step is also critical to get clean cylinders. In particular, if a sample is out of specifications, the cylinder has to be cleaned to avoid a contamination of the next sample and a false positive. This special cleaning depends on the impurity and its level. The sealing of cylinders has also to be checked periodically.
Finally, the sampling operator has to be trained and qualified, due to the risks associated with the sampling: risks linked with hydrogen (anoxia, inflammability) and with the sampling at 800 bar. Depending on local regulations a work permit can be necessary.
Several systems have been developed (Arrhenius et al., 2018), with two main strategies: parallel or serial sampling. Parallel sampling is performed during a vehicle refueling, whereas serial sampling is performed with the HRS nozzle connected to the sampling system.
Even if sampling is critical for the reliability of the analysis, there are currently no international standards or guidelines on hydrogen sampling at the nozzle of the hydrogen refueling station. There is a need of state of the art and harmonization of the hydrogen sampling strategy.
Review of Analytical Methods for Hydrogen Impurity Analysis
The review of the hydrogen contaminants analysis methods aimed at providing an overview of analytical techniques and methods capabilities based on the literature available, including standards published by different bodies (JIS for Japan, ASTM for the US and ISO for Europe and other countries). The review aimed at evaluating the analytical methods available for contaminants analysis in hydrogen fuel and to report critically the state-of-the-art. The methods will be presented in five families: gas chromatography, liquid chromatography, spectroscopic, other and new potential methods.
Gas Chromatography
Gas Chromatography Coupled With Mass Spectrometry
GC-MS is a very classical analytical method which can be used for numerous compounds. The principle of GC-MS is to perform a separation of the different compounds in the matrix by gas chromatography and the identification and quantification using mass spectrometry. The choice of the GC column is critical to separate the compounds based on size (i.e. molecular sieve 5Å column) or polarity (Skoog, West, and Hollar 1992). The detection is done by mass spectrometry which will allow to screen for any mass over charge ratio (scan) or for specific ions or fragments (SIM). It would allow the techniques to be used for a large spectrum of analytes but the instrument configuration may be different to measure formaldehyde or argon (type of column, oven temperature, specific ions or mass scan detection). The instrument is versatile but a method is required for each compound which is the reason why the Japanese standard, JIS K 0123, presents general rules for GC-MS but is not specific to hydrogen matrix or to any contaminant in hydrogen, and cannot be considered as standard method for hydrogen fuel quality (JSA Group, 2018).
Several variants of GC-MS have been tested for hydrogen.
GC-MS
A GC-MS has been tested in electron impact mode by NPL for the measurement of water (m/z = 18), formaldehyde (m/z = 30) and ammonia (m/z = 17) in hydrogen. The analysis was performed in single ion monitoring mode. An advantage is the low sample flowrate, around 20 ml min−1. The limit of detection is 0.8 µmol mol−1 for water, making this method suitable for this impurity. However, for ammonia and formaldehyde, they are respectively 0.5 and 0.2 µmol mol−1, above the specification. They could be lowered with a pre-concentration device (Brown et al., 2011).
GC-MS With Jet Pulse Injection
GC-MS with jet pulse injection is described in ASTM D7649-19 for the measurement of carbon dioxide, argon, nitrogen, oxygen and water in hydrogen. The jet pulse injector is suited to high pressure hydrogen samples as the injected volume is independent from the sample pressure. The gas chromatography uses a DB-5 fused silica column (length 30 m; internal diameter 0.25 μm).
The standard does not provide limits of detection for any compound. However a standard of 5 µmol mol−1 of carbon dioxide, argon, nitrogen and oxygen in hydrogen is used for calibration, and other standards of 2 µmol mol−1 of oxygen in hydrogen, and 5 µmol mol−1 of nitrogen in hydrogen are used to check the detection of oxygen and nitrogen at these levels. Samples down to 3 µmol mol−1 of argon, 3 µmol mol−1 of carbon dioxide, 1 µmol mol−1 of water, 5 µmol mol−1 of nitrogen and 1 µmol mol−1 of oxygen have been analyzed (D03 Committee, 2019d), all below the control thresholds except carbon dioxide.
GC-MS With Pre-concentrator
An ASTM standard D7892-15 describes the use of GC-MS for hydrogen purity analysis. This method can be used for organic halides, non-methane hydrocarbons and formaldehyde with limits of detection below the control threshold (D03 Committee, 2015a).
A draft ASTM standard WK34574 (which is a previous version of the standard D7892-15) describes the use of GC-MS/ELCD with pre-concentrator for the determination of organic halides in hydrogen. In the WK34574, the impurities are trapped in a glass bead trap at −150°C. Then they are transferred, except water, to a Tenax tube by warming to 10°C. This tube is heated at 180°C before impurities enter at −170°C in a GC column with a dimethylpolysiloxane stationary phase (D03 Committee, 2011).
The division of measurement standards of the California Department of Food and Agriculture (CDFA-DMS) has also tested a GC-MS method with cryo pre-concentration at -180°C before the capillary column for thirty halogenated compounds (bromomethane, four freon compounds, and others chlorinated compounds). No detection limit has been calculated, but calibration down to nmol.mol−1 range (2.5–30 nmol mol−1) has been successfully performed (Mough et al., 2014).
Arrhenius et al. (The Research Institute of Sweden, RISE) have tested a GC-MS with a thermo desorption step (TD-GC-MS) to analyze halogenated compounds (exclusive HCl and Cl2). Hydrogen was sampled on a multisorbent, for example the Carbotrap 300. The control threshold is achievable with this method (Arrhenius et al., 2015).
RISE compared several sorbent tubes for trapping hydrocarbons and halogenated hydrocarbons using a TD-GC-MS coupled with a flame ionization detector (FID). The desorption was performed in two steps, with temperatures depending on the tested sorbent tubes. The best sorbent in this study was a three-bed sorbent with Tenax TA, Carbograph 1TD and Carboxen 1003 (Arrhenius et al., 2020). According to (Arrhenius et al., 2015) and (Bacquart et al., 2019), TD-GC-MS/FID has been used by RISE for analysis of heavier hydrocarbons (≥C6).
All these methods cover only some halogenated compounds, not all of them. The use of a separation technique and mass spectrometry detector make total halogenated measurement not achievable by this strategy. It is not possible to ensure the separation and the accurate quantification of all possible halogenated compounds; however, it will provide accurate results for independent and specific halogenated compounds.
For the research on sorbent tubes, for sulfur compounds, a TD-GC-MS with a two-step desorption was used by the Dutch Metrology Institute (VSL) (Arrhenius et al., 2020).
Table 2 gives the detection limits for the ASTM standard, CDFA-DMS, VSL, RISE.
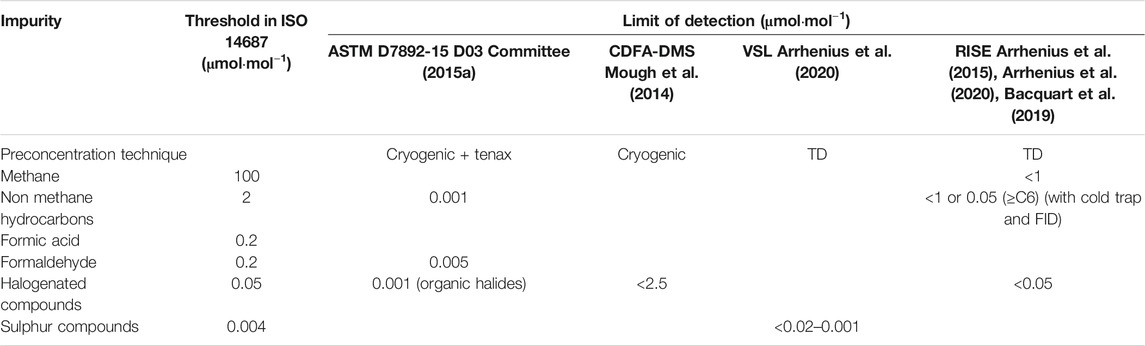
TABLE 2. Detection limit per impurity and preconcentration technique with GC-MS for ASTM D7892-15, CDFA-DMS, VSL and RISE.
Gas Chromatography Coupled With Pulsed Discharge Helium Ionization Detector (GC-PDHID)
The gas chromatograph coupled with a pulsed discharge helium ionization detector (GC-PDHID) relies on the ionization of compounds by a plasma of helium (done by a pulsed DC discharge). It is a method suitable for several compounds, including formaldehyde, nitrogen, argon, oxygen, methane, carbon monoxide and carbon dioxide. In this configuration, the gas chromatography is using size exclusion and the PDHID is a highly sensitive, nondestructive and almost universal detector. The working range is quite linear over five orders of magnitude (VICI, 2015).
CDFA-DMS, the Centro Espanol de Metrologia (CEM) and NPL have included GC-PDHID in their methods for hydrogen purity analysis. Table 3 gives the detection limits of NPL, CEM and CDFA-DMS, per impurity. GC-PDHID is suitable for hydrogen purity analysis according to this table.
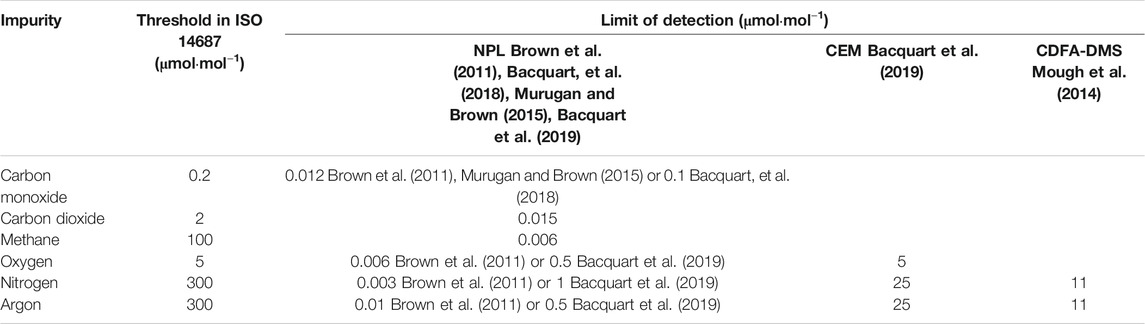
TABLE 3. Detection limit per impurity with GC-PDHID for NPL, CEM and CDFA-DMS.
In NPL, different columns have been used to separate the different impurities (molsieve 5A) (Murugan and Brown, 2015). No details have been provided by the laboratories concerning the separation of argon and oxygen, with the exception of CEM which has indicated that oxygen and argon are not completely separated (Bacquart et al., 2019). Lack of separation between argon and oxygen can be a critical issue in a sample close to ISO 14687 threshold for argon (i.e. 300 µmol mol−1) which could mask a small amount of oxygen whose threshold is 5 µmol mol−1. Ensuring detection capability in this situation is important to avoid oxygen false negative results. In order to improve separation, it is possible to cool the GC to lower than ambient temperature. An alternative to cooling is the use of a suitable column.
Gas Chromatography Coupled With Thermal Conductivity Detector (GC-TCD)
A thermal conductivity detector (TCD) measures the difference of thermal conductivity between the pure carrier gas (usually hydrogen or helium) and the carrier gas with sample compounds with a Wheatstone bridge. The temperature of a filament changes in presence of the sample compounds, leading to a variation of the resistance and of the voltage.
The gas chromatograph coupled with a thermal conductivity detector (GC-TCD) is a method suitable for several compounds, including nitrogen, argon, helium, oxygen, methane, carbon monoxide and carbon dioxide. Almost all these compounds can also be measured with GC-PDHID with lower detection limits. However, the performance of GC-TCD is sufficient for meeting ISO 14687 requirements for most of these compounds. The GC separation may be similar as presented in the GC-PDHID section, however TCD detector is a universal detector with wide linear response (wider than PDHID).
GC-TCD for helium measurement is described in ASTM D1945-14 (natural gas) (D03 Committee, 2019b) and in ASTM D1946-19 (reformed gas) (D03 Committee, 2019a). Sumika Chemical Analysis Service (SCAS), in Japan, uses GC-TCD for measurement of helium, nitrogen and argon in hydrogen. No further information has been found on the methods used by this laboratory (SCAS n.d.). CDFA-DMS, RISE, CEM and NPL have included GC-TCD in their methods for hydrogen purity analysis. Table 4 gives the detection limits of NPL, CEM, RISE and CDFA-DMS for TCD, per impurity.
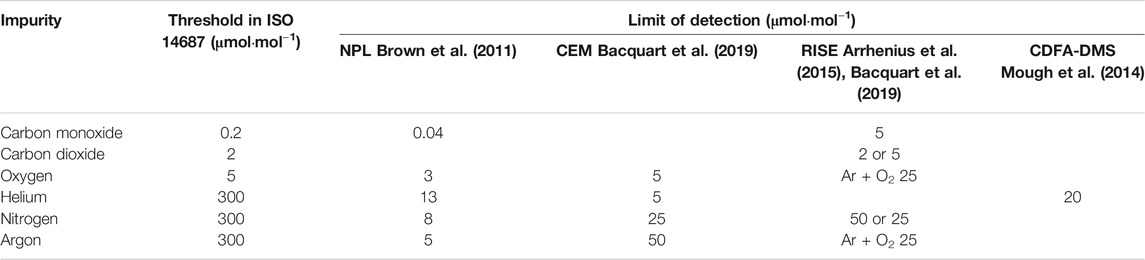
TABLE 4. Detection limit per impurity with GC-TCD for NPL, CEM, CDFA-DMS and RISE.
GC-TCD is suitable for helium, argon and nitrogen analysis in hydrogen fuel according to this table. For carbon monoxide, only NPL meets the criteria of ISO 14687, the detection limit reported by RISE is above the control threshold. The limits of detection for carbon monoxide, carbon dioxide and oxygen of the different laboratories are really close to limits set in ISO 14687 and therefore GC-TCD is not the most suitable method for these contaminants.
In NPL laboratory, a 60 m PLOT MS-5 column has been used to separate argon and oxygen. For helium, argon and hydrogen were the carrier gases. These gases have to be sufficiently pure in order to avoid a false positive (Brown et al., 2011).
RISE has not separated argon from oxygen, the reported result for both molecules is their sum. Oxygen content obtained by another analytical method (for example, OFCEAS, see paragraph Optical Feedback Cavity Enhanced Absorption Spectroscopy) must be subtracted from the result of argon and oxygen to have the argon content (Arrhenius et al., 2020). For nitrogen, the gas has to be sampled from a cylinder, not a gas bag to avoid air contamination according to (Arrhenius et al., 2015). However, in (Bacquart et al., 2019), a system to rinse gas bags with helium is mentioned for the analysis of nitrogen in hydrogen with the same analytical technique.
Gas Chromatography Coupled With Flame Ionization Detector
The flame ionization detector (FID) measures hydrocarbons concentration by using a flame to burn and ionize them. The resulting ions are then collected on an electrode, producing a current proportional to the rate of ionization. It is a sensitive detector with a wide linear range. However, only hydrocarbons can be analyzed, FID is a destructive detector and cannot be used in explosive areas.
Gas Chromatography With Non-retaining Column
Non retaining column is used when no compound separation is required. In this case, the gas column is empty or filled with material that has no separation power (polarity or size). An American standard, ASTM D7675-15, describes the use of a GC coupled with a FID for the measurement of total hydrocarbons in hydrogen, with non-retaining columns. The detection limit is below the control threshold (D03 Committee, 2015b).
Gas Chromatography With Retaining Column for Individual Components
The Japanese standard JIS K 0114 describing GC-FID for total hydrocarbons, for its part, exposes only the general rules for gas chromatography (JSA Group, 2012). The standard is therefore too generic to be considered as a reference method for hydrogen fuel quality.
RISE has also tested a GC-FID method for the analysis of methane and light hydrocarbons from C2 to C5. Heavier hydrocarbons can be analyzed by TD-GC-MS/FID, where MS is used for identification and FID for quantification (Arrhenius et al., 2015) (Bacquart et al., 2019).
Measurement of total hydrocarbons is performed with GC-FID by SCAS without any other information (SCAS, n.d.).
Gas Chromatography With Methaniser and FID Detector
The GC-FID method can be improved by adding a methanizer, enabling the catalytic conversion of any carbon molecule (CO, CO2, hydrocarbons) into methane. The combination of GC with FID allows the detection of all the converted carbonated molecules into methane based on their retention time. The measurement of carbon monoxide and carbon dioxide with total hydrocarbons can be done in a single method.
NPL has tested this method for total hydrocarbons, carbon dioxide and carbon monoxide with detection limits below the control thresholds. Methane and non-methane hydrocarbons are measured separately so their respective results are summed to have the content of total hydrocarbons (Brown et al., 2011; Murugan and Brown, 2015; Bacquart et al., 2019).
NPL applied this method (Bacquart et al., 2018) to quantify formaldehyde at low amount fraction. Even if the detection limit was determined around 80 nmol mol−1, the expanded relative uncertainty was estimated around 23% (k = 2).
CDFA-DMS has developed a method with both GC-FID and methanizer GC-FID: the first is used for total hydrocarbons (without GC) and methane (after HayeSep N column), the second for carbon dioxide and carbon monoxide. Detection limits are below the control threshold except for carbon monoxide, the method was not sensitive enough to meet the criteria (Mough et al., 2014).
Carbon monoxide and carbon dioxide are measured by methanizer GC-FID by SCAS (SCAS, n.d.).
For both methods, GC-FID with or without methanizer, the total hydrocarbon content could be overestimated as the FID response factor is assumed to be proportional to the number of carbon atoms in each molecule (Murugan and Brown, 2015).
Table 5 gives detection limits per impurity with GC-FID, with or without methanizer for ASTM D7675-15, NPL, CDFA-DMS and RISE.
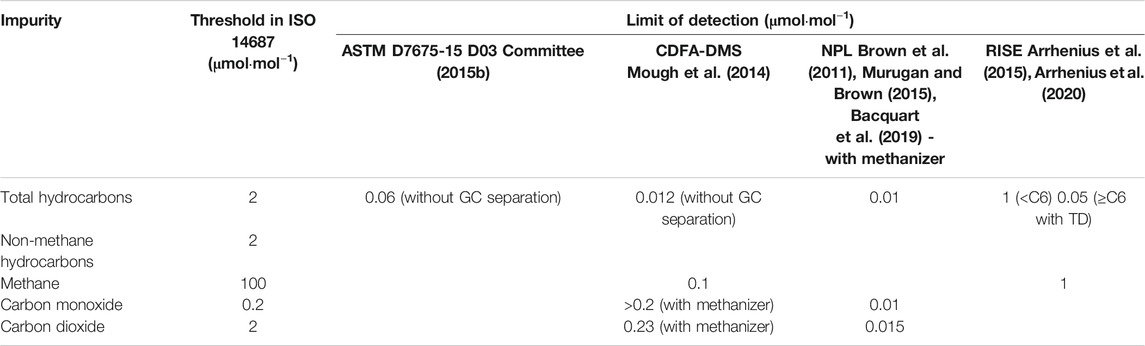
TABLE 5. Detection limit per impurity with GC-FID for ASTM D7675-15, CDFA-DMS, NPL and RISE.
Gas Chromatography Coupled With Electron Capture Detector
An electron capture detector (ECD) relies on a radioactive beta emitter. The beta particles collide with a carrier gas to produce electrons which induce a current. These electrons are absorbed by electronegative compounds such as halogens resulting in a current decrease. It is a very sensitive detector, down to ppt level. However safety constraints and legal requirements apply as it relies on the use of a radioactive source.
An ASTM standard, D7676-18, describes a method comprising a GC coupled with ECD for the analysis of organic halides in hydrogen and other gaseous fuels with a detection limit as low as 0.1 nmol mol−1 This method is only intended to provide a pass/fail test of presence of organic halides, their quantification has not been demonstrated (D03 Committee, 2018a).
GC-ECD was tested by CDFA-DMS for measuring oxygen content in hydrogen: it showed adequate sensitivity but the repeatability was not good enough (Mough et al., 2014).
However, some non-organic halogenated compounds (e.g. Cl2) cannot be measured with GC-ECD. It also suffers from a limited linear range. Thus this method alone is not suitable for the analysis of total halogenated compounds in hydrogen (Brown et al., 2015).
Gas Chromatography Coupled With Electrolytic Conductivity Detector
In an electrolytic conductivity detector (ELCD), a catalytic reactor at 1000°C converts the target compounds in ionizable gaseous molecules which are then dissolved in a solvent. The increase in the electrical conductivity of the solvent is measured and is proportional to the mass of the targeted compound. This detector is sensitive (nmol·mol−1 to μmol·mol−1), with a wide linear range (6 orders of magnitude). Nevertheless, this detector is destructive and not universal.
The ASTM standard WK34574 already quoted in GC-MS part describes also the use of GC coupled with an ELCD, without its reactor, for analyzing some halogenated compounds: hydrogen bromide, hydrogen chloride and chlorine in hydrogen with a limit of detection at 0.001 μmol mol−1, except for hydrogen bromide, 0.01 μmol mol−1. The standard also indicates that the analysis of formic acid and ammonia with this method is possible, with respective detection limits of 0.001 and 0.04 μmol mol−1 (D03 Committee, 2011).
Gas Chromatography Coupled With Flame Photometric Detector
A flame photometric detector (FPD) relies on a flame which decomposes sulphur and phosphorus compounds and ionizes them. The resulting chemiluminescence emission is measured by a photomultiplier tube. As the decomposition product for sulphur compounds is S2, the response is not linear but is proportional to the square of the mass concentration.
GC-FPD is used in combination with cryogenic preconcentration in order to reach low nmol·mol−1 amount fraction. GC-FPD without pre-concentration has not a sufficient limit of detection to be used directly. The advantages of the cryogenic preconcentration is the ability to reach extremely low detection limit however its disadvantage is the selectivity associated. Cryogenic preconcentration may trap differently all the sulphur components making the measurement of total sulphur more complex. Total sulphur can be obtained by summing the results for all the sulphur compounds detected or by ensuring that all sulphur compounds are trapped efficiently.
SCAS mentions the GC-FPD method for measuring sulphur compounds in hydrogen, but without any precision (SCAS, n.d.).
CDFA-DMS has used a GC-FPD method with cryo pre-concentration before the capillary column. The eight different sulphur compounds which have been tested had detection limits between 1.6 and 7.1 nmol mol−1 (Mough et al., 2014).
Gas Chromatography Coupled With Sulphur Chemiluminescence Detection
A sulphur chemiluminescence detector (SCD) burns the sulphur compounds under a reducing atmosphere (with hydrogen). A chemiluminescent reaction between the combustion products (SO) and ozone follows, and the resulting emission is measured by a photomultiplier tube. Contrary to the FPD, the detector response is linear with the mass concentration of sulphur. The SCD is sensitive, down to pg.
A GC-SCD is suitable for analysis of sulphur compounds in hydrogen and other matrices at nmol·mol−1 amount fraction. NPL has used a GC-SCD for measuring sulphur compounds in hydrogen, without preconcentrator. Non-retaining columns have been used. A limit of detection below the control threshold has been reported, 1.4 nmol mol−1 (Downey et al. 2015) or 2 nmol mol−1 (Bacquart et al., 2019).
An ASTM standard, ASTM D7652-11, describes its use for hydrogen with a cryogenic pre-concentrator, enabling a limit of detection at 0.02 nmol mol−1. However, the linearity of the detector was not confirmed (D03 Committee, 2011). The advantages of the cryogenic preconcentration is the ability to reach an extremely low detection limit however its disadvantage is the selectivity associated. Cryogenic preconcentration may trap differently all the sulphur components making the measurement of total sulphur more complex. It can be done by summing all the sulphur compounds detected or by ensuring that all sulphur compounds are trapped efficiently.
Liquid Chromatography
In liquid chromatography (LC), contrary to GC, the mobile phase is liquid, which involves a pre-treatment step to transfer gaseous compounds to liquid phase. This step is critical to ensure an accurate recovery yield of the targeted compounds.
In literature, two types of LC for hydrogen purity analysis have been reported:
• Ionic chromatography (IC)
The column is filled with either cations or anions. With cations, anions in the sample are retained.
• High performance liquid chromatography (HPLC)
The liquid mobile phase is pressurized before entering a column filled with adsorbent material. Thus the sample compounds have different retention times based on their affinity with the adsorbent. The separation is more efficient than in conventional LC.
LC is described in several standards for hydrogen analysis, in particular IC. The Japanese standard JIS K0127 gives only the general rules for ion chromatography (JSA Group, 2013).
Pre-treatment
Pre-treatment is necessary to analyze hydrogen samples with LC. Several methods exist to transform gaseous samples to samples suitable for LC analyzers:
• Bubbling of gas through an impinger in a solution which absorbs impurities. The choice of the solution depends on the target impurities. It has been used for formic acid, ammonia and halogenated compounds. For example, an alkaline buffer solution made of CAPS (N-cyclohexyl-3-aminopropanesulfonic acid) has been tested for formic acid by RISE (Arrhenius et al., 2015). It is the most used method of pre-treatment.
• Combustion of sample, the combustion products are collected, after complete pyrolysis, in an oxidizing absorption solution, as described in ASTM D7359-18 for analysis of fluorine, chlorine and sulfur in aromatic hydrocarbons (D16 Committee, 2018).
• Sampling of gas onto a cartridge column to adsorb the target impurities then elution with a solvent. Thus RISE has used DNPH cartridges for trapping of formaldehyde, and silica gel treated adsorbent for trapping of ammonia (Arrhenius et al., 2015).
• Filtering of gas on filters from which impurities will be transferred to liquid phase, for example by heating and stirring nylon filters with deionized water, as in ASTM D7550-09 standard (D03 Committee, 2009).
Whatever the pre-treatment method, the achievable sensitivity depends on the sampled volume of hydrogen.
The pre-treatment is a crucial step for meeting ISO requirements for some molecules. Thus, ammonia is challenging, as shown in CDFA-DMS report: although the ion chromatograph with conductivity detector as described in ASTM D7550-09 (withdrawn in 2017) (D03 Committee, 2009) is very sensitive, the transfer of ammonia from gaseous samples at 0.2 and 0.4 μmol mol−1 to the eluent was not efficient enough to have a signal with the chosen sample volume (140.1 ml) (Mough et al., 2014).
Traceability of pre-treatment procedure is critical as it is often a step where the measurement traceability is lost. The use of gas standard to ensure the yield of conversion or trapping efficiency is critical to keep the measurement traceability and accuracy along the measurement chain.
Ionic Chromatography
IC After Solid Trapping
Ion chromatography with a conductivity detector is described in ASTM D7550-09 standard for measuring ammonium in hydrogen, after trapping ammonia onto a solid filter. No detection limit is reported, but a sensitivity in nmol.mol−1 range is achievable if the sampled hydrogen volume is sufficient (D03 Committee, 2009). However this standard was withdrawn in 2017.
The advantage of the method is allowing to extend the limit of detection by increasing the volume of hydrogen passing through the solid filter. The challenge is to determine the actual trapping yield of ammonia from the gas phase onto the solid filter. The challenge on measurement traceability is critical due to the lack of reference material for ammonia at nmol·mol−1 amount fraction.
IC After Combustion of the Sample
Two American standards, ASTM D7359-18 and UOP 991, describe the use of combustion ion chromatography (CIC) for analysis of some halogenated and sulfur compounds in liquid fuels: fluorine, chlorine for both, sulfur for the first and bromide for the second. With a pre-concentration device, the limit of detection has been calculated at 0.001 μmol mol−1 for anions determination (D16 Committee, 2018; ASTM International, 2017), meeting ISO 14687 control threshold.
IC After Liquid Trapping
RISE has used an alkaline buffer solution for bubbling before analysis by IC for formic acid. The limit of detection, 0.2 μmol mol−1, is equal to the control threshold (Arrhenius et al., 2015). SCAS also uses an impinger and IC for analysis of ammonia, halogenated compounds and formic acid, and IC for sulphur compounds, without any other precision (SCAS, n.d.).
About halogenated compounds measurement with IC, an issue is underlined in (Brown et al., 2015): the different halogenated compounds cannot be uniformly absorbed in a single solution. The choice of the trapping solution is critical to trap halogenated into the liquid solution. The hydrophilic compounds tend to be easily trapped compared to hydrophobic compounds, therefore it is difficult to determine which fraction of the total halogenated is determined by these methods.
High Performance Liquid Chromatography
HPLC has been tested by RISE in two different set-ups:
• coupled with an absorbance detector (UV-Vis) for formaldehyde analysis in hydrogen, eluted with acetonitrile, after sampling on adsorbent tubes containing silica gel and coated with DNPH. Hydrogen samples in gas bags containing 0.036 μmol mol−1 of formaldehyde have been analyzed, leading to a result of 0.016 μmol mol−1. A hypothesis explaining this difference is the adsorption of formaldehyde on bag walls. Measurement of blanks led to a result of 0.002 μmol mol−1 (Arrhenius et al., 2015).
• coupled with a conductivity detector for ammonia analysis in hydrogen after sampling on silica gel adsorbent tubes. Hydrogen blanks led to a value of 0.08 μmol mol−1 (Arrhenius et al., 2015).
SCAS also utilizes DNPH-HPLC for formaldehyde measurement in hydrogen, without any precision given (SCAS, n.d.).
Optical Spectroscopy
Optical spectroscopic methods are an alternative to chromatographic methods for hydrogen analysis. In these methods, the intensity of light at a specific wavelength after absorption by matter is measured. The wavelength is typically selected to be specific to the selected chemical compound but some interference might exist.
Several different spectroscopic methods can be used including cavity ring-down spectroscopy (CRDS), optical feedback cavity enhanced absorption spectroscopy (OFCEAS), Fourier transform infrared spectroscopy (FTIR), and laser-based direct absorption spectroscopy (DAS).
Cavity Ring-Down Spectroscopy
In CRDS, the light source is a laser emitting at a specific wavelength in an optical resonator composed of two reflective mirrors. The decay time until the light reaches a fraction of its initial intensity is measured. This time decreases when the concentration of the compound absorbing the wavelength increases. This technique allows sensitive detection, down to ppt, due to a high path length of typically several kilometers. However, the analytes which can be measured are limited by the available laser and mirrors wavelengths.
An American standard, ASTM D7941-14 (D03 Committee, 2014), describes the use of continuous wave CRDS for hydrogen purity analysis. Following this standard, ammonia, formaldehyde, carbon monoxide, carbon dioxide, oxygen, hydrocarbons and water can be measured in hydrogen. All detection limits are below the control threshold.
CRDS has been used by NPL for water in hydrogen (Brown et al., 2011). A high flowrate was necessary for this method, about 0.5 L min−1. It has also been successfully tested with carbon monoxide in hydrogen (Murugan and Brown, 2015).
CRDS was tested by CDFA-DMS for water, formaldehyde and ammonia measurement in hydrogen, with success, without any precision (Mough et al., 2014) other than interferences on ammonia and formaldehyde measurements due to water. For ammonia, water above 15 μmol mol−1 invalidate the analysis, and for formaldehyde (not validated because of the lack of gas standard), the corresponding water threshold is 10 μmol mol−1.
An optical parametric oscillator (OPO) was used by VSL as the light source to measure formic acid, formaldehyde, hydrogen chloride and ammonia in hydrogen with limits of detection below the control thresholds except for ammonia (equal) (Bacquart et al., 2019; Meuzelaar et al., 2020).
Table 6 shows the detection limits per impurity for NPL, VSL, CDFA-DMS and ASTM D7941-14.

TABLE 6. Detection limit per impurity with CRDS for NPL, VSL, CDFA-DMS and ASTM D7941-14.
Optical Feedback Cavity Enhanced Absorption Spectroscopy
OFCEAS is a variant of CRDS with a long optical path at low pressure, below 100 mbar absolute, enabling sampling at low pressure and a reduction of the needed sample volume. Analysis over a range of wavelengths can be performed quickly. According to its manufacturer, this technology is suitable for hydrogen purity analysis. Water, methane, oxygen, carbon dioxide, carbon monoxide, hydrogen sulfide, formaldehyde, formic acid, ammonia and hydrogen chloride can be measured in hydrogen (Ap2e, n.d.).
RISE reported limits of detection for water, hydrogen sulphide, oxygen, carbon dioxide and carbon monoxide below the control thresholds (Bacquart et al., 2019).
Table 7 gives the limits of detection of OFCEAS analyzer for RISE and provided by the manufacturer.
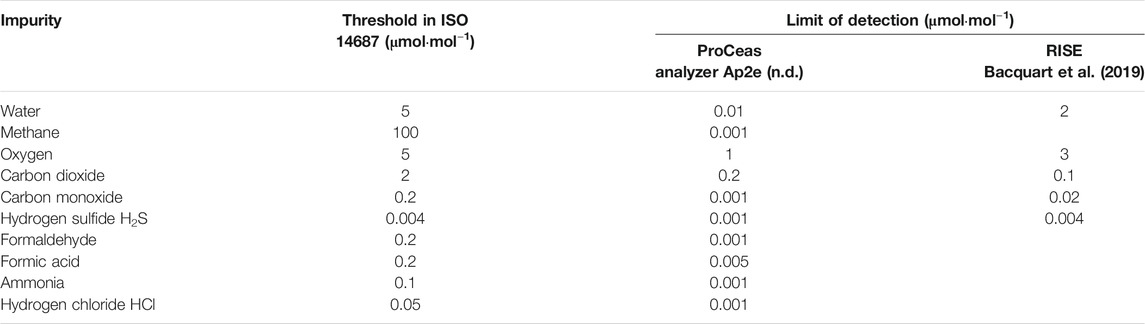
TABLE 7. Detection limit per impurity with OFCEAS for manufacturer and RISE.
Fourier Transform Infrared Spectroscopy
In FTIR, the light source is not monochromatic and covers a large part of the infrared spectrum at once, contrary to CRDS. The resulting signal is then transformed (Fourier transform) to obtain the absorption spectrum. This technique is sensitive, down to nmol·mol−1 when used with a long path multipass absorption cell (typically 5 m or more) but cannot be used for monoatomic species or molecules composed of the two same atoms (nitrogen, oxygen), as they do not absorb in infrared.
An American standard, ASTM D7653-18 (D03 Committee, 2018b), describes the use of FTIR with a detector cooled with liquid nitrogen for hydrogen analysis whereas the Japanese standard JIS K0117 (JSA Group, 2016a) only describes the general rules for FTIR analysis.
According to the American standard, the following impurities can be measured in hydrogen: ammonia, formic acid, formaldehyde, carbon monoxide, carbon dioxide, hydrocarbons and water. Concerning hydrocarbons, the standard does not explain how the total hydrocarbon measurement is performed. CDFA-DMS and NPL have also developed methods for hydrogen purity analysis with FTIR. Table 8 gives the limits of detection per element in ASTM D7653-18 and for CDFA-DMS and NPL.
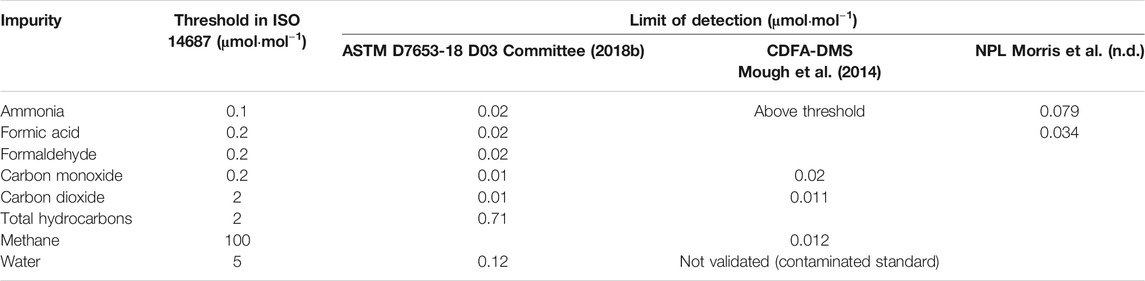
TABLE 8. Detection limit per impurity with FTIR in ASTM D7653-18, for CDFA-DMS and NPL.
All impurities covered by FTIR are suitable for ISO 14687.
Direct Absorption Spectroscopy
Laser-based direct absorption spectroscopy (DAS) is a highly selective and sensitive technique for measuring trace gas species based on the Beer-Lambert law (Swinehart, 1962). The main components of a DAS system include a tunable laser source, a multi-pass cell and a photodetector. The emission wavelength of the laser source is tuned across a single absorption line of the analyte species. Higher sensitivity and lower detection limits can be achieved by using wavelength modulation (WMS). The main advantage of DAS-WMS over other techniques stems from its capability to include multiple laser sources and hence to perform multispecies analysis at nmol.mol−1 levels of ISO 14687 impurities including water, methane, carbon dioxide, carbon monoxide, formaldehyde, formic acid, ammonia and halogenated compounds such as hydrogen chloride.
DAS-2f WMS has been used by VSL for analysis of HCl (Meuzelaar et al., 2020) and CO in hydrogen with a detection limit of 4.2 nmol mol−1 and 1.4 nmol mol−1, respectively.
Other Methods
Chilled Mirror Hygrometer
Chilled mirror hygrometers determine the dew point by cooling, at constant pressure, a reflective condensation surface until water begins to condense. The condensed fine water droplets are detected by a photodetector and in this condition the temperature of the mirror is equal to the dew point temperature of the gas.
A chilled mirror hygrometer has been used to analyze water in hydrogen by NPL (Murugan and Brown, 2015). A large flowrate of 500 ml/min is required with a long purge, up to a few hours. The reported limit of detection is 1 μmol/mol.
This method is also described in the Japanese standard JIS K 0225 (JSA Group, 2016b) and used by SCAS for water measurement in hydrogen (SCAS, n.d.).
Quartz Crystal Microbalance
An alternating electrical field is applied to quartz crystals inducing their oscillation. Their coating is sensitive to the target compounds. Adsorption increases the mass of the surface leading to a change in the resonance frequency of the crystal.
As for a chilled mirror hygrometer, quartz crystal microbalance can be used to perform the analysis of water in hydrogen. It has been tested by NPL with a shorter purging step (a few minutes) than the previous method. However, a large flowrate, 300 ml/min, is also necessary. The reported limit of detection is 1 μmol/mol (Murugan and Brown, 2015; Bacquart et al., 2019).
This method is also described in the Japanese standard JIS K 0225 (JSA Group, 2016b).
Electrochemical Sensor
An electrochemical cell typically consists of electronic conductors (electrodes) and an ionic conductor (electrolyte). Redox reactions take place in the cell and the resulting current is measured.
Oxygen in hydrogen can be analyzed by electrochemical sensors following the standard ASTM D7607-19 (for gaseous fuels) with some precautions: oxides of sulphur and nitrogen, hydrogen sulphide, moisture and particulates must be removed before analysis. The reported detection limit in the standard is 0.3 μmol mol−1. The flowrate ranges from 0.5 to 2 L min−1 (D03 Committee, 2019c).
Japanese standard JIS K 0225 describes the use of galvanic cells, a type of electrochemical sensors where chemical energy is converted into electrical energy, for the determination of oxygen content (JSA Group, 2016b).
Selected Ion Flow Tube Mass Spectrometry
Selected ion flow tube mass spectrometers (SIFT-MS) rely on reaction of gases with a precursor ion generated by microwave discharge through air, usually H3O+, NO+ or O2+. Ions formed are then analyzed by MS. A preconcentration or separation step is not necessary. The sensitivity is high (sub-nmol.mol−1 level) and the response time is very short (20 ms), allowing real-time analysis (Syft Technologies, n.d.).
A SIFT-MS was used by NPL for formaldehyde analysis in hydrogen, in works on stability of formaldehyde gaseous standards. The need for determination of reaction rate constants in hydrogen was assessed (Bacquart et al., 2018). SIFT-MS is also used by NPL for formic acid and ammonia analysis (Morris et al., n.d.). The corresponding detection limits are provided in Table 9.
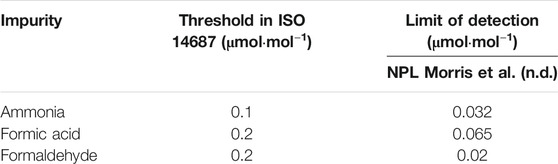
TABLE 9. Detection limit per impurity with SIFT-MS for NPL.
New Potential Methods
This section presents some new promising methods which could be used for the analysis of impurities in hydrogen. They have to be validated for this application.
Time-of-Flight Mass Spectrometry
Time-of-flight mass spectrometry (TOF-MS) is a variant of MS where ions are accelerated by an electric field of known potential and then travel through a tube until the detector. The flight time to reach the detector depends on the mass to charge ratio due to the conversion of the potential energy of the ion in kinetic energy. Real-time measurements can be performed. A Japanese company, Kanomax, reports its use to assess the contamination of hydrogen for FCEVs, without any details (Kanomax, n.d.).
Ion Mobility Spectroscopy
In ion mobility spectrometry, an electric field is applied in a tube to separate ions. They display different velocities based on their physicochemical characteristics as they travel through a purified gas at atmospheric pressure. This method is selective and sensitive (below nmol.mol−1).
A GC-IMS has been developed by ION-GAS for online quality monitoring of HRS (ION-GAS, 2020).
Electron Impact and Ion-Molecule Reaction
With electron impact mass spectrometry (EI-MS), samples are ionized by high energy electrons whereas in ion-molecule reaction mass spectrometry (IMR-MS), ions with lower energy levels are used for ionization. The combination of both enables the analysis of hydrogen covering impurities specified in ISO 14687 in a single instrument developed by V&F (V&F 2019).
Analytical Methods per Impurity
Standard Methods
Several organizations developed standardized methods used for hydrogen purity measurements. A review of the suitability of these standards was performed for Japanese standard (JIS) and North American standards (ASTM). It is critical bearing in mind the new requirement in ISO 21087:2019.
It should be noted that several JIS standards are not dedicated to hydrogen matrix. The Japanese standard JIS K 0225:2002 presents analytical measurements of O2, CO2, CH4 and H2O without defining the type of gas sample (JSA Group, 2016b). The Japanese standard JIS K 0303:2012 (JSA Group, 2016c) presents analytical measurements of formaldehyde in flue gas without clear validation for hydrogen matrix. The application of these standards to hydrogen matrix will require additional development and validation to ensure the standard method is suitable and comply with the requirements of ISO 21087:2019. The Japanese standards JIS K 0114:2012 (JSA Group, 2012), JIS K0117:2017 (JSA Group, 2016a), JIS K 0123:2006 (JSA Group, 2018), JIS K 0124:2011 (JSA Group, 2015) and JIS K0127:2013 (JSA Group, 2013) expose only the general rules for gas chromatography, FTIR analysis, GC-MS, liquid chromatography or ion chromatography respectively.
The Japanese standards present a clear overview of analytical methods but are not specific to hydrogen matrix or to any contaminant in hydrogen and cannot be considered as standard method for hydrogen fuel quality without additional evidences (i.e. validation method report, hydrogen dedicated analytical method).
ASTM standards are dedicated to compounds and hydrogen matrix. The analytical methods are clearly written however all the method validation was not always available, especially the precision and bias section due to the lack of inter-laboratory comparison (lack of scheme or participants). Even if ASTM methods present closer alignment to the requirements of ISO 21087:2019, they will require the laboratory to perform the final method validation test required to comply with ISO 21087:2019.
Analytical Techniques Summary
Table 10 summarizes the suitable analytical techniques which have been published until mid-2020 for hydrogen impurities determination and the validated limit of detection if known. Methods with a detection limit above the control threshold are not included.
TABLE 10. Analytical methods from the bibliographical study per impurity with detection limit above the control threshold.
Survey of Analytical Laboratories
Questionnaire
In 2018, a questionnaire has been sent to EMPIR MetroHyVe partners and ten relevant laboratories in the hydrogen sector to determine which analytical methods have already been implemented and/or tested.
For each impurity in ISO 14687 standard, the following information was requested: the analytical method, its limit of detection, the concentration of standard gases, the uncertainty at the threshold, the references, the presence or absence of cross contamination response and whether the method is specific to hydrogen.
Results
Seven answers (from the United States, China, United Kingdom, France, Sweden and Spain) have been obtained in 2018-2019, shown in Table 11, giving the methods used by each laboratory per impurity. The detection limits and references (if provided by the participants) are indicated.
TABLE 11. Methods used by the participants of the survey, by impurity and laboratory, with their corresponding detection limits and references (if provided).
The laboratories that replied to the questionnaire are using methods described in this review except for the three methods below:
• SCD without GC for measurement of total sulphur compounds. Thus the quantification of sulphur compounds is possible, without identification.
• Alumina Al2O3 sensors which are dedicated to humidity measurements. They are based on two electrodes, a porous layer of aluminium oxide absorbing water, covered by a permeable gold film. Its capacitance varies with moisture absorption. Their advantage is a low response time, a few seconds. The detection limits (0.5 and 0.1 μmol mol−1) provided by the laboratories using them are below the control threshold for water.
• Colorimetric tubes are based on color reactions which transform the target compounds in colored molecules. A scale on the tube allows reading the concentration of the target compound. These tubes are easy to use but not very accurate. They are intended for single use only. One laboratory uses this technique for ammonia, however the detection limit (0.2 μmol mol−1) is above the control threshold.
The survey demonstrates that no technique covers all impurities. Several techniques are used by each laboratory. The average number of techniques in use is six, the minimum is four and the maximum eight. Some methods are used only for specific compounds in halogenated, sulfur or hydrocarbon compounds, not for all compounds from these families. Halogenated compounds are especially challenging, most laboratories covering partially these compounds, confirming the results of the review. It can be noted that each laboratory uses GC-MS, with different setups (with or without preconcentrator, with other detectors such as FID, etc.). GC-TCD and GC-PDHID are also used by a significant number of laboratories, respectively five and four out of seven laboratories. Other families of techniques (liquid chromatography, spectroscopy and other techniques) are less popular: HPLC, IC and FTIR are each used by only one laboratory and OFCEAS by two laboratories. No laboratory from the survey uses CRDS.
Only two out of seven laboratories cover all impurities stated in ISO 14687. In particular, the other five laboratories did not provide any answer for formaldehyde. Formic acid was also not addressed by three participants. There is still a need for method development and standardization to increase the capabilities of analytical laboratories for formaldehyde and formic acid.
Although the number of laboratories capable of performing the analysis of all impurities stated in ISO 14687 is limited, it is noticeable that there is an increasing number of laboratories and techniques used in hydrogen quality in the past years. The number of laboratories is sufficient to organize inter-laboratory comparison and method or instrument comparison. It is important to evaluate the comparability of analytical methods especially in a fast-growing sector.
Discussion
As a summary, the following table indicates, for each reviewed method (including methods from the survey but without potential new methods for which results were not published), the capability of the method to analyze impurities according to ISO 14687:2019 (detection limit below the control threshold). The number of suitable methods per impurity and the number of impurities covered by each method are also given. The methods suitable for a given impurity are in green, and the red color corresponds to three different cases:
• unknown detection limit (?);
• method which does not cover all compounds for halogenated, sulfur or total hydrocarbons compounds (partial);
• detection limit equal to the control threshold (LOD =).
Table 12 was done by taking into account the limit of detection. According to ISO 21087:2019, the limit of quantification with its associated uncertainty should have been the parameter to assess the capability of an analytical method to perform hydrogen purity analysis. However, the limit of detection was much more often reported than the limit of quantification, which explains that this paper is based on detection limit instead of quantification limit.
TABLE 12. Capability of analytical methods to analyze impurities according to ISO 14687:2019 based on detection limit (green: detection limit < the spec., red: “LOD =” detection limit = spec., “Partial” partial covering of spec. and “?” unknown detection limit).FENRG_fenrg-2020-615149_wc_fx1
Several analytical methods have been developed for analysis of hydrogen fuel quality according to ISO 14687:2019. Spectroscopic techniques are the ones covering the most impurities, together with GC-MS. However, some compounds cannot be analyzed by spectroscopy: nitrogen, argon and helium. It should be considered that even if the same technique can perform the analysis, it may require different setup or hardware (i.e. laser, column, carrier gas). Another drawback is the analysis of hydrocarbons, sulphur and halogenated compounds, which is partial, i.e. only some compounds from these families are detected. With spectroscopic techniques, the sum of each compound from these families has to be done.
All impurities, except halogenated compounds, have been addressed, in spite of challenging specifications levels for some compounds (sulfur compounds at 4 nmol mol−1 for instance). Methods for halogenated compounds do not cover all compounds, only some families of these compounds, as the international standard has transitioned from total halogenated to key halogenated. It is key to define with the hydrogen producers or HRS operators the list of halogenated to be measured and therefore ensure to use the appropriate method.
A major conclusion of this peer review article is that there is not a single validated method for all impurities, nor a single analytical technique. Today, a combination of several expensive (about 200 k€) instruments is required to address all impurities of the international standard ISO 14687:2019, including GCs with different detectors and spectroscopic techniques (FTIR, CRDS or OFCEAS). This has been confirmed by the results of the survey sent to the laboratories performing purity analysis of H2 for mobility. Every laboratory uses several analytical techniques, all of them use GCs, and even GC-MS (in different setups) is used by each laboratory. Answers to this survey are very different between them, showing that purity analysis of H2 is far from standardization.
However, some manufacturers have developed new analyzers which could perform the full analysis according to ISO 14687:2019 such as the instrument developed by V&F (V and F, 2019). Nevertheless, no published result has been found about these performances. A validation report is necessary before using these instruments as required by ISO 21087:2019.
Another finding from this state of the art is the lack of alignment between the standardized methods (i.e. ASTM, JIS) or the laboratory analytical methods with the fit for purpose criteria of ISO 21087:2019. These new requirements will need to be promoted and assessed in order to ensure that all analytical methods are comparable and equivalent. There is a clear gap that will require each independent laboratory to verify and validate that their internal methods comply with ISO 21087:2019. It is a prerequisite to ensure the quality of the hydrogen fuel measurement.
As several instruments are necessary to perform purity analysis of H2, requiring highly skilled operators, the cost (capital and operating cost) of this analysis is significant, around 10k€ par analysis (Carré, 2018). Moreover, added to the sampling and transportation requirements, the delay of the analysis, from sampling to the final results, is at least 1–3 weeks. Thus, cost, delay and complexity are as many challenges to the quality approach.
Conclusion
This review presents the state of the art of analytical methods for hydrogen quality according to ISO 14687:2019. New instruments, methods, technologies have emerged since the last review articles. The survey highlighted the actual laboratories capabilities in comparison of the analytical methods state of the art. The growing number of analytical laboratories is a positive sign for the sector and for the development of analytical methods.
This review confirms that the analysis of hydrogen according to ISO 14687:2019 and ISO 21087:2019 remains challenging due to the number of compounds involved and the low control thresholds. In 2020, several instruments are required to perform the whole analysis, the analysis takes between 1–3 weeks and costs around 10 k€ per analysis. Further research is necessary to develop new methods, less expensive, faster, more comprehensive, with a lower consumption of sample gas and which could be standardized.
The new requirement for fit-for-purpose analytical methods following ISO 21087:2019 is currently not widely applied due to lack of knowledge of the new standard and lack of technical studies or tools. To validate methods following ISO 21087:2019 and ensure the traceability of measurements, new gas standards with the considered impurities are necessary. Some reactive species are challenging, such as formaldehyde. Gas standards are also required for calibration, validation and quality control. Inter-laboratory comparison is needed to determine trueness and accuracy as mentioned in ASTM methods. There is a need to develop and deploy these analytical tools for the hydrogen quality sector.
Most methods in this paper are offline. Another way to reduce cost and delay is to use online analyzers. Several online devices are being developed with the same limitations as for offline analyzers: today no single device has been validated to analyze all impurities in ISO 14687:2019. In order to validate such techniques, a comparison between online and offline methods should be carried out in laboratories.
Author Contributions
CB, TB and BG performed literature search and wrote the manuscript. BG and TB performed the survey and CB analyzed the results. All authors provided comments and inputs to the manuscript. AM coordinated the project.
Funding
This research has received funding from the EMPIR programme co-financed by the Participating States and from the European Union's Horizon 2020 research and innovation programme, through the project “Metrology for hydrogen vehicles”, grant number 16ENG01.
Conflict of Interest
Authors CB, BG and MC are employed by company Air Liquide.
The remaining authors declare that the research was conducted in the absence of any commercial or financial relationships that could be construed as a potential conflict of interest.
References
Aarhaug, T. A., Reinkainen, M., and Defoort, F. (2015). “Intermediate report on the performance of existing and new hydrogen purity analysis methods”. Deliverable 2.3. HyCoRA – hydrogen contaminant risk aseessment. Available at: http://hycora.eu/deliverables/D%202.3%20Intermediate%20report%20on%20the%20performance%20of%20existing%20and%20new%20hydrogen%20purity%20analysis%20methods.pdf (Accessed Septemebr 30 2015).
Ap2e, (n.d). “ap2e - H2 Purity control - FR”. Ap2e. Available at: https://www.ap2e.com/fr/notes-application/analyseur-gaz-purete-hydrogene/ (Accessed March 4 2019).
Arrhenius, K., Anna, A., Yaghooby, H., Engelbrektsson, J., and Niklas, S. (2015). Analysis of hydrogen quality according to standard ISO/DIS 14687-2. Pre-Study. REPORT 2015:177. Stockholm, Sweden: EnergiforskAvailable at: https://energiforskmedia.blob.core.windows.net/media/18581/analysis-of-hydrogen-quality-energiforskrapport-2015-177.pdf (Accessed March 2019).
Arrhenius, K., Bohlen, H., Oliver, B., de Krom, I., Heikens, D., and van Wijk, J. (2020). Hydrogen purity analysis: suitability of sorbent tubes for trapping hydrocarbons, halogenated hydrocarbons and sulphur compounds. Applied Sciences-Basel 10 (1), 120. doi:10.3390/app10010120
Arrhenius, K., Murugan, A., and Bacquart, T. (2018). Sampling from hydrogen refuelling stations. MetroHyVe-Report-A4.1.1. Available at: https://www.metrohyve.eu/app/uploads/sites/6/2018/01/MetroHyVe-Report-A4.1.1-Sampling-from-hydrogen-refuelling-stations.pdf (Accessed July 2020).
Arrhenius, K., Oliver, B., and Bartlett, S. (2018). Literature review - state-of-the-art for the storage of reactive species in vessels. MetroHyVe-Report-A4.4.1. Available at: https://www.metrohyve.eu/app/uploads/sites/6/2018/02/MetroHyVe-Report-A4.4.1-Literature-review-%E2%80%93-state-of-the-art-for-the-storage-of-reactive-species-in-vessels.pdf (Accessed July 2020).
Arrhenius, K. (2020). Oliver büker, andreas fischer, stefan persijn, and niamh D. Moore.Development and evaluation of a novel analyser for ISO14687 hydrogen purity analysis. Meas. Sci. Technol. 31 (7), 075010. doi:10.1088/1361-6501/ab7cf3
Astm International, (2017). “UOP991-17 chloride, fluoride, and bromide in liquid organics by combustion ion chromatography (CIC)”. Standard. West Conshohocken, PA: ASTM InternationalAvailable at: https://www.astm.org/Standards/UOP991.htm (Accessed May 25 2018).
Bacquart, T., Arrhenius, K., Persijn, S., Rojo, A., Aupretre, F., Gozlan, B., et al. (2019). Hydrogen fuel quality from two main production processes: steam methane reforming and proton exchange membrane water electrolysis. J. Power Sources 444, 27170. doi:10.1016/j.jpowsour.2019.227170
Bacquart, T., Murugan, A., Carré, M., Gozlan, B., Auprêtre, F., Haloua, F., et al. (2018). Probability of occurrence of ISO 14687-2 contaminants in hydrogen: principles and examples from steam methane reforming and electrolysis (water and chlor-alkali) production processes model. Int. J. Hydrogen Energy 43 (26), 11872–11883. doi:10.1016/j.ijhydene.2018.03.084
Bacquart, T., Perkins, M., Ferracci, V., Martin, N. A., Resner, K., Michael, K., et al. (2018). Production and stability of low amount fraction of formaldehyde in hydrogen gas standards. Int. J. Hydrogen Energy 43 (13), 6711–6722. doi:10.1016/j.ijhydene.2018.02.026
Brown, A. S., Gergely, M. V., Michael, L. D., Nick, J. H., Gordon, G. F., and Hall., K. I. (2011). Methods for the analysis of trace-level impurities in hydrogen for fuel cell applications. NPL Report AS 64. Available at: https://eprintspublications.npl.co.uk/5212/.(Accessed March 2019)
Brown, A. S., Murugan, A., and Brown, R. J. C. (2015). Measurement of “total halogenated compounds” in hydrogen: is the ISO 14687 specification achievable?. Accred Qual. Assur. 20 (3), 223–227. doi:10.1007/s00769-015-1135-2
Carré, M. (2018). How to ensure H2 quality without increasing H2 analysis cost? Air liquide paris innovation campus. Available at: http://projects.lne.eu/jrp-hydrogen/workshop/ (Accessed July 2020).
CEN/TC 268, (2018). Cryogenic vessels and specific hydrogen technologies applications. Hydrogen fuel - product specification and quality assurance - proton exchange membrane (PEM) fuel cell applications for road vehicles. EN 17124:2018. Available at: https://standards.cen.eu/dyn/www/f?p=204:110:0:FSP_PROJECT,FSP_ORG_ID:62235,6249&cs=1D8F80799FAFEF18CEA9E6ED81D14821E (Accessed April 2019)
Cheng, X., Zheng, S., Glass, N., Zhang, L., Zhang, J., Song, D., et al. (2007). A review of PEM hydrogen fuel cell contamination: impacts, mechanisms, and mitigation. Journal of Power Sources, IBA – HBC. 165 (2), 739–756. doi:10.1016/j.jpowsour.2006.12.012
D02 Committee (2015). Test method for chemical composition of gases by mass spectrometry. West Conshohocken, PA: ASTM International. doi:10.1520/D2650-10R15
D03 Committee (2019a). Practice for analysis of reformed gas by gas chromatography. West Conshohocken, PA: ASTM International. doi:10.1520/D1946-90R19
D03 Committee (2018a). Standard practice for screening organic halides contained in hydrogen or other gaseous fuels. West Conshohocken, PA: ASTM International. doi:10.1520/D7676-18
D03 Committee (2015a). Standard test method for determination of total organic halides, total non-methane hydrocarbons and formaldehyde in hydrogen fuel by gas chromatography/mass spectrometry. West Conshohocken, PA: ASTM International. doi:10.1520/D7892-15
D03 Committee (2019b). Test method for analysis of natural gas by gas chromatography. West Conshohocken, PA: ASTM International. doi:10.1520/D1945-14R19
D03 Committee (2019c). Test method for analysis of oxygen in gaseous fuels (electrochemical sensor method). West Conshohocken, PA: ASTM International. doi:10.1520/D7607_D7607M
D03 Committee (2009). Test method for determination of ammonium, alkali and alkaline earth metals in hydrogen and other cell feed gases by ion chromatography (withdrawn 2017). West Conshohocken, PA: ASTM International. doi:10.1520/D7550-09
D03 Committee (2012). Test method for determination of sulfur compounds in natural gas and gaseous fuels by gas chromatography and chemiluminescence. West Conshohocken, PA: ASTM International. doi:10.1520/D5504-12
D03 Committee (2015b). Test method for determination of total hydrocarbons in hydrogen by FID based total hydrocarbon (THC) analyzer. West Conshohocken, PA: ASTM International. doi:10.1520/D7675-15
D03 Committee (2019d). Test method for determination of trace carbon dioxide, argon, nitrogen, oxygen and water in hydrogen fuel by jet pulse injection and gas chromatography/mass spectrometer analysis. West Conshohocken, PA: ASTM International. doi:10.1520/D7649-19.10.1520/D7649-19
D03 Committee (2018b). Test method for determination of trace gaseous contaminants in hydrogen fuel by fourier transform infrared (FTIR) spectroscopy. West Conshohocken, PA: ASTM International. doi:10.1520/D7653-18
D03 Committee (2011). Test method for determination of trace hydrogen sulfide, carbonyl sulfide, methyl mercaptan, carbon disulfide and total sulfur. Hydrogen fuel by gas chromatography and sulfur chemiluminescence detection. West Conshohocken, PA: ASTM International. doi:10.1520/D7652-11
D03 Committee (2014). Test method for hydrogen purity analysis using a continuous wave cavity ring-down spectroscopy analyzer. West Conshohocken, PA: ASTM International. doi:10.1520/D7941_D7941M
D03 Committee (2020). Test method for water vapor content of gaseous fuels using electronic moisture analyzers. West Conshohocken, PA: ASTM International. doi:10.1520/D5454-11R20
D03 Committee (2011). WK34574, new standard test method for determination of trace hydrogen bromide, hydrogen chloride, chlorine and organic halides in hydrogen fuel by gas chromatography (GC) with electrolytic conductivity detector cell (ELCDC) and mass spectrometer (MS), under development. West Conshohocken, PA: ASTM International (Accessed February 26, 2019).
D16 Committee (2018). Test method for total fluorine, chlorine and sulfur in aromatic hydrocarbons and their mixtures by oxidative pyrohydrolytic combustion followed by ion chromatography detection (combustion ion chromatography-CIC). West Conshohocken, PA: ASTM International. doi:10.1520/D7359-18
D22 Committee (2015). Test method for determination of volatile organic chemicals in atmospheres (canister sampling methodology). West Conshohocken, PA: ASTM International. doi:10.1520/D5466-15
Downey, M. L., Murugan, A., Bartlett, S., and Brown, A. S. (2015). A novel method for measuring trace amounts of total sulphur-containing compounds in hydrogen. J. Chromatogr. A. 1375, 140–145. doi:10.1016/j.chroma.2014.11.076
European Industrial Gases Association AISBL (2016). Flexible connections in high pressure gas systems Doc 42/16 (Accessed July 2020).
European Union (2014). Directive 2014/94/EU of the European parliament and of the council of 22 October 2014 on the deployment of alternative fuels infrastructure text with EEA relevance, 307.Available at: http://data.europa.eu/eli/dir/2014/94/oj/eng (Accessed June 2020)
FuelCellsWorks, . (2020). In 2019: 83 new hydrogen refuelling stations worldwide. FuelCellsWorks (blog). Available at: https://fuelcellsworks.com/news/in-2019-83-new-hydrogen-refuelling-stations-worldwide/. (Accessed 19 February 2020).
H2.LIVE Hydrogen Stations in Germany and Europe (2018). H2 mobility. Available at: https://h2.live/en (Accessed 17 July 2019).
Haloua, F., Murugan, A., Bacquart, T., and Arrhenius, K. (2018). Literature review of impurity analysis methods for the compounds mentioned in ISO 14687-2:2012.
Hyundai, . (2019). Hyundai and H2 energy sign joint venture contract. Hyundai hydrogen mobility (blog). Available at: https://hyundai-hm.com/en/2019/08/26/hyundai-and-h2-energy-sign-joint-venture-contract/ (Accessed 26 August 2019).
Hyundai, (2018). Hyundai motor Group reveals “FCEV vision 2030”. Hyundai Media NewsroomAvailable at: https://www.hyundai.news/eu/brand/hyundai-motor-group-reveals-fcev-vision-2030/. (Accessed 11 December 2018).
ION-GAS (2020). H2IMS - hydrogen quality monitor. ION-GAS. Available at: https://www.ion-gas.de/en/H2IMS.html. (Accessed May 2020)
ISO/TC 158 Analysis of Gases (2019). ISO 21087:2019 gas analysis –Analytical methods for hydrogen fuel-proton exchange membrane (PEM) fuel cell applications for road vehicles. Available at: https://www.iso.org/obp/ui/#iso:std:iso.21087-1:v1:en
ISO/TC 197 (2019). Hydrogen Technologies. ISO 14687 Hydrogen Fuel – Product Specification – Part 2: Proton Exchange Membrane (PEM) Fuel Cell Applications for Road Vehicles. Available at: https://www.iso.org/obp/ui/fr/#iso:std:iso.14687-1:v1:en (Accessed January 2020)
Jacques, P.-A., Ihonen, J., and Koski, P. (2014). Review on the impact of impurities on PEMFC and analytical methods for hydrogen QA. Deliverable 1.1 HyCoRA – hydrogen contaminant risk assessment.
JSA Group (2012). JIS K 0114:2012 general rules for gas chromatography. Available at: https://webdesk.jsa.or.jp/books/W11M0090/index/?bunsyo_id=JIS%20K%200114.2012 (Accessed March 2019)
JSA Group (2016a). JIS K 0117:2017 general rules for infrared spectrophotometric analysis. Available at: https://webdesk.jsa.or.jp/books/W11M0090/index/?bunsyo_id=JIS%20K%200117.2017 (Accessed March 2019)
JSA Group (2018). JIS K 0123:2018 general rules for gas chromatography/mass spectrometry. Available at: https://webdesk.jsa.or.jp/books/W11M0090/index/?bunsyo_id=JIS%20K%200123.2018 (Accessed March 2019)
JSA Group, (2015). JIS K 0124:2011 General rules for high performance liquid chromatography. Available at: https://webdesk.jsa.or.jp (Accessed March 2019)
JSA Group (2013). JIS K 0127:2013 general rules for ion chromatography. Available at: https://webdesk.jsa.or.jp/books/W11M0090/index/?bunsyo_id=JIS%20K%200127.2013 (Accessed March 2019)
JSA Group (2016b). JIS K 0225:2002 testing methods for determination of trace components in diluent gas and zero gas. Available at: https://webdesk.jsa.or.jp/books/W11M0090/index/?bunsyo_id=JIS%20K%200225.2002 (Accessed March 2019)
JSA Group (2016c). JIS K 0303:2012 Methods for determination of formaldehyde in flue gas. Available at: https://webdesk.jsa.or.jp. (Accessed March 2019)
Kanomax, (n.d). APPLICATION | KANOMAX. Kanomax. Available at: https://kanomax.biz/asia/solutions/analytical_instruments/application_for_gas_analysis.html (Accessed May 15, 2020).
Metrology for Hydrogen Vehicles, (2017). Available at: http://www.metrohyve.eu/ (Accessed February 15, 2019).
Meuzelaar, H., Liu, J., Persijn, S., Janneke van Wijk, , Adrian, M., and van der Veen, H. (2020). Trace level analysis of reactive ISO 14687 impurities in hydrogen fuel using laser-based spectroscopic detection methods - paper submitted for publication. Int. J. Hydrogen Energy 45 (58). 34024–34036. doi:10.1016/j.ijhydene.2020.09.046
Morris, A., Bacquart, T., Murugan, A., Michael, K., Ward, M., and Niamh, M. (n. d.). MetroHyVe report a2.1.2-2.1.3: summary of NPL analytical methods for hydrogen purity analysis.
Mough, J., Kevin Schnepp, , and Fitch, P. (2014). Staff draft - measurement and standards requirements for hydrogen and biodiesel used as a transportation fuel - volume 1 hydrogen fuel quality - methods for the analysis of contaminants in gaseous hydrogen fuel. Sacramento, CA: California Department of Food and Agriculture - Division of Measurement StandardsAvailable at: https://www.cdfa.ca.gov/dms/hydrogenfuel/CECReportDraft.pdf (Accessed March 2019).
Murugan, Arul., and Brown, Andrew. S. (2015). Review of purity analysis methods for performing quality assurance of fuel cell hydrogen. Int. J. Hydrogen Energy 40 (11), 4219–4233. doi:10.1016/j.ijhydene.2015.01.041
SAE, Fuel Cell Standards Committee (2020). J2719A Hydrogen fuel quality for fuel cell vehicles. Warrendale, PA: SAE InternationalAvailable at: https://www.sae.org/standards/content/j2719_202003/ (Accessed May 2020).
SCAS (n.d). Hydrogen gas | fuel cell and hydrogen gas | energy & batteries | services | sumika chemical analysis Service Ltd. Fukuoka, Japan: Sumika Chemical Analysis Service, LtdAvailable at: https://www.scas.co.jp/en/services/materialscience/energy-storage/fuel-cells/hydrogen-fuel.html (Accessed 14 March 2019).
Skoog, D. A., West, D. M., Hollar, J. F., and Skoog, D. A. (1992). Fundamentals of analytical chemistry. J. Chem. Educ. (11), 69, A305. doi:10.1021/ed069pA305.1
Syft Technologies (n.d). Selected ion flow tube mass spectrometry (SIFT-MS). Christchurch, New Zealand: Syft technologiesAvailable at: https://www.syft.com/sift-ms/ (Accessed May 15, 2020).
Toyota Europe, (2018). Toyota moves to expand mass-production of fuel cell stacks and hydrogen tanks towards ten-fold increase post-2020. Brussels, Belgium: Toyota Europe NewsroomAvailable at: https://newsroom.toyota.eu/toyota-moves-to-expand-mass-production-of-fuel-cell-stacks-and-hydrogen-tanks-towards-ten-fold-increase-post-2020/ (Accessed 24 May 2018).
United Nations Economic Commission for Europe (2018). European agreement concerning the international carriage of dangerous goods by road. ECE/TRANS/275. New York, NY. Available at: https://www.unece.org/index.php?id=50858&no_cache=1 (Accessed March 2020).
US Department of Energy - Energy Efficiency & Renewable Energy (2020). Alternative fueling station locator. Alternative fuels data center. Available at: https://afdc.energy.gov/stations/#/find/nearest?fuel=HY&hy_nonretail=true&country=US (Accessed April 2020).
V and F, (2019). Hydrogen fuel purity testing. Available at: http://www.vandf.com/en/industry-solutions/gas-industry/various-gases/hydrogen-fuel-purity-testing/http://www.vandf.com/en/industry-solutions/gas-industry/various-gases/hydrogen-fuel-purity-testing/ (Accessed May 15, 2020).
VICI, (2015). Product manuals. VICIAvailable at: https://www.vici.com/support/manuals/manmenu.php (Accessed April 27, 2020).
Keywords: hydrogen, fuel cell, hydrogen quality, ISO 14687, impurities analysis, sampling
Citation: Beurey C, Gozlan B, Carré M, Bacquart T, Morris A, Moore N, Arrhenius K, Meuzelaar H, Persijn S, Rojo A and Murugan A (2021) Review and Survey of Methods for Analysis of Impurities in Hydrogen for Fuel Cell Vehicles According to ISO 14687:2019. Front. Energy Res. 8:615149. doi: 10.3389/fenrg.2020.615149
Received: 08 October 2020; Accepted: 15 December 2020;
Published: 24 February 2021.
Edited by:
Peiwen Li, University of Arizona, United StatesReviewed by:
Ioan Stamatin, University of Bucharest, RomaniaShrihari Sankarasubramanian, Washington University in St. Louis, United States
Copyright © 2021 Beurey, Gozlan, Carré, Bacquart, Morris, Moore, Arrhenius, Meuzelaar, Persijn, Rojo and Murugan. This is an open-access article distributed under the terms of the Creative Commons Attribution License (CC BY). The use, distribution or reproduction in other forums is permitted, provided the original author(s) and the copyright owner(s) are credited and that the original publication in this journal is cited, in accordance with accepted academic practice. No use, distribution or reproduction is permitted which does not comply with these terms.
*Correspondence: Claire Beurey, Y2xhaXJlLmJldXJleUBhaXJsaXF1aWRlLmNvbQ==