 Jing Xie
 Tao Lv
 Peng Tong1
- 1School of Economics and Management, China University of Mining and Technology, Xuzhou, China
- 2Anhui Vocational College of Electronics and Information Technology, Bengbu, China
- 3School of Mines, China University of Mining and Technology, Xuzhou, China
- 4Shool of Economics and Management, Dalian University of Technology, Dalian, China
- 5School of Management, Xuzhou University of Technology, Xuzhou, China
In the era of the digital economy, for platform-based actors making a transition from one business field harmful for the sustainable development of society to a new field, their efficiency in value realization (EVR) has become inseparable from the digital platform used. The relationship between EVR on a platform and business transitions is a topic that has not been fully discussed, especially from the perspective of the platform service system. Also, few studies have explored transaction costs and opportunity costs using queuing theory. To fill these gaps and to inform transitions to sustainability, this paper applied a system dynamics method and proposed a framework for analyzing the relationship between EVR and the transition ratio. Findings suggest that improvements in the EVR lead to decreases in response time and may lead to an improved transition ratio. The ratio between EVR and the “entry rate” is important for predicting the transition ratio. However, preference, platform maturity, and the feedback of the transition ratio cause the effect of EVR to dynamically change. Based on this mechanism, the government can take incentive measures to maintain an acceptable transition ratio. For the power industry, the case simulated for this study, the transition can be improved by effectively transmitting a phasing-out policy for platforms and actors, and by guiding power exchange platforms to set reasonable rules, service levels, and growth rates.
Introduction
The sustainability transition (ST), such as the transition from fossil energy power generation to renewable energy power generation, is an important topic for sustainable development. In the digital economy era, a time when platform-driven mechanisms and societies are further emerging, ST should be discussed in terms of an actor’s operation on a platform1 (Mattila and Seppälä, 2018; Egana-delSol and Flanders, 2019; Kloppenburg and Boekelo, 2019; Kolk and Ciulli, 2020).
Platforms can simultaneously influence transition and operational decisions of actors operating on the platform, both in terms of the business field being phased out of and the new niche area. For example, the power exchange center of China has been curbing the trading rate of fired power, by setting priorities that ensure renewable energy consumption2. Integrated energy service platforms can automatically make decisions and allocate task orders to specific providers, based on their ranking and comprehensive scores (Wang, 2019). Ranking and scoring, which are directly affected by the platform, influence the velocity of participants’ transactions. In these examples, as the platform can accelerate the velocity of transactions, actors can obtain profits from transactions at a higher speed. That is, the input resource can generate a faster increase in value. This leads to changes in an actor’s investment in different business fields and can impact the state of the actor’s transition. In this process, transaction velocity is closely related to the core concept of the “efficiency of value realization” (EVR3).
EVR is a key factor connecting an actor’s operations on a platform and an actor’s decision to transition. First, EVR, which measures an actor’s operational efficiency, is a conjunction between platform and actors. That is, EVR is used to measure the velocity at which the actor’s input4 gains an increase in value at a certain ratio5 through that platform. EVR is also used to describe the “service rate”6 of the platform from a service system perspective. Second, EVR influences an actor’s decision on transition because this “service rate” influences the actor’s response time7 and time-varying cost (the cost incurred during the response time). This consequently influences actor’s profit and investment decisions, which are associated with transition decisions.
In addition, EVR serves as a key factor for ST because the platform changes the actors’ transition decisions and behavior mainly in two ways. First, it directly affects the velocity of actors’ value realization by offering service and related rules. Second, its services change the actors’ business environment, impacting their utility. Overall, the influence from the platform to the actors’ business environment can be largely attributed to the impact on the EVR in each period; however, the influence varies over time. In summary, EVR is a key factor connecting the platform, the actor’s operation, and transition. This makes it important to study the influencing mechanism of EVR in the platform operation background in order to accelerate transition.
To analyze the relationship between EVR and transition, and explore a new way of managing ST in the platform economy, we addressed the following question: What is the mechanism shaping the effect of the EVR on the transition ratio8 in the background of the platform?
To explore this mechanism, we raised a second relevant question. In this relationship, how do two factors - value preference and platform maturity - change the effect of the EVR and affect the transition ratio, shaping the dynamic relationship? This question is raised based on two considerations.
First, when considering sustainable development, the government has a “preference” with respect to different actors’ activity and their output. This is usually measured by profit or the index of GDP. This preference is described as a “value preference”9. Through ST policies or government outreach, the social value preference is transmitted to the platform. As a result, the platform provides different services for different actors or projects forming different EVRs on the platform. Also, in response to the social value preference, actors form judgements about the importance of output from different business fields (actor’s value preference10), directly influencing their decision on transition.
Secondly, platform maturity11 is another important factor, because it is closely related to the effect of platform service. As the ability and influence of a platform grows stronger, the platform service is more powerful in changing EVR, and the effect of EVR on the transition dynamically changes. Thus, value preferences and platform maturity play an important role in the mechanism with respect to EVR and the transition ratio.
By answering these two questions, this study identifies an approach to co-governance between the government and the platform to accelerate the transition to sustainability. Specifically, by providing a mechanism that reflects the change in the transition ratio, it informs innovative policies with respect to value preference, platform growth, service level, efficiency of value increase, and actor behavior management during a transition.
The rest of this paper is structured as follows. The next section provides the literature review. Methodology presents the process of modeling using System Dynamics. Simulation Result provides a numerical analysis, using the transition of China’s power industry as an illustration. The last section concludes the paper.
Literature Review
Platform Maturity and Preference
Platform maturity and preference are two important factors influencing the platform’s service level and the effect of the platform service, respectively. First, platforms have social and environmental values (Martin et al., 2017) and make their own value judgments. Kloppenburg and Boekelo (2019) posited that platforms tend to generate exclusions. Platforms do this by making judgments about the right type of energy production and consumption, raising barriers for new entrants. The values are preset or hidden in the design process, as platforms are established based on an idea, concept, or certain requirements resulting from an analysis by platform operator (Abdelkafi et al., 2019). Platforms affect actors’ behavior by offering services, and their value judgments influence their service levels and further change actors’ operational efficiency (Xie and Jawad Sajid, 2019).
These studies highlight the presence of preferences and value judgements in the platform system, impacting the platform’s behavior and actor’s operation. However, the studies do not offer a method or tool for analyzing the influence on platform services and the actor’s operation in the context of ST. To fill this gap, we apply the concept of the “value preference” to describe the new decision criteria, including considerations of profit and sustainability. We also offer a tool to explain the decisions related to the platform, society, and the actor in the ST context.
Second, the effect of a platform service is influenced by its maturity. Kim et al. (2018) proposed that a platform experiences three stages in its development: the pre-platform stage, the transitioning stage, and the stabilizing stage. Gawer (2014) noted that the development stage of a platform should include: internal research and development, becoming a supply chain platform, and then becoming an industrial platform. Loux et al. (2020) classified the maturity level of a platform into the nascent stage and mature stage. That study noted that the platform can evolve from a two-sided platform at a nascent stage, bringing together merchants and buyers, to a mature multi-sided platform, bringing together application developers, banks, and advertisers (Loux et al., 2020). Mature and nascent platforms are mainly classified according to age and influence sales differently (Landsman and Stremersch, 2011). Lee (2019) described the maturity level of platform as follows: the start of construction, the perfection of function, the expansion of the application, the exploration in a certain industry, and the establishment of an ecosystem.
Most scholars agree that the platform’s maturity refers to its capability level and influence at different development stages. Because the development stage of a platform is often defined based on its capability and influence, the level of development stage is often consistent with its maturity level. In summary, the platform’s maturity reflects the level of its capability and influence. When the platform is at a higher stage and of greater maturity, it exerts a stronger effect on the market and stakeholders. At that point, measures taken by the platform generate more influence and as a result, it can significantly increase the actors’ operational efficiency.
In conclusion, the preference and maturity of the platform affect its service and the actor’s operation. Thus, they are considered to be key factors in the mechanism explored by this study.
Sustainability Transition Theory Related to Phasing Out Activities
Sustainability transition theory mainly discusses how transitions evolve over time and provides policy recommendations to support a progressive transition (Vincent et al., 2016). Widely applied sustainability transition theories include the theory of multi-level analysis and the theory of transition management. Multi-level analysis explains the transition process from three perspectives: niche, institution, and prospect (Geels, 2019; Geels et al., 2017; Köhler et al., 2019; Li and Strachan, 2019). The theory of transition management combines long-term thinking with short-term action (Lachman, 2013; Shum, 2017; Williams et al., 2017).
These theories offer an analytical framework for understanding sustainability transitions. Using a multi-level analysis, Vögele et al. (2018) highlighted possible phase-out pathways for coal-related technologies, highlighting that these processes are influenced by economic, political, technical elements, and social factors. Oei et al. (2020) illustrated the effects of different phase-out pathways for power plants, using an input-output model and regional macroeconomic model. Oei et al. (2019) pointed out that, from a macro perspective, a phase-out path can be jointly managed using a polycentric approach by city, regional, national, and international governments and institutions. Rosenbloom (2018) illustrated how ideas, interests, institutions, and infrastructure interact to create pathways that eliminate coal. Rentier et al. (2019) clarified the impact of different market economies on carbon lock-in and phase-out processes. Rentier et al. (2019) emphasized that strategic interactions, employment protections, government ownership, market price, and profit are important factors affecting a phase-out path. Gloria Baigorrotegui (2019) analyzed destabilizations over short periods, noting that the phasing-out mechanism is formed by three factors: pressure, obstruction, and public overflow to trace the activities. The sustainability transition theories relevant to the phase-out pathway demonstrate the framework, approaches, pathways, influencing factors, and policies. These inform a discussion about transition, considering different sides and factors. However, less attention has been paid to the effect of platform on sustainability transition and related mechanisms.
The Method of System Dynamics Used in Sustainability Transition
Many methodologies have been adopted to analyze the dynamic complex systems in the field of sustainability transition. Examples include extensive sensitivity analysis and Monte Carlo simulations (Banos-Gonzalez et al., 2018), scenario analyses based on the co-simulation method (El-Baz et al., 2019), the fuzzy cognitive mapping-system dynamics approach (Kokkinos et al., 2018; Pereira et al., 2020), differential equation modeling natural experiments (Curseu and Schruijer, 2020), agent-based modeling (Kieckhaefer et al., 2017; Shafiei et al., 2013), and system dynamics modeling (SD modeling) (Bautista et al., 2019, Cavicchi, 2018; Cosenz et al., 2020; Graziano et al., 2019, Papachristos, 2011; Tan et al., 2018).
Of these approaches, SD is a good method for reflecting the systemic interactions among variables (Tan et al., 2018), and is especially useful for analyzing feedback relationships. Ma and Hu (2018) combined SD and coupled game theory to analyze the eco-innovation mechanism and policy in the pulp and paper industry. Bautista et al. (2019) assessed biodiesel production based on a SD model and systems theory. Cavicchi (2018) analyzed the influence of power, institutions, and expectations on the bioenergy transition process by applying qualitative system dynamics and interviewing local actors. Cosenz et al. (2020) conceptualized an approach using dynamic business modeling for sustainability, combining an adapted sustainable business model canvas and system dynamics modeling. Kieckhäfer et al. (2017) studied the system of vehicle, energy, and consumers based on SD and agent modeling. Papachristos (2011) tested the dynamic consistency of the “Multi-Level Perspective” substitution pathway based on the MLP framework and SD modeling.
Two important applications of SD emerge from these studies. First, SD is usually used in mechanism analysis and framework building; one example is the model built by Cosenz et al. (2020). Second, SD is used in scenario simulations and to inform policy recommendations, as in the analysis given by Tan et al. (2018). SD modeling is often integrated with another method; this approach is also shown in this paper. That is, the framework and scenarios analyses in this paper are based both on SD and on the integration of queuing theory.
Studies focusing on platforms and sustainability transitions have consistently explored the ST or platform separately. Only a few papers have linked sustainability with the platform. Specifically, Paundra et al. (2020) studied the environmental impact of ridesharing platforms, based on the interplay of access-based and ownership-based consumption mechanisms. Kloppenburg and Boekelo (2019) and Kolk and Ciulli (2020) discussed the relationship between platform, energy system, and ST. Kolk and Ciulli (2020) also proposed a research agenda for the study of ST by linking society, platform, and actors. However, these theories do not consider the relationship between EVR and transition in the context of the platform. Further, none of these studies have analyzed the perspective of the platform queuing system. Finally, few studies have examined the relationship between ST, platform, society, and actors based on SD modeling and the time-based cost analysis. Based on the research agenda advanced by Kolk and Ciulli (2020) and theories about platform preference and maturity, this study focused on the dynamic mechanism between EVR on platform and transition ratio, considering the influence from value preference and platform maturity. This study applied the SD method to describe this complex feedback relationship.
Methodology
This study applied the method of system dynamics, which is a science that combines system science theory with simulations to study feedback structures and system behavior. The method complements the dominant multi-level perspective and the transition management approach, by providing a middle ground between emphasizing agency or structure (Vincent et al., 2016). Because there is feedback in this study’s transition model, system dynamics is an effective approach. The system dynamics method includes the following steps. First, the problem is articulated or conceptualized for a dynamic hypothesis. Second, the model is formulated. Third, the model is tested and analyzed (Espinoza et al., 2017; Homer, 2019). In the modeling process, Little’s Law in queuing theory is used to analyze the time-varying cost (transaction cost and opportunity cost) which relates to the platform service. The value preference is used to analyze the investment decision in the context of ST. This methodology is shown is Figure 1.
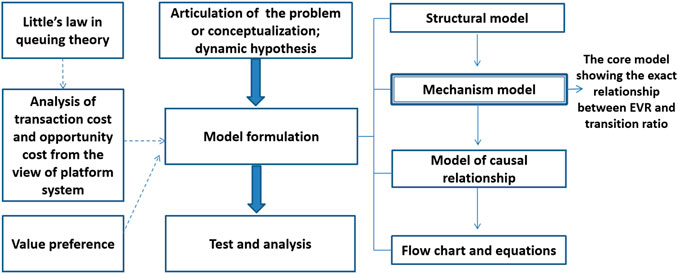
FIGURE 1. Research method.
Notations
To clarify the model and equations in this study, relevant notations are listed in Table 1.
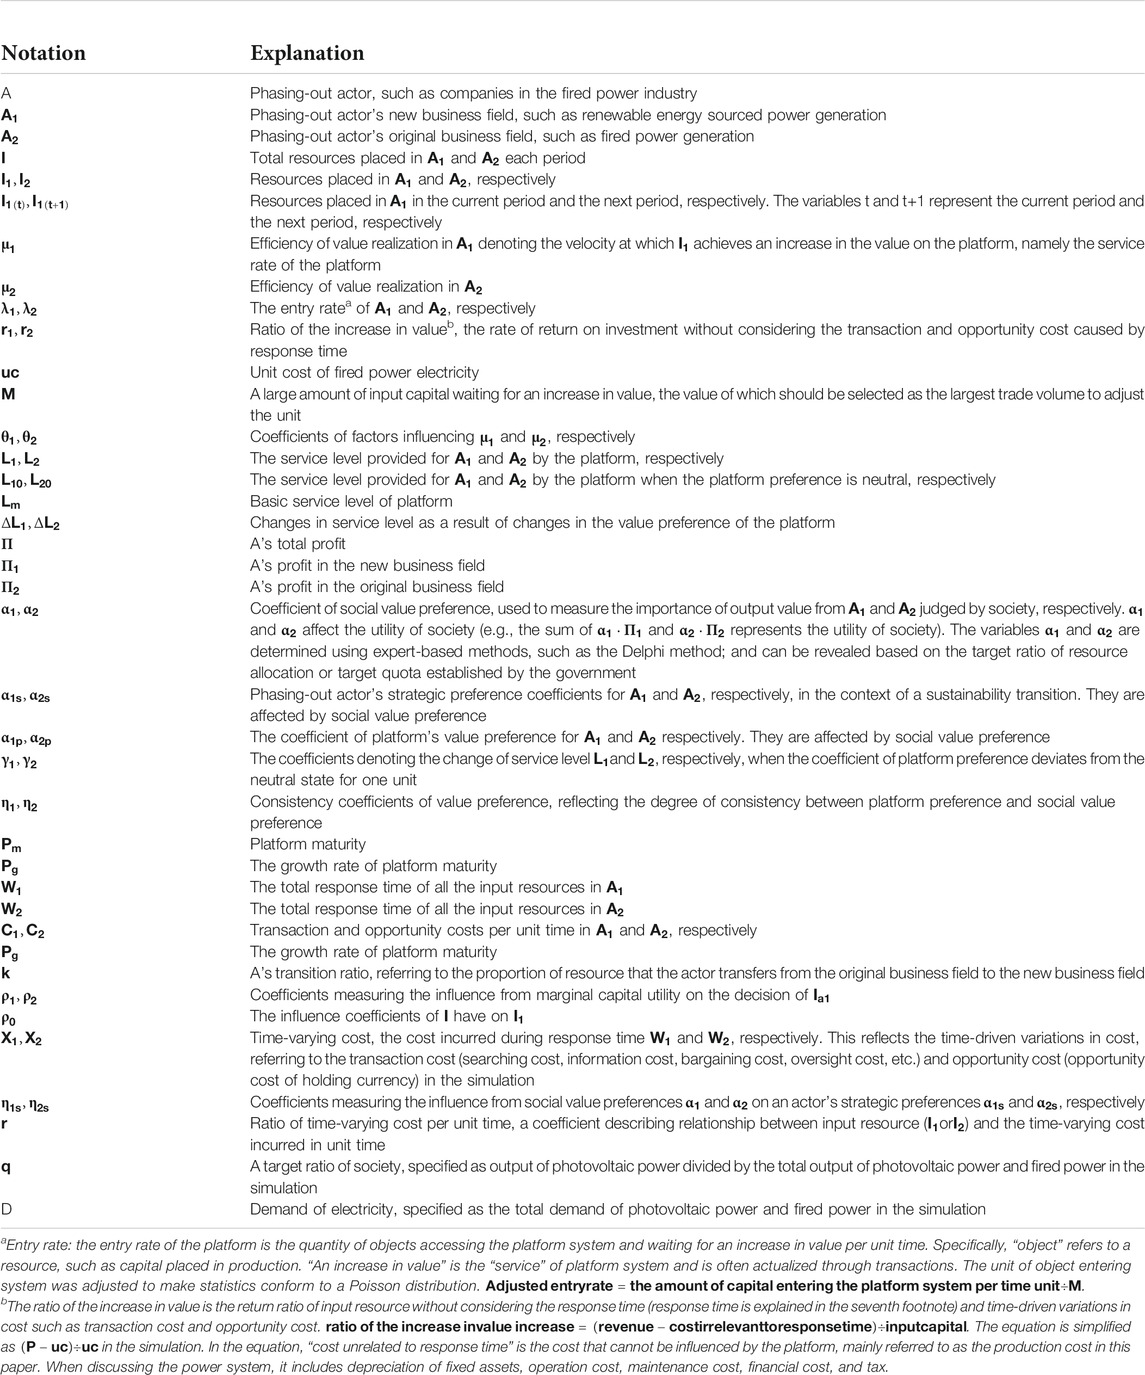
TABLE 1. Notation definitions.
Hypothesis and Model Boundary
The essence of the problem discussed in this paper is the relationship between the input resource, the increase in value of that resource, and the allocation of the resource in the background of the platform’s operation. This relationship can be described as a dynamic feedback event: an actor in transition invests resources in different fields. Based on the influence of the platform, the resources placed in different fields lead to increases in value at different EVRs, leading to different profit levels. Given the effects of the profit and value preference, the transition ratio emerges and influences a new round of resource investments.
To make the research about this relationship implementable, five hypotheses (H1–H5) are included in the model. H1: The actors in transition are considered as a whole (A). There are two kinds of business fields for the actor: a new business field (
The model boundaries were set as follows: A’s new business field (
The model boundaries and the overall relationship among the three parts are presented in the general structure in Figure 2. The main relationship between the three parts was as follows. The actor’s decision-making determines the transition ratio and the resource allocation between
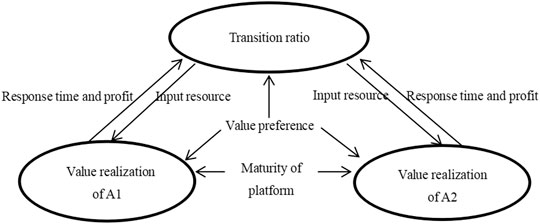
FIGURE 2. General structure.
Dynamic Feedback Mechanism Between EVR and Transition Ratio
The structural model shows the main constituents and general relationship in the transition system. However, the dynamic feedback mechanism between EVR and transition ratio is not precisely related. This is shown as the model illustrating the mechanism involved (Figure 3) and is explained as follows.
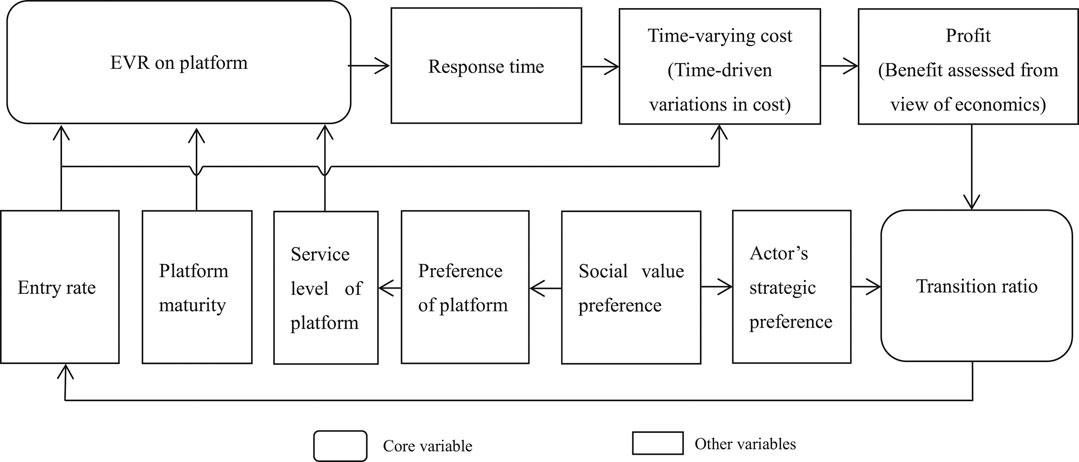
FIGURE 3. Model illustrating the mechanism between EVR and transition ratio.
First, a change in the EVR leads to a change in the transition ratio. The EVR is the consequence of a platform’s effect on an actor, however, it is also a driving force advancing the transition. The EVR is influenced by the platform service, platform maturity, and annual input resource. The EVR and entry rate determined the value of the response time (time of value realization). The response time has a direct relationship, with time-driven variations in costs, such as transaction and opportunity costs. Time-driven variations in cost influence profit, which affects resource allocation decisions and the transition ratio in the next period. The value preference impacts this relationship in two main ways. The social value preference affects the value preference of the platform, which is directly associated with the platform’s service level. Also, the social value preference affects the actor’s strategic preference, impacting the transition ratio.
Second, the transition ratio generates feedback, which causes this relationship dynamic. Changes in the transition ratio lead to changes in the resources invested into different fields, creating fluctuations in the entry rate. The change in the entry rate results in a change in the EVR. This is because the input resource and subsequent output commodities to be traded during each period are related to the number of objects ultimately traded each period (EVR). In addition, a change in the entry rate also causes changes in the time-driven variations in cost, because the quantity of input resources is closely associated with opportunity and transaction costs.
Design of Causal Relationship and Flow Chart
Causal relationships and the development of the flow chart are necessary steps in the simulation based on system dynamics. First, based on the general structure model and the model illustrating the mechanisms involved, the feedback relationships can be analyzed and a chart outlining the casual relationships can be generated. The model illustrating the mechanism illustrates three classes of feedback. The first class of feedback is “EVR → response time → time-varying cost → profit → transition ratio → input resource → entry rate → EVR.” This feedback relationship exists both in
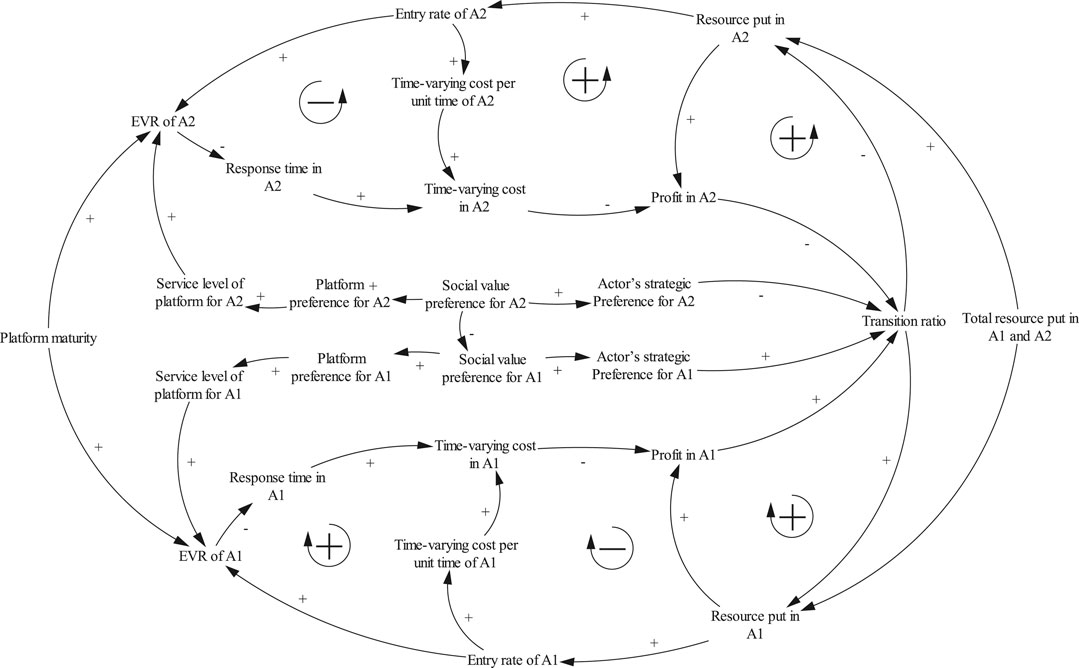
FIGURE 4. Causal relationship.
Second, based on the casual relationships, more detailed relationships of the factors are described using equations and a flow chart. The variables
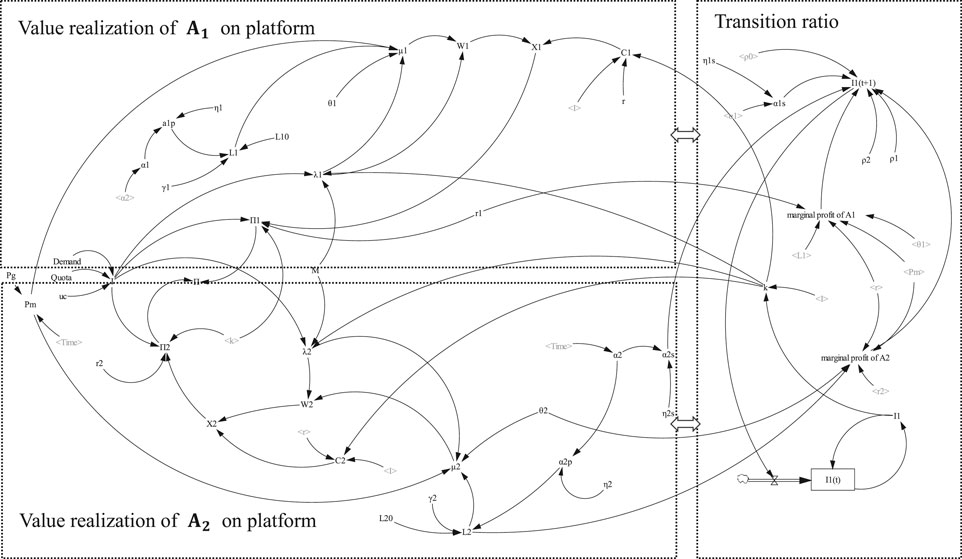
FIGURE 5. Flow chart.
Equations
Based on the structural model, relationship model, flow chart, and the chart of causal relationships, we developed equations related to the value realization and transition ratio.
Equations Relevant to Value Realization
Important variables related to value realization include EVR (
The EVR on the platform is associated with three factors. The first factor is
The second factor associated with EVR is the service level of the platform. Platform service refers to all the measures taken by a platform that influence the value realization of the actor’s input resource, specified as the transaction service in the simulation. The level of service is an assessment or planning level of the platform’s influence on different businesses, marked as level 1, level 2,…. The level of service can be estimated using information or recommended statistics (Xie and Jawad Sajid, 2019); rules used to prioritize different businesses; or indexes related to transaction services, payment service, or derivative services (Yu, 2017). A higher level of service reflects a beneficial influence given by the platform. If more objects are traded, there is a greater increase in the resource inputs and increased gains in the value. This leads to a higher EVR.
The third factor associated with EVR is
Service level (
These equations show that
The entry rate, response time, and cost are explained based on “Little’s Law” in queuing theory, as shown in Eqs. 8–13.
According to Little’s Law, key factors such as platform service, objects to be served, entry rate, and the service rate were first clarified and the response time was calculated. The platform service can be specifically described as “helping an actor’s invested resource gain an increase in value at a certain ratio.” For example, the service can be detailed as matching, sales promotion, coordination of operation, quality, or fame certification. The variables
For commodities such as electricity, society generally needs the supply. Thus, this study considered an electricity transaction system without congestion. The variable
Costs are described in Eqs. 12–15.
More goods to be traded and more resources awaiting an increase in value in one period led to higher transaction and opportunity costs in the period; as such,
In addition, two other formulas of
A’s profit is divided into two parts:
Equations Reflecting the Transition Ratio
The investment in
Factors on the right side of the equation are assigned a value in period t, that is, the value of the factors at the current time. The factor
An actor’s decision to invest in
The product of profit and preference “
Setting “
The transition ratio is a ratio of resource allocation. It describes the portion of resource transferred from an actor’s original field to a new field, as shown in Eq. 23.
Specific Equations of Value Preference
These equations do not discuss the concrete forms of
Only two business fields are discussed here (
Simulation Result
Description of the Simulation Environment
According to the feedback mechanism between EVR and the transition ratio that influences the platform and social value preference, as shown in Methodology, Figure 3, a numerical study was completed, taking the transition of China’s power system toward sustainability as the context. This allowed for the visual observation and exploration of the dynamic relationship of the above factors.
In China, it is important to promote the phasing-out of fossil-sourced power generation14. The Government has introduced a quota system to ensure that a proportion of electricity is generated for consumption using different energy sources15. Rules and policies provide better trading conditions for renewably sourced energy for electricity and ensure the speed of its transaction and consumption16. This creates competitive pressure on conventional power suppliers. All of this indicates that the government has different value preference with respect to different sourced power generations. Meanwhile, the platform creates pressure for fossil sourced power generators because of its inherent responsibilities and as a result of government rules. Founded in 2016, the platform was specified as the power trading center of China, and was a not-for-profit platform managed by state-owned power grid corporations17.
According to government rules, the power trading center ensures that the renewable energy sourced power is transacted and used first. It also facilitates the trading of non-fossil sourced energy power by setting bidding and trading rules. For example, the ranking rule was that when the seller’s price was the same, renewable energy sourced power was prioritized. Next, the power generated in a manner that benefitted energy conservation and environmental protection was prioritized. In addition, by offering a special platform service for trading the “power” of electricity generation, the trading center promoted the supply of electricity transferred from conventional fossil sourced power generators to renewable energy sourced power generators. These services promoted the production and consumption of non-fossil sourced power, somewhat hindered the use of fossil sourced power generator, and promoted the transformation of fossil-sourced power generators. In summary, both the government and this not-for-profit platform pressured fossil-sourced power generators. These power suppliers’ operational efficiency on the platform and the transition decisions were formed in this environment. How would these conventional power suppliers change their transition ratio in this environment, and how transition could be managed in this type of complex relationship was explored in the simulation.
In the simulation, the “phasing-out” actor A was specified as the collective group of fired power plants. The variable
Model Validation
A series of checks were performed to verify the applicability of the SD model: a structural check, extreme value check, reality check, sensitivity check, and unit check. First, the integral causal diagram and flow chart were checked according the mechanism and reality, and a unit check was also performed. The structure was consistent with the model description. Second, for the extreme value check and reality check, irregularities were not found in the system, as shown in Figures 6, 7 Third, the sensitivity check found that the transition ratio was not sensitive to “the ratio of time-varying cost per unit time” (r), as shown in Figure 8A. However, it is very sensitive to the ratio of the increase in value (
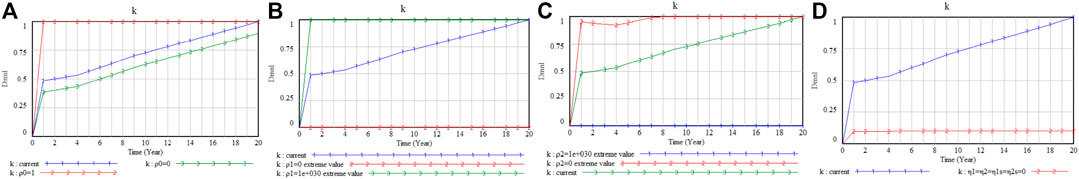
FIGURE 6. Extreme value check: (A) Extreme value check on ρ0; (B) Extreme value check on ρ1; (C) Extreme value check on ρ2; (D) Extreme value check on η1, η2, η1s and η2s.
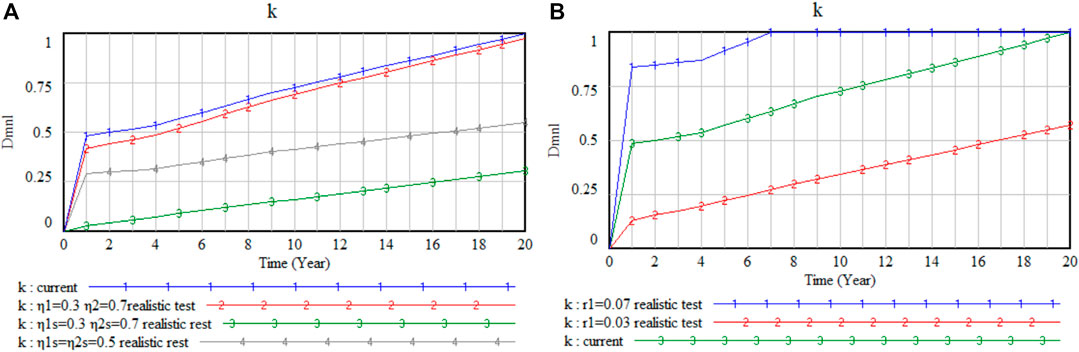
FIGURE 7. Reality check: (A) Reality check on η1, η2, η1s and η2s; (B) Reality check on r1.
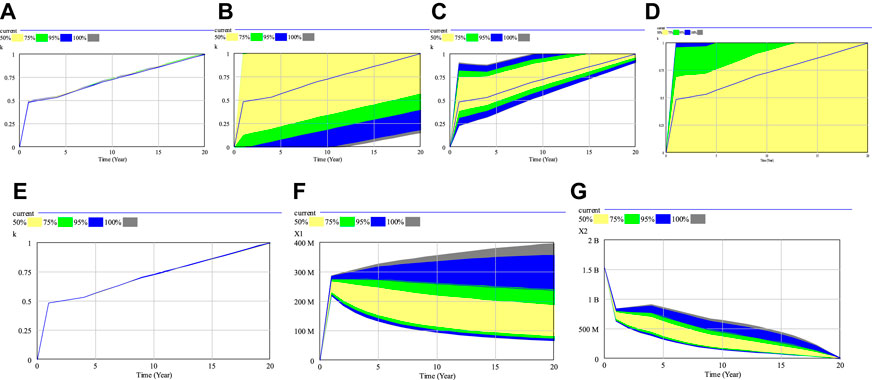
FIGURE 8. Sensitivity test: (A) Sensitivity test on r; (B) Sensitivity test on
Results and Discussion
After checking the model, the dynamic relationships among factors such as EVR and transition ratio were analyzed (Test 1). Then, the dynamic changes in the transition ratio (k) were analyzed when the EVR changed with the social value preference (Test 2). Finally, changes in the transition ratio were analyzed when the EVR changed with platform maturity (Test 3). The simulation results were as follows.
Test 1 Changes in the EVR, cost, and transition ratio in the current state.
The EVR and entry rate jointly affected the cost, profit, and transition ratio. Figures 9A–D shows that
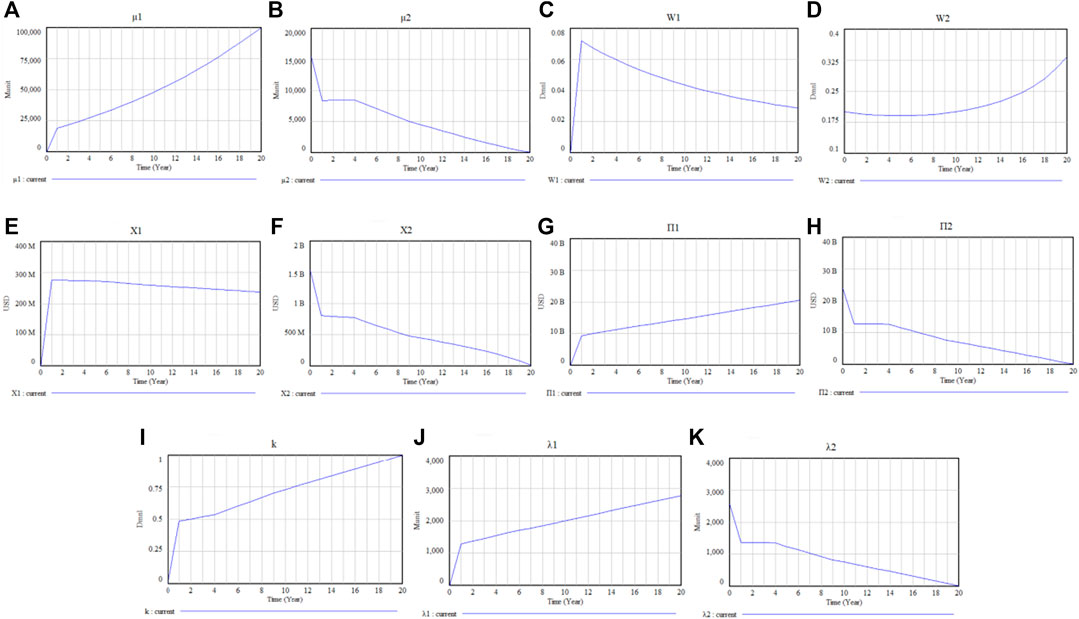
FIGURE 9. Dynamic relationship between EVR and transition ratio: (A) The trend of μ1; (B) The trend of μ2; (C) The change of W1; (D) The change of W2; (E) The change of X1; (F) The change of X2; (G) The change of Π1; (H) The change of Π2; (I) The change of k; (J) The change of λ1; (K) The change of λ2.
To reduce the cost in
Test 2 Preference varies causing the effect of EVR on transition ratio to change.
The social value preference can be changed using approaches such as implementing phasing-out policies. Changes in the relevant variables were seen when the initial values of
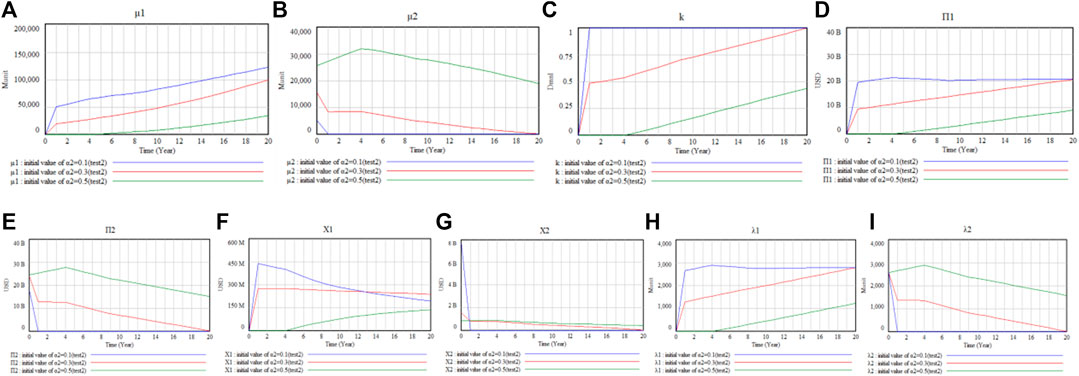
FIGURE 10. Changes in the factors as preference varies: (A) The change of μ1; (B) The change of μ2; (C) The change of k; (D) The change of Π1; (E): The change of Π2; (F) The change of X1; (G) The change of X2; (H) The change of λ1; (I) The change of λ2.
Test 3 With different platform maturity, the state of transition varies.
The transition state was tested when

TABLE 2. The value of transition ratio with different values of
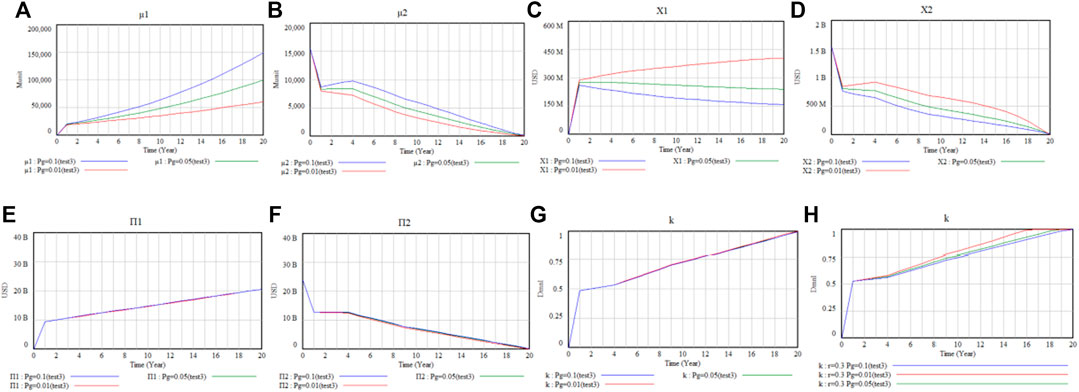
FIGURE 11. Changes in the factors as platform maturity varies: (A) The change of μ1; (B) The change of μ2; (C) The change of X1; (D) The change of X2; (E) The change of Π1; (F) The change of Π2; (G) The change of k; (H) The change of k.
Further Discussion and Policy Implications
Further Discussion
The results of each test were discussed in Results and Discussion; however, there remain issues related to multiple tests or equations that deserve further discussion. In addition, the analysis highlights a number of policy implications.
First, according to Test 2 and Test 3, improvements in the EVR for
Second, Eqs. 20, 23 indicate that marginal profit
and
These expressions are directly related to the transition ratio. From the view of a queuing system,
Third, the simulation specified actor A as the collective representation of phasing-out actors. However, the framework that analyzed the preference, an actor’s resource allocation, and the platform system could also be used to analyze a special actor’s transition. Ultimately, the transition ratio is, in essence, a resource allocation ratio, and the platform is a system which can record the entry rate and service rate. As such, the feedback mechanism of the transition ratio can be used to explain other problems related to resource allocations, if the entry rate of the input resource and service rate of the operation system can be recorded or estimated.
Policy Implications
Based on these results and discussions, this section proposes policies for better managing ST. First, the government should analyze changes in time-varying cost, profit, and transition ratios by observing and estimating the EVR and the entry rate, with the help of platform information systems. Based on this, incentive measures can be used to adjust the value preference. The efficiency of value realization and platform growth can be simulated, compared, and selected to maintain changes in the transition ratio within an acceptable range. The result can be predicted by analyzing the change in the transition ratio given the mechanisms described in this study.
Second, the government can help form appropriate social value preferences taking measures such as phasing-out policies, financial policies, consumption policies, and outreach. Also, the government should effectively transmit preferences to platforms and actors and encourage them to conform to expected preferences to accelerate transition.
In addition, platforms should be guided to set reasonable rules and service levels, consistent with expectations about social value preferences and with a coherent transition strategy. For example, platforms may offer new queuing or ranking rules which do not benefit the low qualified actors who are phasing-out. Meanwhile, they could offer services that help phasing-out actors to enter and operate in
Conclusion
This study explored the mechanisms associated with EVR, time-varying costs, actors’ resource allocation, and the transition ratio. Co-governance measures were also explored.
First, sustainability transitions were found to be influenced by EVR and entry rate, especially the ratio reflecting the “reciprocal of traffic intensity.” By improving EVR in
Second, the value preference transmitted from the government to the platform and actor played an important role in determining the effect of EVR on the transition. When the social value preference for
Third, both the EVR of
The main contributions of this paper are as follows. First, the study illustrated the analysis path from the EVR on a platform to the transition ratio during the dynamic change of multiple factors. This allowed for a model to be established that illustrated an actor’s operation and investment decisions, amidst the background of a digital platform economy and sustainability transitions. Second, the EVR and time-driven variations in costs, such as transaction and opportunity costs, were analyzed from the new perspective of the platform service system. Little’s Law was used to analyze those costs. This extended the application of queuing theory to investments, transaction costs, and transitions to sustainability. It also linked the method of SD with another field, involving stochastic methods. For research on the platform-driven economy, the problem of judging the efficiency and value of digital service may be solved from a new perspective (the value increase of object) and by a new tool (EVR and response time). Third, the transmission of value preference was integrated into the framework of analysis with respect to ST. By introducing the “value preference” to the field of ST, profit was converted into utility, impacting transition decisions. The coefficient of value preference was introduced to describe evaluations about the utility of output, wealth creation, and the increase in the value of a resource. This ST mechanism, which considers value preferences, may reflect the first attempt in this new field to manage value preferences and the relevant resource allocations through co-governance with digital platforms. Such an exploration of the mechanisms involved in value preference and in public affairs such as ST may contribute to reducing the negative effects of a purely profit-driven market mechanism.
Some limitations remain in this study’s model. For example, the model did not consider competition when analyzing the EVR. The transition of the power system in China was used as an example for the simulation. As such, the problems of power peaks and valleys were assumed to be addressed using the social power system, and the power products were considered to be nearly homogeneous. However, when products are heterogeneous, the EVR is affected by operations and competition. In other words, if competition is considered, a relatively low cost may lead to a higher EVR. This study, in contrast, assumed a stable competitive environment. In the future, the function of EVR could be expanded, and correlative factors such as production and operation could be included to address other transition problems in a different context. In addition, the study simulation only considered the situation where the social value preference could be effectively transferred to the platform and the actor. When the consistency coefficient of value preference varies, relevant variables also change.
Future research should include a multi-platform analysis. In addition, the relationship between the EVR and transition ratio could be studied in a more specific way, by considering production and operational conditions on specific platforms, or by discussing specific policies and actors. This could help explore more concrete policies for sustainability transitions.
Data Availability Statement
The original contributions presented in the study are included in the article/Supplementary Material, further inquiries can be directed to the corresponding author.
Author Contributions
JX: Conceptualization, software, writing TL: Conceptualization, supervision, funding acquisition PT and YL: Supervision and editing XL: Software QL and MS: Editing.
Funding
The Fundamental Research Funds for the Central Universities under grant agreement No. 2020ZDPYMS42 and No. DUT17RW132. Anhui provincial government in China for the Quality Engineering Project under grant agreement No. 2019cxtd075 and No. 2020sjjd009. Anhui provincial government in China for the Humanities and Social Sciences Research Fund under grant agreement No. SK2020A0835.
Conflict of Interest
The authors declare that the research was conducted in the absence of any commercial or financial relationships that could be construed as a potential conflict of interest.
Acknowledgments
The authors would like to acknowledge the discussions with Professor Donglan Zha from the Nanjing University of Aeronautics and Astronautics. We also gratefully acknowledge the reviewers' valuable advice.
Appendix
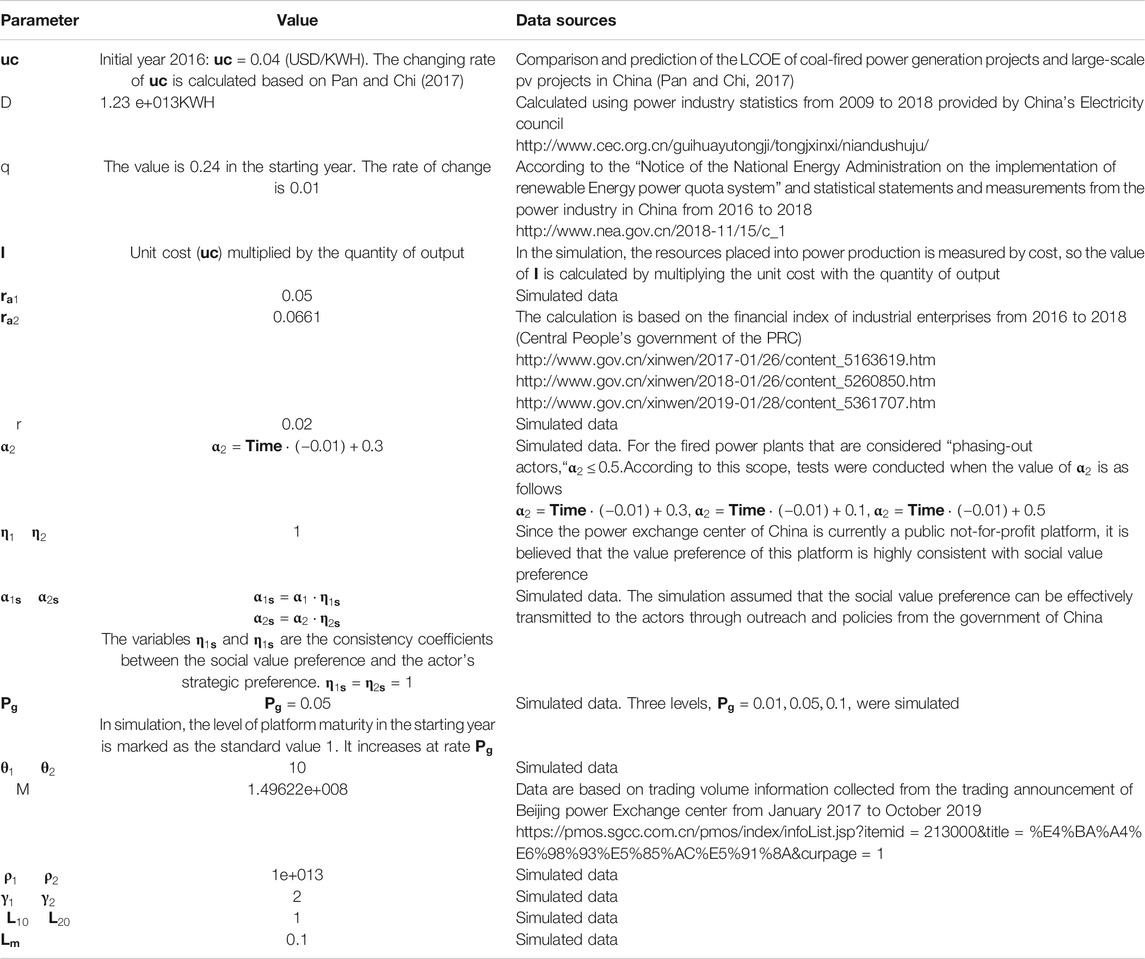
TABLE A1. Value of the parameters in numerical study.
Footnotes
1The platform, which usually exists in the form of a trading market, is a system that allows participants to engage in value-adding activities, and serves as a digital economics organizer with economic and value goals. These platforms can connect, match, design, coordinate, and oversee the market, accelerating innovation and value creation, and influencing the operation of platform-based actors. Source: Egana-delSol PA and Flanders S. 2019. Platform economy and sustainable energy. In: Leal Filho W, Azul AM, Brandli L, et al. (Eds), Affordable and clean energy. Springer International Publishing, Cham, pp.1-9, Mattila J and Seppälä T. 2018. Distributed governance in multi-sided platforms: A conceptual framework from case: Bitcoin. In: Smedlund A, Lindblom A and Mitronen L (Eds), Collaborative value co-creation in the platform economy. Springer, Singapore, pp.183-205.
2Notice on Issuing the Rules for the Implementation of Middle-term and Long-term Transactions across Regions and Provinces in Beijing Power Exchange Center. No .51[2018].http://www.bj-px.com.cn/html/main/col14/2018-08/30/20180830102119626314055_1.html.
3EVR is the amount of objects that gains an increase in value per unit time. “EVR on a platform” is the velocity of the increase in an actor’s value on a platform.
4The “input” can be capital, product, resources, or affairs to be dealt with.
5This ratio is an achievable or target percentage called the “ratio of an increase in value” which is described in notations (Table 1). For example, if 50% of the input capital
6The platform service is an “increase in value” detailed as a transaction or management service. The velocity of the increase in value is the quantity of objects being served by the platform system per unit time. Thus, the efficiency of platform-based value realization discussed in this study is the same as the platform’s service rate.
7Response time: In queuing theory, response time refers to the time between customer arrival and the completion of service, or the total time when a customer stays in the system. In this study, response time is defined as the time of value realization, or the time when the resources that receive added value stay in the system. More specifically, it is the time when the resource passes through a platform system to achieve an increase in value at certain ratio. In a broad sense, it is the time when goals can be achieved through the system.
8The actor’s decision about investments in different business fields shapes the transition ratio. This ratio is the proportion of a resource that an actor in transition transfers from the original business field to a new business field.
9Value preference refers to the evaluation on the importance of profit or output value coming from different value creation activities. The evaluation is made under certain values and criterions. Under the value preference, the wealth originally measured by money and labor time changes according to an assessment of “importance” and becomes the utility value. Under a certain value preference, policies or measures exerted on favored and unsupported fields will differ. It is measured by the coefficient of value preference, shown as notations of
10The value preference discussed in this paper includes the value preference of society, that of platform, and that of the actor. The societal preference is also called social value preference in this paper, while the actor’s preference is also called strategic preference.
11Platform maturity refers to the capability and influence of platform at different development stages.
12“Object” can be goods, resource, capital, or other items waiting to gain value by the operation on the platform. It is specified as the input resource, measured in production cost in simulation.
13Notice on Issuing the Rules for the Implementation of Middle-term and Long-term Transactions across Regions and Provinces in Beijing Power Exchange Center. No. 51 [2018]. http://www.bj-px.com.cn/html/main/col14/2018-08/30/20180830102119626314055_1.html.
14The Energy Administration, together with the Development and Reform Commission, issued “Suggestions on further promoting supply-side structural reform and further eliminating backward coal-sourced power generator to promote the optimization and upgrading of coal and electricity industry” No. [2019]431 (http://www.nea.gov.cn/2020-05/22/c_139077597.htm).
15Notice of the National Energy Administration on the Implementation of Renewable Energy Power Quota System (http://www.nea.gov.cn/2018-11/15/c_1)
16Circular of the Energy Bureau of the National Development and Reform Commission (NDRC) on the mechanism of consumption and security for renewable energy sourced electricity. NDRC [2019] No. 807 (http://zfxxgk.ndrc.gov.cn/web/iteminfo.jsp?id=16176).
17The platform is responsible for the construction and operation of the electricity market, the implementation of national policies, the conduct of electricity transactions, the promotion of clean energy consumption, and the future development of electricity financial transactions; it is also responsible for making basic rules for electricity transactions in cooperation with relevant government departments; and the establishment of technical, operational and management standards for the electricity market.
18The platform is responsible for the construction and operation of the electricity market, the implementation of national policies, the conduct of electricity transactions, the promotion of clean energy consumption, and the future development of electricity financial transactions; it is also responsible for making basic rules for electricity transactions in cooperation with relevant government departments; and the establishment of technical, operational and management standards for the electricity market.
References
Abdelkafi, N., Raasch, C., Roth, A., and Srinivasan, R. (2019). Multi-sided platforms. Electron. Mark. 29, 553–559. doi:10.1007/s12525-019-00385-4
Banos-Gonzalez, I., Martínez-Fernández, J., Esteve-Selma, M. Á., and Esteve-Guirao, P. (2018). Sensitivity analysis in socio-ecological models as a tool in environmental policy for sustainability. Sustainability. 10(8), 2928. doi:10.3390/su10082928
Bautista, S., Espinoza, A., Narvaez, P., Camargo, M., and Morel, L. (2019). A system dynamics approach for sustainability assessment of biodiesel production in Colombia. Baseline simulation. J. Clean. Prod. 213, 1–20. doi:10.1016/j.jclepro.2018.12.111
Cavicchi, B. (2018). The burden of sustainability: limits to sustainable bioenergy development in Norway. Energy Policy. 119, 585–599. doi:10.1016/j.enpol.2018.05.015
Cosenz, F., Picanco Rodrigues, V., and Rosati, F. (2020). Dynamic business modeling for sustainability: exploring a system dynamics perspective to develop sustainable business models. Business Strategy Enviro. 29 (2), 651–664. doi:10.1002/bse.2395
Curseu, P. L., and Schruijer, S. G. L. (2020). Participation and goal achievement of multiparty collaborative systems dealing with complex problems: a natural experiment. Sustainability. 12 (3), 987. doi:10.3390/su12030987
Egana-delSol, P. A., and Flanders, S. (2019). “Platform economy and sustainable energy,” in Affordable and clean energy. Editors W. Leal Filho, A. M. Azul, L. Brandliet al. (Cham: Springer International Publishing), 1–9.
El-Baz, W., Tzscheutschler, P., and Wagner, U. (2019). Evaluation of energy market platforms potential in microgrids: scenario analysis based on a double-sided auction. Front. Energy Res. 7, 13. doi:10.3389/fenrg.2019.00041
Espinoza, A., Bautista, S., Narváez, P. C., Alfaro, M., and Camargo, M. (2017). Sustainability assessment to support governmental biodiesel policy in Colombia: a system dynamics model. J. Clean. Prod. 141, 1145–1163. doi:10.1016/j.jclepro.2016.09.168
Gawer, A. (2014). Bridging differing perspectives on technological platforms: Toward an integrative framework. Res. Pol. 43 (7), 1239–1249. doi:10.1016/j.respol.2014.03.006
Geels, F. W., Sovacool, B. K., Schwanen, T., and Sorrell, S. (2017). The socio-technical dynamics of low-carbon transitions. Joule. 1 (3), 463–479. doi:10.1016/j.joule.2017.09.018
Geels, F. W. (2019). Socio-technical transitions to sustainability: a review of criticisms and elaborations of the multi-level perspective. Curr. Opin. Environ. Sustainability. 39, 187–201. doi:10.1016/j.cosust.2019.06.009
Gloria Baigorrotegui, B. (2019). Destabilization of energy regimes and liminal transition through collective action in Chile. Energy Res. Soc. Sci. 55, 198–207. doi:10.1016/j.erss.2019.05.018
Graziano, M., De Groot, G. S., Daniela Pilato, L., and Laura Sánchez, M. (2019). Fostering urban transformations in Latin america: lessons around the ecological management of an urban stream in coproduction with a social movement (buenos aires, Argentina). Ecol. Soc. 24. doi:10.5751/es-11226-240413
Homer, J. (2019). Best practices in system dynamics modeling, revisited: a practitioner's view. Syst. Dynam. Rev. 35, 177–181. doi:10.1002/sdr.1630
Kieckhäfer, K., Wachter, K., and Spengler, T. S. (2017). Analyzing manufacturers' impact on green products' market diffusion - the case of electric vehicles. J. Clean. Prod. 162, S11–S25. doi:10.1016/j.jclepro.2016.05.021
Kim, H., Lee, D., and Hwang, J. (2018). The effect of online platform maturity on the efficiency of offline industry. Telematics Inf. 35, 114–121. doi:10.1016/j.tele.2017.10.003
Kloppenburg, S., and Boekelo, M. (2019). Digital platforms and the future of energy provisioning: Promises and perils for the next phase of the energy transition. Energy Res. Soc. Sci. 49, 68–73. doi:10.1016/j.erss.2018.10.016
Köhler, J., Geels, F. W., Kern, F., Onsongo, E., Wieczorek, A., Alkemade, F., et al. (2019). An agenda for sustainability transitions research: state of the art and future directions. Environ. Innovation Societal Transitions. 31, 1–32. doi:10.1016/j.eist.2019.01.004
Kokkinos, K., Lakioti, E., Papageorgiou, E., Moustakas, K., and Karayannis, V. (2018). Fuzzy cognitive map-based modeling of social acceptance to overcome uncertainties in establishing waste biorefinery facilities. Front. Energy Res. 6, 25. doi:10.3389/fenrg.2018.00112
Kolk, A., and Ciulli, F. (2020). The potential of sustainability-oriented digital platform multinationals: a comment on the transitions research agenda. Environ. Innovation Societal Transitions. 34, 355–358. doi:10.1016/j.eist.2019.12.008
Lachman, D. A. (2013). A survey and review of approaches to study transitions. Energy Policy. 58, 269–276. doi:10.1016/j.enpol.2013.03.013
Landsman, V., and Stremersch, S. (2011). Multihoming in two-sided markets: an empirical inquiry in the video game console industry. J. Mark. 75 (6), 39–54. doi:10.1509/jm.09.0199
Lee, J. (2019). Assessment research on industrial internet platform from the maturity aspect. Sci. Technol. Manage. Res. 39, 43–47. doi:10.3969/j.issn.1000-7695.2019.02.007
Li, F. G. N., and Strachan, N. (2019). Take me to your leader: using socio-technical energy transitions (stet) modelling to explore the role of actors in decarbonisation pathways. Energy Res. Soc. Sci. 51, 67–81. doi:10.1016/j.erss.2018.12.010
Loux, P., Aubry, M., Tran, S., and Baudoin, E. (2020). Multi-sided platforms in b2b contexts: the role of affiliation costs and interdependencies in adoption decisions. Ind. Market. Manag. 84, 212–223. doi:10.1016/j.indmarman.2019.07.001
Ma, L., and Hu, J. (2018). An analysis of the eco-innovation mechanism and policies in the pulp and paper industry based on coupled game theory and system dynamics. Sustainability. 10 (10), 3482. doi:10.3390/su10103482
Martin, C. J., Upham, P., and Klapper, R. (2017). Democratising platform governance in the sharing economy: an analytical framework and initial empirical insights. J. Clean. Prod. 166, 1395–1406. doi:10.1016/j.jclepro.2017.08.123
Mattila, J., and Seppälä, T. (2018). “Distributed governance in multi-sided platforms: a conceptual framework from case: Bitcoin,” in Collaborative value co-creation in the platform economy. Editors A. Smedlund, A. Lindblom, and L. Mitronen (Singapore: Springer), 183–205.
Oei, P-Y., Hermann, H., Herpich, P., Holtemöller, O., Lünenbürger, B., and Schult, C. (2020). Coal phase-out in Germany-implications and policies for affected regions. Energy. 196, 1–19. doi:10.1016/j.energy.2020.117004
Oei, P-Y., Brauers, H., and Herpich, P. (2019). Lessons from Germany’s hard coal mining phase-out: policies and transition from 1950 to 2018. Clim. Pol. 20 (8), 963–979. doi:10.1080/14693062.2019.1688636
Pan, Y., and Chi, D. (2017). Comparison and prediction of the lcoe of coal-fired power generation projects and large-scale pv projects in China. Sino Global Energy. 22, 1–7 [In Chinese]. Available at: https://www.cnki.net/.
Papachristos, G. (2011). A system dynamics model of socio-technical regime transitions. Environ. Innovation Societal Transitions. 1 (2), 202–233. doi:10.1016/j.eist.2011.10.001
Paundra, J., van Dalen, J., Rook, L., and Ketter, W. (2020). Ridesharing platform entry effects on ownership-based consumption in Indonesia. J. Clean. Prod. 265, 121535. doi:10.1016/j.jclepro.2020.121535
Pereira, I. P. C., Ferreira, F., Pereira, L. F., and Govindan, K., Meidutė-Kavaliauskienė, L., and Correia, R. J. C. (2020). A fuzzy cognitive mapping-system dynamics approach to energy-change impacts on the sustainability of small and medium-sized enterprises. J. Clean. Prod. 256. doi:10.1016/j.jclepro.2020.120154
Rentier, G., Lelieveldt, H., and Jan Kramer, G. (2019). Varieties of coal-fired power phase-out across europe. Energy Policy. 132, 620–632. doi:10.1016/j.enpol.2019.05.042
Rosenbloom, D. (2018). Framing low-carbon pathways: a discursive analysis of contending storylines surrounding the phase-out of coal-fired power in ontario. Environ. Innovation Societal Transitions. 27, 129–145. doi:10.1016/j.eist.2017.11.003
Shafiei, E., Ingi Ásgeirsson, E., Davidsdottir, B., and Stefansson, H. (2013). Integrated agent-based and system dynamics modelling for simulation of sustainable mobility. Transport Rev. 33 (1), 44–70. doi:10.1080/01441647.2012.745632
Shum, K. L. (2017). Renewable energy deployment policy: a transition management perspective. Renew. Sustain. Energy Rev. 73, 1380–1388. doi:10.1016/j.rser.2017.01.005
Tan, Y., Jiao, L., Shuai, C., and Shen, L. (2018). A system dynamics model for simulating urban sustainability performance: a China case study. J. Clean. Prod. 199, 1107–1115. doi:10.1016/j.jclepro.2018.07.154
Vincent, d. G., Rouwette, E., van Kranenburg, H., Freeman, E., and van Breen, H. (2016). Sustainability transition dynamics: towards overcoming policy resistance. Technol. Forecast. Soc. Change. 111, 135–145. doi:10.1016/j.techfore.2016.06.019
Vögele, S., Kunz, P., Rübbelke, D., and Stahlke, T. (2018). Transformation pathways of phasing out coal-fired power plants in Germany. Energy Sustainability Soc. 8, 25. doi:10.1186/s13705-018-0166-z
Wang, Z. (2019). Research on building synthesis energy ecological platform for large⁃scale network collaboration and data intelligent application. Power Demand Side Manage. 21, 77–82. doi:10.3969/j.issn.1009-1831.2019.04.016
Williams, A., Kennedy, S., Philipp, F., and Whiteman, G. (2017). Systems thinking: a review of sustainability management research. J. Clean. Prod. 148, 866–881. doi:10.1016/j.jclepro.2017.02.002
Xie, J., and Jawad Sajid, M. (2019). Utility evaluation index system of cross border e-commerce platform and the innovation of service and strategy. J. Jiangnan Univ. Humanit. Soc. Sci. Ed. 18, 97–107 [In Chinese]. Available at: https://kns.cnki.net/kcms/detail/detail.aspx?dbcode=CJFD&filename=WXQS201902014&dbname=CJFDLAST2019.
Yu, G. (2017). Evaluation e-commerce service level based on variable basis analysis method. Oper. Res. Manage. Sci. 26, 163–184 [In Chinese]. Available at: https://www.cnki.net/.
Keywords: sustainability transition, efficiency of value realization, value preference, time-varying cost, platform maturity
Citation: Xie J, Lv T, Tong P, Li X, Lu Y, Sajid MJ and Lv Q (2021) How Does the Efficiency of Value Realization on a Platform Influence Sustainability Transition? A Case of the Power Industry in China. Front. Energy Res. 8:616124. doi: 10.3389/fenrg.2020.616124
Received: 11 October 2020; Accepted: 28 December 2020;
Published: 19 February 2021.
Edited by:
Xu Tang, China University of Petroleum, ChinaReviewed by:
Jiahai Yuan, North China Electric Power University, ChinaXin Cao, China University of Petroleum, China
Copyright © 2021 Xie, Lv, Tong, Li, Lu, Sajid and Lv. This is an open-access article distributed under the terms of the Creative Commons Attribution License (CC BY). The use, distribution or reproduction in other forums is permitted, provided the original author(s) and the copyright owner(s) are credited and that the original publication in this journal is cited, in accordance with accepted academic practice. No use, distribution or reproduction is permitted which does not comply with these terms.
*Correspondence: Tao Lv, dGFvY3VtdEBjdW10LmVkdS5jbg==