 Rui Yong1
 Ming-Hui Li
- 1Unconventional Oil-Gas Science and Technology Research Institute, China University of Petroleum, Beijing, China
- 2Shale Gas Research Institute, PetroChina Southwest Oil & Gas Field Company, Chengdu, China
- 3PetroChinaTarim Oil & Gas Field Company, Xinjiang, China
Horizontal wellswith multi-cluster fracturing technology is an effective approach to exploit unconventional hydrocarbon reservoirs. The on-site diagnosis results indicate that multi-cluster fractures always tend to propagate unevenly due to stressinterference, therefore it is very essential to study the effect of fracturing parameters on fracture propagation unevenness. In this paper, the unconventional fracturing model (UFM, Unconventional Fracturing Model) is used to study the effect of multi-cluster fracturing parameters on fracture unevenness in a large stage. This model has been validated with the actual fracturing case on-site in the Longmaxi shale. The investigated parameters include completion parameters (cluster spacing, number of perforations per cluster), pumping parameters (fluid injection intensity and proppant injection intensity). Our simulation results show that firstly reducing fracture spacing will increase stress interference, andhydraulic fractures exhibit a “radial” pattern. Secondly, reducing the perforation number of a single cluster can promote the more uniform propagation of multi-cluster fractures. Thirdly, increasing the fluid injection intensity will increase the fracture length, but will also increase the fracture unevenness. Besides, the injection strength of the proppant has a little effect on the average fracture length and the unevenness of the fracture length. Finally, setting a reasonable cluster spacing and injection fluid strength can obtain a more uniform fracture propagation. Meanwhile reducing the number of perforations per cluster can also reach the goal of propagating evenly. This paper provides a certain reference for the optimization of multi-cluster fracturing parameters in large-stage and multi-cluster wells.
Introduction
The unconventional reservoirs such as shale have nanoscale pore-spaces and very low permeability, so the traditional reservoir stimulation methods cannot satisfy their commercial exploitation (Jia et al., 2012). In recent decades, horizontal well drilling with multi-cluster fracturing technology has become the mainstream technology for the exploitation of unconventional reservoirs.
The implementation of this technology is to shoot multi-cluster perforations in the casing of a horizontal well and then to inject high-rate and high-pressure fracturing fluid into the wellbore. Multiple hydraulic fractures can initiate and propagate simultaneously, which increases the stimulation volume and greatly improves reservoir seepage conditions (Chen et al., 2010; Wu et al., 2011a, b).
With the increase in the burial depth of shale gas reservoirs, problems such as complex stratigraphic structure and large in-situ stress differences will emerge in the reservoirs, which makes it difficult to form multiple uniform and effective hydraulic fractures in the target formation (Xie, 2018; Xie et al., 2019; Ma et al., 2020). With the background of the low oil prices, the large-stage multi-cluster fracturing technology, increasing the stage length to reduce the amount of bridge plugs and reducing the cluster spacing to improve the reservoir contact, is the key technology to reduce the cost and improve production (Fan et al., 2019). However, recent studies have shown that reducing fracture spacing will perform stronger stress interference and more uneven fracture length are obtained (Pan et al., 2014; Zhao et al., 2015; Li et al., 2017; Zhou et al., 2019). Pan et al. (2014) established a three-dimensional finite element model to simulate the simultaneous propagation of multiple fractures in horizontal wells. Their results show that the number of perforation clusters and fracture spacing is the main factors affecting fracture propagation. The closer perforation clusters are distributed, the more serious the stress interference in one stage can be obtained. Zhao et al. (2015) established the simultaneous propagation model of multiple fractures using the displacement discontinuity method, and they studied the influence of the stress interference between fractures on the local stress field and initial fracture pressure. Their results show that induced stress may lead to the asymmetric propagation of the two wings of the fractures. Li et al. (2017) studied the influence of perforation erosion on the fracture propagation of multiple clusters by a comprehensive model that couples perforation erosion effect and hydraulic fracture propagation. Their results show that the proppant in the sand slurry will destroy the perforations, resulting in a huge limit-entry capacity reduction, which in turn leads to a wider variation among the length of fractures in one stage. Liu et al. (2020) explored multi-fracture propagation in shale strata based on the Lattice model, and their results show that middle fractures are suppressed by other adjacent fractures. Fracture spacing and in-situ stress difference are the key parameters to keep uniform fracture length from their results. Meanwhile their results (Liu et al., 2019) show that the application of zipper fracturing technology increases SRV when two horizontal wells exist. These above studies indicate that uneven fracture propagation is very common during the propagation of multiple fractures.
In multi-cluster fracturing field operations in the large stages, fracturing fluids with temporary plugging agents are usually used to plug the over-treated fractures and promote the uniform propagation of multi-cluster fractures (Wang et al., 2018; Murphree et al., 2020; Zhou et al., 2020). Zhou et al. (2020) studied the effect of temporary plugging ball on fracture propagation using a fully coupled model of “wellbore-perforation-fracture propagation” based on the boundary element method. Their results show that the addition of temporary plugging agents helps to improve the non-uniform propagation of multi-cluster fractures. Li et al. (2020) studied the temporarily plugging staged fracturing (TPSF) using the cohesive zone method, and their results show that lateral fractures can break through the suppression from previous fractures and TPSF enhance the complexity of fracture network. Chen et al. (2020a) numerically investigated the optimization of the number of diverters and diverting time during near-wellbore diversion in a heterogeneous stress reservoir, and their results indicate that more ball sealers and the earlier diverting time are required for creating a new fracture in the formations with the high-stress zone. Some advanced monitoringmethods in the oil-field also show the effectiveness of temporary plugging technology. Rahim et al. (2017) adopted post-job diagnostics and analyzed well performances in the cases in carbonate and sandstone reservoirs, and they proved that the diverters can successfully plug perforations. Panjaitan et al. (2018) carried out a comprehensive method including water hammer analysis, step-down test, and micro-seismic data in Haynesville Shale and their results show the diverters can divert the fluid to intended perforations and TPSF can promote uniform propagation of multiple fractures. Some other field researches also get similar results (Huang et al., 2018; Senters et al., 2018; Weddle et al., 2018). In TPSF operations, a key question is how uneven is the fractures at this point when the temporary plugging agents are injected. Fracturing parameters have an important impact on the unevenness of multi-cluster fracture propagation. Therefore, studying fracturing parameters on multi-cluster fracture length is of great significance to the design of the timing and dosage of the temporary plugging agents.
At present, there are few studies on the influence of multi-cluster fracturing parameters on the unevenness of multi-cluster fracture lengthin a large stage. In this paper, numerical simulation is conducted using the unconventional fracturing model (UFM) to analyze the sensitivity of fracturing design parameters. The first part of this study will briefly describe the mathematical model of the UFM model; In the second part, a large-scale multi-cluster fracturing simulation will be performed on the shale formation of the Longmaxi Formation in Changning, and compared with the real treatment pressure curve to verify the accuracy of the model; In the third part, numerical simulations will be carried out on different fracturing parameters to study the influence of fracturing parameters on the unevenness of fracture length. The main fracturing parameters studied include completion parameters (cluster spacing and the number of perforations per cluster); pumping injection parameters (fluid injection intensity and proppant injection intensity).
Mathematical Model
The UFM model is used to simulate the propagation of multiple clusters of fractures. The UFM model is a complex fracture model developed by Weng et al. based on a pseudo-three-dimensional plane hydraulic fracture model. The model can simulate the propagation of multiple fracture tips. The mathematical model is as follows (Nolte, 1991; Weng et al., 2011, 2012):
Fluid Flow in Fractures
The flow equation of power-law fluid in a fracture follows Poiseuille’s law (Nolte, 1991):
where, p is the fluid pressure; q is the local flow velocity in the fracture; hfl is the fluid height in the fracture; is the average fracture width; w(z) is the depth-related fracture width; s is the distance along the fracture; n and K is the fluid power-law exponent and consistency coefficient, respectively.
The fluid in the fracture obeys the conservation of mass, and its continuity equation is:
where c1 is the total filtration coefficient; h1 is the filter loss zone height; τ(s) is the time when the fracture unit first contacts the fracturing fluid.
Global volume balance equation:
where Q(t) is the injection rate; L(t) is the total length of the entire fracture at time t; h is the fracture height.
In the wellbore, the total injection rate should be equal to the sum of the rates flowing into the fractures, and its equation satisfies (Mack and Elbel, 1992):
where, qi(t) is the injection rate of the ith fracture.
The 2D KPN model is used to describe the relationship between fracture width and pressure, and the equation is satisfied (Perkins and Kern, 1961; Nordgren, 1970):
where E′ is the plane strain rock modulus.
At the crack tip, the following boundary conditions are met:
Fracture Height Control Model
For the control of the fracture height, the UFM model uses a model like the pseudo-three-dimensional model (Weng et al., 2011). The pressure p in the fracture is:
where pcp is the fracture pressure at the perforation depth (measured at the bottom of the fracture); ρf is the fluid density.
The fracture height is obtained by matching the stress intensity factor and fracture toughness. The intensity factors at the top and bottom of the fracture tip can be obtained from the pressure in the fracture, fracture height, and local stress. The calculation equation for the stress intensity factor and fracture width at the top and bottom of the fracture tip is:
where, KIu and KIu is the stress intensity factors at the top and bottom of the slit tip, respectively; δn and δi is the local stress at the top of the fracture tip and the bottom of the fracture tip, respectively; h is the fracture height; hi is the height from the bottom of the seam tip to the top of the seam tip.
Stress Interference Model
The 3D modified boundary element method is used to calculate the induced stress field (Crouch and Starfield, 1983; Olson, 2004):
where Aij is the 3D correction factor; h is the fracture height; dij is the distance between ith element and jth element; α and β is the fitting parameters (α = 1, β = 3.2); Cij is the influence coefficient of the discontinuous displacement of element j on the induced stress on element i; indicates the influence coefficient of the shear discontinuous displacement of element j on the normal stress of element i; indicates the influence coefficient of the discontinuous displacement of the element j on the normal stress of the element i.
Proppant Transport Model
The model determines the type of fluid and proppant by volume concentration, and the calculation equation for the average volume concentration in the fracture is as follows:
where Xk is the volume fraction of the k proppant; Δx′ is the element length; hbank is the stacking height; ck is the concentration of the k proppant.
The horizontal transport model of proppant in fractures is a one-dimensional migration model, which only considers horizontal advection migration. The fluid concentration change equation is described as (Adachi et al., 2007):
where qfl is the flow rate in the fracture; fleakoff is the velocity of the fluid passing through the fracture wall;
The sedimentation velocity of the proppant in the vertical direction is described by the Stokes equation (Weng et al., 2011):
Where vset,k is the sedimentation velocity of the k proppant; ρprop,k is the density of the k proppant; Dk is the diameter of the k proppant; and is the rheological index and consistency coefficient weighted by the fluid concentration, respectively.
Interaction Criterion Between Hydraulic Fractures and Natural Fractures
Natural fractures can be seen as the friction interface, Renshaw and Pollard (Weng et al., 2012) established the orthogonal interaction criterion of hydraulic fracture and natural fracture, and Gu et al. (Nolte, 1991) extended to the nonorthogonal criterion on Renshaw and Pollard’s study. The detailed work can be seen in Gu’s study. With a certain cohesion interface standard, the extended orthogonal formula is:
where S0 is the cohesive force; μ is the interfacial friction coefficient; T0 is the tensile strength of the rock; σH, σh are the horizontal maximum and minimum principal stresses, respectively.
The Influence of Fracturing Parameters on the Unevenness of Fracture Length
Model Establishment and Model Verification
The UFM has been integrated into the Mangrove platform of the geological integrated software Petrel. The verification of the model and the analytical solution has been conducted by Weng et al. (Murphree et al., 2020), so this study will not repeat.
In this section, based on the same/real logging data, injection procedures, completion measures, and fracturing design as well A, three-dimensional fracturing numerical simulation results are generated and compared with the on-site fracturing treatment pressure curve to verified the accuracy of the geological model and fracturing model.
As shown in Figure 1, the target zone of Well A is located in the Long 1 layer of the Longmaxi Formation in Changning, with a burial depth of 3060–3175 m. Logging interpretation results show that organic carbon content (TOC) is between 4 and 8%. Minimum horizontal principal stress (Shmin) is between 56.77 and 71.6 MPa. The maximum horizontal principal stress (Shmax) is between 71.34 and 83.69 MPa. And the vertical stress (Sv) is between 71.83 and 73.17 MPa. The stress state belongs to a strike-slip fault. The measured depth of Well A is 4891.47 m, the vertical depth is 3100∼3200 m, the horizontal completion section length is 1500 m, the average stage length is designed to be 120 m, the total number of perforations in one stage is 48 holes, and the number of clusters is 11 clusters and the cluster spacing is 10.9 m.
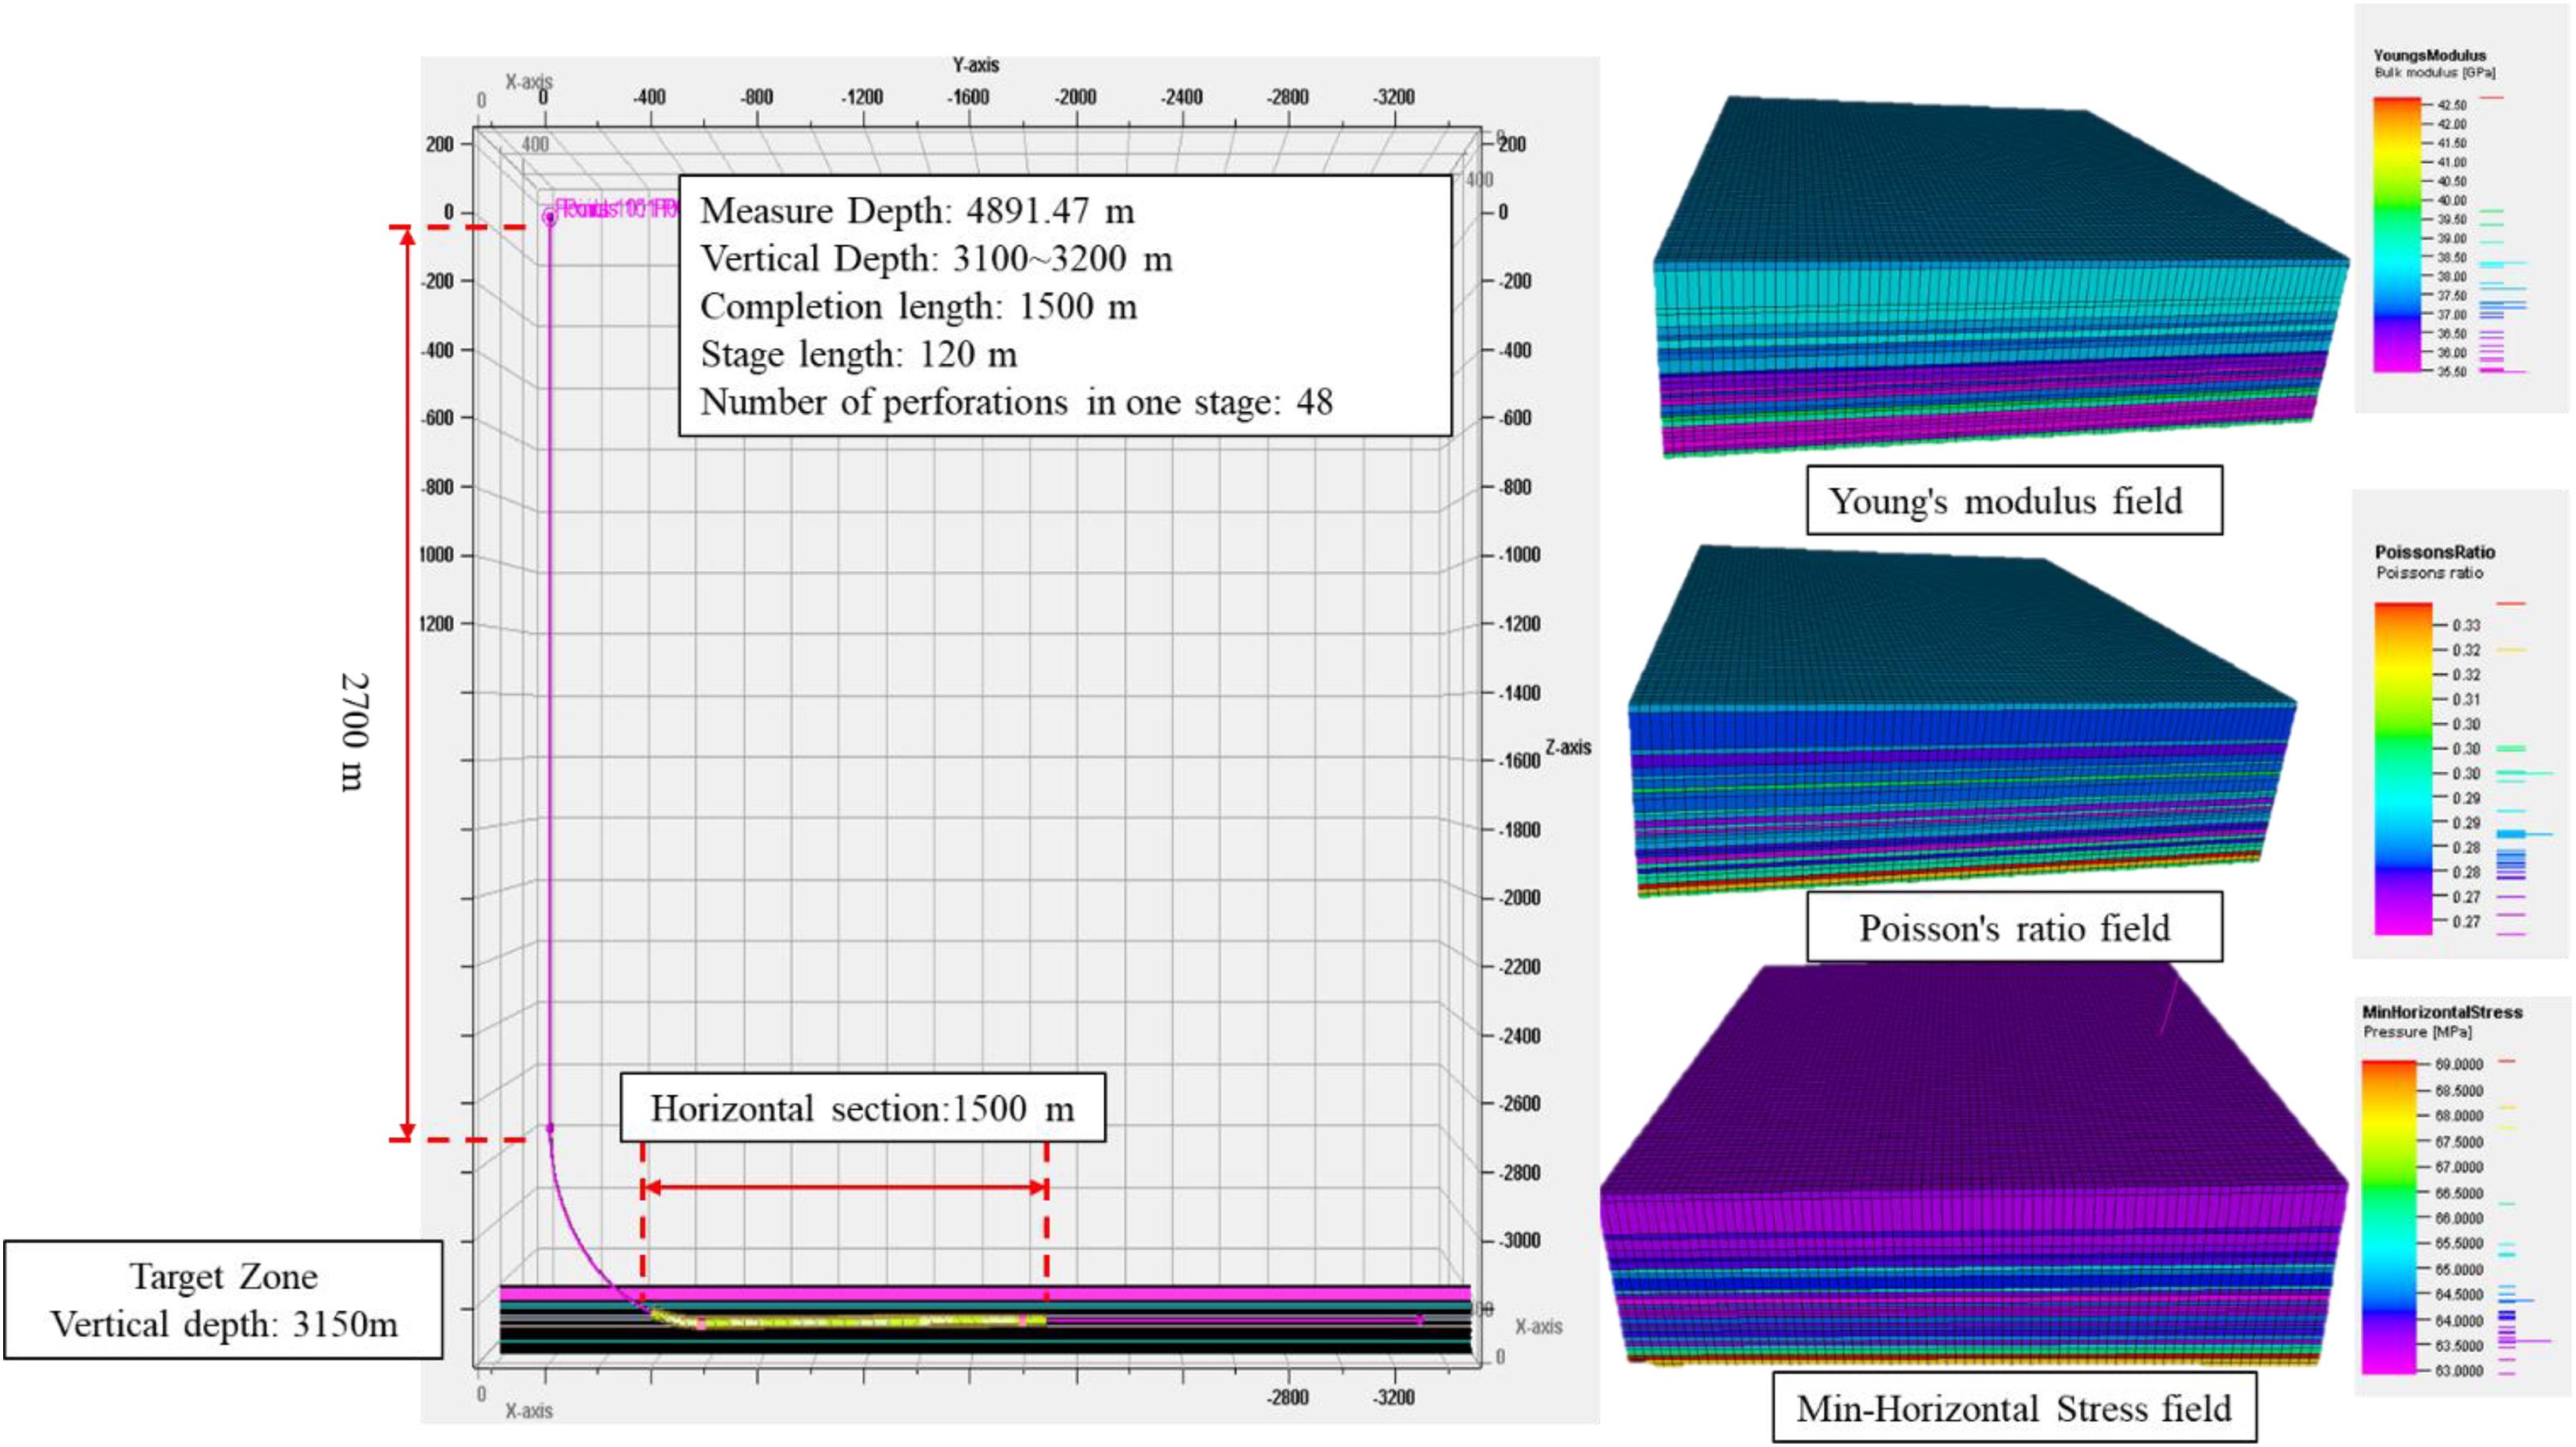
Figure 1. Well A completion design and geological parameter field.
The average minimum horizontal, maximum horizontal and vertical stress is 64.19 MPa, 77.52 MPa and 72.5 MPa, respectively. X-axis, Y-axis, and Z-axis are the directions of horizontal minimum stress σh, horizontal maximum stress σH and vertical stress σV, respectively. In addition, the horizontal wellbore direction in this model is parallel to the direction of the minimum horizontal principal stress, so that multiple fractures can be generated in the horizontal wellbore perpendicular to the wellbore. In fact, this is a common practice in multi-cluster fracturing of horizontal wells. Sensitivity analysis is proposed to determine how uniform will the fractures distribute based on changes in certain fracturing parameter while the other parameters remain the basic model parameters. The basic model parameters are shown in Table 1.
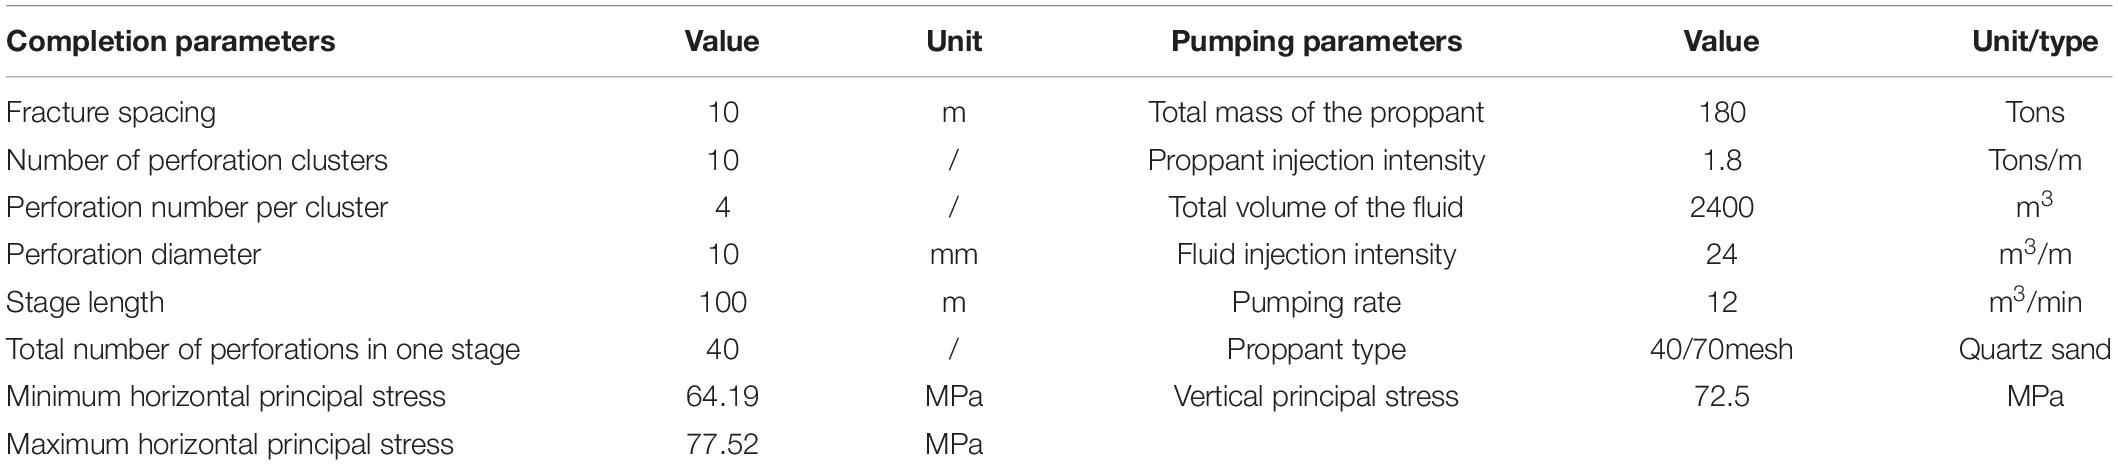
Table 1. Basic parameters of the numerical model.
Figure 2 shows the on-site treatment pressure and the simulated pressure are in good agreement. It should be noted that there are still some pressure disturbances in the pumping pressure curve, which are mainly ascribed to stratigraphic causes. However, it can be proved that simulating the Longmaxi section of the Changning block by this model can be fairly representative to some extent.
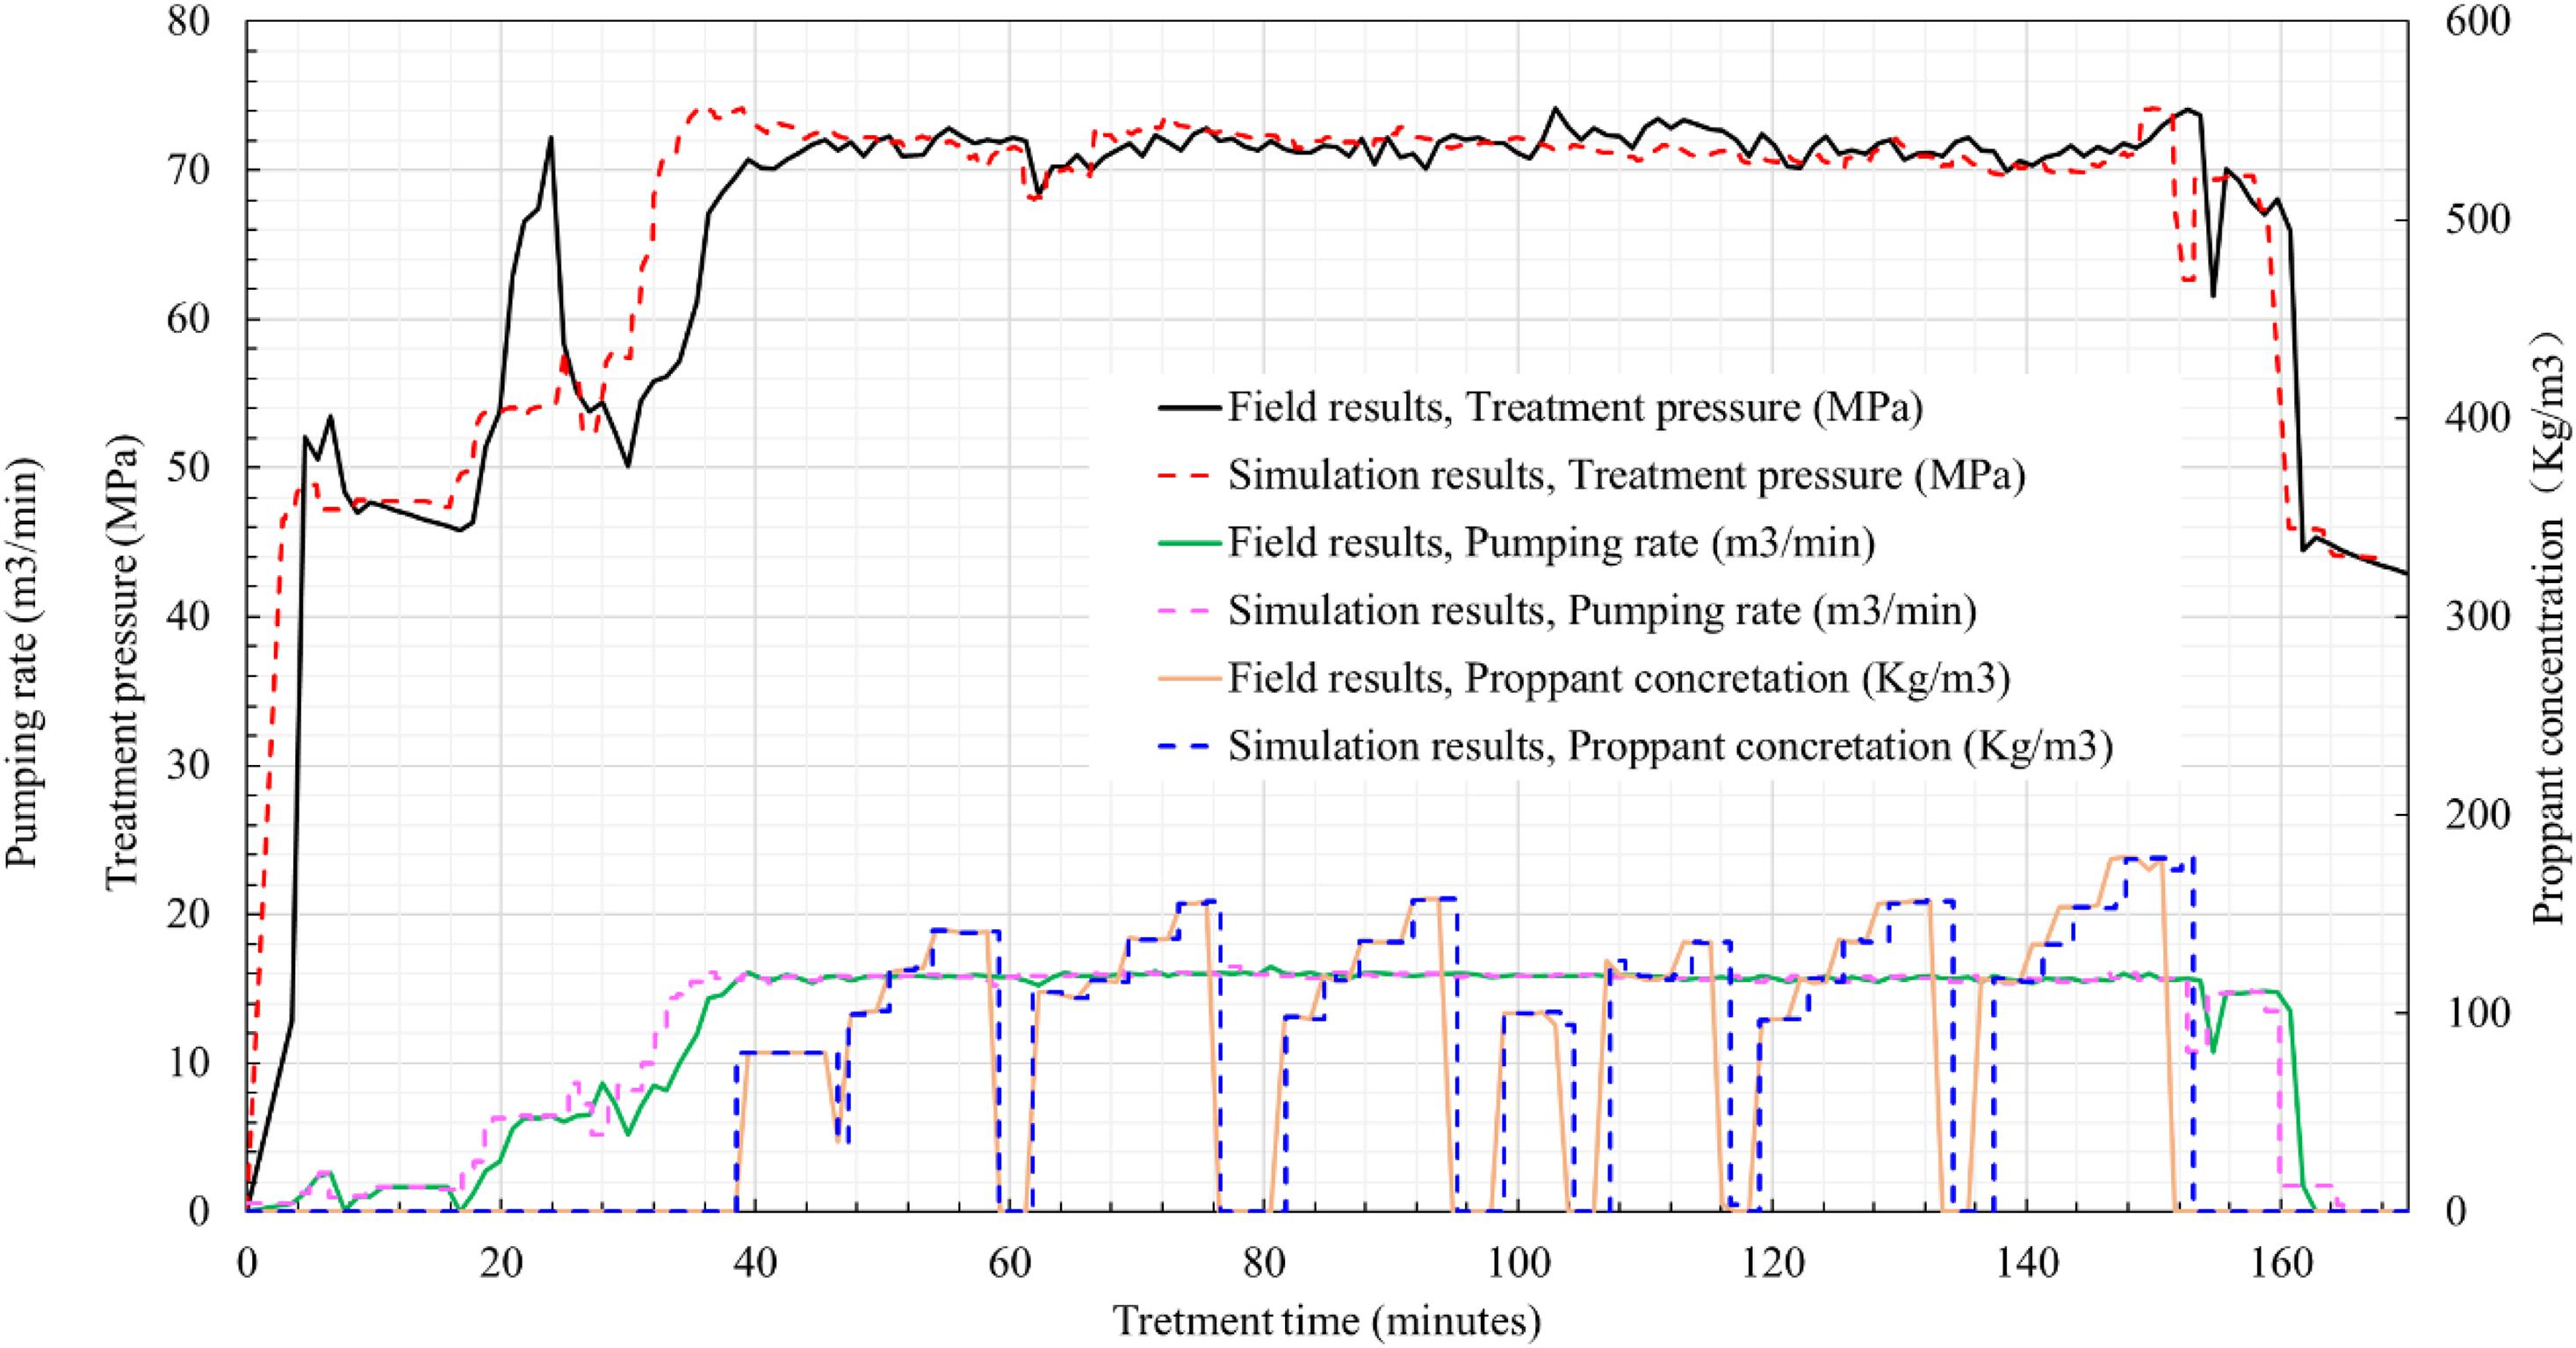
Figure 2. Comparison of on-site fracturing treatment curve and numerical simulation treatment curve of Changning A well.
This section will study the fracturing parameters from the following two aspects: completion parameters (cluster spacing and the number of perforations per cluster); pumping parameters (fluid injection intensity and proppant injection intensity).
The unevenness of fracture length is defined as the length difference in the geometrical morphology of multiple clusters of fractures in the same stage. In this study, the fracture propagation geometry mainly refers to the fracture length, so we define the value of the fracture unevenness as the standard deviation of the fracture length of multiple clusters. The larger the value is, the more uneven the distribution of multiple clusters of fractures in the stage; otherwise, the more uniform fracture propagation can be obtained when the value is smaller. Its mathematical expression is:
where σ(L) is the length unevenness of multiple clusters of fractures; Li is the fracture length of the ith fracture; is the average fracture length of multiple fractures.
Fracture Spacing
The fracture spacing will be changed to 5 m, 10 m, 15 m, and 20 m, respectively, to explore the influence of the cluster spacing on the length unevenness of multi-cluster fracture propagation. As shown in Figure 3, when the fracture spacing is 5 m, 10 clusters of fracture propagate in a “radial shape”, and the strong stress interference under the narrow cluster spacing promotes the deflection of the clusters. With the continuous increase of the fracture spacing, when the fracture spacing is 20 m, the morphology of each fracture is almost parallel, which indicates that the increase of the cluster spacing can reduce the stress interference and the fracture morphology transitions from a strong fracture deflection to a mutual parallel fracture group. Fracture lengths of the cases in Figure 3 are analyzed, and the length unevenness of the cracks and the average value of the fracture lengths in each case according to formula (20) are calculated.
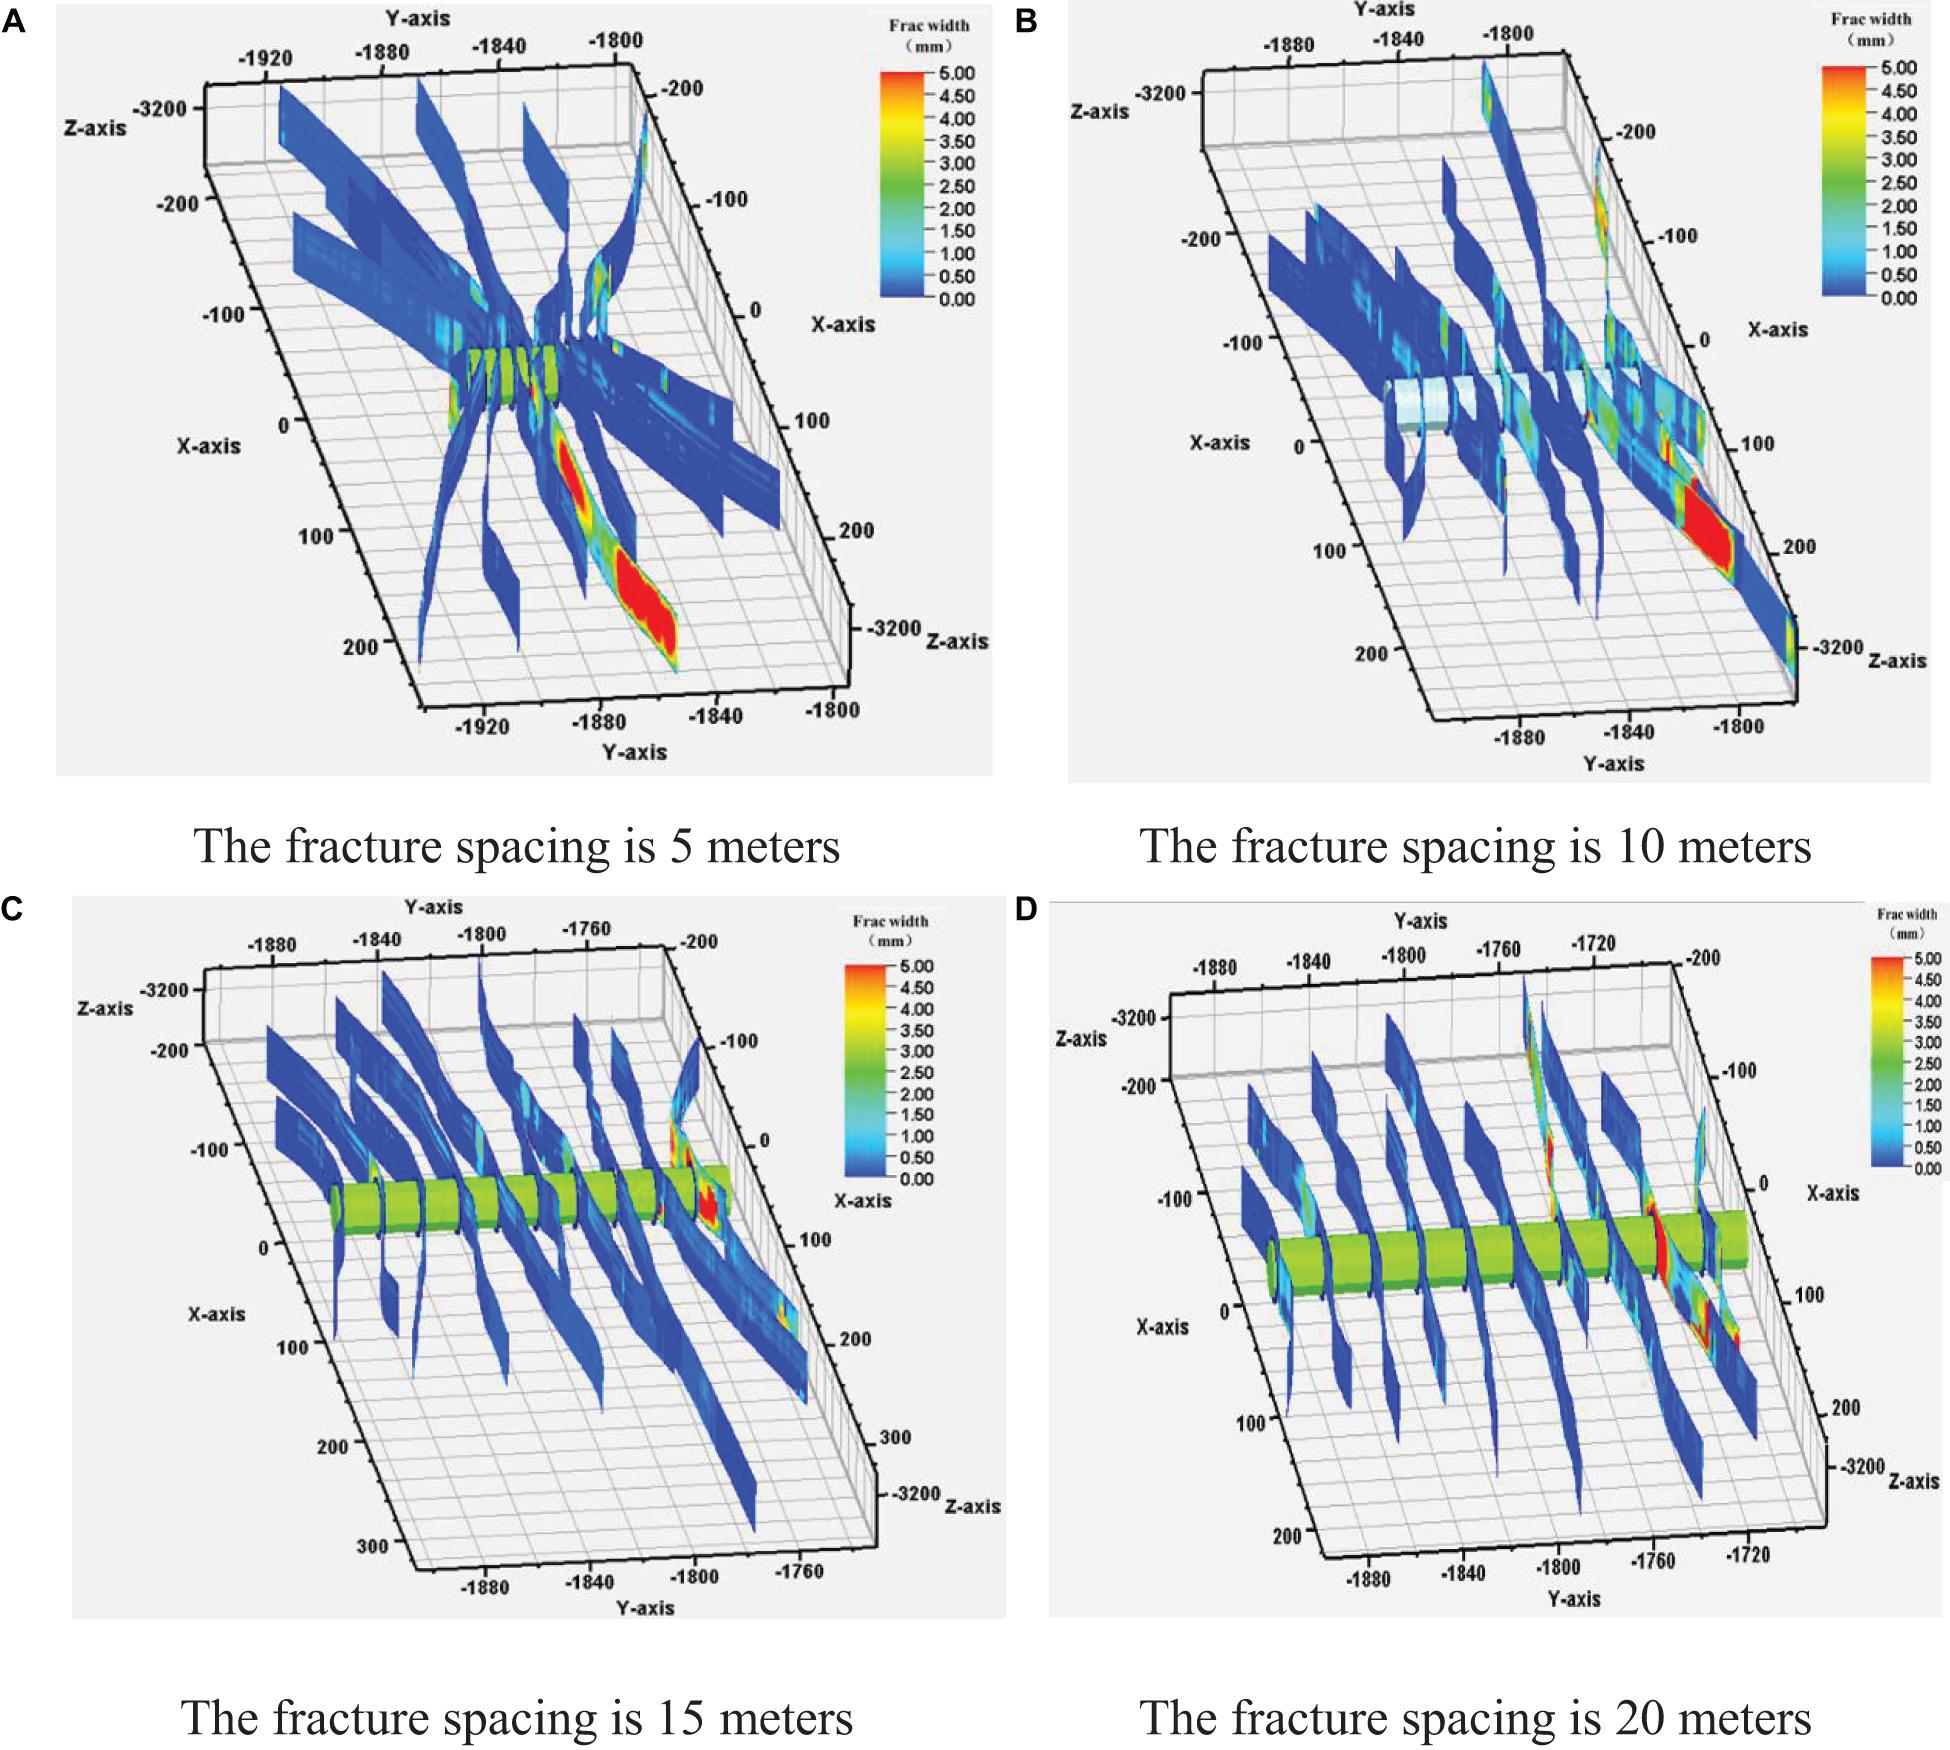
Figure 3. Multi-cluster fracture propagation pattern under different fracture spacing. (A) The fracture spacing is 5 m. (B) The fracture spacing is 10 m. (C) The fracture spacing is 15 m. (D) The fracture spacing is 20 m.
Figure 4A shows the fracture lengths in different fracture spacing cases. It can be seen from the figure that as the fracture spacing increases, the histogram of fracture length distribution gradually turns from uneven to even. Figure 4B shows the variation of the average fracture length and unevenness with the different fracture spacing. The results showed that the fracture spacing increased from 5 to 20 m, the unevenness of the multi-cluster cracks decreased, and the average fracture length did not change much.
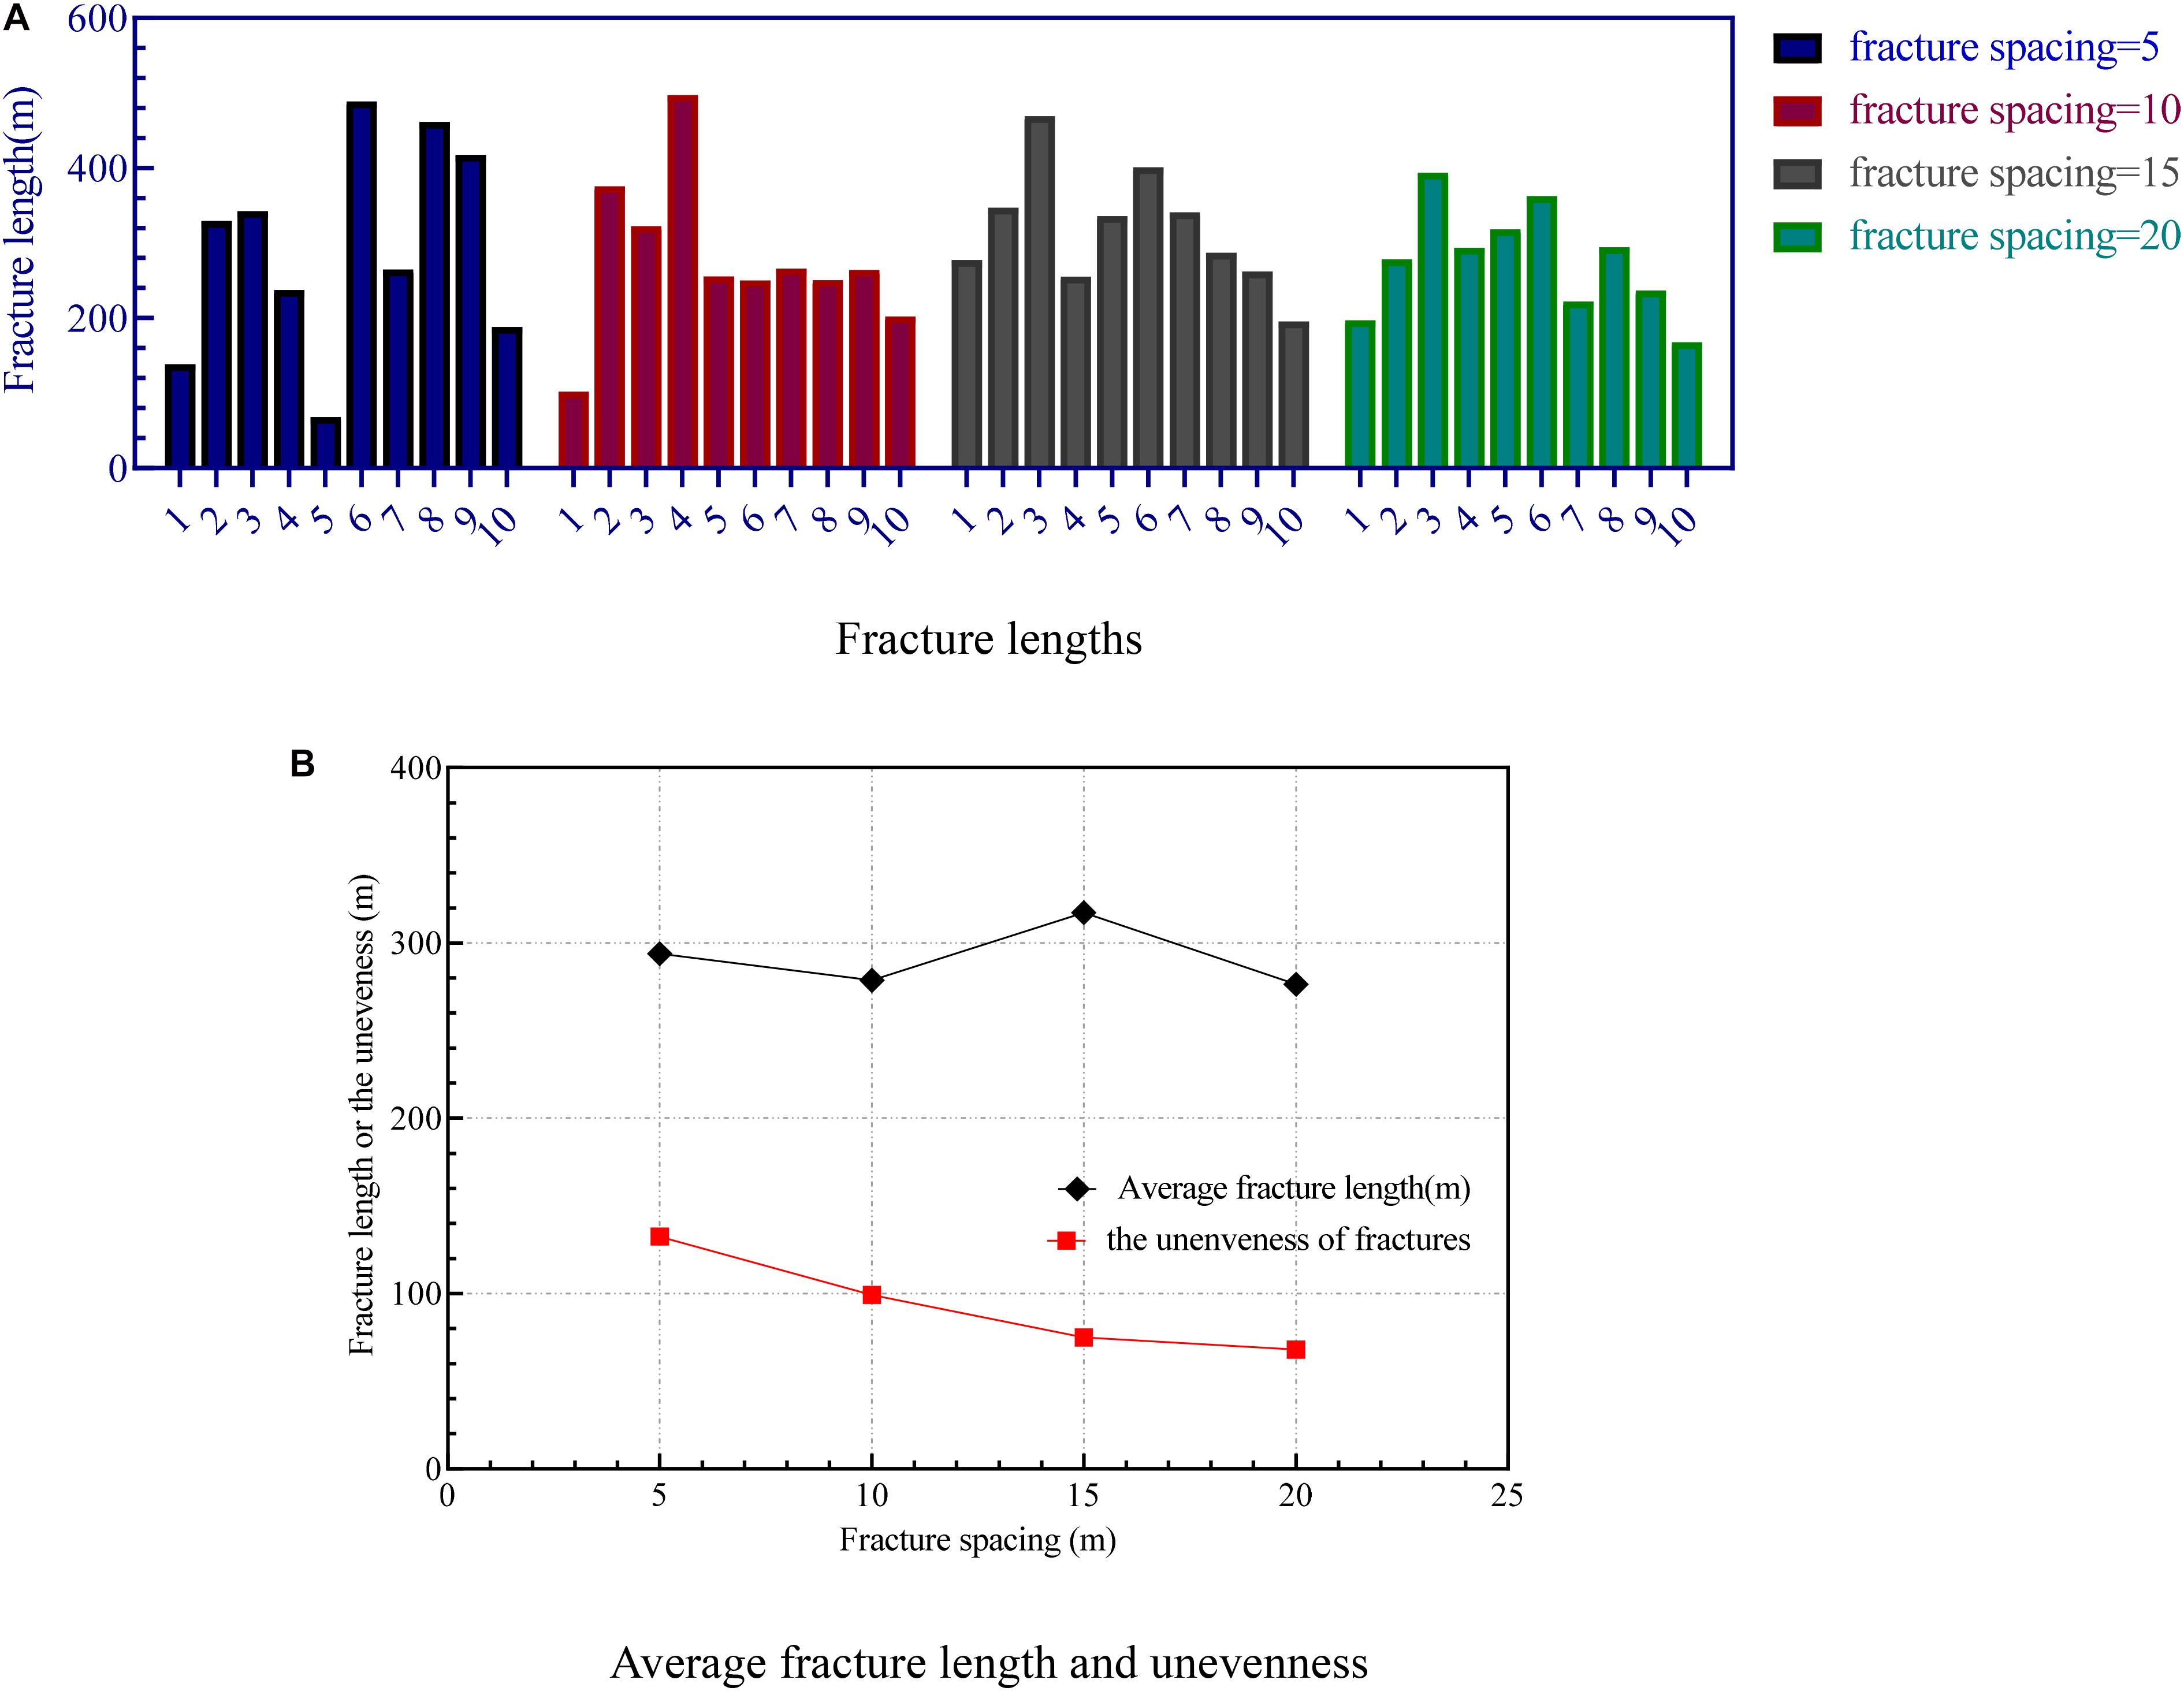
Figure 4. The variation of fracture length and unevenness under different fracture spacing. (A) Fracture lengths. (B) Average fracture length and unevenness.
Number of Perforations per Cluster
With the basic parameters unchanged, the number of single-cluster perforations is modified to 2 holes, 4 holes, 6 holes, and 8 holes, respectively. Influence of the number of perforations per cluster on the fracture propagation morphology and length unevenness are explored.
The fracture propagation pattern is shown in Figure 5. It can be seen from this figure that most of the fractures have a fracture width of less than 2 mm, and the overall crack width is small. The side fractures are affected by stress interference and the fracture length is reduced. The middle fractures are deflected due to stress interference, and multiple fractures merge into the main fracture within 100 m from the wellbore and continue to expand, which further increases the induced stress and promotes uneven fracture propagation.
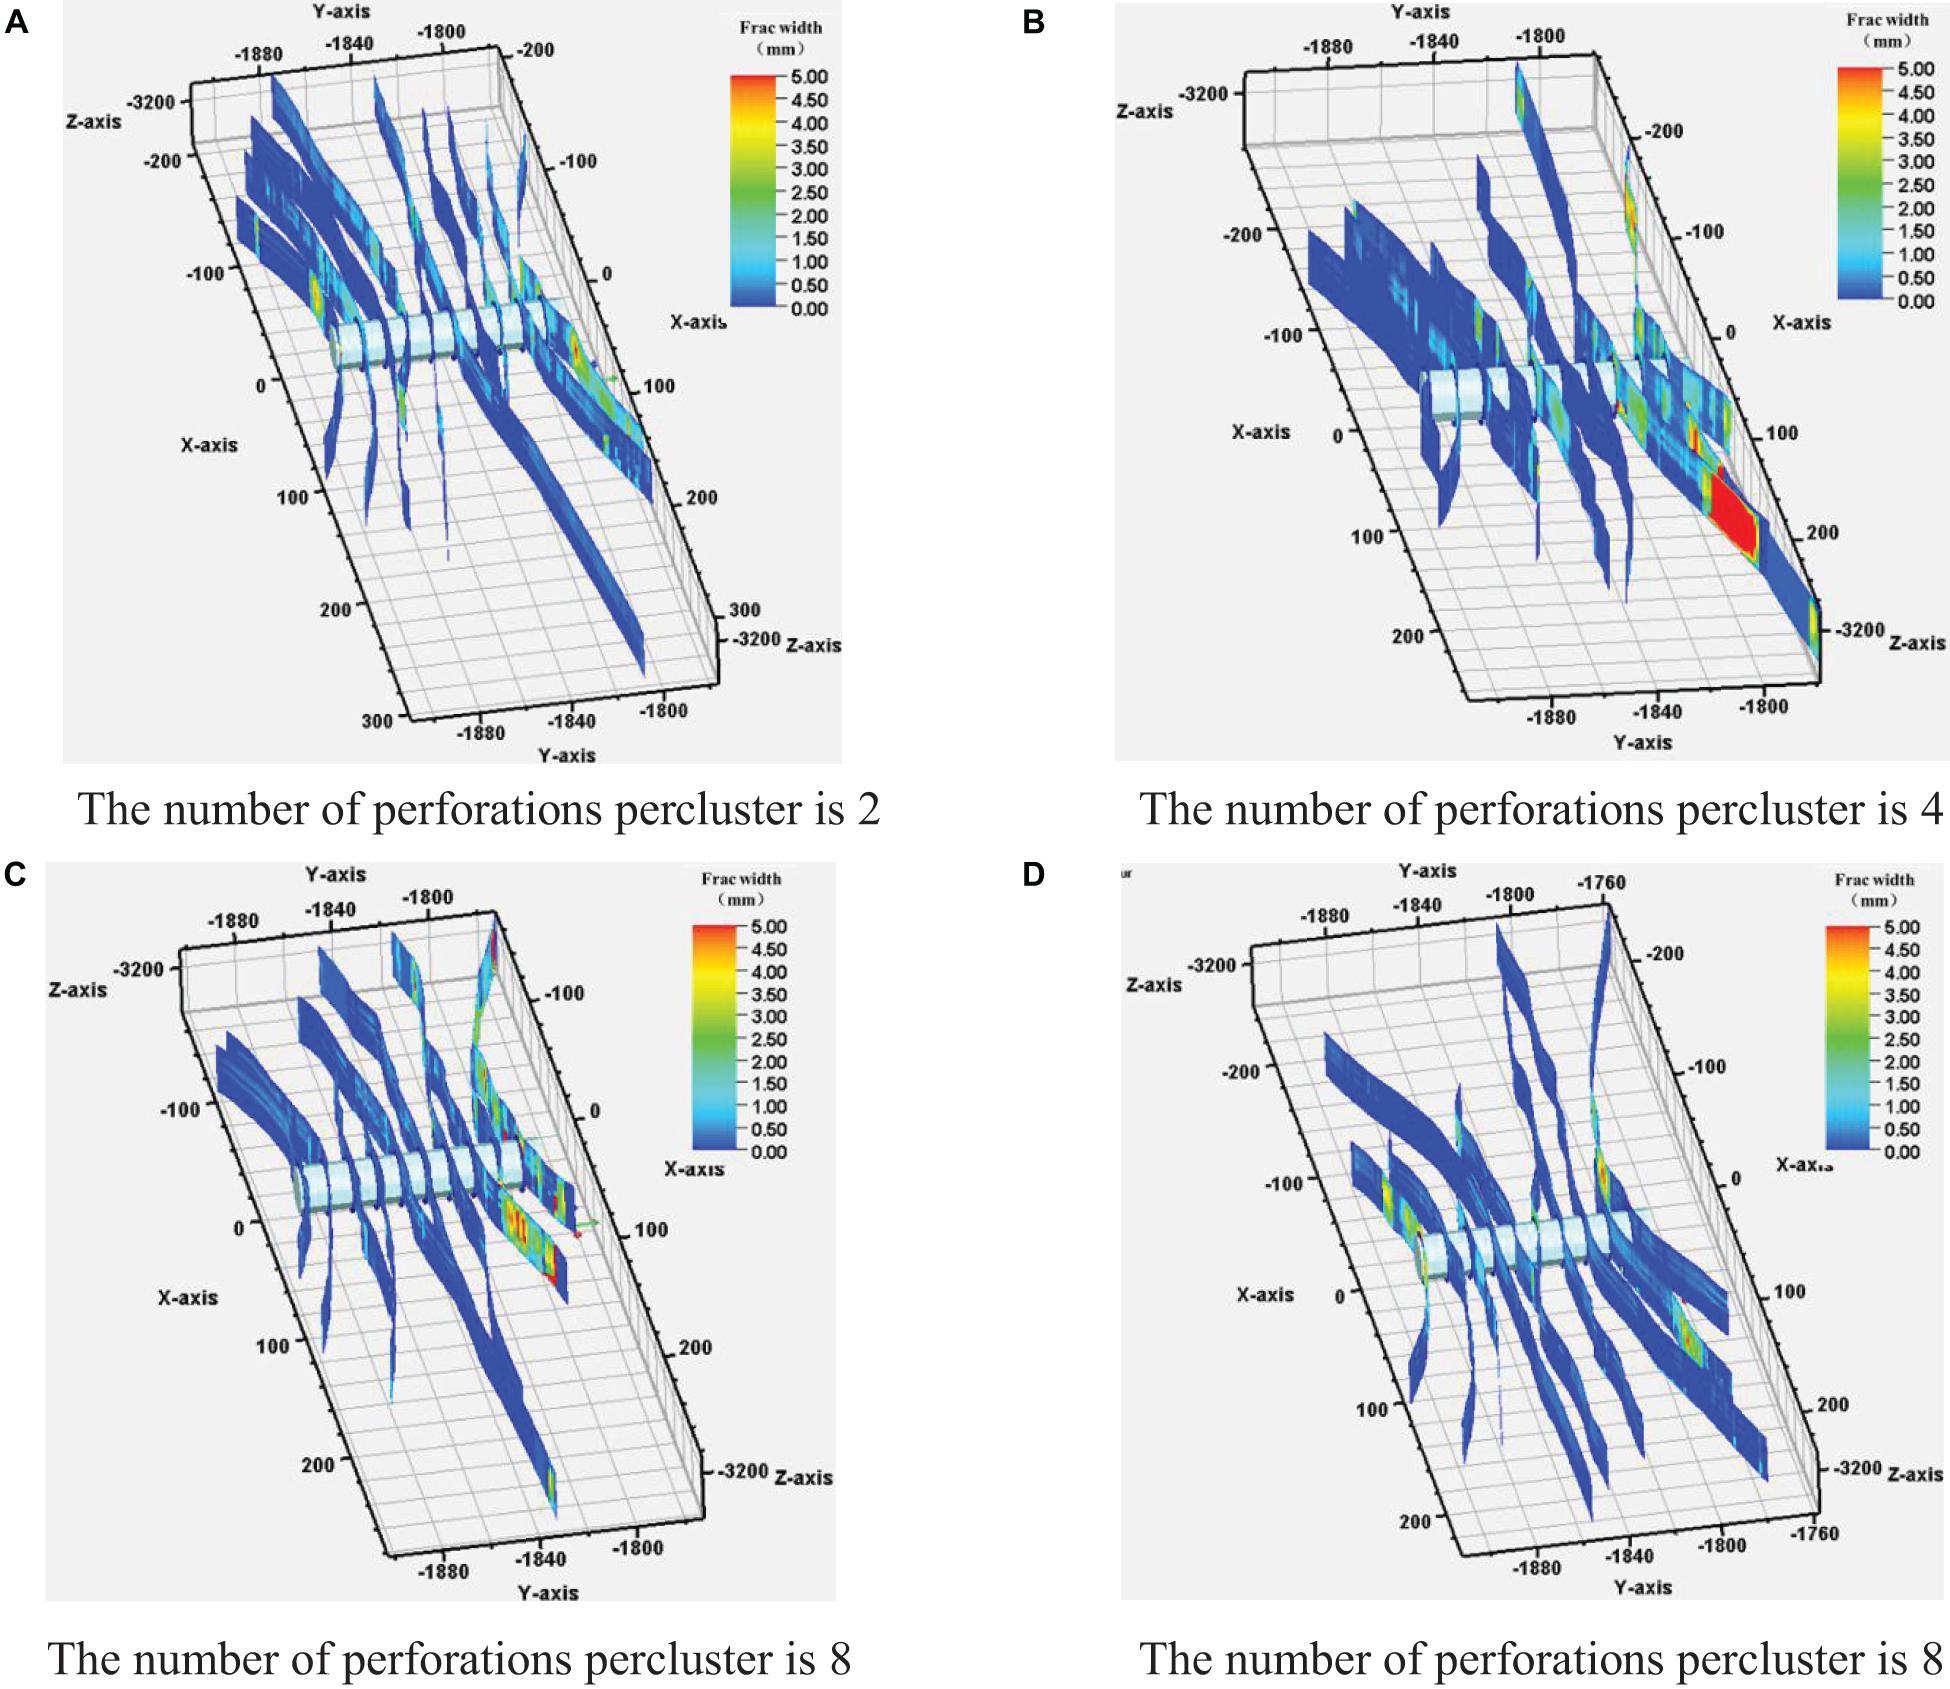
Figure 5. Multi-cluster fracture propagation pattern under different numbers of perforations per cluster. (A) The number of perforations per cluster is 2. (B) The number of perforations per cluster is 4. (C) The number of perforations per cluster is 8. (D) The number of perforations per cluster is 8.
The fracture lengths of the cracks in each case in Figure 5 are counted, and the fracture length results are shown in Figure 6A. The results in Figure 6A do not reflect the changes in the uniformity of the cracks. Therefore, the unevenness calculation is performed, and the calculation result is shown in Figure 6B. It can be seen from Figure 6B that the average length of the fracture has a slight downward trend with the increase in the number of perforations per cluster. The unevenness of the fractures increases with the increase in the number of perforations per cluster. When the number of perforations per cluster is six, it is an abnormal point. This may be due to the influence of the calculation of the fracture length when multiple clusters of fractures merge, which interferes with the calculation result of unevenness. These results show that reducing the number of single-cluster perforations can help reduce the unevenness of cracks and improve the uniformity of cracks; at the same time, increase the average length of fractures slightly.
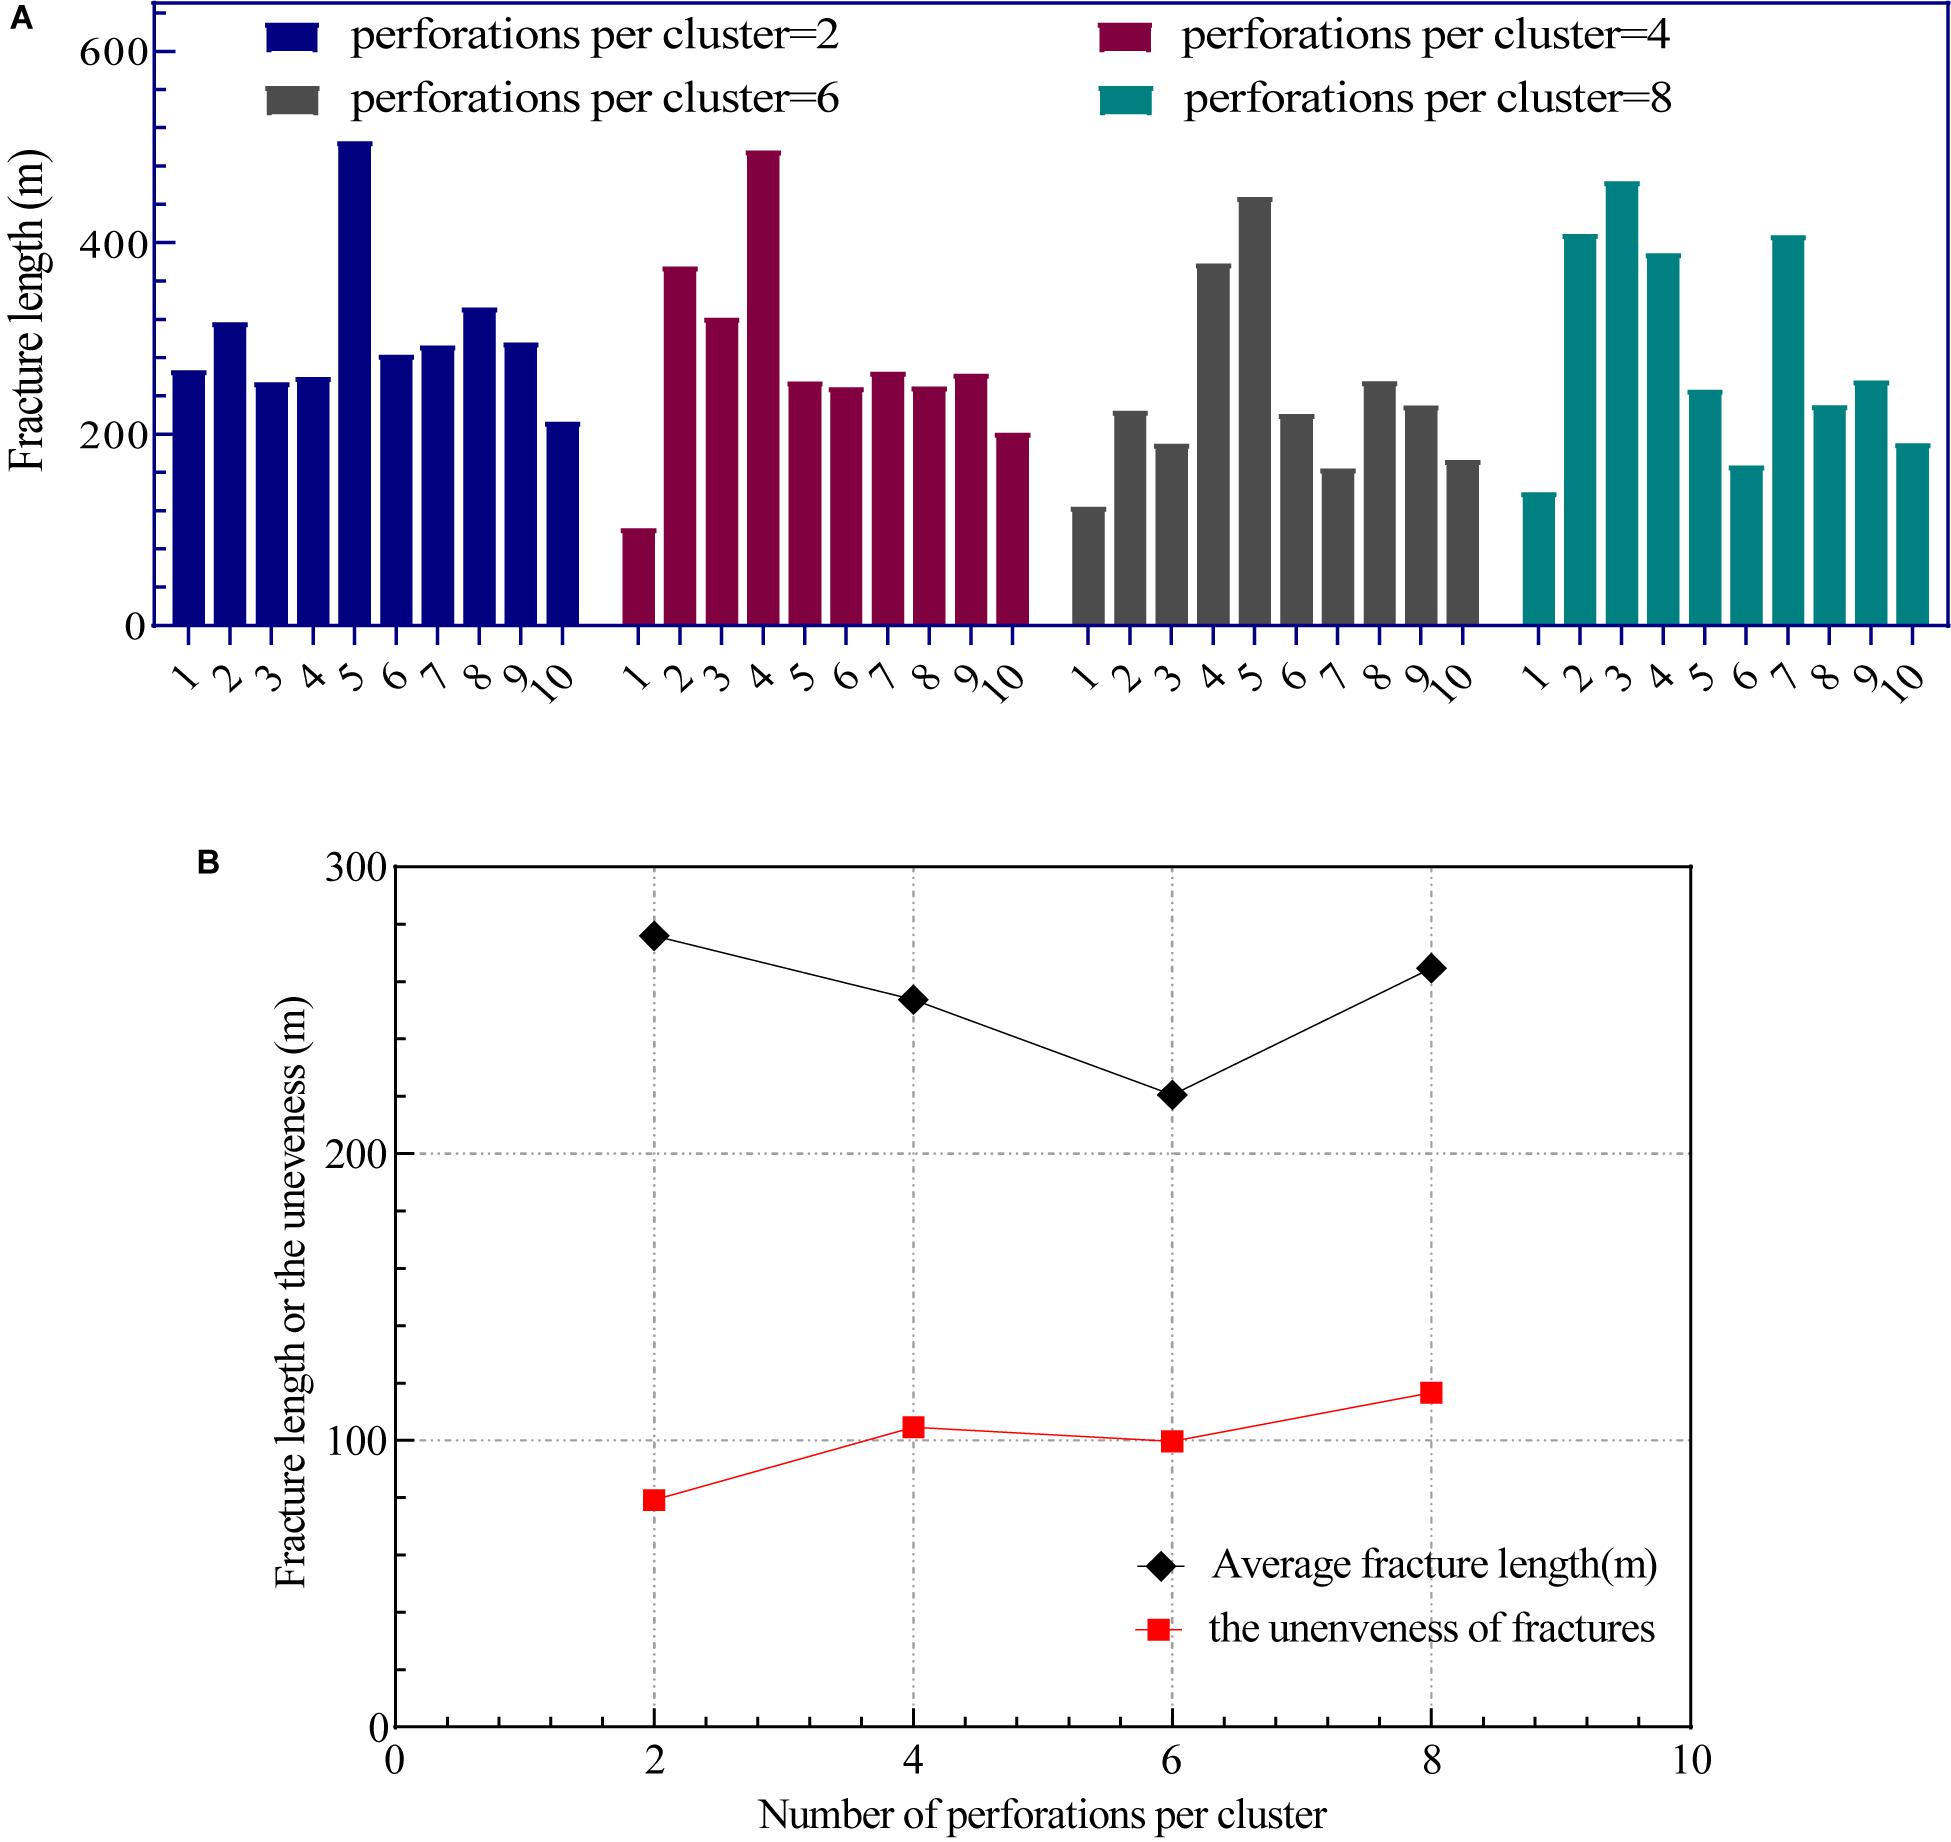
Figure 6. The variation of fracture length and unevenness with different numbers of perforations per cluster. (A) Fracture length. (B) Average fracture length and unevenness.
Fluid Injection Intensity
With the basic parameters unchanged, the pump injection schedule is changed to alter the fluid injection intensity as: 10 m3/m, 20 m3/m, 30 m3/m, respectively. Influence of the injection fluid intensity on the fracture propagation morphology and length unevenness are explored.
Figure 7 is the fracture morphology diagram. From Figures 7A–C, as the fluid injection intensity increases, the difference in fracture length of multiple clusters of fractures gradually increases, and the fracture propagation gradually becomes uneven, such as the longest fracture length in Figure 7A is 319.05 m, and the shortest fracture length is 141.894 m. In Figure 7B, they are 497.189 m and 102.252 m, respectively. This shows that the increase of the injection strength increases the unevenness of the fracture propagation. Figure 8A shows the fracture length distribution under different fluid injection intensity. Figure 8B shows the variation of unevenness and fracture length with fluid injection intensity. When the fluid injection intensity is 10 m3/m, the average fracture length is 221.7 m, and the unevenness is 51.53 m; while the injection intensity is 20 m3/m, 30 m3/m, the average fracture length is 278.7 m, 327.2 m, the unevenness of the cracks increased to 104.58 m and 88.02 m; This shows that the increase of the injection intensity increases the length of the fracture stimulation as a whole, but the unevenness of the fracture gradually increases, and there is the extreme value of the maximum unevenness of the fracture. In our simulations, the injection intensity in the case with the maximum unevenness is 20 m3 /m.
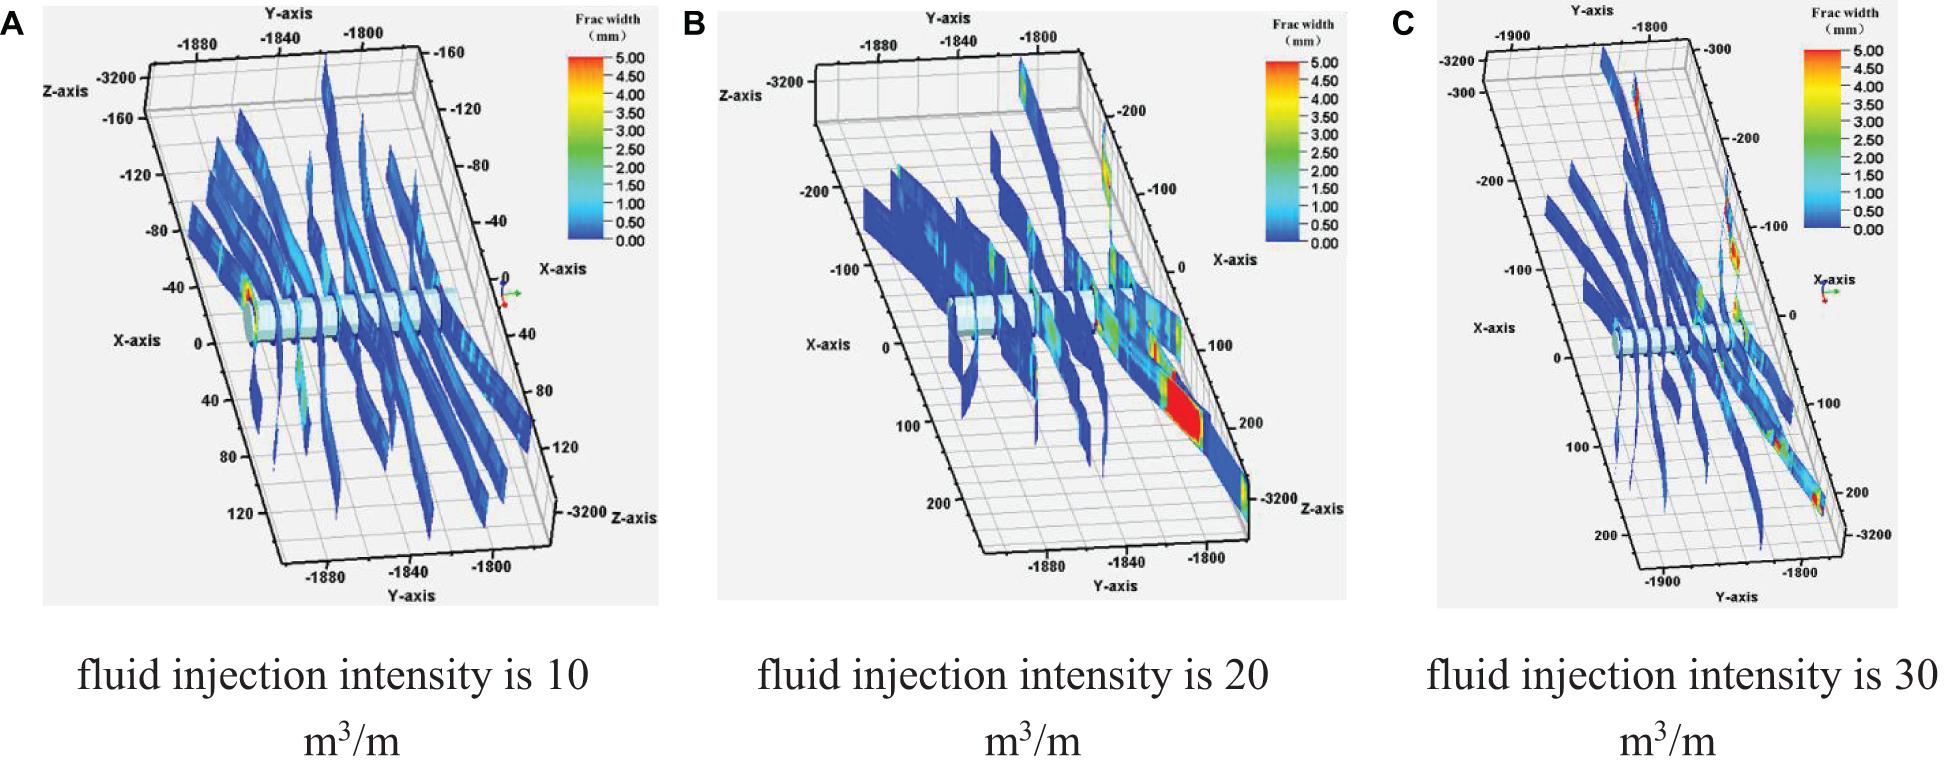
Figure 7. Multi-cluster fracture propagation morphology under different injection fluid intensity. (A) fluid injection intensity is 10. (B) fluid injection intensity is 20. (C) fluid injection intensity is 30.
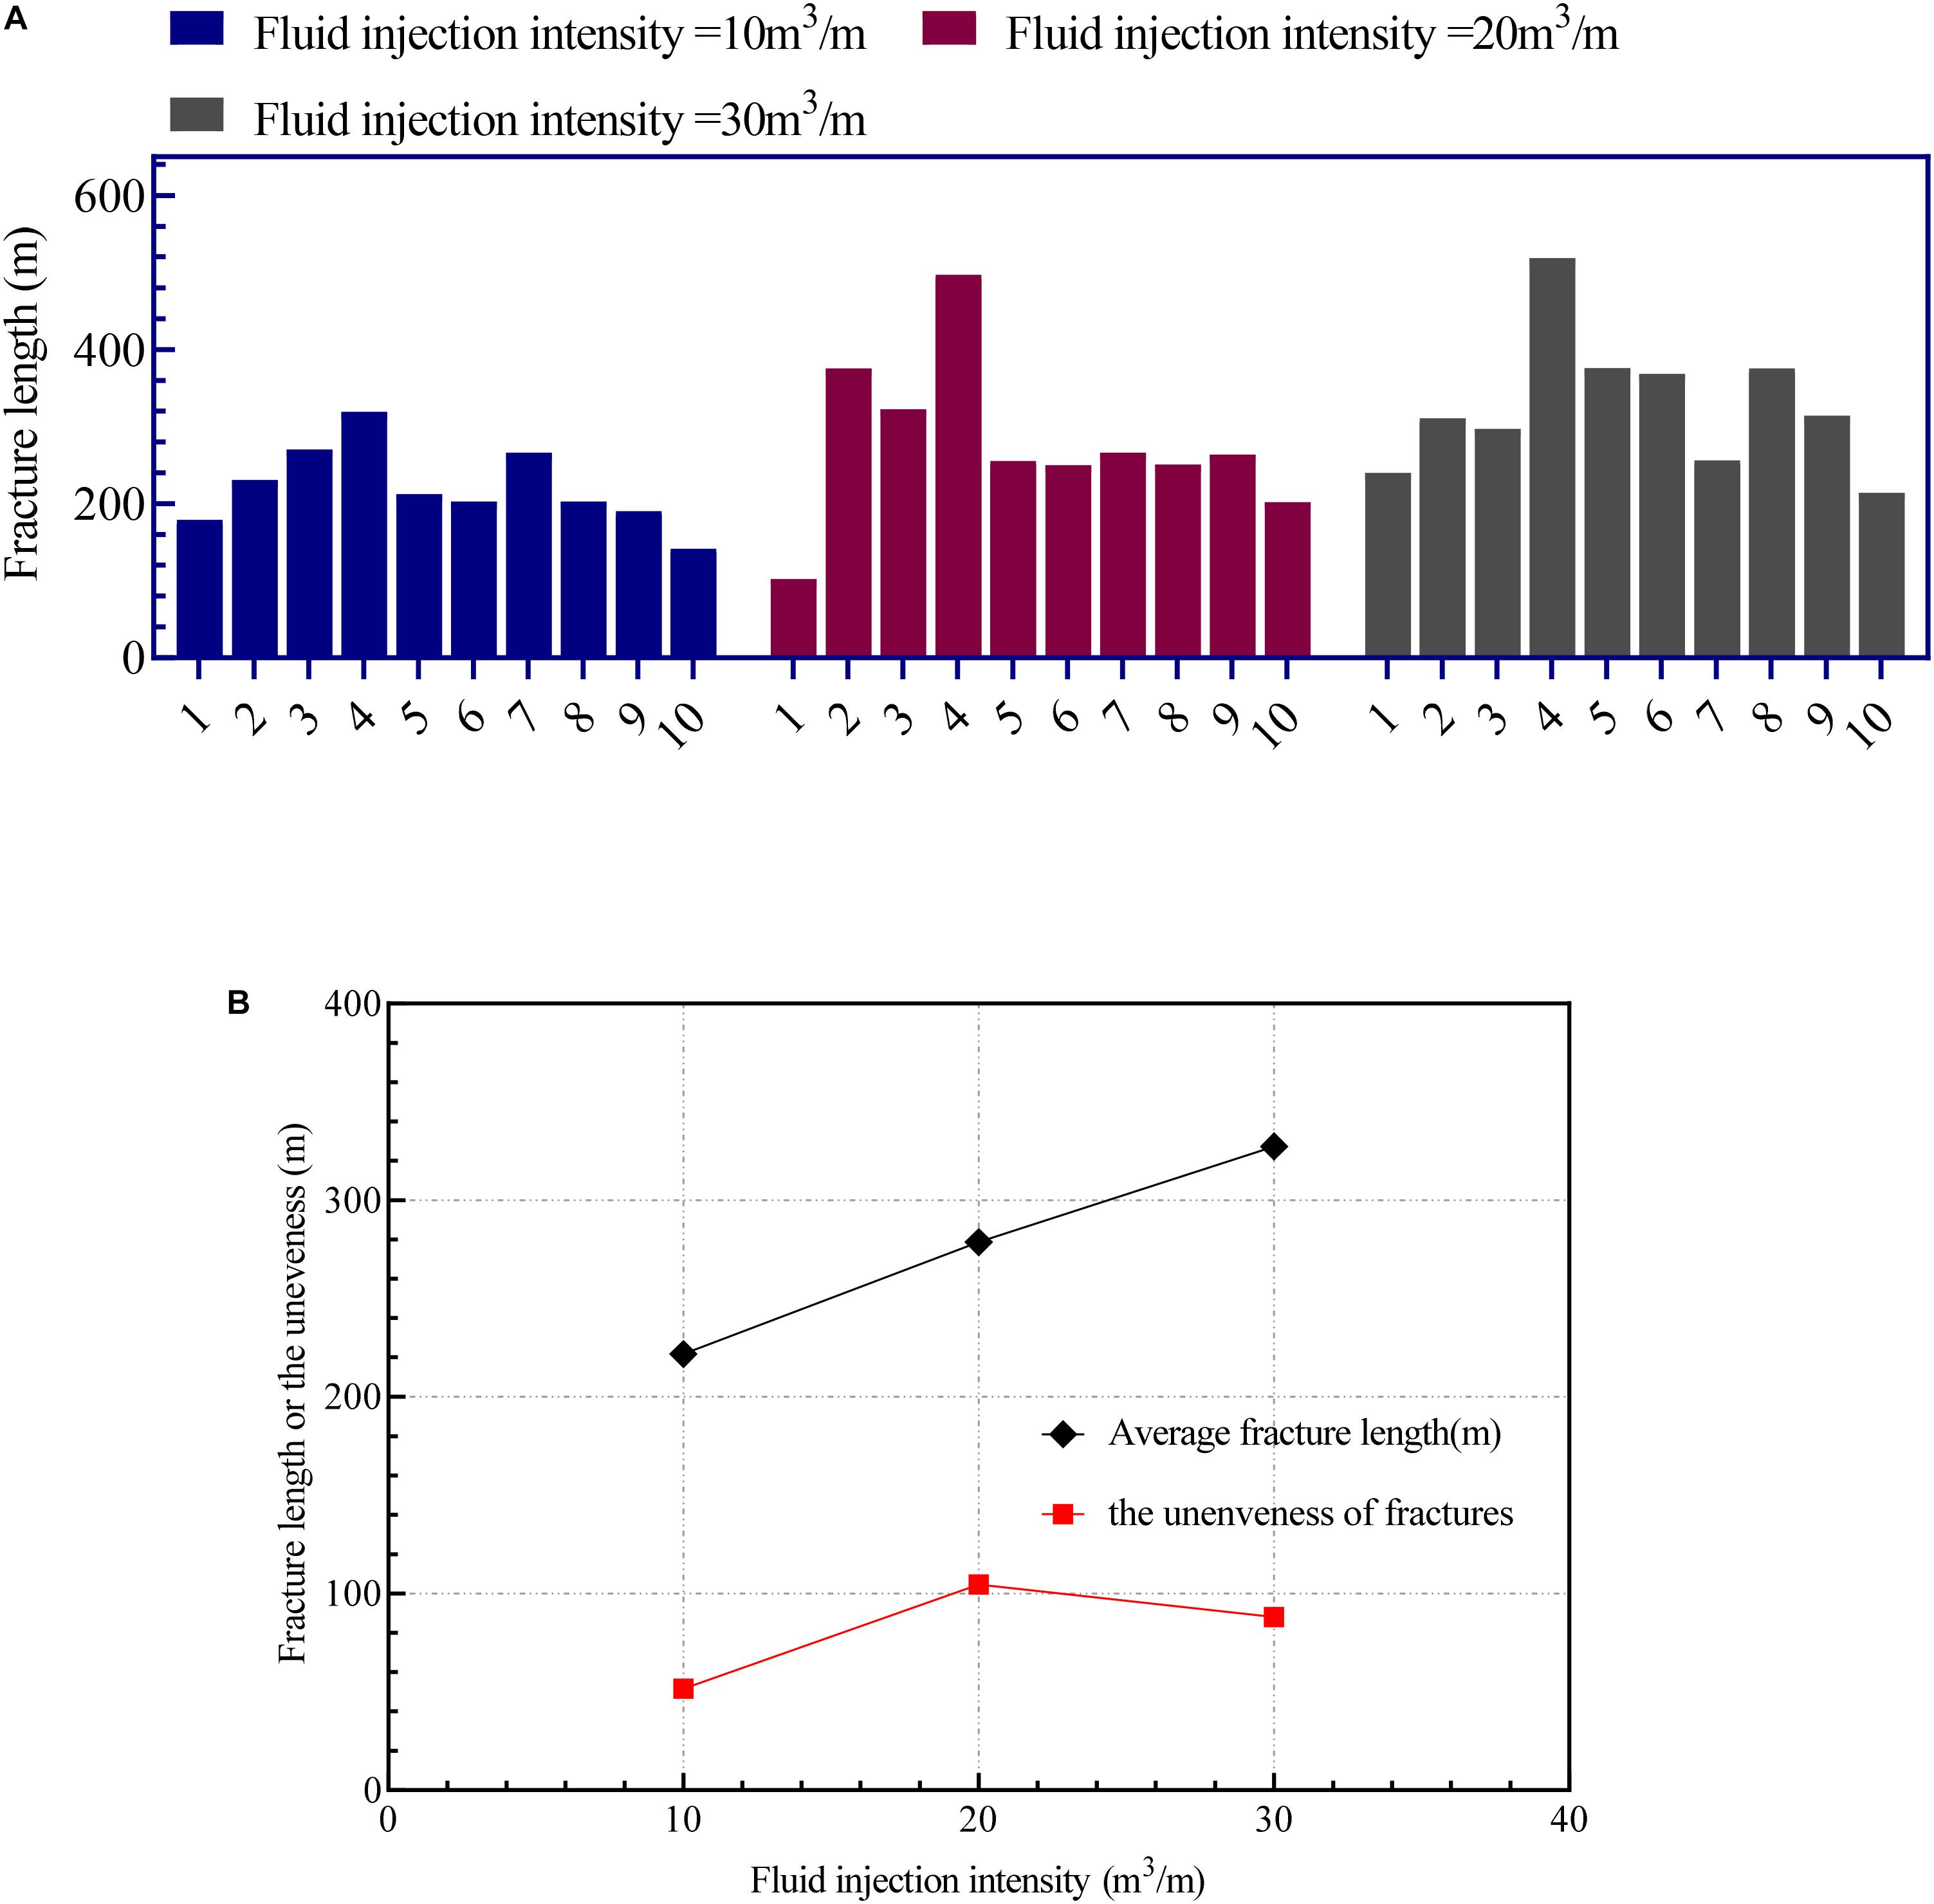
Figure 8. The variation of the average fracture length and unevenness with different fluid injection intensity. (A) Fracture length. (B) Average fracture length and unevenness.
Proppant Injection Intensity
In this section, we will keep the basic parameters unchanged, and change the proppant injection intensity to 1.8 t/m, 2.4 t/m, and 3.0 t/m, respectively, and explore the influence of the proppant injection intensity on the fracture propagation pattern and the unevenness of fracture length. The fracture morphology diagram is shown in Figure 9. It can be seen from Figures 9A–C that when the proppant injection intensity increases from 1.8 to 3.0 t/m, the average fracture width has been increased, and the average fracture width is 2.1 mm, 2.4 mm, and 3.0 mm, respectively. There is not much change in other geometric forms of fractures. Figure 10A shows the distribution of fracture lengths under different proppant injection intensity. Figure 10B shows the variation of average fracture length and the unevenness with the proppant injection intensity. The results show that when the injection proppant intensity increases, the average length of the fractures in each cluster hardly changes, which are 278.7 m, 285.8 m, and 285.4 m, respectively; the unevenness of the cracks gradually decreases to 104.6 m, 90.9 m, and 85.9 m, respectively. This shows that the change of the proppant injection intensity will not affect the average length of fractures or the scale of stimulation and meanwhile have a little effect on improving the uniformity of the fracture length.
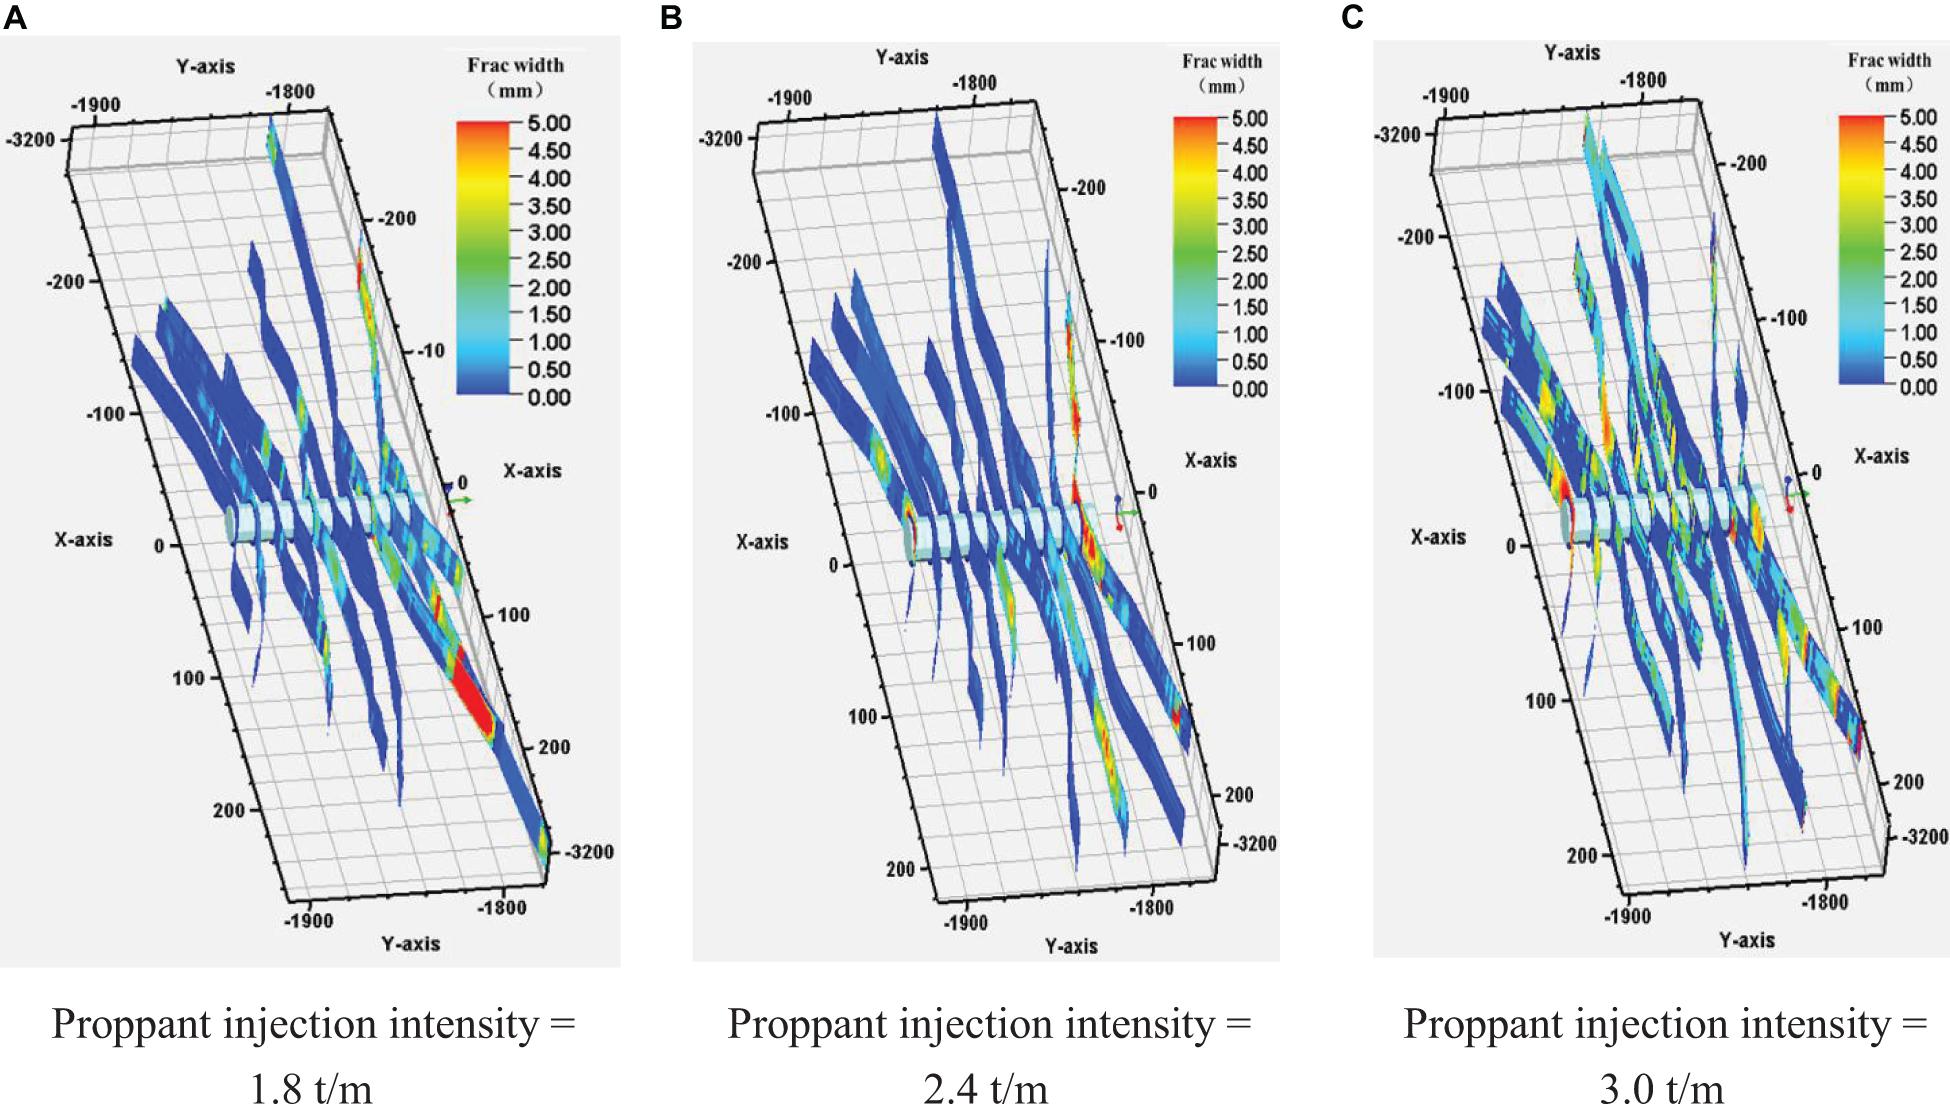
Figure 9. Multi-cluster fracture propagation pattern under different proppant injection intensity. (A) Proppant injection intensity = 1.8 t/m. (B) Proppant injection intensity = 2.4 t/m. (C) Proppant injection intensity = 3.0 t/m.
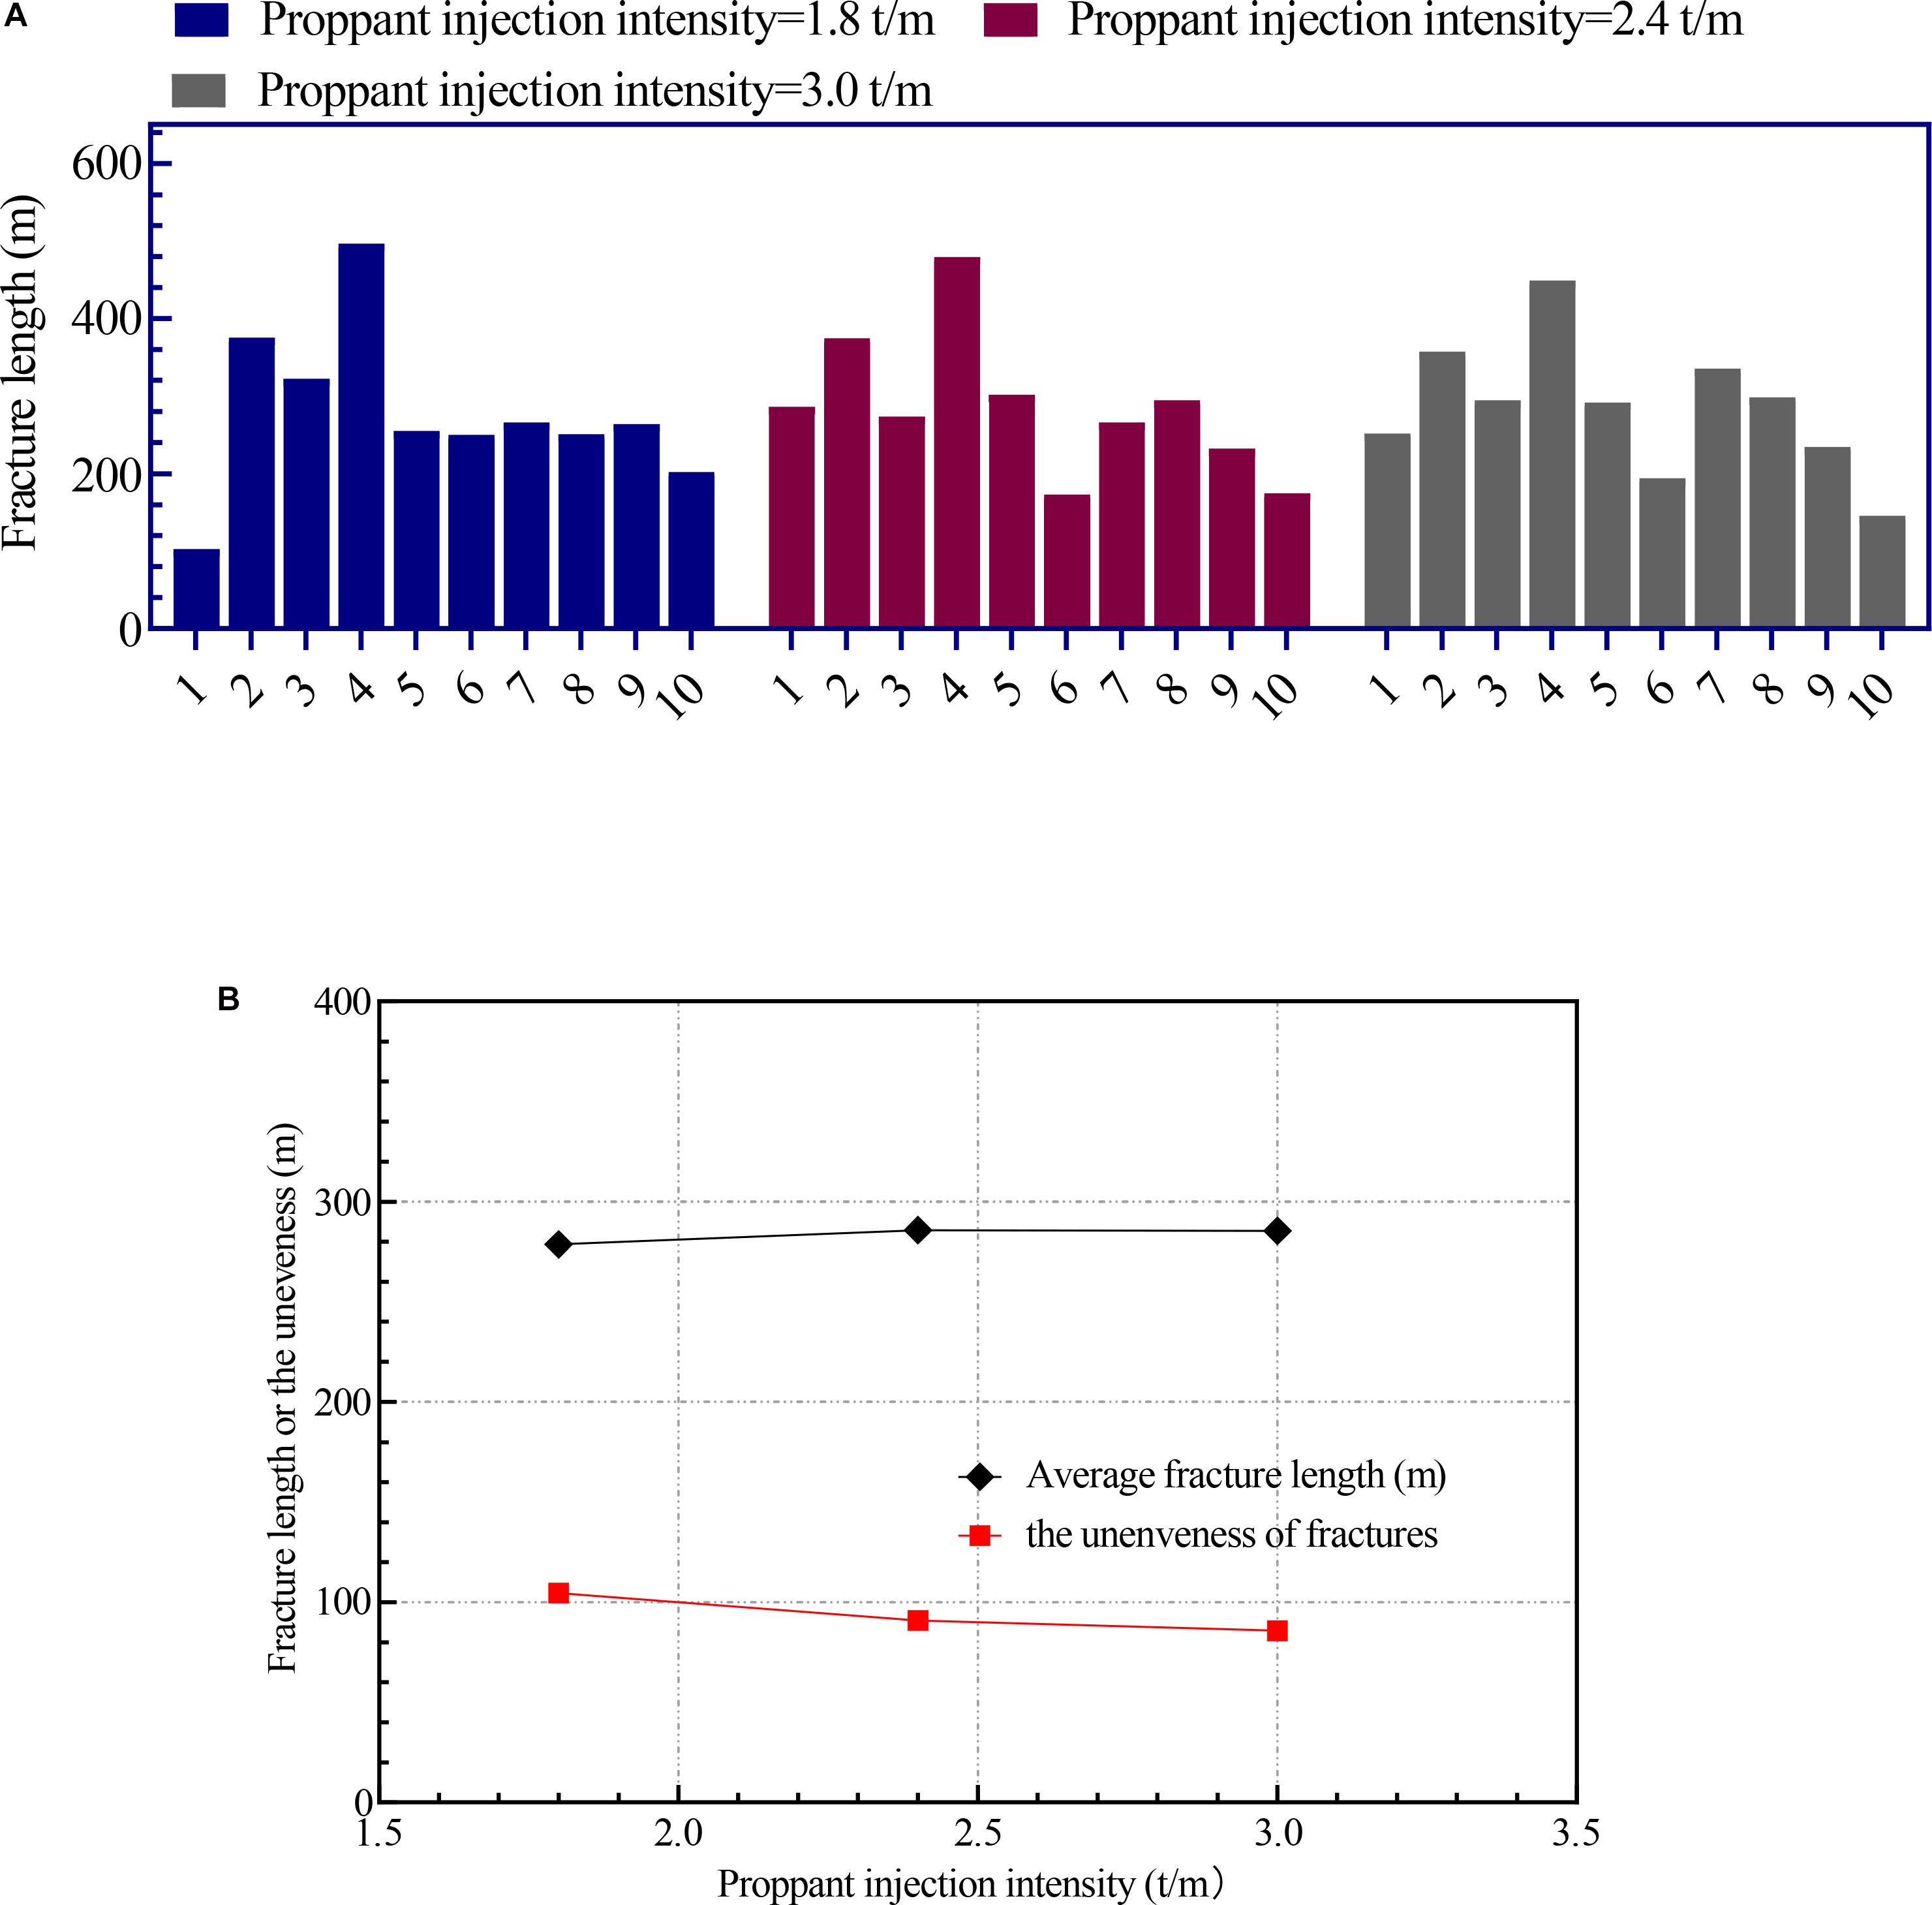
Figure 10. The variation of average fracture length and unevenness with proppant injection intensity. (A) Fracture length distribution. (B) Average fracture length and unevenness.
Effect of Approach Angle When Natural Fractures Exist
Complicated natural fractures (NF) and bedding usually exist in shale formations. Therefore, complex fracture networks are created when hydraulic fractures (HF) encounter natural fractures. The approach angle refers to the angle between hydraulic fractures and natural fractures, which is an important parameter that affects the interaction between hydraulic fractures and natural fractures. This section mainly describes the complex fracture network when the natural fractures are distributed under different approach angles. The approach angles for setting natural fractures are 30, 60, and 90 degrees. The basic setting parameters of natural fractures are shown in Table 2.
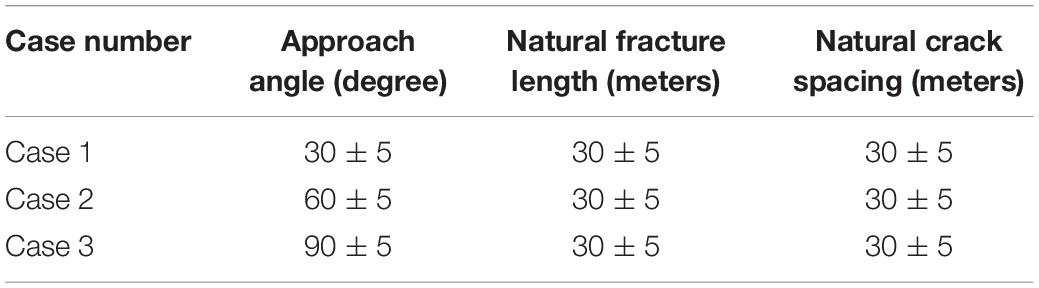
Table 2. Basic parameters of natural fractures in different cases.
Figure 11 shows the fracture networks with different natural fractures approach angles. Compared with the no-HF case, the fracture morphology with NFs shows a more complicated fracture network. Due to the high fluid loss of natural fractures, the local fracture width shows wider hydraulic fractures. In addition, the fracture morphology of different approach angles is also quite different. When the natural fracture angle is 30 degrees, hydraulic fractures divert easily to the natural fractures, which show a highly complex fracture network in the near-wellbore region and far-field region. When the approach angle is 60 degrees, hydraulic fractures are captured by the natural fracture only at the near-wellbore region and a small amount of the fracture network was disturbed in the far-field region. This phenomenon is more obvious when the approach angle is 90°. There are only a few hydraulic fractures in the far-field region, and the figure shows that hydraulic fractures do not communicate with the natural fractures. The complex fracture network in the near-wellbore region is mainly due to the strong stress interference created by the simultaneous propagation of multiple fractures, which makes it easier for hydraulic fractures to divert to natural fractures. However, the stress interference is relatively weak in the far-field region. At low approach angles, hydraulic fractures in the far-field region can still divert to natural fractures to produce a more complex fracture network, as shown in Figure 11A; At high approach angles, the hydraulic fractures in the far-field region will directly cross the natural fractures, as shown in Figure 11C.
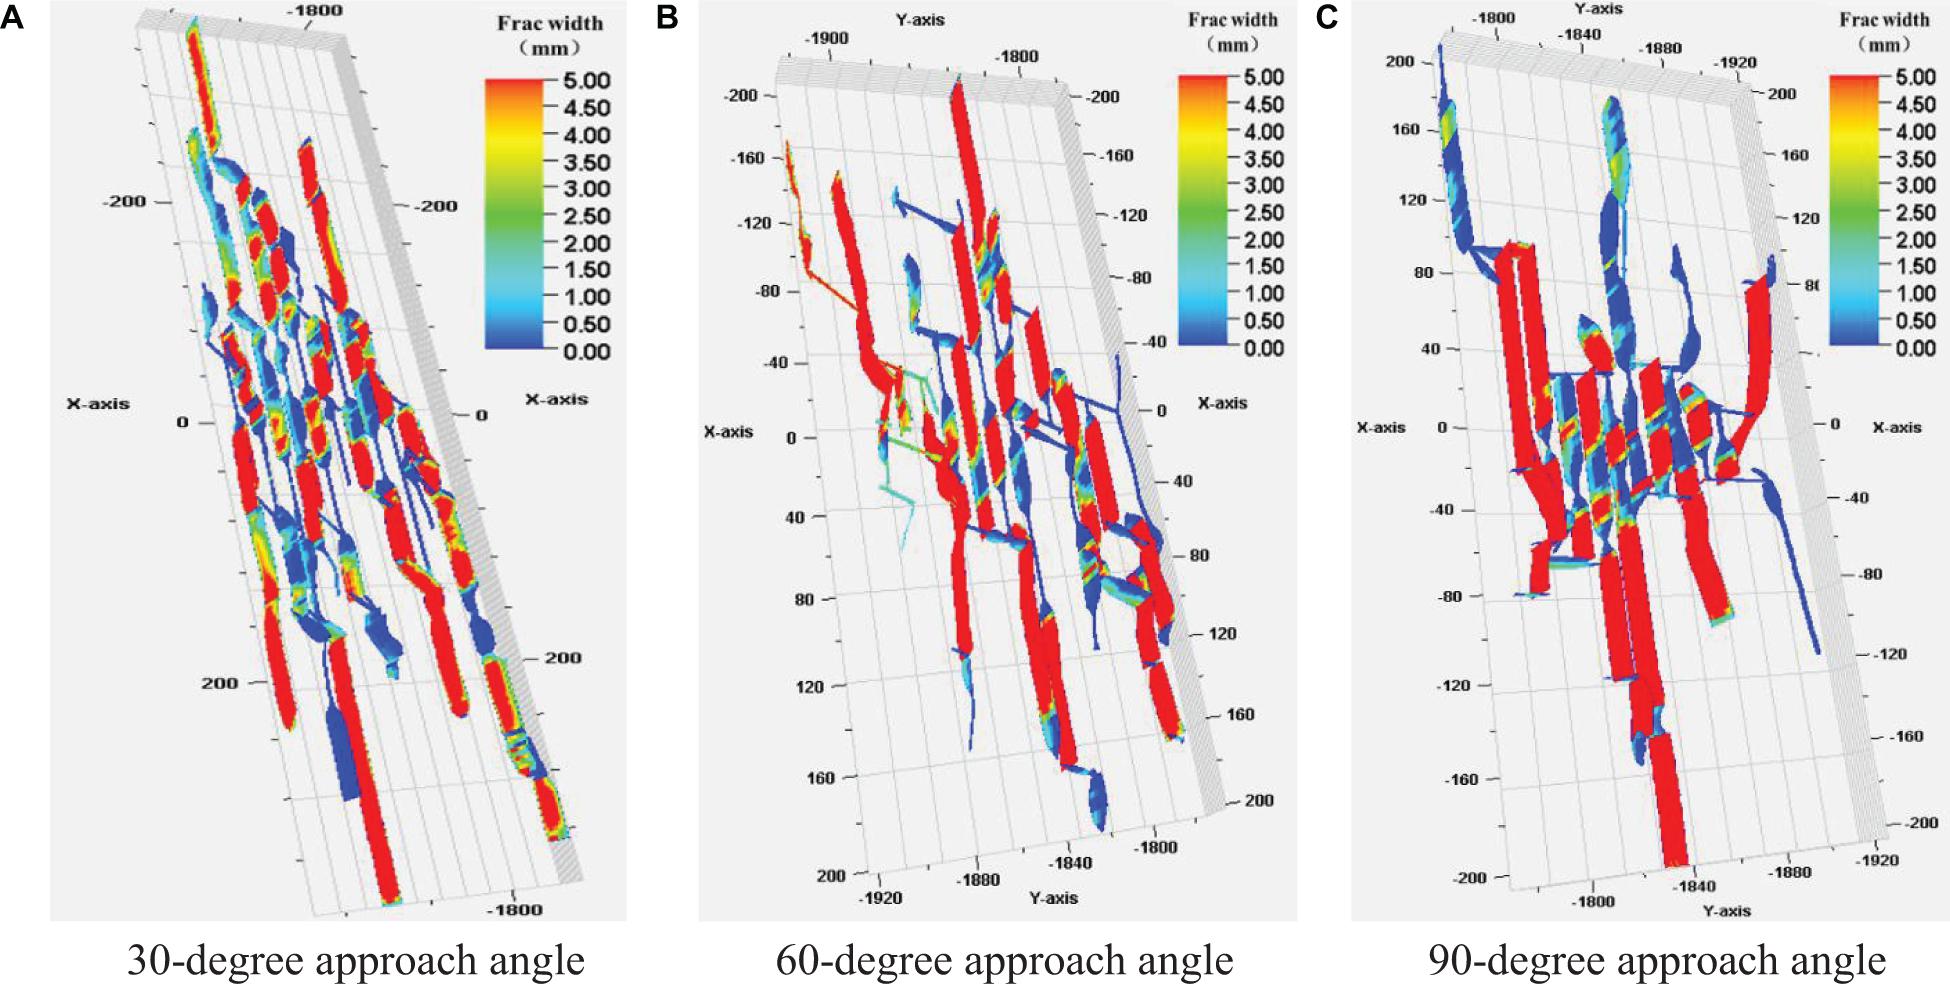
Figure 11. Fracture morphology under different natural fracture approach angles. (A) 30-degree approach angle. (B) 60-degree approach angle. (C) 90-degree approach angle.
Figure 12A shows the fracture length under the conditions of different approach angles. It can be seen from this figure that natural fractures with low approach angles promote the propagation of hydraulic fractures. Although natural fractures cause the high fluid loss of fracturing fluid, natural fractures provide a fast propagation path, which caused hydraulic fractures to spread to the far-field region. However, when the approach angle increases, natural fractures cut off the normal propagation path of hydraulic fractures to the far-field. Hence the shape of hydraulic fractures near the well section is complex, the length of hydraulic fractures gradually decreases. Figure 12B proves the above conclusion. When the approach angle is low, the average fracture length is the highest, the reservoir stimulation zone is the best, and the unevenness is the highest; when the approach angle is high, the average fracture length is the shortest and the unevenness is the lowest.
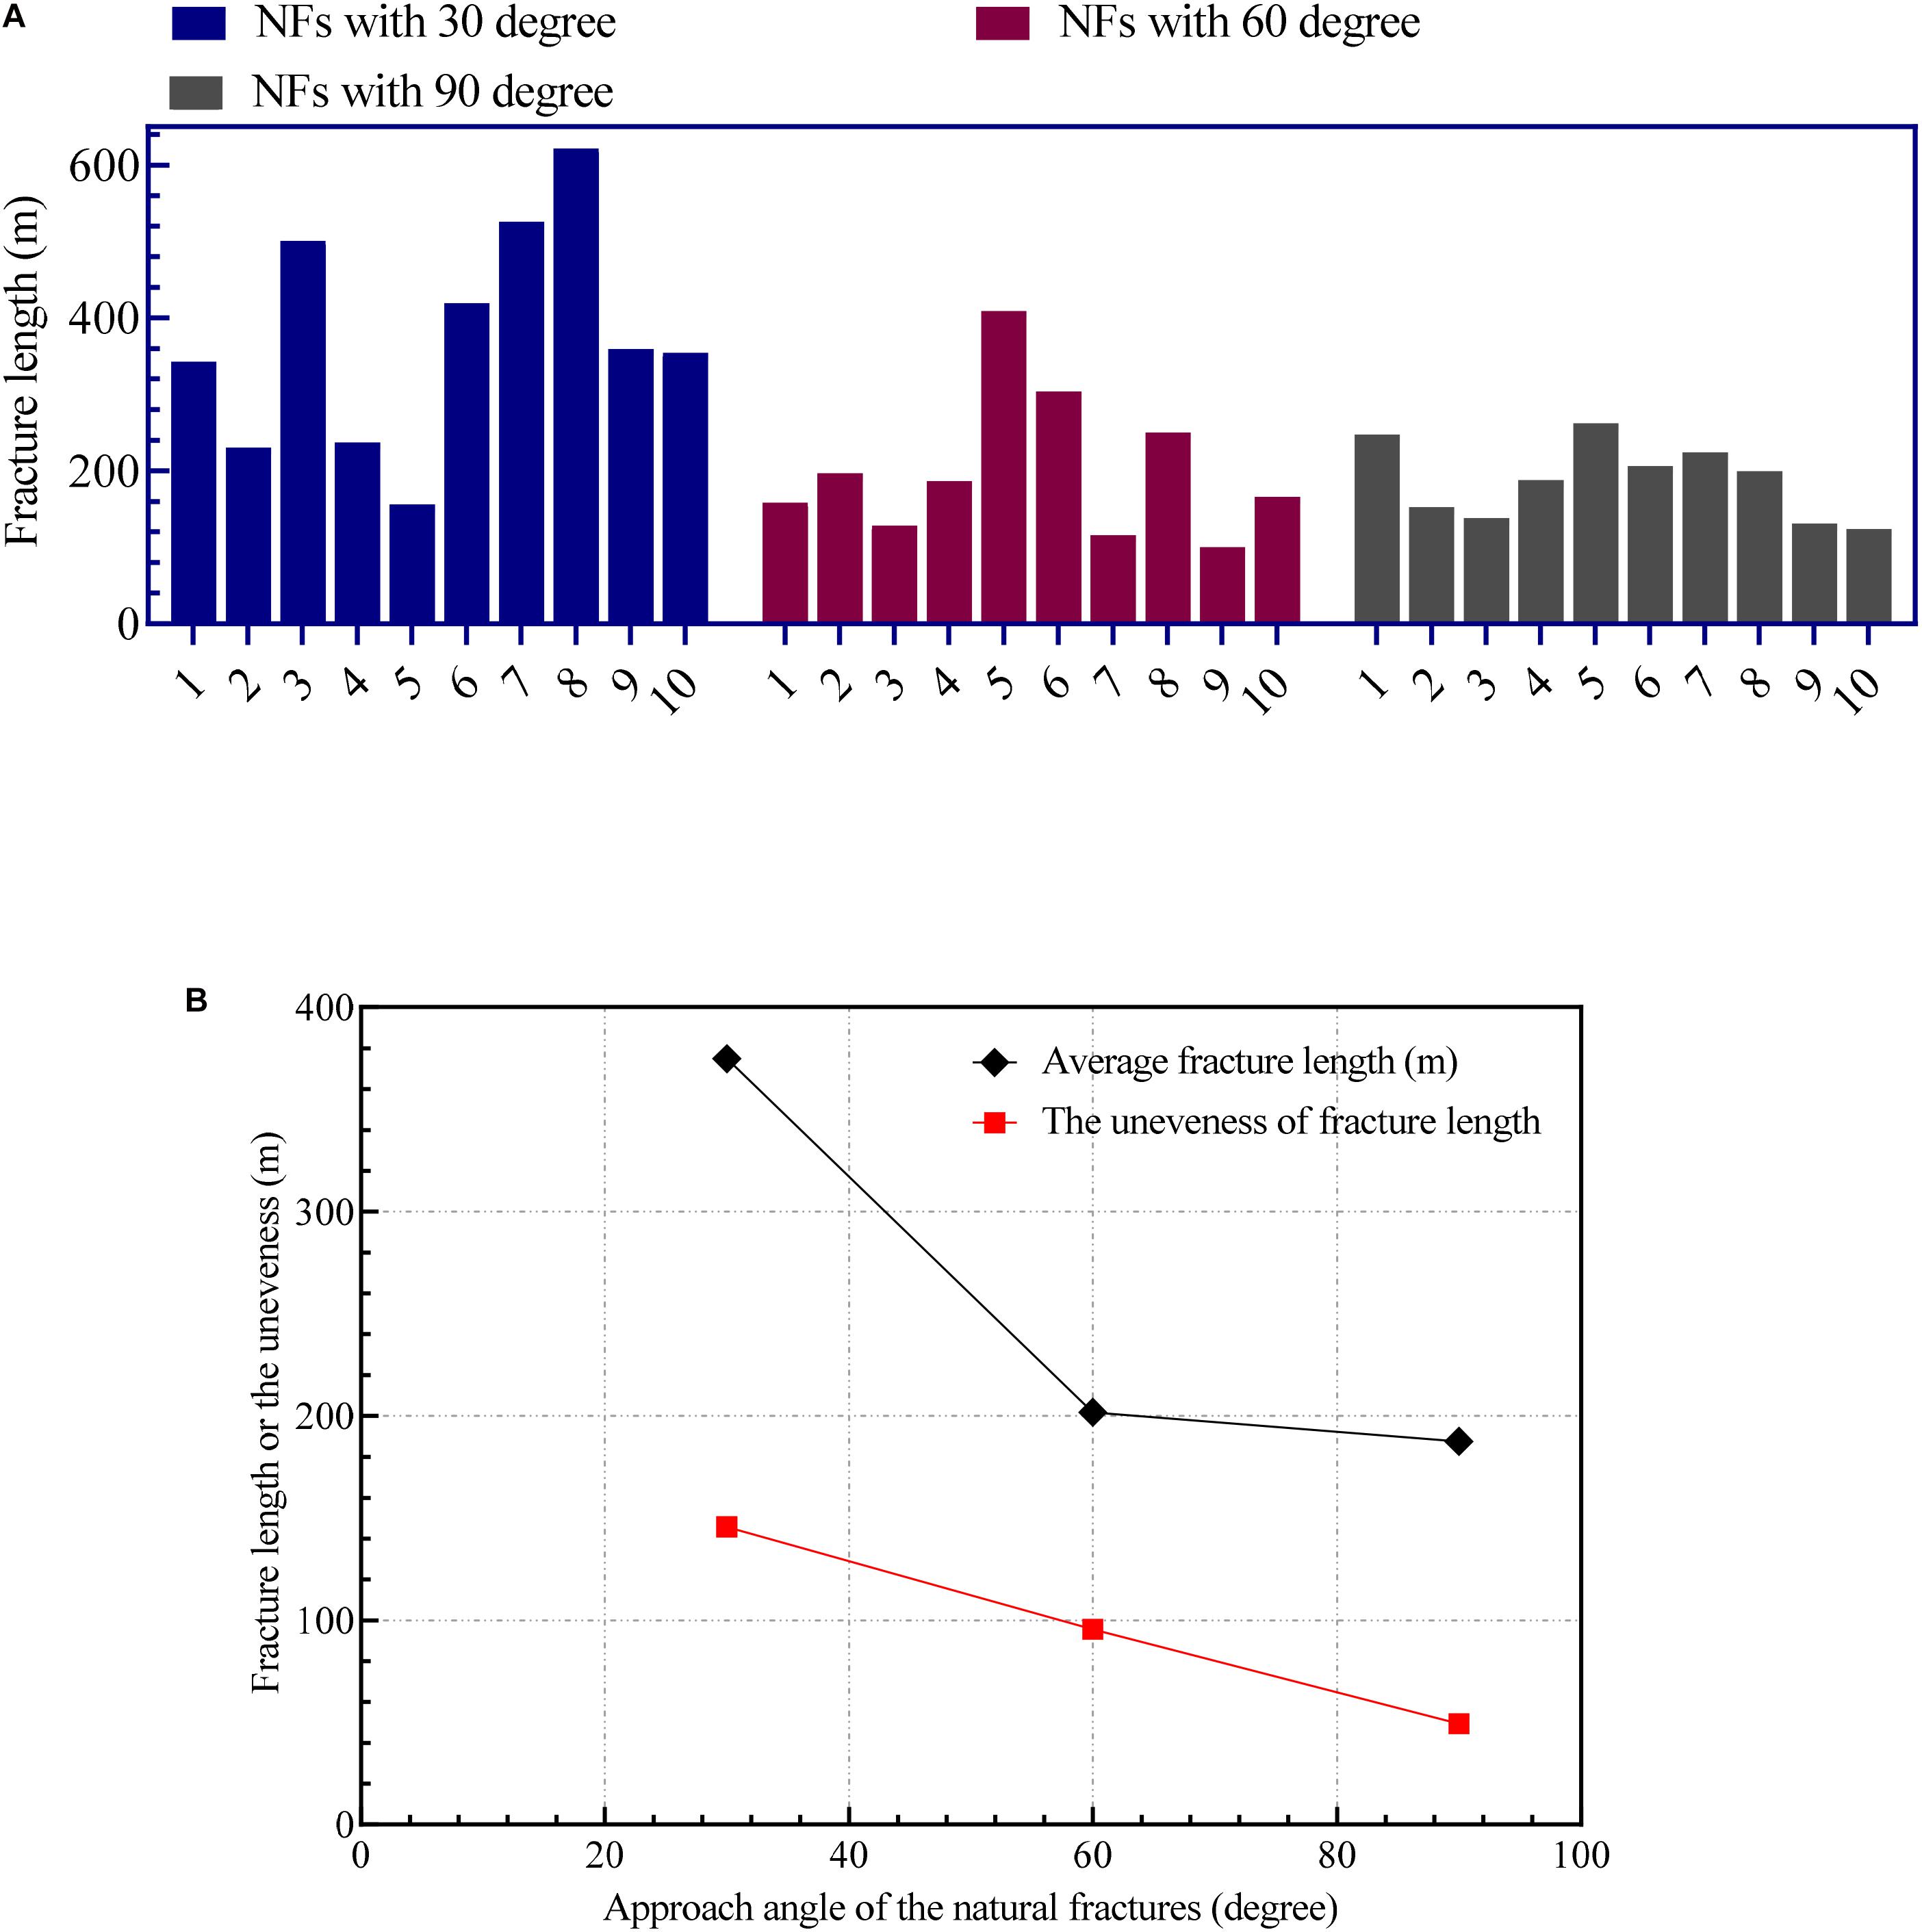
Figure 12. The variation of fracture length and unevenness under different approach angles natural fractures. (A) Fracture length. (B) Average fracture length and unevenness.
Conclusion
This study uses an UFM to carry out geological modeling and fracturing simulation of real Sichuan Changning shale. Comparing with field fracturing treatmentpressurecurvewith the simulationtreatmentpressurecurve, the accuracy of this simulation can be verified. Through a series of numerical simulations of different fracturing parameters, the main conclusions as follows:
1. Small fracture spacing has a strong stress interference during fracturing in the horizontal wells, which will cause obvious uneven propagation of fractures. Its influencing factors include completion parameters (cluster spacing and the number of perforations per cluster) and pumping parameters (fluid injection intensity and proppant injection intensity).
2. Reducing the fracture spacing will increase the stress interference, causing the fracture to appear “radial style,” Meanwhile the unevenness of the fracture’s length increases with the decrease of the fracture spacing.
3. Reducing the number of perforations per cluster can promote more uniform propagation of multiple clusters of fractures and reduce the unevenness of fracture length.
4. Increasing the fluid injection intensity will increase the length of the fractures, but at the same time, it will increase the unevenness of the fracture length and cause the fractures to propagate more unevenly.
5. The increase of proppant injection intensity has little effect on the average length of fractures, while it has a little effect on improving the uniformity of the fracture length.
6. When natural fractures exist, the uniformity of fracture length increases with the decrease of approach angle in horizontal wells.
7. In horizontal large-stage multi-cluster wells, reasonable cluster spacing, and fluid injection intensity should be set to achieve a more effective stimulation effect, meanwhile reducing the number of perforations per cluster is also helpful to improve the uneven propagation.
Data Availability Statement
The original contributions presented in the study are included in the article/Supplementary Material, further inquiries can be directed to the corresponding authors.
Author Contributions
RY wrote the first manuscript and designed the paper framework. F-JZ provided the funds and the research idea of this study. M-HL provided very helpful thoughts and opinions, and made the simulations. YS wrote the introduction and made grammatical modifications to the whole manuscript. X-JZ provided a large number of relevant references and made grammatical corrections to the manuscript. Z-HZ has provided a number of helpful suggestions for the idea of this manuscript. BL and S-YQ have done data analysis and equipment for the whole research for this manuscript. All authors contributed to the article and approved the submitted version.
Funding
This work was financially supported by the Foundation of State Key Laboratory of Petroleum Resources and Prospecting (Grant No. PRP/indep-2-1704), the National Natural Science Foundation of China, the National Science and Technology Major Projects of China (Grant Nos. 2016ZX05051 and 2017ZX05030), and China University of Petroleum – Beijing School Startup Fund (No. ZX20190183).
Conflict of Interest
YS, X-JZ and Z-HZ were employed by company PetroChina Southwest Oil & Gas Field Company. S-YQ was employed by company PetroChinaTarim Oil & Gas Field Company.
The remaining authors declare that the research was conducted in the absence of any commercial or financial relationships that could be construed as a potential conflict of interest.
References
Adachi, J., Siebrits, E., Peirce, A., and Desroches, J. (2007). Computer simulation of hydraulic fractures. Int. J. Rock Mech. Mining Sci. 44, 739–757. doi: 10.1016/j.ijrmms.2006.11.006
Chen, M., Zhang, S. C., Xu, Y., Ma, X. F., and Zou, Y. S. (2020a). A numerical method for simulating planar 3D multi-fracture propagation in multi-stage fracturing of horizontal wells. Pet. Explor. Dev. 47, 171–183. doi: 10.1016/s1876-3804(20)60016-7
Chen, Z., Xue, C. J., Jiang, T. X., and Qin, Y. M. (2010). Application proposal of shale gas well volume fracturing technology in China[J]. Nat. Gas Ind. 30, 30–32. doi: 10.1016/j.wasman.2010.02.001
Crouch, S. L., and Starfield, A. M. (1983). Boundary Element Methods in Solid Mechanics: With Applications in Rock Mechanics and Geological Engineering. London: George Allen & Unwin.
Fan, Y., Zhou, X. J., Ceng, B., Song, Y., Zhou, N. Y., and Chen, Y. (2019). Application of intensive staged fracturing technology in deep shale gas well Zi-2[J]. Xinjiang Pet. Geol. 40, 117–124.
Huang, J., Safari, R., and Fragachan, F. (2018). “Applications of self-degradable particulate diverters in wellbore stimulations: hydraulic fracturing and matrix acidizing case studies,” in Paper Presented at the Proceedings of the SPE International Hydraulic Fracturing Technology Conference and Exhibition. Society of Petroleum Engineers, (The Woodlands TX).
Jia, C. Z., Zheng, M., and Zhang, Y. F. (2012). Unconventional hydrocarbon resources in China and the prospect of exploration and development[J]. Pet. Explor. Dev. 39, 129–136.
Li, J., Dong, S., Wen, H., Li, X. L., and Guo, T. K. (2020). Numerical Simulation of Temporarily Plugging Staged Fracturing (TPSF) based on cohesive zone method. Comp. Geotechnics 121:103453. doi: 10.1016/j.compgeo.2020.103453
Li, Y. M., Chen, X. Y., Zhao, J. Z., Xu, W. J., Wu, J., and Fu, D. Y. (2017). Influence of perforation erosion on multiple growing hydraulic fractures in multi-stage fracturing[J]. Nat. Gas Ind. 37, 52–59. doi: 10.1016/j.ngib.2017.11.002
Liu, X., Qu, Z., Guo, T., Sun, Y., Wang, Z., and Bakhshi, E. (2019). Numerical simulation of non-planar fracture propagation in multi-cluster fracturing with natural fractures based on Lattice methods[J]. Eng. Fract. Mech. 220:106625. doi: 10.1016/j.engfracmech.2019.106625
Liu, X., Rasouli, V., Guo, T., Qu, Z., and Damjanac, B. (2020). Numerical simulation of stress shadow in multiple cluster hydraulic fracturing in horizontal wells based on lattice modelling[J]. Eng. Fract. Mech. 238:107278. doi: 10.1016/j.engfracmech.2020.107278
Ma, X. H., Xie, J., and Yong, R. (2020). Geological characteristics and high production control factors of shale gas in silurian longmaxi formation, southern Sichuan Basin, SW China. Pet. Explor. Dev. 47, 901–915. doi: 10.1016/s1876-3804(20)60105-7
Mack, M. G., and Elbel, J. L. (1992). “Numerical representation of multilayer hydraulic fracturing,” in Paper presented at the The 33rd U.S. Symposium on Rock Mechanics (USRMS), (Santa Fe).
Murphree, C., Kintzing, M., Robinson, S., and Sepehri, J. (2020). Evaluating limited entry perforating & diverter completion techniques with ultrasonic perforation imaging & fiber Optic DTS warmbacks. Paper presented at the SPE Hydraulic Fracturing Technology Conference and Exhibition, Society of Petroleum Engineers, The Woodlands, Texas.
Nolte, K. G. (1991). Fracturing-pressure analysis for nonideal behavior[J]. J. Pet. Technol. 43, 210–218. doi: 10.2118/20704-pa
Nordgren, R. P. (1970). “Propagation of a vertical hydraulic fractures,” in Paper Presented at SPE 45th Annual Fall Meeting, SPE. 3009, (Houston).
Olson, J. E. (2004). “Predicting fracture swarms—the influence of subcritical crack growth and the crack-tip process zone on joint spacing in rock,” in The Initiation, Propagation, and Arrest of Joints and Other Fractures, eds J. W. Cosgrove and T. Engelder (Bath: Special Publication, Geological Society Publishing House), 73–87. doi: 10.1144/gsl.sp.2004.231.01.05
Pan, L. H., Zhang, S. C., Cheng, L. J., Lu, Z. H., and Liu, K. Y. A. (2014). numerical simulation of the inter-cluster interference in multi-cluster staged fracking for horizontal wells[J]. Nat. Gas Ind. 34, 74–79.
Panjaitan, M., Moriyama, A., McMillan, D., Rutledge, L., Xu, J., and Parkhonyuk, S. (2018). “Qualifying diversion in multi clusters horizontal well hydraulic fracturing in haynesville shale using water hammer analysis, step-down test and micro-seismic data,” in Paper Presented at the Proceedings of the SPE Hydraulic Fracturing Technology Conference and Exhibition. Society of Petroleum Engineers, (The Woodlands TX).
Perkins, T. K., and Kern, L. R. (1961). “Widths of hydraulic fractures,” in Paper Presented at 36th Annual Fall Meeting of SPE, Oct, 1961.
Rahim, Z., Al-Kanaan, A., Taha, S., Crawford, E. M., Khalifa, M., Krich, D., et al. (2017). “Innovative diversion technology ensures uniform stimulation treatments and enhances gas production: example from carbonate and sandstone reservoirs,” in Paper Presented at the Proceedings of SPE Hydraulic Fracturing Technology Conference and Exhibition. Society of Petroleum Engineers, (The Woodlands TX). doi: 10.2118/184840-MS
Senters, C. W., Johnson, M. D., Leonard, R. S., Ramos, C. R., Squires, C. L., et al. (2018). “Diversion optimization in new well completions,” in Paper presented at the Proceedings of the SPE Hydraulic Fracturing Technology Conference and Exhibition. Society of Petroleum Engineers, (The Woodlands TX). doi: 10.2118/189900-MS
Wang, B., Zhou, F. J., Zou, Y. S., Gao, L. Y., Hu, J., and Gu, X. L. (2018). Numerical simulation method of fracture interaction during temporary plugging staged fracturing[J]. Fault Block Oil Gas Field 25, 506–509.
Weddle, P., Griffin, L., and Pearson, C. (2018). “Mining the bakken II - pushing the envelope with extreme limited entry perforating,” in Paper presented at the Proceedings of the SPE Hydraulic Fracturing Technology Conference and Exhibition. Society of Petroleum Engineers, (The Woodlands TX). doi: 10.2118/189880-MS
Weng, X., Kresse, O., Cohen, C., Wu, R., and Gu, H. (2012). “Numerical modeling of hydraulic fractures interaction in complex naturally fractured formations,” in Paper Presented at the 46th U.S. Rock Mechanics/Geomechanics Symposium, (Chicago, IL: American Rock Mechanics Association).
Weng, X., Kresse, O., Cohen, C.-E., Wu, R., and Gu, H. (2011). Modeling of hydraulic-fracture-network propagation in a naturally fractured formation. Soc. Pet. Eng.26, 368–380. doi: 10.2118/140253-PA
Wu, Q., Xu, Y., Liu, Y. Z., Ding, Y. H., Wang, X. Q., and Wang, T. F. (2011a). The current situation of stimulated reservoir volume for shale in U.S. and its inspiration to China[J]. Oil Drilling Prod. Technol. 33, 1–7.
Wu, Q., Xu, Y., Wang, T. F., and Wang, X. Q. (2011b). Significant revolution in the concept of increasing production - Introduction to volume stimulation technology[J]. Nat. Gas Ind. 31, 7–12.
Xie, J. (2018). Practices and achievements of the changning–weiyuan shale gas national demonstration project construction[J]. Nat. Gas Ind. 38, 1–7. doi: 10.1016/j.ngib.2017.07.001
Xie, J., Xian, C. G., Wu, J. F., and Zhao, C. D. (2019). Optimal key elements of geoengineering integration in changning national shale gas demonstration zone[J]. China Pet. Explor. 24, 174–185.
Zhao, J. Z., Chen, X. Y., Liu, C. Y., Li, Y. M., Li, H., and Cao, X. J. (2015). The analysis of crack interaction in multi-stage horizontal fracturing[J]. Nat. Gas Ind. 26, 533–538.
Zhou, T., Chen, M., Zhang, S. C., Li, Y. Z., Li, F. X., and Zhang, C. (2020). Simulation of fracture propagation and optimization of ball-sealer in-stage diversion under the effect of heterogeneous stress field[J]. Nat. Gas Ind. 40, 82–91.
Keywords: horizontal well, staged fracturing, fracture propagation, UFM model, uneven propagation
Citation: Yong R, Zhou F-J, Li M-H, Song Y, Zhou X-J, Zhao Z-H, Li B and Qin S-Y (2021) Effects of Fracturing Parameters on Fracture Unevenness During Large-Stage Multi-Cluster Fracturing in Horizontal Wells. Front. Energy Res. 9:612486. doi: 10.3389/fenrg.2021.612486
Received: 30 September 2020; Accepted: 10 March 2021;
Published: 20 May 2021.
Edited by:
Wei Yu, University of Texas at Austin, United StatesReviewed by:
Peng Tan, CNPC Engineering Technology R&D Company Limited, ChinaTiankui Guo, China University of Petroleum (Huadong), China
Copyright © 2021 Yong, Zhou, Li, Song, Zhou, Zhao, Li and Qin. This is an open-access article distributed under the terms of the Creative Commons Attribution License (CC BY). The use, distribution or reproduction in other forums is permitted, provided the original author(s) and the copyright owner(s) are credited and that the original publication in this journal is cited, in accordance with accepted academic practice. No use, distribution or reproduction is permitted which does not comply with these terms.
*Correspondence: Fu-Jian Zhou, emhvdWZqQGN1cC5lZHUuY24=