 Claudio Carbone1*
 Francesco Gracceva1
 Nicola Pierro1
 Vincenzo Motola1
 Yi Zong2
 Shi You2
 Mar Pérez-Fortes3
 Ligang Wang3,4
 Alessandro Agostini1
- 1Italian National Agency for New Technologies, Energy and Sustainable Economic Development (ENEA), Rome, Italy
- 2Centre for Electric Power and Energy, Technical University of Denmark (DTU), Copenhagen, Denmark
- 3Group of Energy Materials, Swiss Federal Institute of Technology in Lausanne (EPFL), Lausanne, Switzerland
- 4Innovation Research Institute of Energy and Power, North China Electric Power University, Beijing, China
The large market penetration of non-dispatchable renewable power sources (vRES), i.e., wind and photovoltaic, may be hampered by an increasing need for large scale energy storage capacity and the challenges of balancing the power grid. Novel technologies integrating waste gasification with reversible Solid-Oxide Cell systems have been proposed to provide flexible grid balancing services. The rSOC system operated in electrolysis mode uses excess power from vRES to generate hydrogen (H2), which is combined with syngas derived from waste gasification to produce methane (CH4). The rSOC system can also be operated in fuel cell mode by oxidising syngas to produce electricity. This paper presents a well-defined case study which aimed to estimate the potential deployment of a novel rSOC technology in a future power system dominated by intermittent renewables. The hourly power grid residual loads (i.e., the difference between load and vRES power generation) and the availability of low-grade organic waste and residues are quantified and matched for the southern Italian peninsula in 2030. The results show that the theoretical grid flexibility needs approximately 10 TW h of overproduction and 5 TW h of underproduction in 2030 to ensure the complete disposal of the municipal organic waste generated in 2030 (6.7 Mt) and that production of renewable CH4 will need to be 1.4–2.4 Mt, pointing to an intriguing perspective for the deployment of rSOC systems at a large scale. The multifunctionality of the system proposed is an added value that can make it a convenient and efficient piece of the puzzle of technologies required in a climate-neutral and circular economy. The results and methods here presented are intended to form the basis for estimations of future potential deployment and economic and environmental assessments of competing technologies.
1 Introduction
The member states of the European Union (EU) have signed and ratified the Paris agreement to keep global warming “well below 2°C above preindustrial levels, and to pursue efforts to limit the temperature increase even further to 1.5°C”. To meet this challenging target, the EU has put forward the ambitious Green Deal, a growth strategy that transforms the Union into a modern, resource-efficient, and competitive economy. Specific goals are (1) no net emissions of greenhouse gases by 2050, (2) decoupling economic growth from resource use, and (3) leaving no person and no place behind. The European Green Deal is the roadmap for making the EU’s economy sustainable (European Commission, 2019).
The greenhouse gas (GHG) emissions resulting from the provision of energy services have contributed significantly to historic anthropogenic climate change, impacting the energy budget of the atmosphere. Since approximately 1850, the global use of fossil fuels (coal, oil, and gas) has increased. These resources now dominate energy supply, which has resulted in the rapid growth in emissions of climate forcers, e.g., GHGs (Edenhofer et al., 2011). Demand for energy and associated services to meet social and economic development and improve human welfare and health is increasing. All societies require energy services to meet basic human needs and to serve productive processes. Historically, economic development has been strongly correlated with increasing energy use and growth of GHG emissions, and renewable energy can help decouple that correlation (Edenhofer et al., 2011).
In its EU2020 climate and energy package of 2009, the EU passed The Renewable Energy Directive (RED) (European Parliament, 2009). The RED set targets for renewable energy at 20% by 2020. In November 2016, the European Commission published the so-called winter package, a set of measures that is part of the ‘Clean Energy for all Europeans’ initiative. A recast of the RED was included in the package. In 2018, the EU agreed on a set of ambitious targets in its 2030 energy union strategy, with renewables expected to cover 32% of total energy consumption (European Commission, 2018b). To reach such an overall renewable energy target, by 2030, the EU needs to meet more than 50% of its gross electricity generation needs through renewable energy sources (RES) because it is easier (and cheaper) to decouple the power sector from fossil fuels than other systems (e.g., transport) (Banja et al., 2017).
Variable/non-dispatchable renewable energy resources (vRES), namely wind and solar photovoltaic (PV) sources, grew over four-fold in capacity in Europe between 2007 and 2016, from 62 to 260 GW (IRENA, 2020), and are still increasing. The costs associated with RES technologies have been decreasing abruptly, especially for solar PV and wind, which have resulted in high levels of competitiveness for RES on a more levelized general power market (IRENA, 2019). However, the large penetration of intermittent, weather-dependent vRES poses serious threats to system operation, such as increased interconnector flows, greater need for balancing and storage, as well as curtailment of vRES (Collins et al., 2018).
The large penetration of vRES on some electric grids has resulted in curtailment in recent years. Studies of renewable energy grid integration have found that curtailment levels may grow as wind and solar energy generation penetration increases (Bird et al., 2016). Collins et al., (2018) found that variable renewable curtailment increased linearly beyond 20% penetration of vRES and that it is an inherent part of highly variable renewable power systems. This is due to operational inefficiency and the costs associated with additional transmission infrastructure and the storage systems needed to avoid curtailment. This challenge could be addressed by trading with neighboring countries/regions or adding more flexible options, depending, case by case, on what is more secure and economically viable.
A broad spectrum of energy storage technologies are currently being evaluated as candidates for transferring surpluses from the electricity grid to the gas grid or a gas-consuming process. The importance of gas technologies for handling high shares of vRES and complying with future curtailment of generation is being discussed at length. Simonis and Newborough (2017) modeled excess wind power in the Emden region of Germany between 2015 and 2020. The study is based on time series data for wind generation and electricity demand, exhibiting that excess renewable electricity levels will reach about 40 MW and 45 GW h per annum by 2020. They concluded that achieving a progression in power-to-gas capacity in the preceding period is necessary.
In this context, rSOC technologies may play a pivotal role in the transition toward the decarbonization of the power grid. The rSOC system can be operated in electrolysis mode using excess power from vRES to generate H2 or in fuel cell mode by oxidising an H2 rich energy carrier to produce electricity. As energy convertors, rSOC systems may enable the penetration of large amounts of vRES in the power grid by offering balancing services and producing renewable fuels for the industry, transport, and heating and cooling sectors, which are the hardest sectors to decouple from fossil fuels. Hutty et al., (2020) presented a successful proof-of-concept application of rSOC systems to real microgrid cases. They found that rSOC systems may reduce the import of grid power and reach up to 50% of grid independence while attaining cost-effectiveness.
Although various technologies exist to provide additional energy storage to the grid, each technology works with a distinct and strict time and energy capacity range (Olsen et al., 2020). Indeed, energy storage systems based on rSOC technology present some key advantages in flexibility, adaptability, capability, and efficiency, where more pronounced balancing needs are observed. The rSOC systems boast easy scalability (e.g., kW to MW) and can be used hourly up to monthly timescales. They can therefore be deployed at different locations, where they can either store energy as fuels or chemicals or be connected to the natural gas grid. The round trip efficiency for these systems is close to 70%, and it is anticipated that this could rise to 80% (Peters et al., 2015). Furthermore, because of the solid feature of solid-oxide stacks, there is limited risk of electrolyte leakage. On the other hand, there are safety issues in terms of fuel utilization, such as: risk of corrosion of materials, carbon deposition and nickel oxidation; the presence of impurities and gas cleaning; balance-of-plant (BoP) modifications and/or new burner and heat exchanger installation. These issues are expected to be resolved and/or fine-tuned to achieve full integration of rSOC systems with gasifiers for large scale deployment (Liu et al., 2013).
A case study for applying a multifunctional system, named Waste2Grids (W2G) hereafter, is proposed. A W2G plant is a combination of an rSOC system with a waste biomass gasifier connected to natural gas and power grids (W2G Project). In a W2G system, the H2 is produced with an rSOC operated as an electrolyser, using excess power from vRES. The H2 is then combined with syngas from biowaste and residue gasification to produce synthetic CH4. The rSOC system can also be operated in fuel cell mode by oxidising syngas to produce electricity.
CH4 is considered an optimal final chemical product due to its large-scale distribution, storage infrastructures and applications. The amount of H2 that could be directly injected into the gas grid is limited by country specific standards and regulations to a maximum of 0–12 vol% (Götz et al., 2016). In contrast, synthetic CH4 may exploit existing natural gas infrastructures for storage in large quantities over long periods of time (in Europe alone, storage capacity is about 1 PW h, i.e., ca. 20% of the total annual consumption) (GIE, 2018). The direct methanation of biogas using hydrogen from electrolysis is another promising pathway for the seasonal storage of renewables in the natural gas network in terms of cost savings (Calbry-muzyka and Schildhauer, 2020). Because it has a large storage and distribution infrastructure already available, CH4 is an optimal energy and carbon carrier that could make vRES available to a large portfolio of final uses due to its intensive integration with other well-established natural gas sectors and facilities, i.e., mobility, as compressed natural gas (CNG) motor fuel, industry or space heating and cooling. An efficient combustion natural gas has low tailpipe or stack emissions. If used in fuel cells, there is virtually no emission of harmful pollutants in the operation phase (Schreiber et al., 2020). This combination of biowaste and residue gasification with the rSOC provides the added value of efficiently disposing and valorizing organic waste, thus limiting environmental impact.
Wang et al. (Wang et al., 2020) originally presented the concept and developed the thermodynamic performance of the novel W2G technology. Building upon these findings, the present study develops and presents an overall methodology for the identification and potential deployment of this technology in specific areas by applying it to an Italian case study. The present study investigates Italian power market zones to identify the areas with the highest penetration of vRES (i.e., vRES-dominated zone) and need storage capacity and flexibility/adequacy in the power system. Based on the historical data of vRES generation and load in the Italian power market and the planned penetration of intermittent renewables, we developed residual load scenario simulations for 2030. These were calculated and matched with biowaste availability, considering the efficiencies of a representative set of novel W2G systems and the maximum technical W2G deployment potential. This study also estimates the hourly power grid balancing needs in 2030 based on NECP projections, along with the spatial distribution and availability of biowaste.
2 Materials and Methods
The overall goal of the W2G technology is to facilitate the penetration of vRES power in RES-dominated areas and efficiently dispose of organic waste by balancing the grid and, at the same time, synthesising a renewable chemical. The first step involves converting various types of carbon-containing waste (e.g., industrial and municipal organic waste, secondary and tertiary biomass) into syngas, a mixture of H2/carbon monoxide (CO)/carbon dioxide (CO2), via gasification. The syngas is then cleaned and further conditioned (if necessary) to meet the requirements of the rSOC unit. It works in Solid-Oxide Fuel Cell (SOFC) mode for power generation (PowGen) and Solid-Oxide Electrolysis Cell (SOEC) mode for power storage (PowSto). This two-mode operation, as defined in W2G, requires interaction with an electrical grid to capture electricity storage and generation needs. However, there might be times when the amount of generated and demanded power are close to each other, i.e., when the corresponding residual loads are limited. To keep the system in continuous operation and avoid the costly and inefficient shutdown and start-up phases, a third operation mode, the power neutral mode, has been introduced (PowNeu). In PowNeu mode, the power produced internally in SOFC mode is also used internally to produce CH4 in SOEC mode. Thus, the plant can be considered as isolated from the electrical grid but remains under operation and can quickly be back-in-service for the electrical grid by switching from the PowNeu mode to PowGen or PowSto modes.
The schematics of the energy flows of the three modes are shown in Figure 1. The gasification process operates all the time, while the solid-oxide cell switches among the three operating modes, depending on the balancing scenarios. In order to allow the operation of the three modes in a single plant, the solid-oxide cell stacks are split into two blocks, Block A and B. Both blocks can switch between SOFC (PowGen) and SOEC (PowSto) modes. The PowGen mode converts the cleaned syngas from the gasification process into power with the fuel cell operation of the solid-oxide cell stack (both Block A and B) and delivers the electricity produced to the grid. The PowSto mode imports electricity from the grid and converts the syngas from the gasification process into CH4 with the electrolyser operation of the solid-oxide cell stack (both Block A and B), and sends the CH4 produced to the natural gas grid. In the PowNeu mode, a part of the syngas is converted in Block A (SOFC operation) into power to drive the Block B (SOEC operation) so that the remaining syngas can be converted into CH4. The overall process is exothermic with a considerable amount of excess heat at the intermediate temperature levels, which can be used by an additional steam cycle to enhance the efficiency of each mode. The concept and thermodynamic performances of W2G technology are described in full detail by Wang et al., (2020).
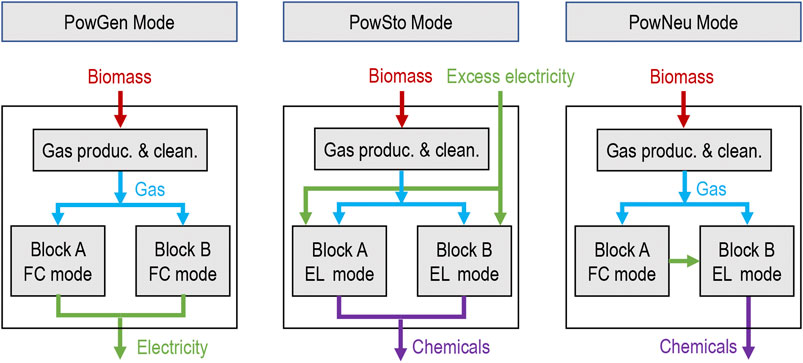
FIGURE 1. Schematic illustration of the energy flows of the three modes for W2G plants. The red arrows stand for energy flows related to biomass fed into the plant and the syngas generated from the gasification processes; the green arrows represent power/electricity flows; the blue arrows indicate energy flows related to water and steam; the purple arrows are the energy flows related to the CH4 produced. The rSOC stacks are split into two blocks—Block A and Block B, to allow for the operation of the three modes in one single plant; Gas production and clean.: gasification and cleaning; FC: fuel cell operation; EC: electrolyzer operation. The Figure is only a simple illustration and does not represent a detailed flowchart.
2.1 General Methodology to Assess the Potential Deployment of Waste2GridS Systems
The methodology for estimating the potential technical deployment of W2G systems in 2030 involves three main tasks (Figure 2). In the first task, an analysis of historical disaggregated data is carried out to quantify the current dispatchable and flexible generation needs (residual loads) in the different market zones with high vRES penetration and the expected development of residual loads in 2030 according to the expected penetration of wind and PV. The second parallel task involves a geographically explicit assessment of the available biomass in the selected areas and feedstock to support the deployment of the W2G technology. The last task involves the identification of the maximum potential deployment of the W2G technology, based on the future availability of waste and residues and the expected theoretical balancing needs of the power system, due to the higher penetration of vRES in 2030.
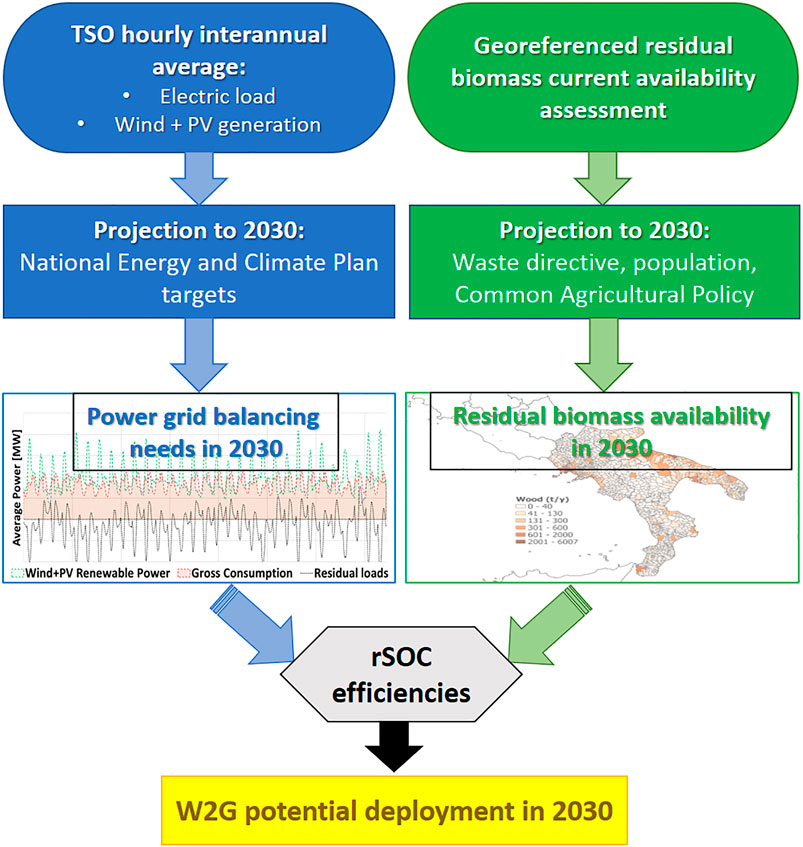
FIGURE 2. Exemplification of the methodology adopted in this work to determine the potential deployment of the W2G systems in specific RES-dominated areas.
2.1.1 Analysis of Current and Future Power Balancing Needs
The current and 2030 balancing scenarios were developed for different electrical zones in Italy to identify the optimal case study (see Section 3.1), based on a statistical analysis of historical/forecasted data provided by the Italian Transmission System Operator (TSO) (Terna, 2019a). The data for the 2030 scenario estimate were obtained by scaling the current power profiles in Italy to the planned expectations for 2030, based on growth targets and trajectories for the renewable share of the electricity sector according to the Italian National Energy and Climate Plan -NECP (Ministero dello Sviluppo Economico et al., 2019). The different zones are assumed to increase proportionally to Italy as a whole. Table 1 reports the expected increase of RES penetration in the time horizon 2016–2030 in Italy, provided by NECP.
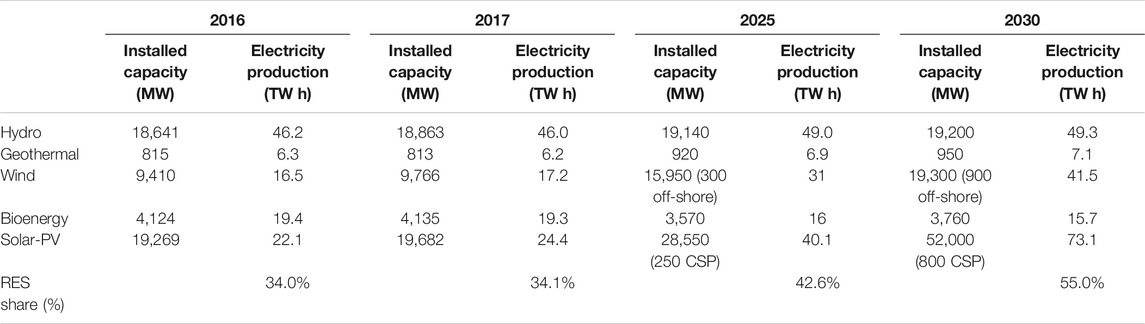
TABLE 1. Italian electric energy mix for RES, in terms of installed capacity (MW) and electricity production (TW h), normalized according to the Directive 2009/28/CE, source: NECP (Ministero dello Sviluppo Economico et al., 2019).
The electricity grid balancing power profiles were estimated based on dispatchable and flexible generation needs. These were defined in terms of residual loads, namely, the imbalance between gross consumption and vRES generation (the sum of wind and solar power generation). The energy balance of the electrical system was calculated on an hourly basis. The residual load was defined hour by hour as the difference between the foreseen load (total electricity demand) and the production from vRES. A positive residual load implies the need for energy sources other than PV and wind to fulfill the grid requirements. A negative residual load occurs when the grid cannot fully absorb the available vRES. The resultant overproduction would be curtailed or fed to a power storage system. The PowGen and PowSto modes of the W2G rSOC system would then be used to balance the positive and negative residual loads, respectively.
To allow for year-to-year fluctuations in the climatological drivers affecting wind and solar PV capacity factors and generation trends, the current power generation profile. Resultant capacity factor average values were applied to up-to-date installed capacity rates for 2018, to determine current vRES energy production. Even though the use of the average capacity factor values may lead to peak shaving and, consequently, underestimate the maximum capacity of the vRES system, this approach was the best compromise, to overcome the inadequacy of one single year representativeness in depicting the inter-annual variability. Load profiles are elaborated accordingly. The inter-annual time-series are compared as a function of working and non-working days to consider the bias caused by the load reduction occurring systematically during weekends.
Figures 3, 4 show the inter-annual variation of historical data relating to capacity factors for wind and solar PV 2011–2018 (w/o 2012) for two months from each year, referring to the selected electrical Italian zone (see Section 3.1) in Southern Italy. The two months reported are January and July, as they were considered representative of the cold and warm seasons. The green line indicates the averaged values taken as current status to calculate power generation according to the installed capacity reported for 2018.
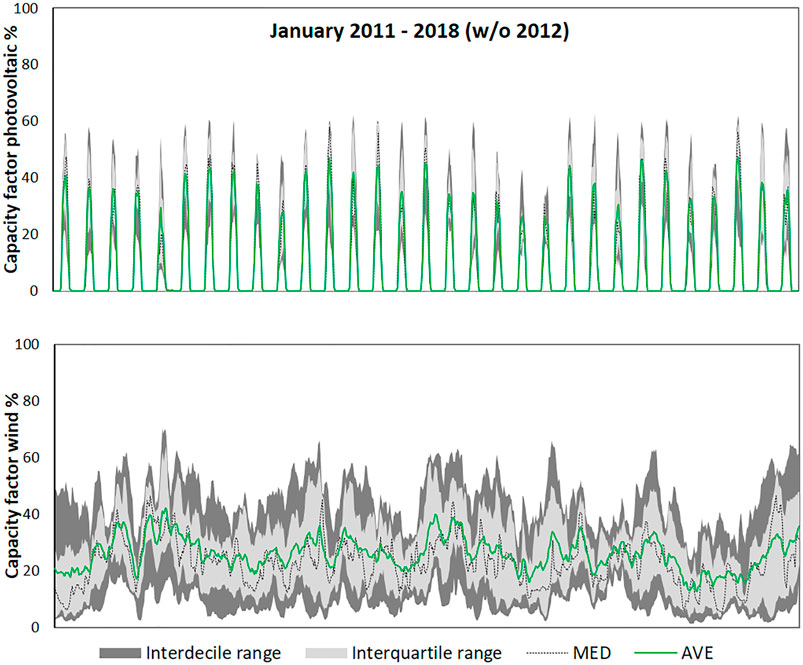
FIGURE 3. Statistics of 2011–2018 (w/o 2012) historical hourly based data of capacity factors for PV (A) and wind (B) corresponding to January (cold season). Interdecile range, interquartile range, median (MED), and average (AVE) values are plotted.
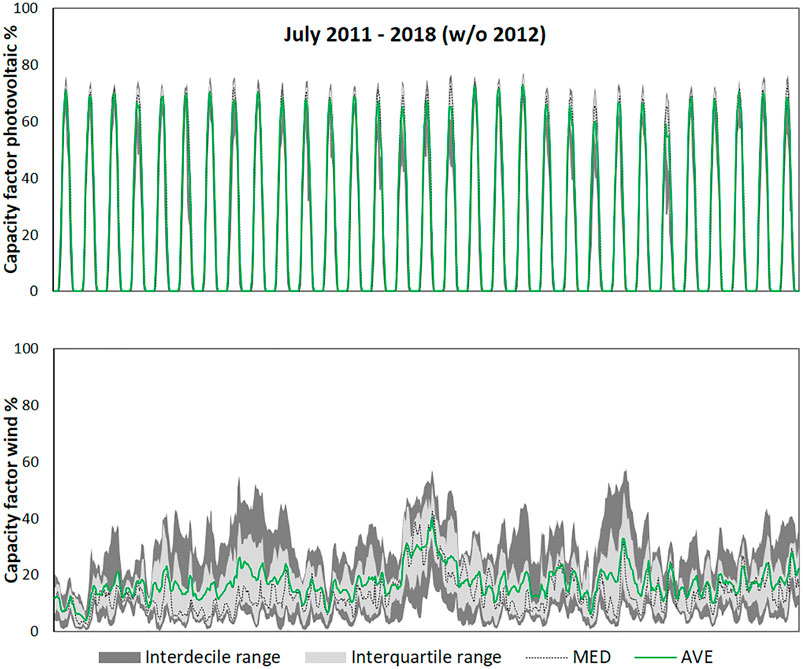
FIGURE 4. Statistics of 2011–2018 (w/o 2012) historical hourly based data of capacity factors for PV (A) and wind (B) corresponding to July (warm season). Interdecile range, interquartile range, median (MED), and average (AVE) values are plotted.
Wind power production exhibits no clear diurnal pattern but a favorable seasonal profile with much more intensity and variation and a consequent higher production during the cold season. Solar PV is characterized by its typical daily pattern, with multi-peak daily trends with higher intensity in the middle of the day and steep changes in concomitance with sunrise and sunset, as well as a higher contribution in the warm season.
To estimate the expected residual loads in 2030, the current hourly-based generation profiles and the electrical load patterns were generated for the entire annual timescale. The dataset was then scaled to 2030 based on the targets provided by NECP (Ministero dello Sviluppo Economico et al., 2019). The applied increase coefficients are assumed, in comparison to 2018 installed capacity, as 222.7, 276.5, and 102.1%, for wind, PV generation, and load, respectively.
2.1.2 Biomass Assessment
In combination with evaluating the grid balancing needs in 2030, we also characterized the biomass availability to fuel the W2G technology. There are many biomass classification schemes available worldwide.
The scheme adopted in this work was developed by the EU BEE Project (Biomass Energy Europe Project, 2020), which aimed to harmonize methodologies for biomass resource assessments for energy purposes in Europe and its neighboring countries. This approach to biomass assessment is in compliance with the EU S2Biom Project (S2Biom Project, 2020). Accordingly, biomass resources were evaluated as follows:
Energy crops: wood energy crops (short rotation forestry, i.e., willow, eucalyptus, poplar), grass energy crops (miscanthus, hemp), oilseed crops (rape, linseed, sunflower), hydroponics (lake weed, kelp algae).
Wood, wood residues and by-products: wood and wood branches from forest, wood residues from the industrial sector (sawmills, construction, furniture).
Agricultural residues: wheat or barley straw, corn stover, pruning (fruit, vineyard).
Livestock: pig and cattle slurry, sheep manure, grass silage, poultry litter.
Agro-industrial residues: residues and waste from various processes in the distillery, dairy, meat, fish, oils, fruit and vegetable sectors.
Waste: sewage sludge, organic fraction of MSW.
Taking into account the technology investigated and the characteristics of the examined areas, the following biowaste categories are considered:
Agricultural residues: cereal straw, fruits tree pruning.
Waste: MSW organic fractions, waste wood, and waste paper.
The Italian National Institute of Statistics (ISTAT a, 2020) reports annual grain and fruit production and their cultivated areas at the EU NUTS 2 level (European Commission, 2018c). The annual straw and pruning are computed at the NUTS 2 level and then allocated on the NUTS 3 level using information from the Italian Agriculture Census (ISTAT b, 2020) as a proxy, enabling a higher spatial resolution at the scale of Italian municipalities. Straw and pruning residues are then quantified by applying specific empirical conversion factors, taken from (ENAMA, 2011), to the annual production of grain and fruits.
MSW data are provided by the Italian Institute for Environmental Protection and Research (ISPRA) (ISPRA Waste database, 2020), the public Italian authority in charge of monitoring waste management, which elaborates on the annual MSW report, a database containing quantitative data on all the fractions of the MSW at NUTS3 level. The 2018 report was considered (reference year 2017), and three different MSW fractions—i.e., organic, paper, and wood–are quantified for the municipalities of interest. MSW quantification for the year 2030 was performed according to the mandatory goals set by the Waste Directive (EU) 2018/851 (European Commission, 2018). The MSW was therefore considered as separated at origin in its organic fraction.
Annual straw, pruning, waste paper, waste wood, and MSW data are elaborated and then computed by employing the Q-GIS (Quantum Geographical Information System) software and raster algorithms (QGIS, 2020) to produce a georeferenced dataset on the spatial distribution and availability of organic waste. The georeferenced datasets ensure data interoperability, Standard Query Language (SQL) query capabilities, and dynamic visualization.
The ratio underpinning this shortlist is that the gasification technology, though it may work with many more feedstock types, is more reliable and efficient with low moisture feedstock (Sikarwar et al., 2016). In addition, dry feedstocks are more easily transported and stored. Low grade waste streams were also considered, as hypothetically, these will suffer from less competition from other uses in a future bio-based economy and have a lower, and in some cases, negative cost.
Environmental aspects also contributed to the identification of the feedstocks considered. Fruit tree pruning often involves field burning, causing the emission of air pollutants. Though it may be considered a residue, cereal straw provides benefits to soil health, ecosystem services, and removes carbon from the atmosphere (Giuntoli et al., 2016). Energy crops were excluded for their competition for agricultural land (European Commission, 2015) and their environmental impact, which involves using machinery, fertilizers, and pesticides on a large-scale (Agostini et al., 2015).
Several other sources consider the net annual increment (NAI) of the forest biomass to be available for bioenergy production, at least partially (e.g., both Biomass Energy Europe Project; S2Biom Project). However, forest biomass was also excluded from the present study as we focus on low grade residual biomass, and because the appropriation of the forest NAI for bioenergy production would instantaneously release this carbon into the atmosphere, thus cannot be considered carbon neutral, but rather as a foregone sequestration (Pan et al., 2011; Maxwell et al., 2019).
Manures were excluded from the present study due to their moisture content and the difficult and costly processes involved with handling, transporting, and storing it.
2.1.3 Potential Deployment
We also considered the efficiency of the W2G system to assess whether the amount of residual biomass and waste estimated for the 2030 scenario would be sufficient to cover the full grid balancing needs of the examined area.
There are degrees of freedom in the design of W2G plants. Each plant itself comprises the processes of onsite biomass pre-treatment, gasification, syngas cleaning, rSOC stacks, methanator, heat exchanger network, and steam turbine network (for heat recovery). The sections of biomass pre-treatment, gasification and syngas cleaning were considered to operate at full load all the time without load shifting in order to continuously provide the same amount of clean syngas for the rSOC stack and methanation subsystems. The coordination of the two rSOC blocks (Figure 1) and the methanator enables the plant to switch between the PowGen/PowSto/PowNeu modes. Therefore, the operating strategy of each subsystem mentioned above is as follows:
PowGen: biomass pre-treatment, gasification, syngas cleaning, rSOC block A (SOFC mode), rSOC block B (SOFC mode), methanator (hot standby), heat exchanger network, and steam turbine network.
PowSto: biomass pre-treatment, gasification, syngas cleaning, rSOC block A (SOFC mode), rSOC block B (SOEC mode), methanator (partial-load operation), heat exchanger network, and steam turbine network.
PowNeu: biomass pre-treatment, gasification, syngas cleaning, rSOC block A (SOEC mode), rSOC block B (SOEC mode), methanator (full-load operation), heat exchanger network, and steam turbine network.
The plant design can be varied by changing (1) the combination of gasification technology (entrained flow gasifier or circulating fluidized bed gasifier), syngas cleaning technology (hot/cold), electrolysis mode (steam electrolysis or co-electrolysis), and (2) the design operating points of the key components, particularly the stacks (under both SOFC and SOEC modes). For this paper, the technology combination was selected as it is a fast-internally circulating fluidized bed gasifier, hot syngas cleaning, and fuel-electrode supported cell stack. All the aspects mentioned above were implemented into an optimization platform to derive a set of optimal plant designs (design pool). They show the trade-off between mode-efficiency (i.e., PowGen, PowSto) and capital expenditure (CAPEX), or specific cell area per kW-LHV of the processed biomass. For the purpose of this work, five options are shortlisted from the pool of the optimal designs, which we considered sufficient to enable a good coverage of the overall characteristics of the W2G technology. Other design freedoms can be automatically optimized by considering different process configurations, as detailed in Wang et al., (2020).
The key stack design points for the five designs selected are listed in Table 2. The energy content of the biomass needed as input to produce the specified amounts of electricity or CH4, and the corresponding efficiency values in PowSto and PowGen modes are also reported.
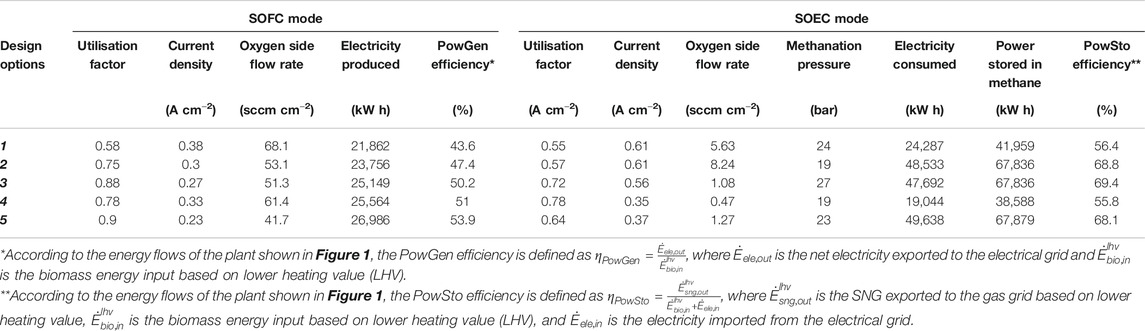
TABLE 2. Key stack design points, energy flows needed as input to produce the specified amounts of electricity or CH4, and the corresponding efficiency values in PowSto and PowGen modes, for the five optimal designs selected.
The energy content of the available feedstocks was quantified by applying the same lower heating values (LHV) used by the European Commission for the calculation of the default values of the RED (Giuntoli et al., 2017).
By combining the waste availability and process design efficiencies, the constraints to the deployment of the W2G technology were identified in terms of maximum power utilization in the PowSto mode and the PowGen mode.
3 Results
In this section, the results of the biowaste availability, power grid balancing needs, and potential deployment of the W2G technology are reported. All these estimates represent the technical sustainable potential, they do not account for competition with other uses of the biomass and waste, as these depend on the economic performance of the technology and markets and policies that are not accounted for in this work. Furthermore, they do not account for the potential use of other technologies for the stabilization of the power grid or connectivity with other power markets to dispose of the excess power from vRES.
3.1 Identification of vRES-Dominated Areas and Future Dispatchable and Flexible Power Generation Needs
The Italian power market uses zonal management systems, which reflect grid limitations in transmission capacity. The stretched shape of the Italian Peninsula, dominated by the Apennines, a mountain chain extending from the North-West to South-East, bordered by narrow coastlands across the middle of the country, limits the possibility of achieving a full meshed grid integration, especially between North and South of Italy. The Italian electricity market implemented a zonal structure in which the zones are defined as parts of the National power grid, where physical limits exist for electricity transfers to/from other geographical areas. The six geographical zones of the national network are shown in Figure 5: Northern Italy (NORD), Central-Northern Italy (CNOR), Central-Southern Italy (CSUD), Southern Italy (SUD), Sicily (SICI), and Sardinia (SARD). It is likely that in the future, there will be more investment in the grid to help increase the flexibility of the overall system, reduce curtailments and local congestion. However, the short- to mid- term deployment of local storage systems could play an important role in a transition to high-vRES scenarios.
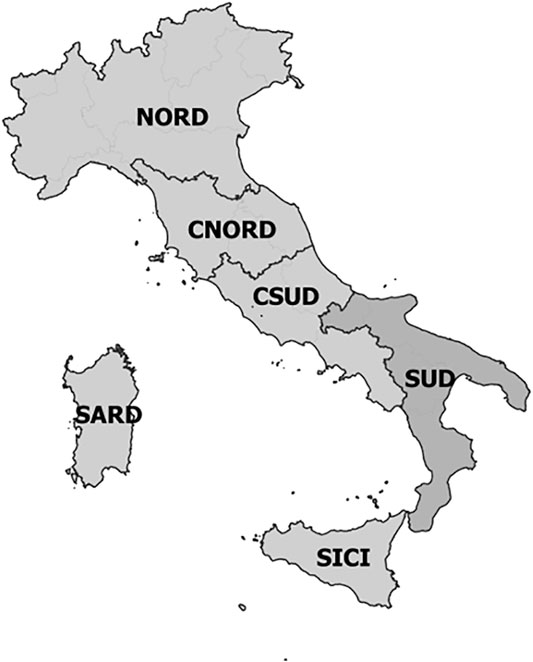
FIGURE 5. Zones in the Italian electricity system (adapted from Terna, 2019b).
In Italy, at the end of 2017, the installed capacity of wind and solar PV was approximately 9.8 and 19.7 GW, corresponding to 17.2 and 24.4 TW h of electricity generation, respectively. This represents a total renewable energy penetration of 12.5%, which is expected to increase over the next few years. The NECP envisages a central role for vRES in the future Italian power energy mix, with PV expected to account for more than a half of the power capacity by the end of the decade, (i.e., 50 GW installed capacity by 2030). In NECP projections, RES estimate an electricity generation of 186.8 TW h, including 74.5 and 40.1 TW h of PV and wind power, respectively. In this study the 2018 data provided by TERNA, the Italian TSO in charge of high voltage electricity transmission networks and the auxiliary services market throughout the country, were explored and disaggregated into the six market zones. The 2018 renewable penetration rates for wind and PV power are 5, 10, 16, 27, 28, and 54%, in NORD, CNOR, CSUD. SARD, SICI, and SUD, respectively (Ministero dello Sviluppo Economico et al., 2019).
Figure 6 shows the distribution of the PV and wind power installed capacity in Italy in provinces and regions, respectively. Most wind power plants (more than 95%) are located in the south of Italy, while solar PV plants are distributed more uniformly throughout the country, with a slightly higher contribution in northern regions. In terms of power generation, the higher productivity of the PV plants in the South is due to more than 2000 h of sunshine per year, counterbalanced by a higher number of proper sites for distributed generation in the North (e.g., civil and industrial building roofs). However, Northern regions, being more densely populated and industrialized, exhibit a less pronounced overproduction from vRES (Guandalini et al., 2017), indicating that Southern areas will be more impacted by transmission congestion and energy curtailments in the future.
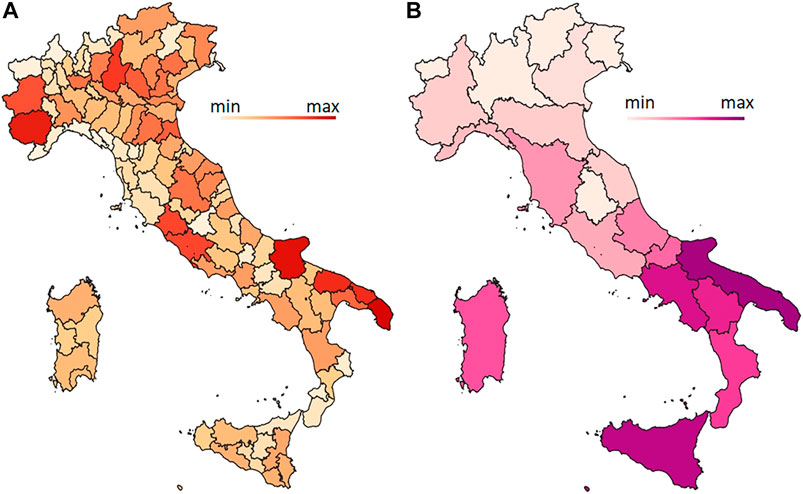
FIGURE 6. Distribution of the installed capacity for wind (A) 2018 and PV (B) 2019 power.
A recent analysis of the Italian authority for power system management shows that vRES penetration has already determined an increasing wind curtailment in Italy. In 2019, the wind power energy curtailment was estimated at 6,067 GW h (3% of the total wind production), 62% of which is concentrated in the South of Italy (ARERA, 2020).
The Italian lockdown in spring 2020 due to the Covid-19 pandemic can be considered a sort of real-scale laboratory experiment of the expected conditions of the electricity system in 2030. According to preliminary estimations (ENEA, 2020), wind curtailment could have reached ca. 60 GW h in a single week (April 27–May 3, 2020), corresponding to 10% of the total wind curtailment in 2019, and providing important warning signals about the adequacy of the future power system.
This is reflected by our 2030 power grid balancing scenarios. Figure 7 shows hourly-based residual loads patterns for SUD; the zone exhibiting the highest negative residual loads. The plots refer only to two months, i.e., January and July, reported as representative of the cold and warm seasons. They show that a low frequency of positive residual loads and a large overproduction of vRES power are expected (i.e., flexibility needs dominated by PowSto), without significant seasonal fluctuations. In SUD. The influence of heating and lightning requirements during winter is counterbalanced by cooling system consumption during summer, resulting in a limited annual variation in electricity demand.
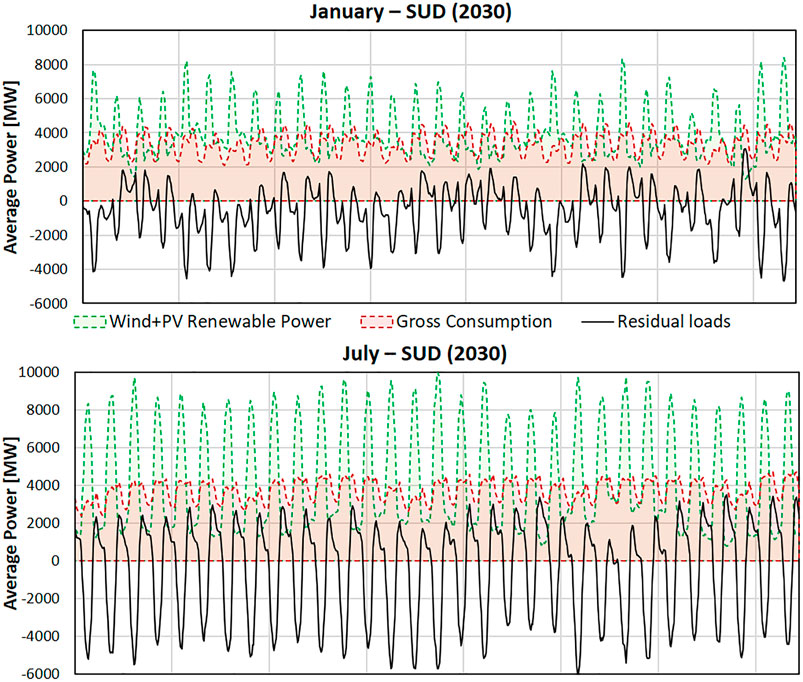
FIGURE 7. The total variable renewable generation (PV and wind) and residual load (hourly-based) in January (A) and July (B) for the RES-dominated regions in Italy, namely the SUD zone as here defined. Expected scenarios in 2030.
Table 3 reports our estimations, calculated from the same dataset, of hours in overproduction for 2030 in Italy. They evidence a much more pronounced overproduction for SUD with respect to the other zones, corresponding to a large increase in installed vRES capacity, which drives a strong mismatch between production and load. This points to significant storage requirements in the time horizon 2020–2030, with large capacity combined with rapid charge/discharge periods, which could potentially be matched by the W2G technology.
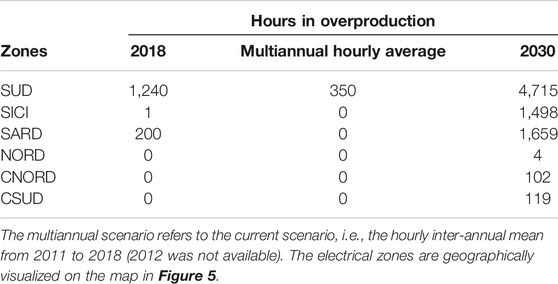
TABLE 3. Summary of overproduction in different zones of the Italian electrical power system, according to TSO data and our projections.
Molise, Puglia, Basilicata, and Calabria, the four regions in the SUD zone, were therefore identified as the main RES-dominated Italian areas, and SUD was selected as the case study in the present work.
3.2 Residual Biomass Availability in 2030
The amount of biomass available that could be converted to syngas and enable the operation of W2G technology in the RES-dominated zone SUD was quantified by building a Geographical Information System (GIS) geodatabase that spatially covers the areas identified as the power market zone SUD (i.e., the regions Molise, Puglia, Basilicata, and Calabria) and the region Campania. The neighboring region of Campania was added for the biomass availability quantification because of the high potential of municipal solid waste (MSW) production from the city of Naples and its surrounding area and their lack of disposal capacity (i.e., issues experienced with illegal waste disposal and export to other regions) (Ripa et al., 2017). The georeferenced database was used as input to evaluate the feasibility of the proposed technology and to estimate the size of future plants with the scope of balancing the 2030 electricity grid by recycling waste, taking into account its 2030 targets in compliance with the RED recast (European Comission, 2018) directive and the EU Circular Economy package (European Comission, 2018).
The agricultural residues considered include cereals, straw, and fruit trees pruning, as these were identified as the most relevant agricultural residues in the selected southern regions. SUD presents a total area of 62,531 km2, of which 17,550 and 9,962 km2 are covered by cereal crop cultivation and fruit tree plantations, respectively.
For the regions under evaluation, the crops chosen for the straw biomass availability assessment were Wheat, Barley, Oat, Rice, Corn, and horticulture. These cultivation areas for these crops amount to 1,755,020 ha. The fruit trees with more relevant production in the selected regions were olives, vineyards, peaches, apricots, cherries, and oranges, for the reference year 2018, totaling an area equal to 996,234 ha.
The sustainability standards for agricultural forestry and land management deriving from the Common Agricultural Policy (CAP) (European Commission, 2018a) were taken into account to elaborate the 2030 projections for agricultural farming practices, land management, and agreed (national and regional) forestry management plans.
The CAP sustainable agricultural farming practices include applying conservation of Soil Organic Carbon (SOC) practices (e.g., Cross Compliance issues of ‘maintaining agricultural land in good farming and management condition’ and avoiding soil erosion). Moreover, there may be market constraints, as straw is already used for livestock bedding, animal feed, and in the future could be used in biorefineries, building biomaterials, and second-generation biofuel (ENAMA Biomass Project, 2020). Therefore, to account for the impact on soil health, ecosystem services, storage of carbon in the soil, and competition with other markets, only a conservative 30% of total straw production was estimated to be available in 2030.
Fruit tree pruning currently has limited uses. They can be used for conventional combustion. However, given the very high moisture content (about 60%), high bark and ashe content, low spatial density (2–4 t d.m./ha), and the high collection bailing and transport costs, they are not competitive on the market. Currently, pruning offcuts are left in the fields or burned to preserve fruit trees from infection (ENAMA Biomass Project, 2020). The real limitation for the use of this resource in the year 2030 is likely to be feedstock market prices, in case of pruning for syngas conversion, as no significant environmental constraints were present. For the year 2030, the base potential is considered 90% of the potential calculated for 2018.
The 2030 waste stream availability was estimated based on demographic projection and the goals outlined in the Circular Economy Package Directive (European Commission, 2018).
Figures 8A–E show georeferenced maps of expected waste and residue availability in 2030, indicating pruning, straw, waste paper, waste wood, and MSW, respectively. Figure 8F shows the total waste and residue availability for gasification in a W2G plant in 2030.
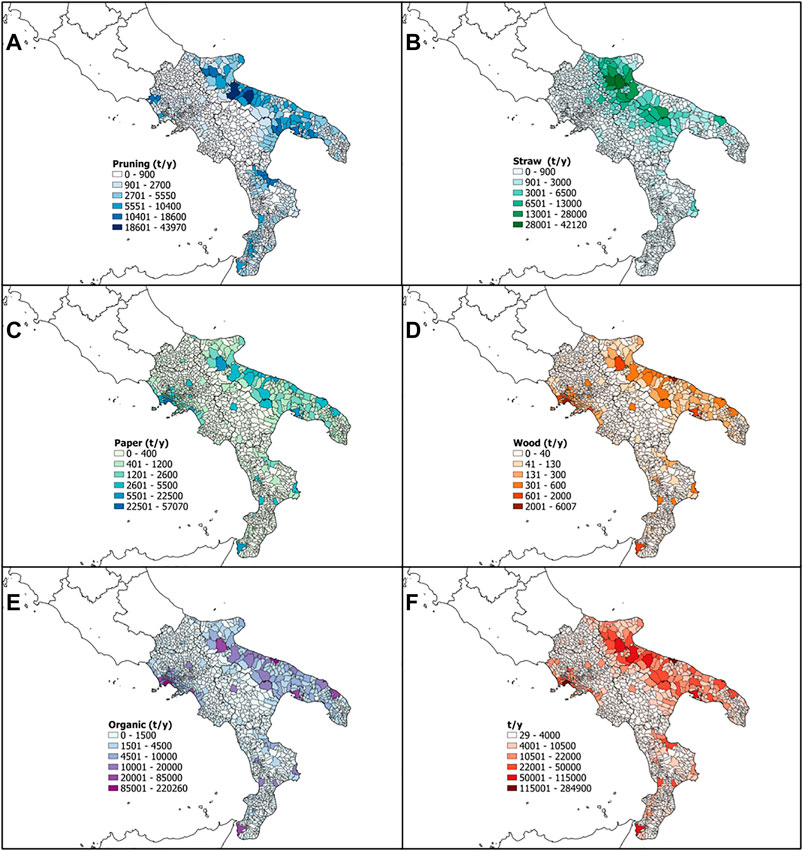
FIGURE 8. Georeferenced maps of 2030 projections, technical potential for (A) pruning, (B) straw (C) wood, (D) paper (E) municipal organic waste, and (F) total feedstocks availability.
The potential obtained was thus considered as sustainable technical potential (Figure 9). It does not include any economic aspects, in particular, regarding alternative uses of the same feedstocks in a future European bioeconomy. While this methodological approach tends to overestimate the availability of waste and residue, limiting the waste and supply area to the region under analysis has an opposite impact on estimates, as it excludes potential imports. Residue (and waste in particular) are often transported for long distances, e.g., a large percentage of the waste produced in the Central and Southern regions of Italy are treated in plants located in the Northern regions, indicating a national movement of waste from South to North (Malinauskaite et al., 2017). Transboundary transport is common as well. In extraordinary cases, large amounts are transported between countries (The New York Times, 2020. A Whiff of Naples Arrives in Hamburg, 2008). Thus, in the framework of this study, we referred to the technical potential to account for at least current sustainability constraints, refraining from any economic analysis and market and policy issues, such as future competing uses. The georeferenced organic waste stream database and the power grid data have been made available online (W2G Project).
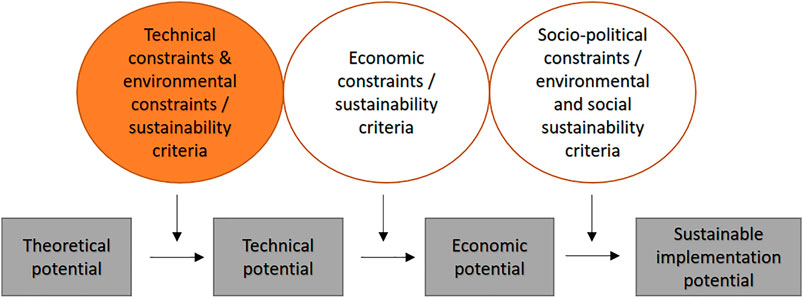
FIGURE 9. Biomass potential classification, adapted from (S2Biom Project).
Table 4 provides the total technical potential of residues and waste available for SUD in 2030 and the corresponding energy content. The energy content refers to the dry part of the biomass. This approach reflects the limited impact of water content on gasification processes, which contrasts with combustion, where the moisture content of the fuel was determined. For the year 2018, the maximum technical potential of straw was estimated at 2,754,612 t d.m./year, while the maximum technical potential of pruning was 1,356,780 t d.m./year.
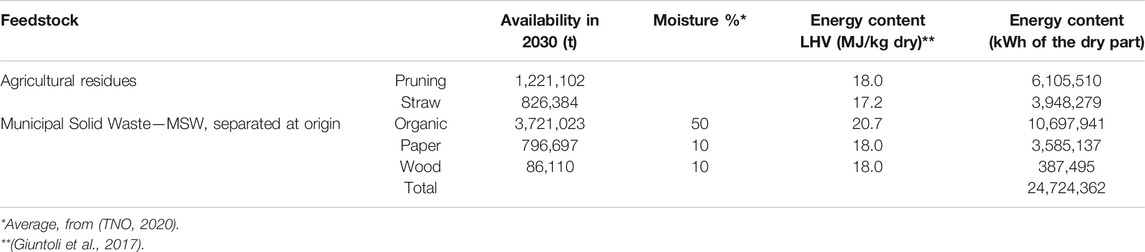
TABLE 4. Technical potential of the feedstock in 2030.
3.3 Potential Deployment of Waste2GridS Technology in the Italian Case Study
The maximum potential installed capacity is identified for the RES-dominated zone SUD, both in PowGen and PowSto modes.
Table 5 presents the results, comparing the residual loads expected in 2030 with the maximum power capacity of the W2G technology, which can be matched by the biomass waste and residues available (Table 4) in those regions. The five best performing designs—D1, D2, D3, D4, and D5—and the corresponding efficiencies were taken into account (Table 2). Data are reported in terms of availability of biomass with respect to the energy needs for the two examined modes of operation, i.e., PowGen mode and PowSto mode, for SUD. The total waste availability is the total energy content of waste and residues, expressed in MW h.
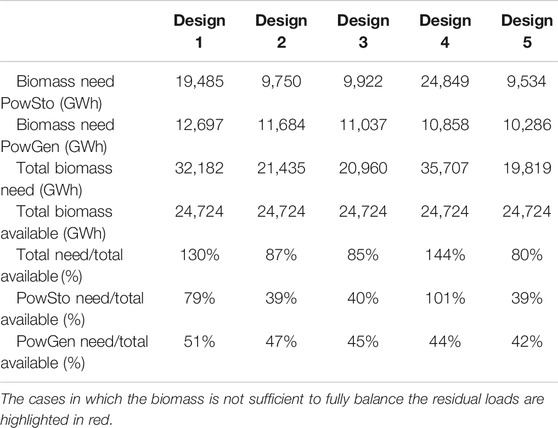
TABLE 5. Comparison between the residual loads and the local (in-around SUD) biomass waste and residue availability, in terms of energy content, by adopting W2G technology in the five proposed designs.
Biomass needs PowGen is the amount of biomass required as gasification feedstock to fuel the PowGen operation required to balance the power grid. Biomass need PowSto, shows the total amount of biomass needed to produce the amount of syngas required to match the amount of excess electricity in the power grid, and stoichiometrically produce enough CH4 to be injected into the gas grid. The total biomass need corresponds to the sum of Biomass need PowSto, and Biomass need PowGen.
If the total biomass need is larger than the total biomass availability, this implies a surplus of biomass. The only constraint to W2G technology deployment is the flexibility needs of the power grid. The cells in red highlight the cases in which the residue and waste are not sufficient to cover the balancing and flexibility demands of the power grid.
Histograms in Figure 10 show the frequency and capacity of hourly balancing needs for the power grid system analysis in 2030 (A) and the cumulative residual load in terms of power consumption or production (B). The cumulative residual load represents the potential operation of W2G systems in PowGen and PowSto modes, to fully satisfy the dispatchable and flexible generation needs of the power grid.
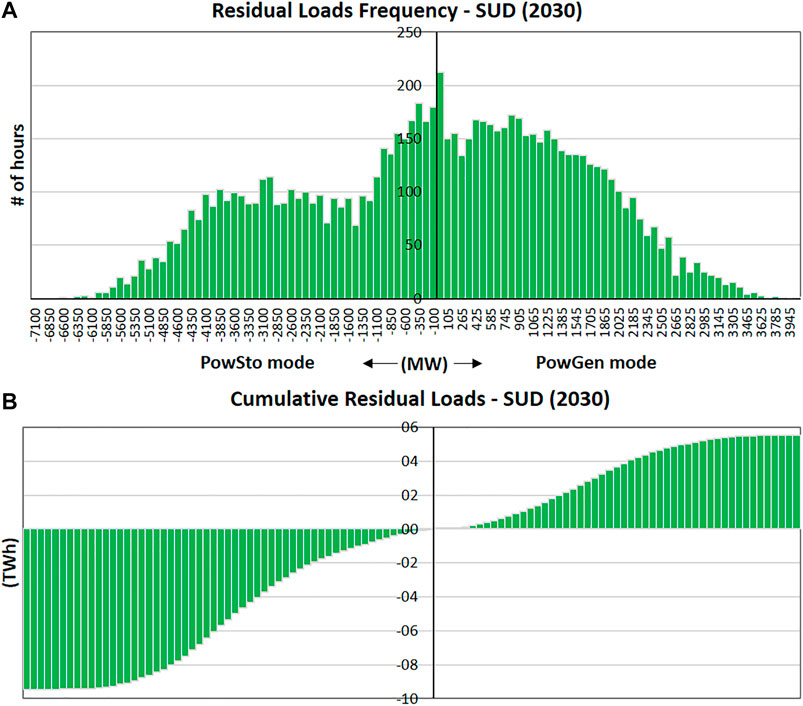
FIGURE 10. Frequency histogram of the hourly PowGen/PowSto power capacity (A). Energy content of waste and residues needed to support W2G technology deployed in the vRES-dominated zone (B). 2030 scenario in Southern Italy (SUD zone).
In PowGen mode, the amount of available biomass satisfies the energy demand for all the configurations. The biomass availability is not a constraint to the operation of the PowGen mode. The local biomass would be able to balance the excess electricity in the power grid in SUD. The same is true in PowSto mode for D1, D2, D3, and D5, whereas the amount of biomass is sufficient to run a maximum capacity of 4225 MW in PowSto mode, D4. These results correspond to the production of renewable CH4 in the range 1.4–2.4 Mt. The total biomass required to balance the power grid in both modes of operation is considerably higher than the amount of biomass potentially available in 2030, resulting in not enough in D1 and D4 designs.
The methodology applied in this work show that incorporating the 2030 expectations of wind and solar power penetration into the existing electricity system in SUD, would result in large and frequent surpluses and deficits that are attributable to the patterns of vRES variability. In order to satisfy the magnitude of the surplus and deficits, corresponding in total to ca. 5.5 and 9.4 TW h, respectively, a 4,025 and 6,600 MW of maximum potential installed capacity are identified when the system is operated as PowGen and PowSto, respectively.
4 Discussion
W2G systems are rSOC combined with the gasification of waste and residues. The overall approach of the system was conceived in this perspective to provide grid-balancing flexible services with the ability to fulfill upward and downward power adjustments that are able to operate both as SOFC and SOEC. The scope of this work aimed to estimate the potential role of the W2G system in fulfilling the reasonably predicted 2030 power grid balancing needs for a well-defined case study of a specific geographical zone in terms of biomass availability and vRES penetration.
In the first step of the analysis, the 2030 dispatchable and flexible power generation needs were estimated by the high penetration of intermittent, weather dependent vRES in Italy. Based on these results, the power market zone SUD (Figure 5) was identified as the RES-dominated zone for Italy. In the second step, the low-grade residual biomass availability in the same area was quantified. In the third and last step, the power grid balancing needs were matched with biowaste availability by considering the efficiency of optimized W2G systems.
Based on statistically high resolution historical data and a plausible estimation of power generation and load in 2030, this work provides the characterization of specific power grid balancing needs and a detailed georeferenced biowaste availability assessment, to explore the maximum potential capacities of W2G technology both in power storage mode and power generation mode.
In the power storage mode, the W2G system uses excess power from vRES combined with syngas from waste gasification to produce CH4, which is then injected into the natural gas grid for transport and storage. This operational mode is a key asset of the technology as it offers a multiplicity of added values:
it allows a higher penetration of renewables by absorbing the excess power, which can cause grid unbalances or renewables power generation curtailment;
it produces an energy and carbon carrier which has already a large distribution network and storage capacity;
it can provide long term seasonal storage of the excess renewables power;
it produces an energy carrier which may be used to decouple fossil fuels fromall sectors of the economy (transport, space heating, industry and others);
it contributes to solving the issue of organic waste disposal.
In power generation mode, the syngas produced from waste is used as SOFC to produce renewable power and dispose of organic wastes and residues.
On top of that, the plant's reversibility enables continuous operation, improving efficiency and economic costs by avoiding both unproductive phases and the ramp-up and down (or warming and cooling) time of single mode power generation or storage technologies.
The results indicated that the amount of waste and residue in the examined Italian region was enough to match the power storage balancing needs of the power grid. In the power generation mode, the residue and waste were sufficient to generate all the electricity need by the power grid in most design configurations. The potential for the deployment of W2G technology is impressive, with an order of magnitude of the rSOC capacity of approximately 4 and 7 GW when the rSOC operates in power generation and power storage modes, respectively. The operation of the W2G systems would correspond to about 5.5 TW h of power generated and 9.6 TW h of energy absorbed from the grid, and approximately 1.4–2.4 Mt of methane produced; while, at the same time, disposing of 6.7 Mt of biowaste. In agreement with our estimate, at least as an order of magnitude, the Italian TSO, in its adequacy analysis of the NECP scenario, reports projections of a need of approximately 6 GW additional to centralized storage capacity, mainly in the South, for 2030 (Terna, 2019c). These potentials are theoretical upper limits to the deployment of the W2G systems, as merely the sustainable technical potential of biowaste and power grid estimated balancing needs are considered.
5 Conclusion
The power sector is one of the main contributors to global warming, and RES may play a key role in its decarbonization. The transition toward a climate-neutral energy system requires higher penetration of vRES, namely wind, and PV. The EU aims at achieving a 96–99% renewable energy share in the power sector by 2050 (EU energy roadmap 2050). This paper proposes a case study for the potential deployment of the novel W2G rSOC system in the so-called RES-dominated area in Italy, to enable such a renewable penetration in the power sector.
The results showed that the power overproduction from intermittent renewables might be an opportunity instead of an issue. The W2G technology could dispose of all the organic waste of a RES-dominated zone and fully balancing the power grid. In the long term (summer-winter), it could produce valuable renewable fuels (i.e., syngas, H2, and CH4) and a chemical building block for the other sectors of the economy (transport, space heating, industry).
The research question underpinning the methodology proposed in this work is ‘what is the potential deployment of the W2G technology’. To answer that question, the two other questions to answer are ‘what is the balancing need of the power grid in 2030?’ and ‘what is the availability of biowaste in 2030?‘. This study has presented a methodological approach that answers these questions. The same approach could also be applied to other areas characterized by overproduction of vRES and potentially interested in applying similar technologies to dispose of the organic waste and balance the power grid.
The results of the present study show sustainable technical potentials. They are not meant to represent an optimal solution but rather indicate the maximum potential deployment of the technology and support the identification of an optimal design and scale for future studies. This paper provides insights into potential operating parameters and locations where W2G-like technologies could be used to treat biowaste and/or balance the power grid. This prospective case study does not provide a final resolution for the application of rSOC technology in the transition toward a 100% renewable energy power sector in Italy as it did not account for the economic and political factors that drive wholesale prices and the total system costs of the power grid.
This work contributes to understanding of biowaste availability and which power sector features are needed to implement overall EU energy targets. Further to the methodological approach outlined, our datasets on waste flow availability and power grid balancing needs provide the basis for similar studies and/or market/techno-economic optimization modeling in the future.
Data Availability Statement
The raw data supporting the conclusions of this article were made available by the authors, without undue reservation, and can be found in the ZENODO repository at: 1) waste stream dataset: https://zenodo.org/record/3629527#.X-x-v9hKiUk; 2) power grid (renewables and consumption) dataset: https://zenodo.org/record/3625882#.X-x-1dhKiUk.
Author Contributions
AA, LW, MP-F, YZ, and SY undertook funding acquisition, designed the research project and the overall methodology. CC, AA, and FG analyzed power generation and load data. NP and VM performed the biomass assessment in Italy. CC and AA wrote the paper. All authors contributed to review and editing of the manuscript.
Funding
This work was supported by the European Union Horizon 2020 Grant Agreement No. 826161 Waste2GridS Project, and by the Fuel Cells and Hydrogen Joint Undertaking Program.
Conflict of Interest
The authors declare that the research was conducted in the absence of any commercial or financial relationships that could be construed as a potential conflict of interest.
Abbreviations
LHV, Low Heating Value; PowGen mode, Power Generation mode of the rSOC; PowNeu mode, Power Neutral mode of the rSOC; PowSto mode, Power Storage mode of the rSOC; PV, photovoltaic; RED, Renewable Energy Directive of the European Parliament; RES, renewable energy resources; RES-dominated zone, areas characterized by high penetration of renewable energy resources; rSOC, reversible Solid-Oxide Cell; SOEC, Solid-Oxide Electrolysis Cell; SOFC, Solid-Oxide Fuel Cell; t.d.m., tons of dry matter; TSO, Transmission System Operator; vRES, non-dispatchable/variable renewable energy power resources; SUD, The identified RES-dominated zone for Italy, including four political regions in the South of Italy (Basilicata, Calabria, Molise, Puglia); W2G, Waste2GridS Project/Technology.
References
Agostini, A., Battini, F., Giuntoli, J., Tabaglio, V., Padella, M., Baxter, D., et al. (2015). Environmentally sustainable biogas? The key role of manure co-digestion with energy crops. Energies. 14, 33–39. doi:10.3390/en8065234
ARERA. (2020). Report. Available at https://www.arera.it/it/docs/20/321-20.htm.
Banja, M., and Jégard, M. (2017). Renewable technologies in the EU electricity sector trends and projections: analysis in the framework of the EU 2030 climate and energy strategy. doi:10.2760/733769(online)
Biomass Energy Europe Project. (2020). Biomass Energy Europe Project. Available at http://www.eu-bee.eu/. (Accessed).
Bird, L., Lew, D., Milligan, M., Carlini, E. M., Estanqueiro, A., Flynn, D., et al. (2016). Wind and solar energy curtailment: a review of international experience. Renew. Sustain. Energy Rev. 65, 577–586. doi:10.1016/j.rser.2016.06.082
Biswas, S., Kulkarni, A. P., Giddey, S., and Bhattacharya, S. (2020). A review on synthesis of methane as a pathway for renewable energy storage with a focus on solid oxide electrolytic cell-based processes. Front. Energy Res. 8, 64. doi:10.3389/fenrg.2020.570112
Calbry-muzyka, A. S., and Schildhauer, T. J. (2020). Direct methanation of biogas—technical challenges and recent progress. doi:10.3389/fenrg.2020.570887
Collins, S., Deane, P., Ó Gallachóir, B., Pfenninger, S., and Staffell, I. (2018). Impacts of inter-annual wind and solar variations on the European power system. Joule 2, 2076–2090. doi:10.1016/j.joule.2018.06.020
Davies, J., Dolci, F., Klassek-Bajorek, D., Ortiz Cebolla, R., and Weidner, E. (2020). Current status of chemical energy storage technologies. doi:10.2760/280873
Edenhofer, O., Pichs-Madruga, R., Sokona, Y., Seyboth, K., Eickemeier, P., Matschoss, P., et al. (2011). IPCC special report on renewable energy sources and climate change mitigation summary for policymakers and technical summary. doi:10.5860/CHOICE.49-6309
ENAMA Biomass Project. (2020). Biomass project. Available at https://www.enama.it/progetto-biomasse/sccc7227d. (Accessed).
ENAMA. (2011). Report. Available at https://www.progettobiomasse.it/it/pdf/studio/p1c2.pdf.
ENEA. (2020). Report 02/2020. Available at https://www.enea.it/it/seguici/pubblicazioni/analisi-trimestrale-del-sistema-energetico-italiano.
European Commission. (2018a). COM(2018) 392. Available at https://eur-lex.europa.eu/resource.html?uri=cellar:aa85fa9a-65a0-11e8-ab9c-01aa75ed71a1.0003.02/DOC_1&format=PDF.
European Commission. (2018c). Regulation 1059/2003. Available at https://eur-lex.europa.eu/legal-content/EN/TXT/PDF/?uri=CELEX:02003R1059-20180118&from=EN.
European Parliament. (2009). Directive 2009/28/EC of the European parliament and of the council of april 23 2009. doi:10.3000/17252555.L_2009.140.eng
GIE. (2018). GIE Existing gas storage capacity in Europe exceeded one petawatthour in 2018, shrinked against 2016-GIE. Available at https://www.gie.eu/index.php/gie-media/press-releases/ (Accessed).
Giuntoli, J., Agostini, A., Caserini, S., Lugato, E., Baxter, D., and Marelli, L. (2016). Climate change impacts of power generation from residual biomass. Biomass Bioenergy 89, 146–158. doi:10.1016/j.biombioe.2016.02.024
Giuntoli, J., Agostini, A., Edwards, R., and Marelli, L. (2017). Solid and gaseous bioenergy pathways : input values and GHG emissions. Calculated according to the methodology set in COM(2016) 767 (EUR 27215). doi:10.2790/27486
Götz, M., Lefebvre, J., Mörs, F., McDaniel Koch, A., Graf, F., Bajohr, S., et al. (2016). Renewable Power-to-Gas: a technological and economic review. Renew. Energy 85, 1371–1390. doi:10.1016/j.renene.2015.07.066
Guandalini, G., Robinius, M., Grube, T., Campanari, S., and Stolten, D. (2017). Long-term power-to-gas potential from wind and solar power: a country analysis for Italy. Int. J. Hydrogen Energy 42, 13389–13406. doi:10.1016/j.ijhydene.2017.03.081
Hutty, T., Dong, S., and Brown, S. (2020). Suitability of energy storage with reversible solid oxide cells for microgrid applications. Energy Convers. Manag. 226, 113499. doi:10.1016/j.enconman.2020.113499
IRENA. (2019). Report. Available at https://www.irena.org/publications/2019/Mar/Renewable-Capacity-Statistics-2019.
IRENA. (2020). Report. Available at https://www.irena.org/publications/2020/Jun/Renewable-Power-Costs-in-2019.
ISTAT a. (2020). Download data. Available at http://dati.istat.it/ (Accessed).
ISTAT b. (2020). Download data. Available at http://dati-censimentoagricoltura.istat.it/Index.aspx (Accessed).
Liu, M., Lanzini, A., Halliop, W., Cobas, V. R. M., Verkooijen, A. H. M., and Aravind, P. V. (2013). Anode recirculation behavior of a solid oxide fuel cell system: a safety analysis and a performance optimization. Int. J. Hydrogen Energy 38, 2868–2883. doi:10.1016/j.ijhydene.2012.12.070
Malinauskaite, J., Jouhara, H., Czajczyńska, D., Stanchev, P., Katsou, E., Rostkowski, P., et al. (2017). Municipal solid waste management and waste-to-energy in the context of a circular economy and energy recycling in Europe. Energy 141, 2013–2044. doi:10.1016/j.energy.2017.11.128
Maxwell, S. L., Evans, T., Watson, J. E. M., Morel, A., Grantham, H., Duncan, A., et al. (2019). Degradation and forgone removals increase the carbon impact of intact forest loss by 626%. Sci. Adv. 5, 2546. doi:10.1126/sciadv.aax2546
Ministero dello Sviluppo Economico. (2019). Ministero dell’Ambiente e della Tutela del Territorio e del Mare, and Ministero delle Infrastrutture e dei Trasporti. Piano Nazionale Integrato per l’Energia e il Clima.
Olsen, K. P., Zong, Y., You, S., Bindner, H., Koivisto, M., and Gea-Bermúdez, J. (2020). Multi-timescale data-driven method identifying flexibility requirements for scenarios with high penetration of renewables. Appl. Energy 264, 33. doi:10.1016/j.apenergy.2020.114702
Pan, Y., Birdsey, R. A., Fang, J., Houghton, R., Kauppi, P. E., Kurz, W. A., et al. (2011). A large and persistent carbon sink in the world’s forests. Science 333, 988–993. doi:10.1126/science.1201609
Peters, R., Deja, R., Blum, L., Nguyen, V. N., Fang, Q., and Stolten, D. (2015). Influence of operating parameters on overall system efficiencies using solid oxide electrolysis technology. Int. J. Hydrogen Energy 40, 7103–7113. doi:10.1016/j.ijhydene.2015.04.011
QGIS. (2020). QGIS project. Available at https://www.qgis.org/en/site/. (Accessed).
Ripa, M., Fiorentino, G., Vacca, V., and Ulgiati, S. (2017). The relevance of site-specific data in Life Cycle Assessment (LCA). The case of the municipal solid waste management in the metropolitan city of Naples (Italy). J. Clean. Prod. 142, 445–460. doi:10.1016/j.jclepro.2016.09.149
S2Biom Project. (2020). S2Biom Project. Available at https://www.s2biom.eu/en/. (Accessed).
Schreiber, A., Peschel, A., Hentschel, B., and Zapp, P. (2020). Life cycle assessment of power-to-syngas: comparing high temperature Co-electrolysis and steam methane reforming. Front. Energy Res. 8, 1–17. doi:10.3389/fenrg.2020.533850
Sikarwar, V. S., Zhao, M., Clough, P., Yao, J., Zhong, X., Memon, M. Z., et al. (2016). An overview of advances in biomass gasification. Energy Environ. Sci. 9, 2939–2977. doi:10.1039/c6ee00935b
Simonis, B., and Newborough, M. (2017). Sizing and operating power-to-gas systems to absorb excess renewable electricity.. Int. J. Hydrogen Energy 42, 21635–21647. doi:10.1016/j.ijhydene.2017.07.121
Terna. (2019a). Download data. Available at https://www.terna.it/it/sistema-elettrico/transparency-report/download-center. (Accessed).
Terna. (2019b). Download data. ed evoluzione del Sistema Elettrico_8d75639fa148d01.pdf. Available at: https://download.terna.it/terna/Contesto. (Accessed).
Terna. (2019c). Rapporto adeguatezza italia Adeguatezza Italia 2019_8d71cb7ff32ad37.pdf. Available at: https://download.terna.it/terna/Rapporto.
The New York Times. (2020). A Whiff of Naples Arrives in Hamburg (2008). Available at https://www.nytimes.com/2008/06/09/world/europe/09trash.html.
TNO. (2020). Phyllis2 Download data. Available at https://phyllis.nl/.
W2G Project (2020). W2G Projectat. Available at https://www.waste2gridsproject.net/publications/.
Wang, L., Zhang, Y., Li, C., Pérez-Fortes, M., Lin, T. E., Maréchal, F., et al. (2020). Triple-mode grid-balancing plants via biomass gasification and reversible solid-oxide cell stack: concept and thermodynamic performance. Appl. Energy 280, 115987. doi:10.1016/j.apenergy.2020.115987
ISPRA Waste database. (2020). Available at https://www.isprambiente.gov.it/en/databases/data-base-collection/waste.
Keywords: solid oxide fuel cell, solid oxide electrolysis cell, biomethane production, waste valorization, grid adequacy, hydrogen, renewable energy recources
Citation: Carbone C, Gracceva F, Pierro N, Motola V, Zong Y, You S, Pérez-Fortes M, Wang L and Agostini A (2021) Potential Deployment of Reversible Solid-Oxide Cell Systems to Valorise Organic Waste, Balance the Power Grid and Produce Renewable Methane: A Case Study in the Southern Italian Peninsula. Front. Energy Res. 9:618229. doi: 10.3389/fenrg.2021.618229
Received: 16 October 2020; Accepted: 12 January 2021;
Published: 17 February 2021.
Edited by:
Valerie Eveloy, Khalifa University, United Arab EmiratesReviewed by:
Yusuf Bicer, Hamad Bin Khalifa University, QatarAniruddha Pramod Kulkarni, Commonwealth Scientific and Industrial Research Organisation (CSIRO), Australia
Copyright © 2021 Carbone, Gracceva, Pierro, Motola, Zong, You, Pérez-Fortes, Wang and Agostini. This is an open-access article distributed under the terms of the Creative Commons Attribution License (CC BY). The use, distribution or reproduction in other forums is permitted, provided the original author(s) and the copyright owner(s) are credited and that the original publication in this journal is cited, in accordance with accepted academic practice. No use, distribution or reproduction is permitted which does not comply with these terms.
*Correspondence: Claudio Carbone, Y2xhdWRpby5jYXJib25lQGVuZWEuaXQ=