 Kai Hou1,2
 Puting Tang
 Zeyu Liu
- 1Key Laboratory of Smart Grid of Ministry of Education, Tianjin University, Tianjin, China
- 2Key Laboratory of Smart Energy and Information Technology of Tianjin Municipality, Tianjin University, Tianjin, China
- 3Tianjin Key Laboratory for Control Theory and Applications in Complicated Industry Systems, Maritime College, Tianjin University of Technology, Tianjin, China
With the ever-increasing penetration of renewable resources, more complexities and uncertainties are introduced in power system reliability assessment. This entails an enormous number of contingency states to represent the characteristics of renewable energy. As a result, the unbearable computation burden is the main challenge toward the efficiency of the state enumeration (SE) method. To address that, this paper proposes an improved reliability evaluation approach that can not only increase the accuracy but also accelerate the analysis. In detail, the impact increment method is first employed to decrease the proportion of higher-order contingency states, leading to accuracy improvement. Then, the shadow price is used to solve the optimal power flow (OPF) problem in a faster manner. This shadow price (SP) method allows us to obtain the optimal load curtailment directly from linear functions rather than the time-consuming OPF algorithms. In addition, one hundred percent criterion is used to match shadow-price-based linear functions with system states. Case studies are performed on the RTS-79 system and IEEE 118-bus system, in which test scenarios include loads, photovoltaics (PV), and wind turbines (WT). Results indicate that the proposed method can significantly ease the computation burden and outperform traditional reliability assessment methods in terms of both computing time and accuracy.
Introduction
With the increasingly great attention to the low-carbon emission and sustainability, the conventional generations using fossil fuels are withdrawing and renewable resources are rapidly developing. Whereas, the expanding share of renewable energy brings more uncertainties in reliability assessment. Unlike conventional energy, the outputs of PV and WT are determined by solar radiation, wind velocity, etc. The fluctuation and unpredictable characteristics of these nature factors make the outputs of renewable generation stochastic and intermittent. Therefore, this raises the concern of generation adequacy in the power system with high renewable energy penetration.
Indeed, there is a growing interest in evaluating the impact of high penetration of wind power and photovoltaics on power system reliability (Alotaibi and Salama, 2016). The authors in (Ding et al., 2011) develops the output models of wind turbines in a wind farm considering wind speed correlation. A new wind power probabilistic interval prediction model is proposed to describe the uncertain scenario of wind power (Yang et al., 2020). Moreover, an efficient framework that enables a fast cascading path searching under high penetration of wind power (Liu et al., 2020a) is proposed. The universal generating functions are used to evaluate the time-varying reliabilities of power systems with high wind power penetration (Ding et al., 2014). The Copula theory can capture the correlation between wind turbines in different locations (Tomasson and Soder, 2018). It inevitably entails a large number of scenarios and variables to represent the fluctuating outputs of renewable resources. Moreover, the detailed hourly load models and massive contingency states also need to be considered in the reliability assessment. Thus, with the expansion of power systems and the increasing penetration of renewable energy, the number of system states exponentially grows, which results in an unacceptable computation burden.
In general, two major methods, Monte Carlo simulation (MCS) method and analytical method, are utilized to assess the reliability of power systems (Billinton and Li, 1994). Both have their applications and limitations. The MCS method randomly samples the system states to be analyzed, and variance reduction technique (Sankarakrishnan and Billinton, 1995), state-space pruning approach (Singh and Mitra, 1997), cross-entropy method (Gonzalez-Fernandez and da Silva, 2011), etc., have been successfully employed to promote its efficiency. However, the MCS usually requires a longer sampling time to encounter a failure state with a low probability of occurrence, when applied to evaluate highly reliable power systems (Li, 2014). On the other hand, the analytical method is very useful and more efficient for power system planning (Ding et al., 2011). The State Enumeration technique, a typical analytical method, enumerates system states until the stopping criteria are met. However, exponentially growing system states would result in such a heavy computation burden that the SE method cannot bear.
Various methods are proposed to ease the computation burden of the SE method for power system reliability evaluation considering PV and WT. Combining high-dimensional Copula theory with the discrete convolution method, an efficient approach (Wang et al., 2018) is proposed to handle high-dimensional dependencies. Generally, most literatures are investigated to reduce the number of system states. The maximum order of contingency states is commonly used as the stopping criterion to neglect the high-order states. Since the probability of a high-order contingency may be larger than that of a low-order contingency, this criterion may make the reliability results lower than the actual value. To deal with that, techniques such as fast sorting (Liu et al., 2008) are used to arrange contingencies based on the probability of occurrence. However, a low probability state may have larger impact on system reliability indices than a high probability state due to different outage capacities. To address this issue, an impact-increment-based state enumeration (IISE) approach (Hou et al., 2016; Hou et al., 2018) is used to transfer partial impacts of higher-order states to the corresponding lower-order ones. In this way, the proportion of high-order contingencies is decreased implicitly, and the neglecting of higher-order states will no longer bring unacceptable errors, albeit using the maximum order criterion. As a result, we can achieve a remarkable accuracy improvement for the SE method. Furthermore, an incremental reliability assessment approach (IRAA) (Lei et al., 2018) is proposed to apply IISE to transmission expansion planning. In this way, more reliable references could be provided for system planners to select the best optimal planning scheme.
Compared with the number of system states, studies of the state analysis acceleration are relatively rare. The state analysis requires repeated computations for OPF problems corresponding to numerous system states, therefore the state analysis is the most time-consuming process for the reliability assessment. An improved stochastic fractal search algorithm (ISFSA) (Nguyen et al., 2020) is proposed to improve the OPF solving process, in terms of optimal solution quality, execution speed as well as success rate. Time in an OPF optimization can be saved, and the enhancement is considerable in the whole process. Followed by that, Direct Current (DC) OPF (Geng et al., 2018), parallel computation (Gubbala and Singh, 1995), post optimal analysis (Safdarian et al., 2013), etc., are utilized to speed up the state analysis, but they cannot decrease the number of OPF optimizations. The multi-parametric linear programming approach (Yong et al., 2019) is used to decrease the OPF calculations for the MCS method. The Lagrange multiplier based state enumeration (LMSE) approach (Liu et al., 2020b) is proposed to accelerate the analysis without loss of accuracy. A shadow-price-based linear function is present in this paper to solve the OPF problem by matrix multiplications. In this manner, the optimal load curtailment can be obtained directly, rather than the time-consuming OPF computations. Therefore, we can significantly accelerate the evaluations of most system states to ease the computation burden for the SE method.
In this paper, we propose an improved state enumeration method based on the shadow price and impact-increment (SPIISE) method. The accuracy and speed of reliability assessment can be enhanced by the IISE method and shadow price (SP) method, respectively. Furthermore, by integrating the SP into the IISE, we can evaluate the reliability of power systems with high renewable energy penetration more efficiently. In summary, the main contributions are as follows:
1 Shadow-price-based linear functions are constructed to establish the relationship between the system state and optimal load curtailment. By avoiding a myriad of OPF optimizations, we can achieve significantly reduce the computing time of reliability assessment.
2 One hundred percent criterion is proposed to match the states with the shadow price, which can ensure the accuracy of the shadow-price-based linear functions.
3 An impact-increment-based state enumeration method is used to evaluate the impact of renewable energy on reliability. This allows us to ease the heavy computation burden and improve the accuracy of the traditional SE method.
The remainder of this paper is organized as follows. Section The Methodology of Reliability Assessment introduced the framework of the proposed reliability assessment methodology. In Section Reliability Assessment Method Based on Shadow Price and Impact Increment Methods, the IISE method and the shadow price method are illustrated in detail. Case studies are performed in Section Case Studies and conclusions are drawn in Section Conclusion.
The Methodology of Reliability Assessment
The framework of reliability evaluation of power systems with high renewable energy penetration is shown in Figure 1, which consists of three main processes: 1) system state selection 2) system state analysis 3) reliability indices computation.
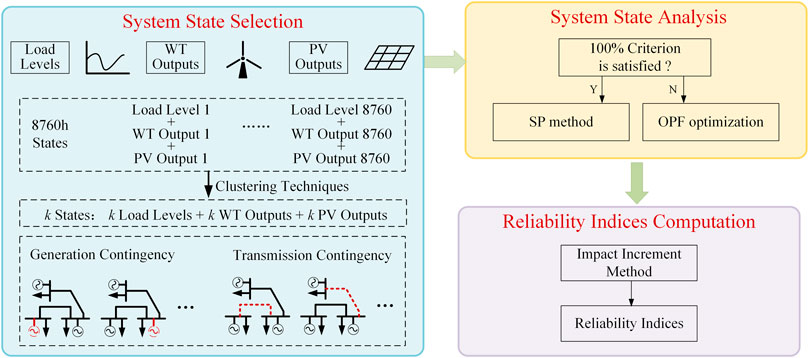
FIGURE 1. The framework of the proposed method.
System state selection is used to enumerate all possible contingencies by the SE method. The contingencies include generation and transmission. In the SE method, the reliability assessment indices can be obtained by calculating the possibility and impact of each system state. The mathematical expression is as follows:
where I(s) is the impact of the system state s, which can be calculated by system state analysis.
System state analysis uses the OPF model to calculate the influence of state contingency states. When some contingencies occur in power systems, resulting in line overload or system disconnection, the generator output must be readjusted, and if necessary, load shedding should be carried out to ensure the normal operation of the system. The optimal load curtailment is determined by the DC-OPF model, which is composed of three aspects: decision variables, objective function, and constraints.
The decision variable x = [θ, PC, PG]T includes the generation output PG = [PG,1, PG,2,…, PG,g]T, the voltage phase θ = [θ1, θ2,…,θn]T, and the load curtailment PC = [PC,1, PC,2,…, PC,n]T. The objective function is the minimum total load curtailment PLC. The constraints include the power flow limits, the upper and lower limits of generation output, the branch flow limits, and the upper and lower limits of load curtailment. Then, the optimal load curtailment (OLC) model is
Reliability indices computation is to calculate the reliability assessment indices. After calculating all the enumerated contingencies states based on the optimal power flow model, the reliability assessment indices can be obtained. The common reliability indices include expected energy not supplied (EENS), probability of load curtailments (PLC), average energy not supplied (AENS), and expected demand not supplied (EDNS). This paper uses EENS as the reliability assessment index. According to (Eq. 1), it can be calculated by:
where T is the time period of reliability assessment. I(s) is the load curtailment of state s.
Reliability Assessment Method Based on Shadow Price and Impact Increment Methods
In this paper, the impact increment method and shadow price method are used to improve the system state selection and system state analysis, respectively. The impact increment method can transfer partial impacts of higher-order states to the corresponding lower-order ones, which can reduce the number of system states implicitly. SP method can establish the linear function between the system state and optimal load curtailment, which can avoid a myriad of OPF optimizations.
The Impact-Increment-Based State Enumeration Method
The traditional SE method needs to enumerate a large number of contingency states. In this way, some high-order states are ignored to improve the calculation speed at the cost of accuracy. In order to solve this problem, the IISE reliability assessment approach is used in this paper.
According to the reliability indices calculation Eq. 1, the reliability indices calculation equation based on impact increment can be deduced. Taking a three-components system as an example, we have,
Equation 5 is a polynomial with eight terms, including one normal state and seven contingency states. Then, this equation can be simplified by replacing the availability with unavailability,
It can be seen from the above equation that the impact has been changed into the form of impact increment. Thus, the impact increment of system state s is defined as follows,
where Card(u) is the order of contingency states u. Therefore, Eq. 6 can be simplified to,
Compared with Eqs 5, 9, it can be seen that the number of terms to be calculated is the same in the two equations, but the content of each term is different. The system state probability of the first equation is replaced by the impact-increment probability, which is eliminating the availability of available components. Also, the system state impact in Eq. 5 is replaced by the impact-increment. In this way, the proportion of the impact of low-order contingencies in the total impact is increased. As a result, the calculation efficiency can be improved when the high-order contingencies are ignored in some scenarios. Furthermore, Eq. 9 of the three-component system can be extended to the N-component system,
A Shadow-Price-Based Optimal Load Curtailment Calculation Method
The OLC model solving process is the most time-consuming in the reliability assessment. In this paper, the OLC model Eq. 3 is a linear programming problem, which can be expressed as follows:
where
The simplex method is generally used to solve linear programming problems (Vanderbei, 1998). Then we get,
where B is the optimal basis. xB and cB are the solution and cost coefficient vector corresponding to B, respectively. As long as the criterion xB ≥ 0 and σ ≥ 0 are satisfied, x is the optimal solution and z is the optimal objective function.
This paper considers various load levels and renewable generation outputs. The load level PL,i changes with time and there are 8,760 load levels in a year. All generator buses are divided into three categories: conventional generators, PVs, and WTs. The maximum power output PGmax of conventional generators is constant, while that of renewable generations changes with time. When dealing with a specific contingency, each load level and generator output should be calculated by the optimal load curtailment model to obtain reliability indices. However, the OPF calculation requires too much time because the number of contingency states is very large.
To address that, a shadow-price-based optimal load curtailment calculation method (SP) is proposed to accelerate the solving process of the optimal load curtailment model. It can be observed that the only different part of the OPF model is matrix b between different load levels and generator outputs. And the shadow price can be used to represent the influence of these changes on the optimal load curtailment. Based on Eq. 12, the reduced cost σ is always positive when matrix b changes. Therefore, once xB ≥ 0 is satisfied, the change of optimal load curtailment can be calculated by the shadow price, as shown in Eq. 12.
Furthermore, through the criterion xB ≥ 0, the variation range of b can be obtained, which can be expressed as [β1, β2]. Therefore, the new linear programming problem can be directly solved by using the last calculation result if the changed b’ is still in this range. In this case, the optimal base matrix B is unchanged, and the optimal load curtailment of the new state can be obtained by Eq. 12. Hence, fbi (β) is the optimal objective value as a function of varying bi with the other bounds fixed. It should be noted that fbi (β) is a piecewise linear and convex function, as shown in Figures 2, 3.
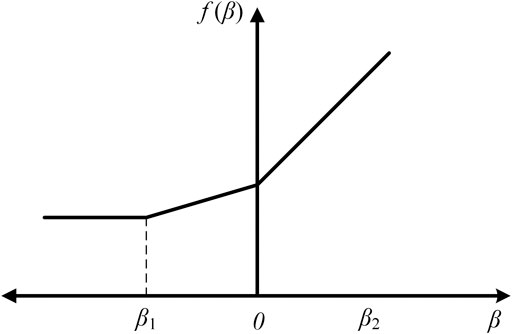
FIGURE 2. β = 0 is a breakpoint.
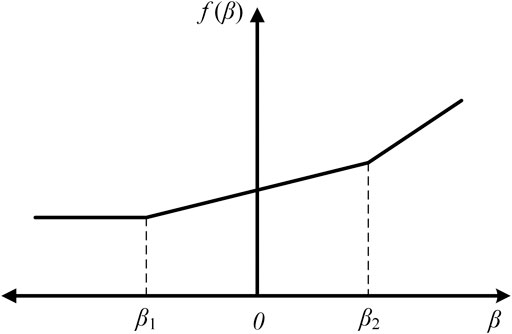
FIGURE 3. β = 0 is in the interior of the linearity interval.
Obviously, if fbi (β) does not change, then we can easily obtain the optimal objective function of different bi. The gradient
However, the change in b is usually composed of multiple components. Therefore, one hundred percentage criterion is considered: for all the constant data in the changing constraint conditions, when the sum of all allowable increase percentages and allowable decrease percentages does not exceed one hundred percent, the shadow price of this problem is unchanged, as follows:
Consequently, for the linear programming problem with changes in b, when one hundred percentage criterion is satisfied, the optimal load curtailment can be obtained directly by z = cBB−1b = wb, in which w is the shadow price. This simple calculation can eliminate the cumbersome iterative OPF optimizations because the new solution can be calculated by the previous solutions.
Process of the Proposed Approach
The overall process of the proposed SPIISE method is shown in Figure 4 and elaborated as follows:
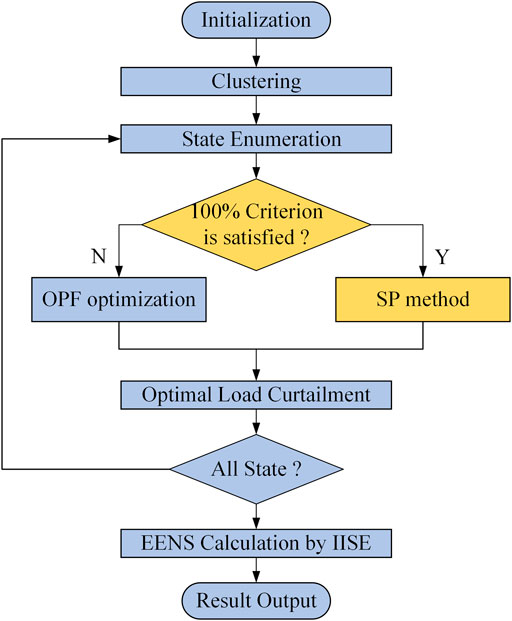
FIGURE 4. Flowchart of the proposed method.
Step 1: Initialization. Input power system data, load level data, PV and WT output data. Set the maximum contingency order.
Step 2: Clustering. Reduce the load levels and renewable generation outputs by the k-means clustering technique.
Step 3: System state enumeration. Enumerate all contingency states, and select a system state to analyze.
Step 4: The judgment of one hundred percentage criterion. Determine whether Eq. 13 is satisfied, then use the SP method or OPF optimization algorithm to solve the optimal load curtailment model, and obtain the optimal load curtailment of the system state.
Step 5: EENS computation. Calculate the reliability assessment index (EENS) by the impact-increment-based state enumeration approach, as shown in Eqs 4, 10.
Step 6: Output Results.
Case Studies
The RTS-79 system (Subcommittee, 1979) and IEEE 118-bus system (IEEE 118-Bus System, 1962) are used to demonstrate the effectiveness of the proposed SPIISE method. The performance of IISE and SP methods are verified. Finally, the impacts of renewable energy penetration on the power system reliability are analyzed in detail. The performance of studies is parallel tested on a PC equipped with dual Intel Xeon Platinum 8180 CPU (ES) 28 × 1.8 GHz and 128 GB RAM.
Annual load curves (Figure 5) is the actual annual load data in Alberta (Alberta Electric System Operator, 2017). Annual output curves of PV and WT (Figures 6, 7) are from NREL National Wind Technology Center (Renewable Resource Data Sets, 2019). The fault component, analyzed in this paper, includes branches and generations. The unavailability of components in the RTS‐79 system and branches in the IEEE‐118 bus system are calculated by (Subcommittee, 1979). The unavailability of generations in the IEEE‐118 bus system is 1.5%. The MCS result with 1 × 10⁸ samples is regarded as the actual result of reliability assessment, which can be used as a benchmark to evaluate the accuracy of other methods.
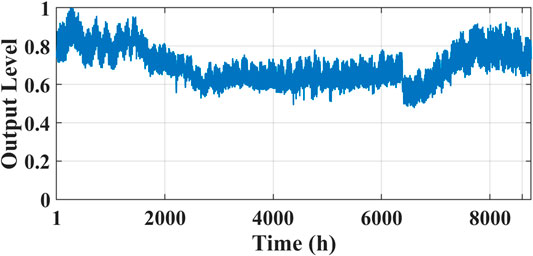
FIGURE 5. Annual load curve.
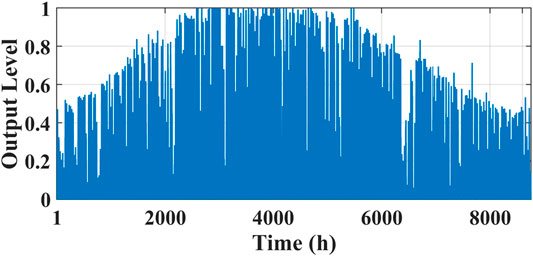
FIGURE 6. PV annual curve.
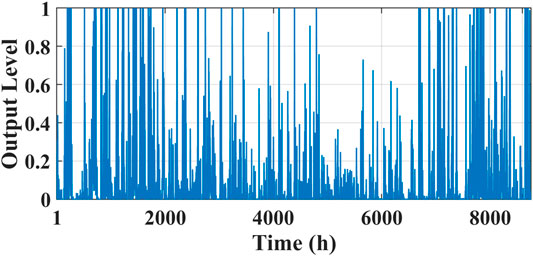
FIGURE 7. WT annual curve.
RTS-79 System
RTS‐79 system is a composite power system with 24 buses, 33 generator units, and 38 branches. The total generation capacity is 34.05 MW and the peak load is 28.5 MW. In this case, 5% capacity of conventional generation is replaced by PV and WT. The ratio of PV to WT is 1:1. The cluster number is 100. The maximum contingency order is 5 and transmission contingencies above third-order are ignored. The SPLMSE is applied in the RTS‐79 system to test its performance. SPSE denotes the method that combines the SP method and SE method. IISE, SPSE, SE, and MCS approaches are also utilized as comparisons.
Accuracy and Efficiency
As shown in Table 1, reliability indices EENS yielded by two approaches (SPSE and SE) are equal, however, the computation speed is increased by over 5 times. This is because the number of OPF optimizations per contingency is reduced from 100 to 14.10, so over 80% of OPF optimizations are substituted by shadow-price-based linear functions. Compared with the traditional approach (SE), the IISE method can achieve more accurate reliability results. It can be seen in Figure 8 that the position of SPIISE is located at the bottom left of all others. Thus, combined with the SP method and IISE method, SPIISE performs high efficiency in terms of both computation time and accuracy. Furthermore, efficiencies of MCS and SPIISE are approximately equal. Consequently, the superiority of the LMIISE is confirmed, and using the analytical method (SE) to evaluate power systems with 5% penetration of renewable energy becomes feasible and effective.
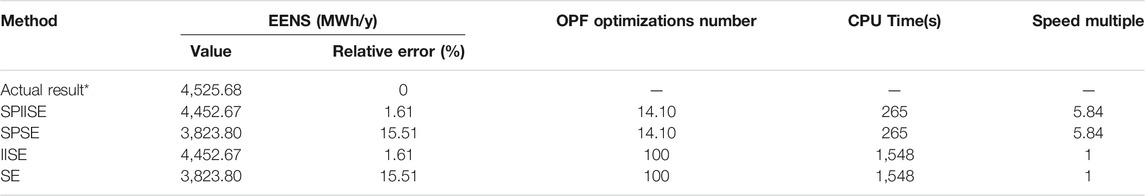
TABLE 1. Reliability assessment results of SPIISE, SPSE, IISE, SE and MCS (RTS-79).
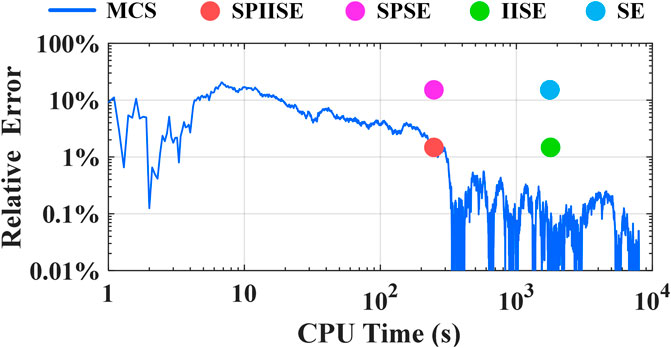
FIGURE 8. Comparisons of computation efficiencies of five methods (RTS-79).
The clustering technique is used in the proposed methodology to ease the computation burden of the SE method. As shown in Figure 2, the massive scenarios of loads, PVs, and WTs are reduced to representative system states. As shown in Table 2, the relative errors can reach 2% when the cluster number is over 100. Therefore, the clustering technique could achieve a good trade-off between speed and accuracy, so 100 is used as the cluster number in this paper. Also, the acceleration performance of the proposed SPIISE method is getting better for the larger cluster number.
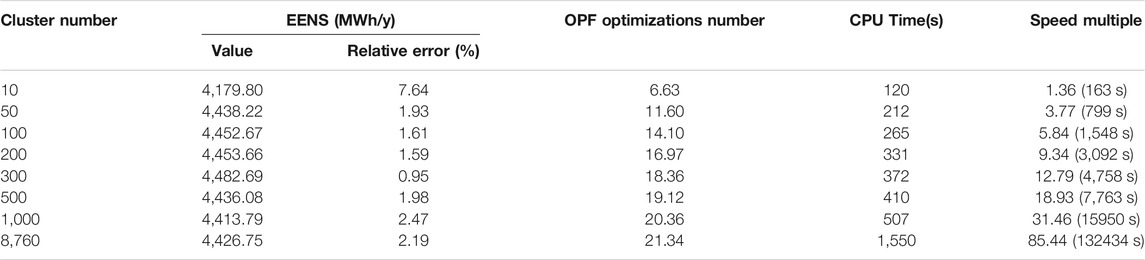
TABLE 2. The Impact of Cluster Number on Reliability assessment results (RTS-79).
Impact of Renewable Energy Penetration
In this paper, renewable generation penetration ζ is defined as follow:
where Pg represents the total capacity of convention generators; Pre represents the capacity of renewable generators. In this subsection, we compare the following three cases with growing renewable energy penetration to illustrate the impact of renewable energy penetration.
Case 1: The convention generation is being replaced by the renewable generation with growing penetration, that is the total generation capacity Pg + Pre remains unchanged.
Case 2: The renewable generation is being newly added in power systems with growing penetration, that is the convention generation capacity Pg remains unchanged.
Case 3: the load increased by 10%, and total generation capacity Pg + Pre is increasing at different renewable energy penetrations.
Table 3 presents the reliability assessment results of the RTS-79 system at different renewable energy penetrations in Cases I and II. It can be found that the higher penetration of renewable energy can improve the reliability in Case I while deteriorate the reliability in Case II. This is because that intermittent renewable energy cannot satisfy the generation adequacy at all the time, unlike the convention generators. Moreover, the reliability results of Case 3 are shown in Figure 9. Load growth decreases the reliability of power systems. The initial reliability level is 2085 MWh/y, which is the EENS of the RTS-79 system without renewable energy and increased load. To reach the initial reliability level, both convention generation and renewable generation are needed to be expanded, as shown in Figure 10. Thus, in this case, the convention generation is a necessary support for the reliability of power systems with high renewable energy penetration.
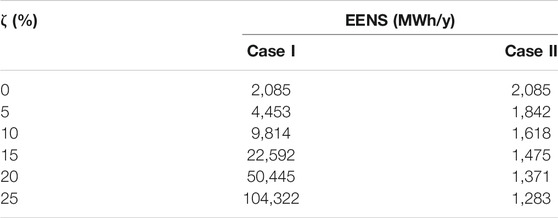
TABLE 3. The impact of renewable energy penetration on EENS in cases 1 and 2 (RTS-79).
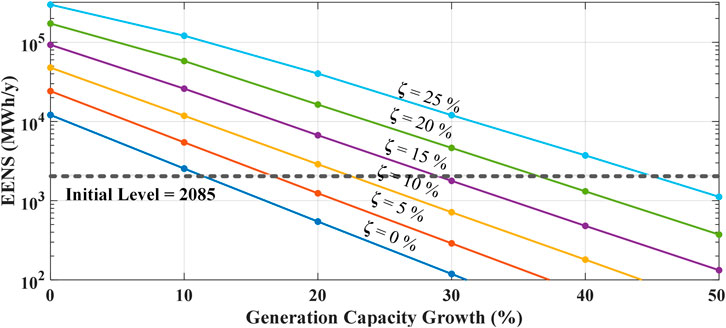
FIGURE 9. Reliability results of generation capacity growth at different renewable energy penetrations in Case 3.
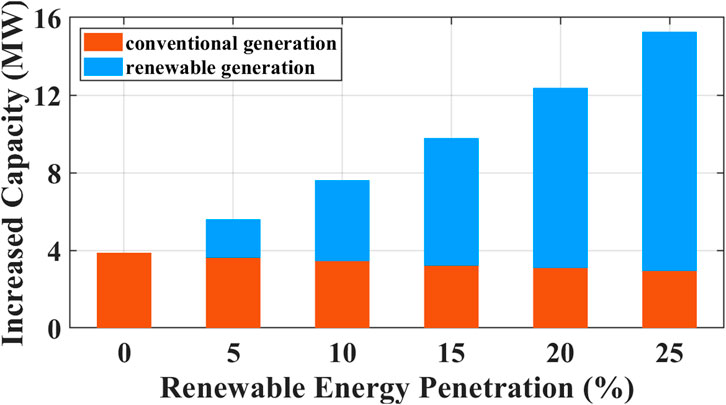
FIGURE 10. Increased generation capacity at different renewable energy penetrations in Case 3.
IEEE 118-Bus System
IEEE 118-bus system consists of 118 buses, 54 generation units, and 186 branches. The total generation capacity is 99,662 MW and the peak load is 42,420 MW. Similar to the RTS-79 system, renewable generation penetration ζ = 5%, the cluster number is 100, and the maximum contingency order is 2. SPIISE, SPSE, IISE, SE, MCS are applied in the IEEE 118-bus system.
As shown in Table 4, SPIISE still outperforms the other methods in the IEEE 118-bus system. Based on the IISE method, the relative errors are reduced to 2.01% from 30.29%. About 80% of system states are calculated by the SP method, rather than the time-consuming OPF optimizations. Therefore, the position of LMIISE is located at the bottom left of others, as shown in Figure 11. Also, the efficiency of the proposed approach can reach or even exceed that of the MCS. In addition, since the IEEE-118 bus system is more complicated than the RTS-79 system, more OPF optimizations are needed in this case.
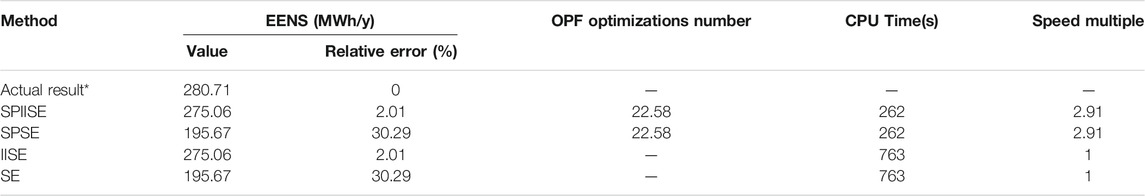
TABLE 4. Reliability assessment results of SPIISE, SPSE, IISE, SE and MCS (IEEE 118-bus).
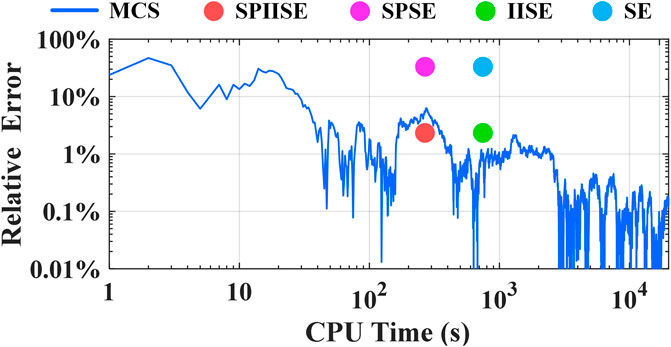
FIGURE 11. Comparisons of computation efficiencies of five methods (IEEE 118-bus).
Conclusion
This paper proposes a shadow-price-and-impact-increment-based reliability evaluation approach to improve the efficiency of reliability assessment for power systems with high renewable energy penetration. Based on the impact increment method, more precise indices could be obtained with only low-order contingency. On the other hand, the shadow-price-based linear functions are constructed to calculate the optimal load curtailment in a faster manner. Moreover, one hundred percent criterion is applied to determine the shadow price of states. The results indicate that about over 80% OPF optimizations can be obtained directly by matrix multiplications, rather than the time-consuming optimization algorithms. Consequently, the proposed methodology can significantly improve computational efficiency. Moreover, a detailed analysis shows that convention generation may be an effective and necessary way to ensure the reliability of power systems with high renewable energy penetration. In addition, the one hundred percent criterion may be conservative for state matching, therefore, future research will focus on further decreasing the number of OPF calculations.
Data Availability Statement
The original contributions presented in the study are included in the article/Supplementary Material, further inquiries can be directed to the corresponding author.
Author Contributions
KH: supervision, literature review, and writing-reviewing. PT: mathematical analysis, writing, and software. ZL: simulation, framework formation, and writing. HJ: supervision and project administration. LZ: methodology, writing-reviewing and editing.
Funding
This work was supported by the National Natural Science Foundation of China (52061635103, 51707129).
Conflict of Interest
The authors declare that the research was conducted in the absence of any commercial or financial relationships that could be construed as a potential conflict of interest.
Nomenclature
Abbreviations
EENS Expected energy not supplied
IISE Impact-increment-based SE method
MCS Monte Carlo simulation method
OLC Optimal load curtailment
OPF Optimal power flow
SE State Enumeration method
SPIISE shadow‐price‐based IISE method
SPSE shadow‐price‐based SE method
Variables
aj the availability rate of component j
g the numbers of generators
I(s) the impact of the system state s
n the numbers of buses
ns the number of contingency components of the system state s
P(s) the probability of occurrence of system state s
PBmax,ij the maximum power flow of branch ij
PC,i the load curtailment of node i
PG,i the generation output of generator i
PGmax,i the maximum output of the generator i
PL,i the load of node i
PLC the total system load curtailment
R the reliability assessment index
s the system state
ui the unavailability rate of component i
xij the reactance of branch ij
θi the voltage phase of node i
Sets
Ω the set of enumerated system states
References
Alberta Electric System Operator (2017). Hourly load by area and region 2011 to 2017. Available at: https://www.aeso.ca/
Alotaibi, M. A., and Salama, M. M. A. (2016). An efficient probabilistic-chronological matching modeling for DG planning and reliability assessment in power distribution systems. Renew. Energ. 99, 158–169. doi:10.1016/j.renene.2016.06.058
Billinton, R., and Li, W. (1994). Reliability assessment of electrical power systems using Monte Carlo methods. New York: Springer
Ding, Y., Singh, C., Geol, L., Ostergaard, J., and Wang, P. (2014). Short-term and medium-term reliability evaluation for power systems with high penetration of wind power. IEEE Trans. Sustain. Energ. 5 (3), 896–906. doi:10.1109/TSTE.2014.2313017
Ding, Y., Wang, P., Goel, L., Loh, P., and Wu, Q. (2011). Long-term reserve expansion of power systems with high wind power penetration using universal generating function methods. IEEE Trans. Power Syst. 26 (2), 766–774. doi:10.1109/TPWRS.2010.2054841
Geng, L., Zhao, Y., and Chen, G. (2018). Simplified sequential simulation of bulk power system reliability via chronological probability model of load supplying capability. IEEE Trans. Power Syst. 33 (3), 2349–2358. doi:10.1109/TPWRS.2017.2757033
Gonzalez-Fernandez, R. A., and da Silva, A. M. L. (2011). Reliability assessment of time-dependent systems via sequential cross-entropy monte carlo simulation. IEEE Trans. Power Syst. 26 (4), 2381–2389. doi:10.1109/TPWRS.2011.2112785
Gubbala, N. V., and Singh, C. (1995). Models and considerations for parallel implementation of monte carlo simulation methods for power system reliability evaluation. IEEE Trans. Power Syst. 10 (2), 779–787. doi:10.1109/59.387917
Hou, K., Jia, H., Li, X., Xu, X., Mu, Y., Jiang, T., et al. (2018). Impact-increment based decoupled reliability assessment approach for composite generation and transmission systems. IET Gener. Transmiss. Distrib. 12 (3), 586–595. doi:10.1049/iet-gtd.2017.0745
Hou, K., Jia, H., and Xu, X. (2016). An impact increment-based state enumeration reliability assessment approach and its application in transmission systems. IEEE Trans. Power App. Syst. Pas 98 (6), 2047–2054. doi:10.1109/TPAS.1979.319398K
IEEE 118-Bus System, Illinois center for a smarter electric grid (1962). Available at: http://publish.illinois.edu/smartergrid/ieee-118-bus-system/
Lei, Y., Zhang, P., Hou, K., Jia, H., Mu, Y., and Sun, B. (2018). An incremental reliability assessment approach for transmission expansion planning. IEEE Trans. Power Syst. 33 (3), 2597–2609. doi:10.1109/TPWRS.2017.2756261
Liu, H., Sun, Y., Wang, P., Cheng, L., and Goel, L. (2008). A novel state selection technique for power system reliability evaluation. Electr. Power Syst. Res. 78 (6), 1019–1027. doi:10.1016/j.epsr.2007.08.002
Liu, Y., Wang, Y., Yong, P., Zhang, N., Kang, C., and Lu, D. (2020a). Fast power system cascading failure path searching with high wind power penetration. IEEE Trans. Sustain. Energ. 11 (4), 2274–2283. doi:10.1109/TSTE.2019.2953867
Liu, Z., Hou, K., Jia, H., Zhao, J., Wang, D., Mu, Y., et al. (2020b). A Lagrange multiplier based state enumeration reliability assessment for power systems with multiple types of loads and renewable generations. IEEE Trans. Power Syst. doi:10.1109/TPWRS.2020.3045021
Nguyen, T. T., Nguyen, T. T., Duong, M. Q., and Doan, A. T. (2020). Optimal operation of transmission power networks by using improved stochastic fractal search algorithm. Neural Comput. Appl. 32 (13), 9129–9164. doi:10.1007/s00521-019-04425-0
Renewable Resource Data Sets, National renewable energy laboratory (2019). Available at: https://www.nrel.gov/grid/data-tools.html
Safdarian, A., Firuzabad, M. F., and Aminifar, F. (2013). Composite power system adequacy assessment based on postoptimal analysis. Turk. J. Elec. Eng. Comput. Sci. 21 (1), 90–106. doi:10.3906/elk-1104-36
Sankarakrishnan, A., and Billinton, R. (1995). Sequential Monte Carlo simulation for composite power system reliability analysis with time varying loads. IEEE Trans. Power Syst. 10 (3), 1540–1545. doi:10.1109/59.466491
Singh, C., and Mitra, J. (1997). Composite system reliability evaluation using state space pruning. IEEE Trans. Power Syst. 12 (1), 471–479. doi:10.1109/59.575787
Subcommittee, P. M. (1979). IEEE reliability test system. IEEE Trans. Power App. Syst. Pas 98 (6), 2047–2054. doi:10.1109/TPAS.1979.319398K
Tomasson, E., and Soder, L. (2018). Generation adequacy analysis of multi-area power systems with a high share of wind power. IEEE Trans. Power Syst. 33 (4), 3854–3862. doi:10.1109/TPWRS.2017.2769840
Wang, Y., Zhang, N., Kang, C., Miao, M., Shi, R., and Xia, Q. (2018). An efficient approach to power system uncertainty analysis with high-dimensional dependencies. IEEE Trans. Power Syst. 33 (3), 2984–2994. doi:10.1109/TPWRS.2017.2755698
Yang, X., Yang, Y., Liu, Y., and Deng, Z. (2020). A reliability assessment approach for electric power systems considering wind power uncertainty. IEEE Access 8, 12467–12478. doi:10.1109/ACCESS.2020.2966275
Keywords: shadow price, impact increment, reliability assessment, optimal load curtailment, renewable energy, optimal power flow
Citation: Hou K, Tang P, Liu Z, Jia H and Zhu L (2021) Reliability Assessment of Power Systems with High Renewable Energy Penetration Using Shadow Price and Impact Increment Methods. Front. Energy Res. 9:635071. doi: 10.3389/fenrg.2021.635071
Received: 29 November 2020; Accepted: 15 January 2021;
Published: 03 March 2021.
Edited by:
Nian Liu, North China Electric Power University, ChinaReviewed by:
Kenneth Okedu, Caledonian College of Engineering, OmanMinh Quan Duong, The University of Danang, Vietnam
Copyright © 2021 Hou, Tang, Liu, Jia and Zhu. This is an open-access article distributed under the terms of the Creative Commons Attribution License (CC BY). The use, distribution or reproduction in other forums is permitted, provided the original author(s) and the copyright owner(s) are credited and that the original publication in this journal is cited, in accordance with accepted academic practice. No use, distribution or reproduction is permitted which does not comply with these terms.
*Correspondence: Zeyu Liu, dGp1bHp5QHRqdS5lZHUuY24=