 Rui Chen1
 Haochun Lu2,3,4,5*
- 1Business School, Teesside University, Middlesbrough, United Kingdom
- 2Graduate Institute of Business and Management, Chang Gung University, Taoyuan, Taiwan
- 3Department of Cardiology, Chang Gung Memorial Hospital, Taoyuan, Taiwan
- 4Department of Information Management, Chang Gung University, Taoyuan, Taiwan
- 5Department of Industrial and Business Management, Chang Gung University, Taoyuan, Taiwan
China’s urbanization over the past thirty years has been the fastest in history and has led to significant challenges in balancing urbanization and energy use. As a result, this study proposed a comprehensive green urbanization assessment index system considering energy use and environment protection together. To be specific, principal component analysis was applied to eliminate redundant information, and a slacks-based measure model was used to evaluate urbanization efficiencies. Meanwhile, with super efficiency incorporated, the proposed model enabled to distinguish the DMU from DMUs with same efficiency value, further, a projection analysis was conducted to direct the improvement of the identified inefficient decision-making units (DMUs). Finally, the comprehensive green urbanization index system was applied to a western Chinese province (Sichuan Province) to demonstrate the effectiveness of the proposed models, from which it was found that the overall green urbanization efficiency in Sichuan province was 81.54%, due to an input distribution imbalance and low technical efficiency.
Introduction
In today’s more global and more urban world in which population, production and wealth are increasingly concentrated in cities, urbanization has been playing a vital role in economic and social development (Zhang et al., 2014). Most Chinese cities today offer a higher standard of living than ever before in the country’s long history (Storper and Scott, 2016). In recent decades, however, China’s rapid urbanization has led to widespread urban sprawl and energy and environmental issues such as insufficient resources, air pollution and green cover depletion (Imam and Banerjee, 2016; Karteris, et al., 2016). As shown in Figure 1, the correlation between energy consumption per capita and urbanization in China has grown rapidly and significantly. In response, the State Council of China promulgated the “National New Urbanization Plan (2014–2020)” (NNUP) that signified that China was in a crucial transition period from outdated to modern urbanization. Chinese Premier Li Keqiang argued that it was necessary to seriously expand the development of green, low carbon and cyclical patterns in city planning.
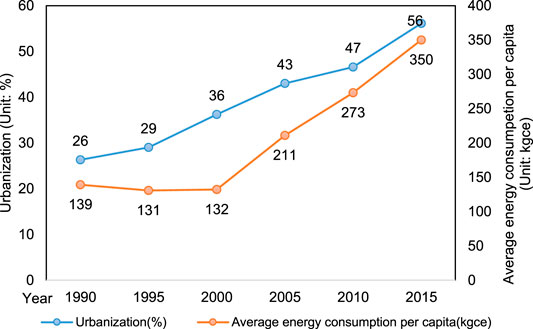
FIGURE 1. Average energy consumption and urbanization changes in China.
Therefore, in response to the government’s requirements as outlined in the 13th Five-Year Plan, this study addresses environmental protection and energy conservation to increase urban sustainability, which is called green urbanization in this paper. Green urbanization designs and green city construction have low energy consumption, low pollution, low emissions, and high energy efficiency characteristics. As 2016 was the beginning of the 13th Five-Year Plan in China, this paper sought to evaluate the regional green urbanization efficiency in China since its inception to assist in guiding future management and planning.
Several green urbanization efficiency evaluations have been previously conducted. For example, Tan et al. (2014) applied a super-efficiency DEA and Malmquist index to analyze the efficiency of China’s infrastructure, Hayek et al. (2015) demonstrated an indicator-based behavioral modeling approach to assess urban condition quality across multiple aspects and scales, Chikaraishi et al. (2015) developed a latent class STIRPAT model to capture the moderating effects of urbanization that was able to generate urbanization-dependent elasticities to incorporate the moderating effect of urbanization, Wei et al. (2016) applied mean variance analysis to determine the indicator weights and then used the analytic hierarchy process (AHP) to evaluate the urban carrying capacity efficiency, and Zhao and Chai (2016) proposed a new novel urbanization level evaluation method based on the entropy principle and proved its objectivity and flexibility in choosing an indicator network.
Unfortunately, most of the above methods have been found to have theoretical shortcomings and limitations, one of which is indicator selection. Based on findings from previous urbanization development research (Cottineau et al., 2015; Zhou et al., 2015; Huang, Yan and Wu, 2016; Wu and Lung, 2016), additional factors need to be considered when assessing green urbanization and environmental index systems, such as green urban covering, climate, emissions, and environmental investment (Radford and James, 2013; Imam and Banerjee, 2016). Many current urban efficiency indicators focus on energy consumption and use (Liddle and Lung, 2014; Ma, 2015), which discounts the importance of energy conservation, and only include population and the economy (Ancog and Ruzol, 2015; Cobbinah, Erdiaw-Kwasie and Amoateng, 2015), with other factors such as social services receiving scant attention. Therefore, the green urbanization index system developed in this study is an expansion of the urbanization and environment and energy index systems.
Another theoretical shortcoming has been the efficiency models, with the traditional evaluation models ignoring the interactions between the system indicators and neglecting to account for the input and output slacks when reporting the efficiencies, both of which can lead to inaccurate results. Therefore, to address the limitations in past research, an SBM model was employed in this study to conduct the efficiency evaluations, which included both overall efficiency and super efficiency based on a principal component analysis (PCA).
Therefore, this paper makes four main contributions.
(1) Green urbanization efficiencies are estimated by considering economic development, environment protection and energy use.
(2) A comprehensive green urbanization index system is designed to measure the efficiency.
(3) Slacks-based measurement models that consider the input and output slacks are applied to evaluate and rank the DMUs.
(4) With the incorporation of super-efficiency idea, the proposed model is able to distinguish the DMUs with the same level of efficiency values. Projection and improvement analyses are conduced to guide and advise managers in terms of energy use and environmental protection.
The remainder of the paper is organized as follows. Modelling Section presents the index system for the green urbanization evaluation and proposes several applied SBM models based on the PCA, Practical Application Section verifies the efficiencies of the proposed models in a practical application, and the final results and discussion are respectively reported in Results and Discussions and Implication Sections.
Modelling
Based on SBM and PCA, this paper introduces an integrated approach to green urbanization efficiency assessments and optimization. In this section, the methodology is described and the indicators specified and selected.
The development of the general integrated model, which is illustrated in Figure 2, is summarized in six steps:
(1) Representative SBM input and output indicators relating to urbanization, environment and energy are selected.
(2) The final index system for the efficiency evaluation based on PCA is determined.
(3) The SBM model is employed to analyze the green urbanization efficiency from general, technical and scale perspectives.
(4) A super efficiency SBM model is applied to rank and compare the efficiencies in 21 cities.
(5) Finally, quantitative suggestions and specific improvement directions are determined from the analysis.
(6) Conclusions and initial optimization suggestions for cities are then proposed for each input sector.
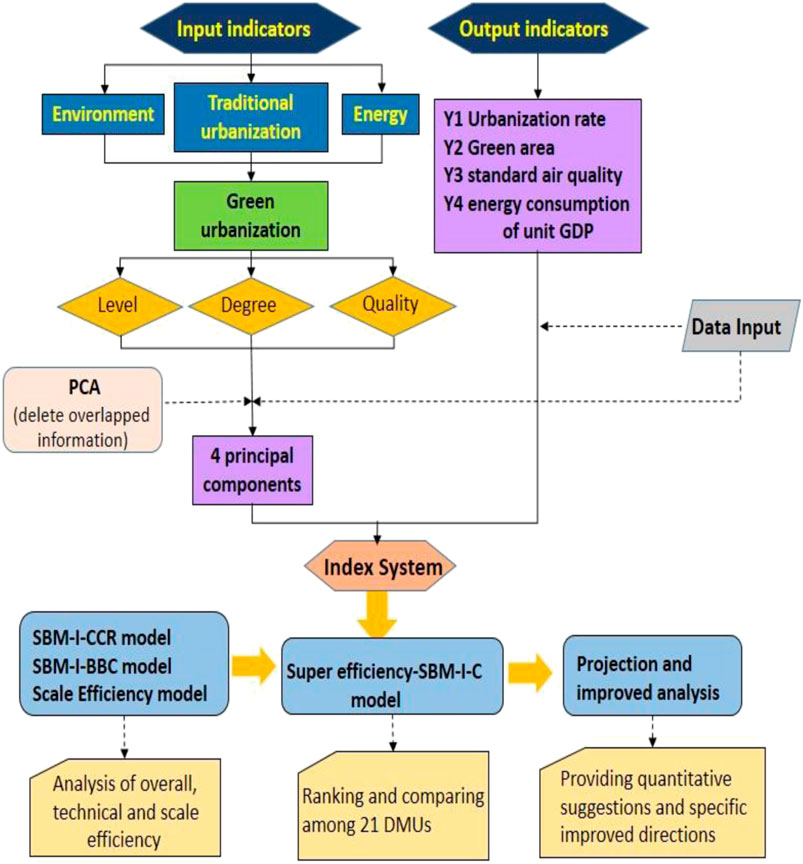
FIGURE 2. Efficiency assessment framework.
Index Selection
The initial green urbanization evaluation system for China was established based on the scientific evaluation principles of comprehensiveness, objectivity, comparability and operability (Pérez-Alonso et al., 2011; Zhou et al., 2018). Three green urbanization perspectives—level, quality and degree—were integrated in the index system to evaluate the green urbanization efficiency.
Five indices were selected to measure the urbanization level: urbanization rate; the ratio of rural employed labor; urban population density; per capita GDP; and the proportion of primary industry in GDP.
Social services, resource utilization and environmental impact indices were selected to measure the green urbanization quality. The social service index included education, science, health care, and employment, all of which promote a robust and sustainable economy. The following seven indices included four factors: living standards, education, health care and technology. Living standards were determined using Engel’s coefficient of urban residents and the funds for urban residents per capita under basic provision protection, education level was determined based on the number of high school enrollments and the education spending per capita, health care was determined by the hospital beds per thousand people and medical funds per capita, and due to limited data collection, technology spending per capita was chosen to represent the technology level.
As the main aim of green urbanization is reducing energy consumption, resource utilization was determined from the energy consumption of a unit of added value in industry and the urban daily water consumption per capita, the environmental impact was determined from the proportion of environmental investment in GDP, which directly reflected government efforts towards environmental improvements, and waste water discharge rate, which indirectly influences the environmental quality in a region.
The green urbanization degree was then employed to evaluate the impact on the environment, energy use, social stability and development in cities, with the specific environmental indices being the proportion of green areas in developed areas and the standard air quality proportion, the specific energy indices being energy consumption of unit GDP, which reflected the economic structure and resource utilization changes, and the specific social stability and development indices being the average per capita net income in rural areas.
The proposed green urbanization index system including 20 indices is shown in Table 1, therefore had a complicated structure, as 20 indices needed to be considered. After analyzing the characteristics of each index, the outputs were determined to be urbanization rate, the proportion of green area in developed areas, the standard air quality proportion, and the energy consumption per unit of GDP, which were respectively denoted y1, y2, y3,y4, with the energy consumption per unit of GDP (y4) being the undesirable output. The principle of efficiency evaluation models is to maximize outputs. Therefore, the reciprocal y4 = 1/y4 was employed in the SBM models to ensure accurate results. The remaining 16 indices were the inputs, which were denoted x1 to x16.
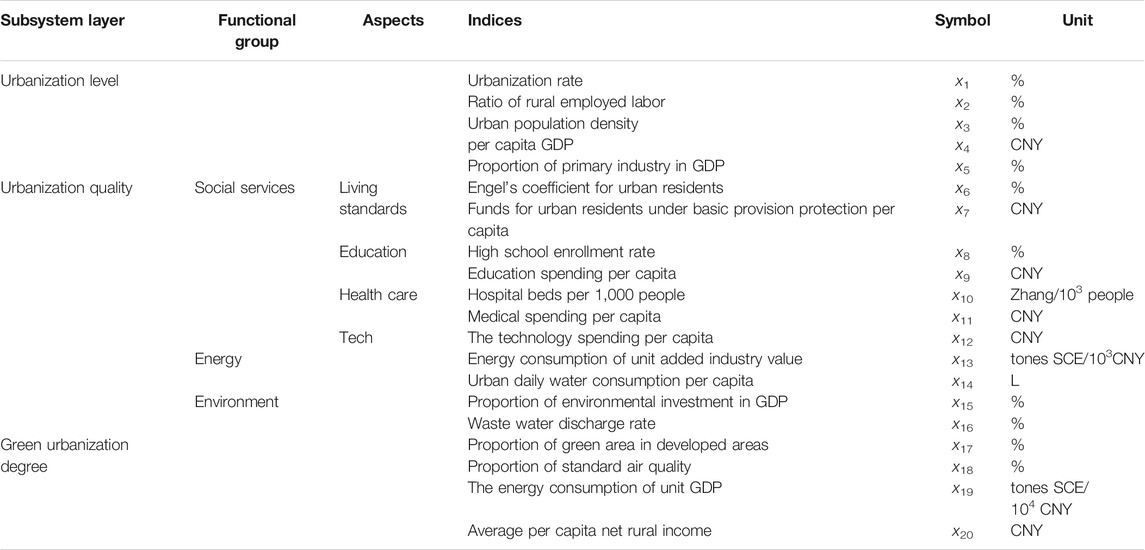
TABLE 1. Green urbanization index system.
Evaluation System
(1) Principal component analysis (PCA)
Generally, the number of DMUs should be more than twice the number of inputs and outputs. As some of the selected indices had tight positive correlations, the information overlaps needed to be eliminated to ensure an accurate efficiency evaluation. Therefore, PCA, a powerful tool to reduce the number of variables (Põldaru and Roots, 2014; Azadeh, et al., 2013), was applied to remove the overlapping data from which the final reduced index system was determined to assess the green urbanization efficiency.
(2) Slacks-based measurement model
After the PCA index system reduction, the evaluation models were established.
The DEA model, first proposed in 1978 (Charnes et al., 1978), has been widely used to evaluate efficiency, with two main DEA models, the CCR and the BBC models, being the most well-known, with the CCR measuring overall efficiency under a constant return to scale assumption and the BBC measuring technical efficiency under a variable return to scale assumption. However, both have an obvious shortcoming as they presume that the inputs behave proportionally, which is unrealistic.
A second drawback of these radial models is that they neglect the slacks when reporting the efficiency. Therefore, of the DEA models, the slacks-based measure (SBM) model was selected (Tone, 2001) as it deals with the slacks directly and does not assume proportionate changes in the inputs and outputs (Chen and Jia, 2016). SBM models are more in line with reality, and have been used to measure energy efficiencies in Brazil, Russia, India and China (Song et al., 2013).
The efficiency was analyzed from technical, scale and general perspectives, for which two different models were employed: the SBM–CCR model which measures overall efficiency; and the SBM-BCC model which measures technical efficiency.
The respective equations are as follows:
and
where ε is less than any positive number and greater than zero, and
(3) Super-efficiency-SBM-C model (SE-SBM-CCR)
As traditional DEA models are unable to differentiate and rank the individual DMU efficiencies, the SE-SBM-CCR model, first proposed by Andersen and Petersen (1993), was applied for further comparisons and to rank the individual DMU efficiencies. The SE-SBM model principle is that for each efficient DMU, the model moves the production Frontier back and recalculates the efficiencies (Zhang et al., 2016). SE-SBM-CCR also eliminates the upper bound on the technical efficiency score and provides additional information regarding the relative performance of the efficient unit. Therefore, the SE-SBM-CCR model was applied in this paper to assess overall efficiency.
The constraints were as shown in Eq. (3),
(4) Projection and improved analysis
The results from the DMU efficiency evaluations allow for projections and improvement analyses to assist the inefficient DMUs and provide quantitative and qualitative management suggestions. Because there are no uncontrollable variables, such as environmental variables, the projection model could be simplified to Eq. (4).
where
Practical Application
The developed models were applied to a green urbanization efficiency evaluation in Sichuan province, which is known in China as the “Land of Abundance”. Located in the southwestern region of China, Sichuan can be divided into five development priority zones based on physical environment, natural resource abundance, and urban infrastructure (as shown in Figure 3) (Hu et al., 2016).
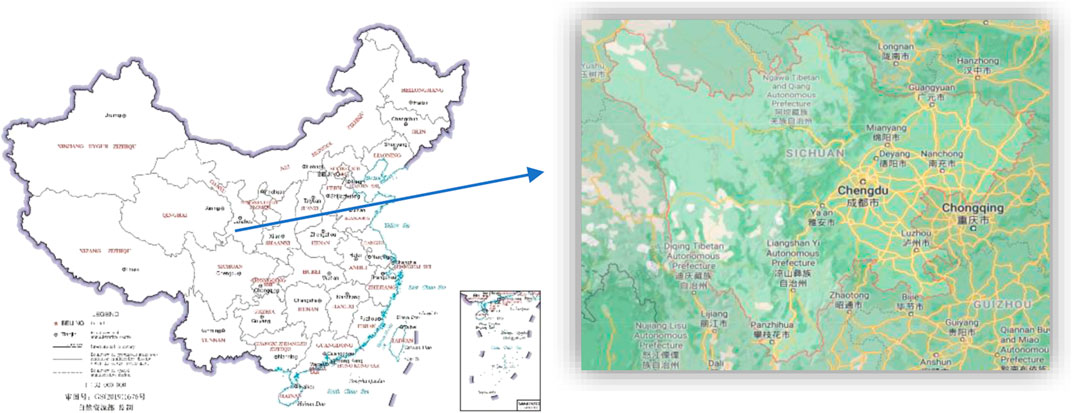
FIGURE 3. Functional regionalization of Sichuan.
Data from the Sichuan province 2014 statistical yearbook was extracted for each of the indices and the PCA applied to the inputs to reduce any excessive information overlaps and reduce the number of indices, for which SPSS 22.0, a calculation software program was used. After the KMO and Bartlett tests were passed, which tested whether the data were suitable for the PCA, four principal components were extracted; F1, F2, F3, and F4 (Table 2).
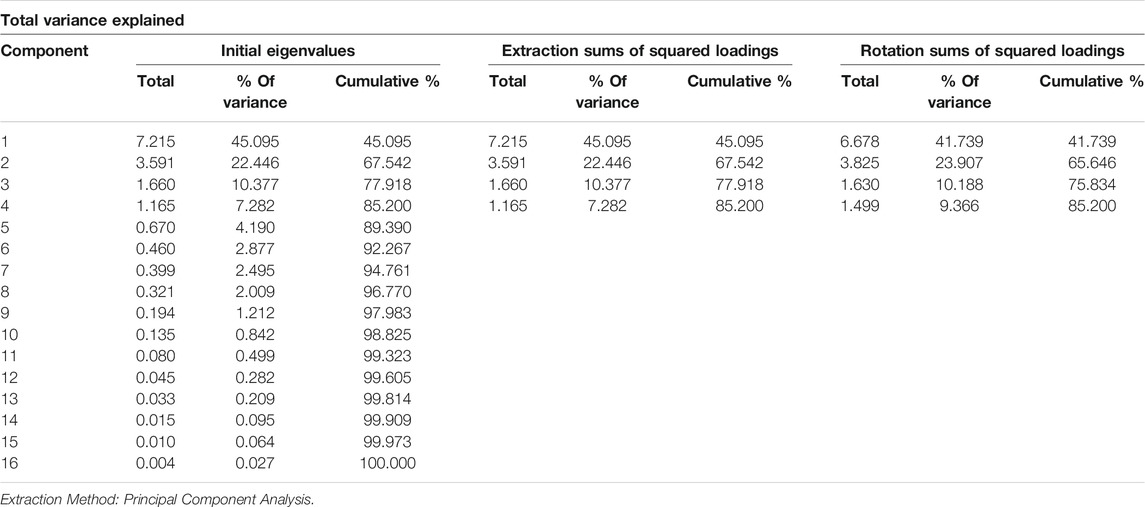
TABLE 2. Four components extracted by the PCA.
The component score coefficient matrix determined the definition for each basic component: F1 described the population, economic, and living standard indices; F2 described the education, health care and technology indices; and F3 and F4 respectively described the environment and energy indices.
Some negative data were identified during the PCA calculation; however, as SBM models are unable to deal with negative data, the same positive number was simultaneously added to each DMU component to ensure that the DMU efficiencies would not be influenced by the data processing (Pastor, 1996).
Following the data analysis, a reduced index system was considered, with each city in 2014 being considered one DMU, as shown in Table 3.
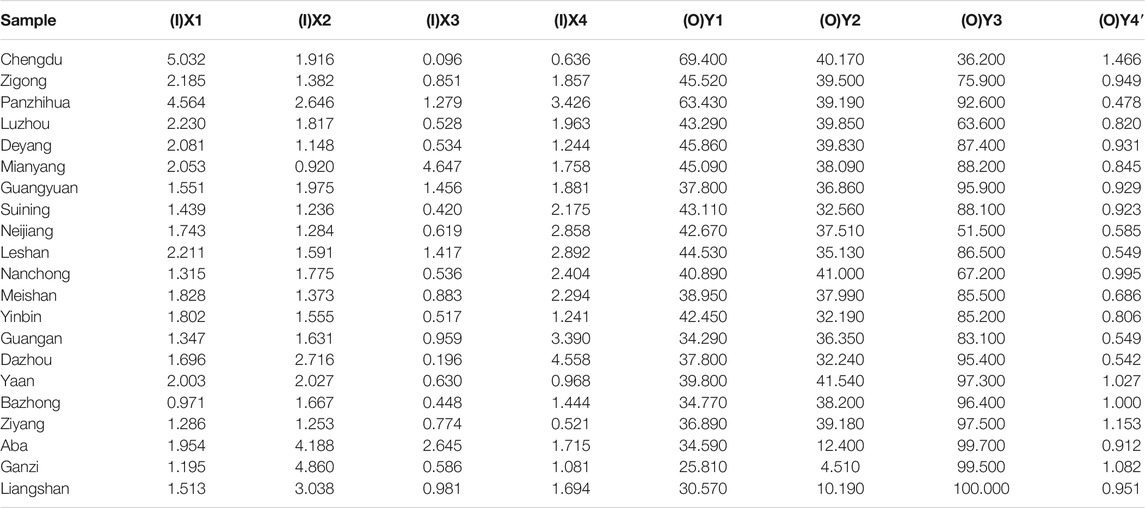
TABLE 3. Efficiency evaluation index system.
Governments are often more willing to make adjustments based on these input indicators as results and suggestions are more meaningful when based on an input-oriented analysis.
The input-oriented models were applied using Eq. (1) and the DEA SOLVER 5.0 and MAXDEA basic 6.4 software to determine the final overall, technical, scale and super efficiency values for each city and their respective rankings.
Results
Overall, Technical and Scale Efficiencies
Table 4 shows the green urbanization efficiency trends in the 21 cities.
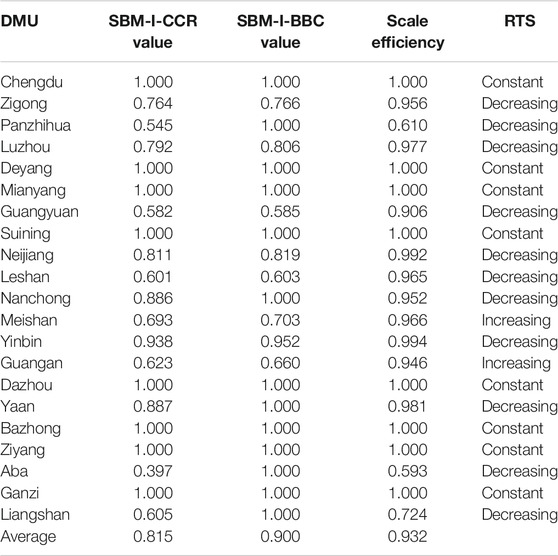
TABLE 4. Efficiency values for the 21 DMUs based on the SBM models.
First, the overall efficiency (SBM-I-CCR) revealed that 13 cities were inefficient, ranging from relatively developed cities such as Zigong and Panzhihua to smaller autonomous prefecture cities such as Aba and Liangshan. As the average overall efficiency was 81.54%, an 18% improvement was needed. At the outset of the 13th Five-Year Plan in China in 2016, the Sichuan provincial government needed to focus on green urbanization as well as new urban construction. Aba ranked last of these 21 cities, with an SBM-I-CCR value of only 39.7%, which was far less than the 81.55% average, meaning that 60.29% improvements were needed. The efficiencies in both Aba and Liangshan were low because of poor natural conditions, underdeveloped economies, a lack of resources and backward technologies; however, these factors were not included in the environmental factors because of the difficulties in measuring qualitative factors, which are further discussed in the final section of this paper. Ganzi, however, was shown to be efficient, and therefore, the Aba and Liangshan governments should determine if Ganzi’s model would suit their local conditions.
Second, the average technical efficiency as assessed by the SBM-I-BBC was nearly 90%. Eight cities were found to be inefficient, with Guangyuan being the worst at only 58.46% efficiency, leaving a large space for technical improvements. Careful resource allocation is also critical as reducing resource waste could maximize the desirable outputs.
Finally, the scale efficiency average was 93.16%, with 13 of the 21 cities being found to be scale inefficient, all of which had decreasing returns to scale, which indicated that the marginal benefits were smaller than the marginal costs, resulting in a waste of inputs. Therefore, the scale would need to proportionally shrink to maximize the scale-efficiency.
The integration of the three models revealed the following. Only eight of the 21 cities were efficient. The technical and scale efficiency analysis showed that of these eight cities, Zigong and Luzhou were found to be inefficient by both the SBM-I-BBC and the scale-efficiency models, which meant that the inefficiencies were the result of both technical and scale issues. Of the other inefficient cities, five needed to only address scale problems.
Rank and Comparison of the 21 DMUs (Super Efficiency Model)
As shown in Table 5 and Figure 4, the green urbanization efficiencies varied widely from 3.4022 to 0.5821, which revealed the serious unbalanced development in Sichuan Province. Most efficient cities were located in Chengdu, the capital city, and the northeast economic zones, with the efficiencies in the south, northwest and Panxi economic zones being sup-optimal. Therefore, the Sichuan government needs to adjust its development strategies and intensify investment in technology, infrastructure, and the provision of expertise in the southern and western areas.
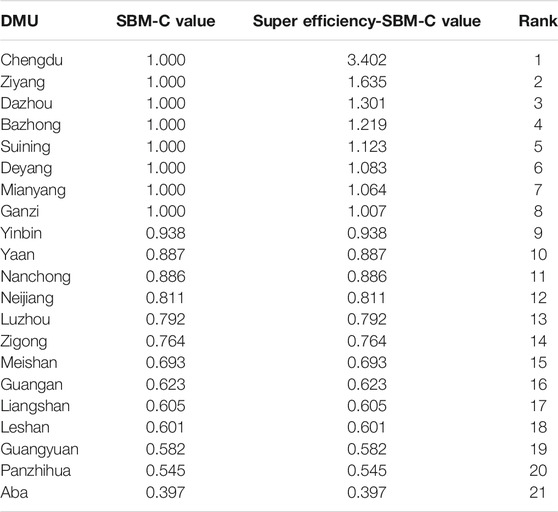
TABLE 5. The super efficiency value of 21 cities.
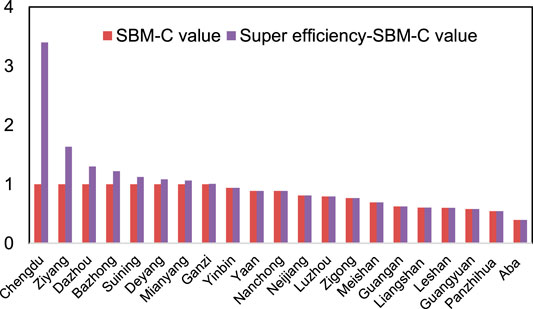
FIGURE 4. Efficiencies in the 21 cities solved by two models.
Projection and Improved Analysis
A projection analysis was performed on the 13 inefficient cities, the results of which are shown in Figures 5, 6.
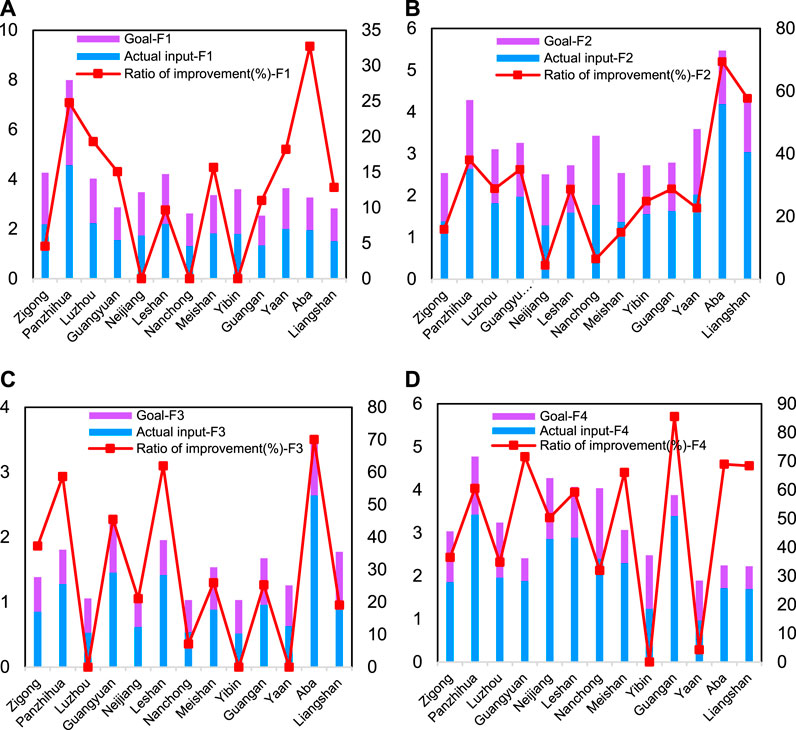
FIGURE 5. Projection and improved analysis of inputs.
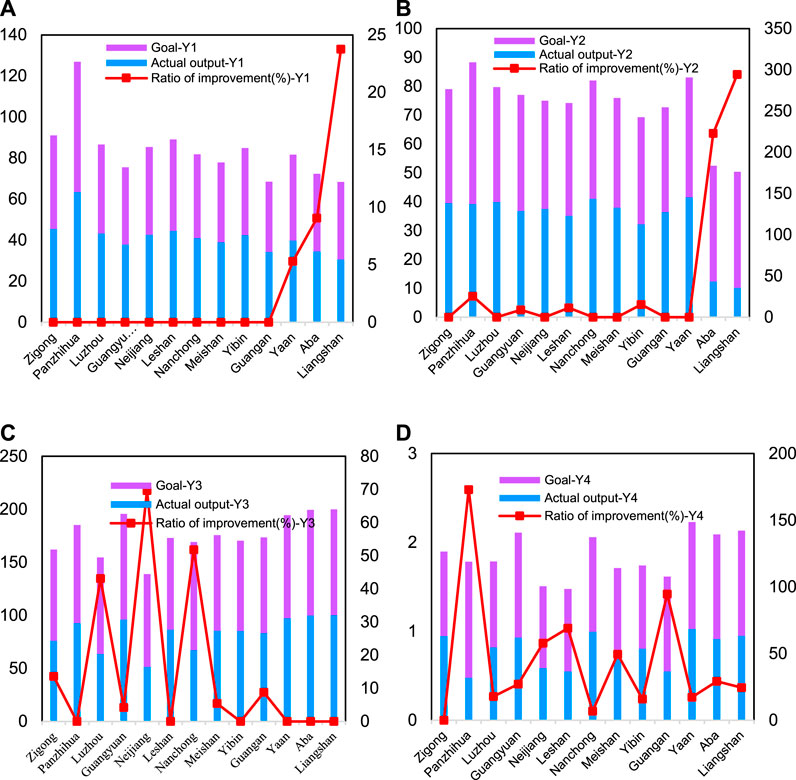
FIGURE 6. Projection and improved analysis of outputs.
Figures 5, 6 identify the trends or features in the 21 cities and their green urbanization efficiencies.
First, with the exception of Ya’an, Aba and Liangshan, the inefficient cities had no basic development construction and most had basic urbanization input redundancies. Therefore, it was concluded that while the urbanization process in Sichuan was developing well, it was in a critical transition stage from basic urbanization to green urbanization, which means that the government needs to pay greater attention to improving the technical efficiencies and allocating redundant resources to improvements in the environment and energy.
Urban development in Aba and Liangshan has lagged far behind other cities, with the most serious problem being a poor utilization of the urbanization inputs. While there has been significant government investment, there are still large output shortfalls. Therefore, the respective city governments and the provincial government need to focus on greener urban development in these two cities by focusing on the possible shortfalls, which could be the poor natural conditions (poor resources, location or a shortage of qualified workers) or the lack of qualified experts and appropriate technical development.
Energy conservation appeared to be a difficult challenge for the inefficient cities, with almost every city (expect for Zigong) having a low energy utilization problem. For example, Panzhihua, the improvement ratio for which was greater than 100%, requires more resources to improve their energy utilization, which would require increased inputs and technical efficiency improvements.
Overall, as the greening construction in Sichuan was relatively good with more than 60% of the inefficient cities having no shortfalls, the main challenge is to reduce the pollutant discharges by updating technologies and moving toward industrial transition. However, the ratio of improvements for greening in both Aba and Liangshan exceeded 200%, which indicated that there may be an unwillingness by local governments to invest in the environment because of the unique and superior air quality in these cities. As both cities have low urbanization, the government needs to place its focus on urban construction rather than the environment; however, during the construction process, sound environmental protection methods should be used.
Discussions and Implications
From these concrete conclusions, several directions are proposed in this section to advance the green urbanization development in Sichuan province.
Technical improvements are urgently needed. New and advanced technologies could improve efficiency and reduce resource waste. Therefore, the government needs to invest in technological improvements in the following areas.
(1) Environment: it is necessary to improve waste treatment and recycling technologies to further protect the environment, reduce pollution and encourage sustainable development. The industrial transformation needs greater focus to reduce the number of polluting factories, and encourage the establishment of green companies, which could be promoted using tax incentives.
(2) Urbanization: the urbanization problems need to be systematically resolved. The director of a city development center in NDRC suggested that to achieve the green urbanization goal, governments need to improve the urbanization quality by developing intelligent traffic management systems and scientifically modifying urban layouts.
(3) Energy conservation: the analysis demonstrated that controlling energy utilization was crucial. Therefore, the provincial and local governments need to more widely implement the advanced technologies being used in some areas to optimize energy supply schemes and install more advanced renewable energy sources.
The wide super-efficiency gap between these 21 cities revealed the shortfalls in the urbanization rates in Aba and Liangshan and highlighted Sichuan’s unbalanced development, which also meant that the green urbanization efficiencies were poor in some areas. Therefore, local governments need to address the development shortfalls by learning from experts in many fields and accelerating the construction of joint industrial parks to promote economic and technological self-sufficiency.
Governments also need to carefully plan major constructions and determine the major development fields in each economic zone. This could be done by encouraging the more efficient cities to aid the less efficient cities. However, the super efficiency analysis revealed that some core cities in each economic zone had also not yet achieved green urbanization efficiency.
It is also vital that development be aligned with local conditions; therefore, the concrete measures and development orientations that should be followed are given in the following suggestions. First, as it is located in the center of Sichuan province, Chengdu needs to focus on developing a multi-dimensional traffic system to provide more convenient, faster and cheaper modes of transportation. Second, as southern Sichuan has abundant water resources, the government should fully exploit and integrate these natural advantages to developed ports and a harbor economy. Third, in the northeastern area bordering Chongqing, it is crucial to cooperate with the Chongqing municipality to pursue joint development. Fourth, the Panxi (Panzhihua–Xichang) zones, which are located on the One Belt and One Road route, should be increasingly open to the outside world and clean-energy resources developed to reduce the emissions from the many polluting factories. Finally, tourism and transportation should be further developed in the northwest zones to develop an eco-friendly tourism cluster and boutique tourism routes. Overall, it is essential that all cities have a common view of the need to improve and maintain green urbanization efficiency, with the associated technological developments aligning with resource conservation and manageable utilization and gradually encouraging the adoption of green architecture, green communities and green energy by controlling land use and resident settlement, and adjusting economic structures, transportation networks, functional allocations, and city development. A national campaign to promote green living could also help residents be mindful of their energy consumption. Therefore, the main challenge facing city planners is to develop an ideal model for sustainable green urban growth.
Conclusion
This study developed a series of SBM DEA models to evaluate green urbanization efficiencies, where PCA was used for indicator filtering. First, in order to comprehensively evaluate the efficiencies, indicators in this paper cover multiple aspects, that is population, economy, education, health care, technology, the environment and energy use. Second, PCA was applied before the efficiency evaluations to reduce the quantity of indices to be analyzed. Third, SBM models were employed to address the efficiency measurement deviations in traditional DEA models, which ignore the input and output slacks, and a series of SBM models applied to evaluate the efficiencies to ensure greater accuracy. Fourth, an all-dimensional, multi-angular evaluation and analysis from overall efficiency to technical efficiency to scale efficiency to super efficiency was conducted, with the super efficiency analysis producing a ranking list to compare the efficiencies in different areas. Fifth, as the experimental data used were extracted from public documents obtained from local governments, the efficiencies calculated for each city were relatively accurate and rational. Finally, a green urbanization index system was developed, applied, and proven to be effective, which could be useful for efficiency evaluations in other regions or countries.
Based on the SBM model, 13 of the 21 cities were identified to be inefficient. The technical and scale efficiency analysis were further evaluated by the SBM-I-BBC model. Among the efficient DMUs, super efficiency SBM model is used to distinguish the DMUs with the same level of efficiency values. Finally, projection and improved analysis was conducted to direct cities’ governments to improve the green urbanization efficiencies. Strategies differ from city to city, for example, reduce the pollutant discharges by updating technologies and moving toward industrial transition in Chengdu.
Because of the limited data, we evaluated the green urbanization efficiency in Sichuan province. For future research, a multi-stage DEA model is planned to be proposed to evaluate more complex real-world systems with long-term data.
Data Availability Statement
The datasets presented in this study can be found in the main text. The names of the repository/repositories and accession number(s) can be obtained from the corresponding author.
Author Contributions
HL proposed the model and revised the paper; RC collected the data and calculated the urbanization efficiencies.
Conflict of Interest
The authors declare that the research was conducted in the absence of any commercial or financial relationships that could be construed as a potential conflict of interest.
References
Ancog, R., and Ruzol, C. (2015). Urbanization adjacent to a wetland of international importance: the case of Olango Island Wildlife Sanctuary, Metro Cebu, Philippines. Habitat Int. 49, 325–332. doi:10.1016/j.habitatint.2015.06.007
Andersen, P., and Petersen, N. C. (1993). A procedure for ranking efficient units in data envelopment analysis. Manag. Sci. 39 (10), 1261–1264. doi:10.1287/mnsc.39.10.1261
Azadeh, A., Ghaderi, S. F., Anvari, M., Raoofi, Z., Izadbakhsh, H. R., and Rezaee, M. J. (2013). An integrated decision support system for performance assessment and optimization of decision-making units. Int. J. Adv. Manuf. Technol. 66 (5–8), 1031–1045. doi:10.1007/s00170-012-4387-6
Charnes, A., Cooper, W. W., and Rhodes, E. (1978). Measuring the efficiency of decision making units. Eur. J. Oper. Res. 2 (6), 429–444. doi:10.1016/0377-2217(78)90138-8
Chen, L., and Jia, G. (2016). Environmental efficiency analysis of China's regional industry: a data envelopment analysis (DEA) based approach. J. Clean. Prod. 195, 1487–1496. doi:10.3390/en11082002
Chikaraishi, M., Fujiwara, A., Kaneko, S., Poumanyvong, P., Komatsu, S., and Kalugin, A. (2015). The moderating effects of urbanization on carbon dioxide emissions: a latent class modeling approach. Technol. Forecast. Soc. Change 90, 302–317. doi:10.1016/j.techfore.2013.12.025
Cobbinah, P. B., Erdiaw-Kwasie, M. O., and Amoateng, P. (2015). Africa's urbanisation: Implications for sustainable development. Cities 47, 62–72. doi:10.1016/j.cities.2015.03.013
Cottineau, C., Reuillon, R., Chapron, P., Rey-Coyrehourcq, S., and Pumain, D. (2015). A modular modelling framework for hypotheses testing in the simulation of urbanisation. Systems 3 (4), 348–377. doi:10.3390/systems3040348
Hayek, U. W., Efthymiou, D., Farooq, B., von Wirth, T., and Teich, M. (2015). Quality of urban patterns: Spatially explicit evidence for multiple scales. Landsc. Urban Plann. 142, 47–62. doi:10.1016/j.landurbplan.2015.05.010
Hu, Y., Huang, W., Wang, J., Chen, S., and Zhang, J. (2016). Current status, challenges, and perspectives of Sichuan׳s renewable energy development in Southwest China. Renew. Sustain. Energy Rev. 57, 1373–1385. doi:10.1016/j.rser.2015.12.138
Huang, L., Yan, L., and Wu, J. (2016). Assessing urban sustainability of Chinese megacities: 35 years after the economic reform and open-door policy. Landsc. Urban Plann. 145, 57–70. doi:10.1016/j.landurbplan.2015.09.005
Imam, A. U., and Banerjee, U. K. (2016). Urbanisation and greening of Indian cities: problems, practices, and policies. Ambio 45 (4), 442–457. doi:10.1007/s13280-015-0763-4
Karteris, M., Theodoridou, I., Mallinis, G., Tsiros, E., and Karteris, A. (2016). Towards a green sustainable strategy for Mediterranean cities: assessing the benefits of large-scale green roofs implementation in Thessaloniki, Northern Greece, using environmental modelling, GIS and very high spatial resolution remote sensing data. Renew. Sustain. Energy Rev. 58, 510–525. doi:10.1016/j.rser.2015.11.098
Liddle, B., and Lung, S. (2014). Might electricity consumption cause urbanization instead? Evidence from heterogeneous panel long-run causality tests. Global Environ. Change 24, 42–51. doi:10.1016/j.gloenvcha.2013.11.013
Ma, B. (2015). Does urbanization affect energy intensities across provinces in China?Long-run elasticities estimation using dynamic panels with heterogeneous slopes. Energy Econ. 49, 390–401. doi:10.1016/j.eneco.2015.03.012
Pastor, J. T. (1996). Chapter 3 Translation invariance in data envelopment analysis: a generalization. Ann. Oper. Res. 66 (2), 91–102. doi:10.1007/bf02187295
Pérez-Alonso, J., Callejón-Ferre, Á. J., Carreño-Ortega, Á., and Sánchez-Hermosilla, J. (2011). Approach to the evaluation of the thermal work environment in the greenhouse-construction industry of SE Spain. Build. Environ. 46 (8), 1725–1734. doi:10.1016/j.buildenv.2011.02.014
Põldaru, R., and Roots, J. (2014). A PCA-DEA approach to measure the quality of life in Estonian counties. Soc. Econ. Plann. Sci. 48 (1), 65–73. doi:10.1016/j.seps.2013.10.001
Radford, K. G., and James, P. (2013). Changes in the value of ecosystem services along a rural-urban gradient: a case study of Greater Manchester, UK. Landsc. Urban Plann. 109 (1), 117–127. doi:10.1016/j.landurbplan.2012.10.007
Song, M.-L., Zhang, L.-L., Liu, W., and Fisher, R. (2013). Bootstrap-DEA analysis of BRICS' energy efficiency based on small sample data. Appl. Energy 112, 1049–1055. doi:10.1016/j.apenergy.2013.02.064
Storper, M., and Scott, A. J. (2016). Current debates in urban theory: a critical assessment. Urban Stud. 53 (6), 1114–1136. doi:10.1177/0042098016634002
Tan, Z., Ren, C., and Hu, L. F. (2014). “Analysis on investment efficiency of infrastructure of China under the background of new-type urbanization - based on super-efficiency DEA model and Malmquist index”, in 2014 11th international conference on service systems and service management (ICSSSM), IEEE, 1–6.
Tone, K. (2001). A slacks-based measure of efficiency in data envelopment analysis. Eur. J. Oper. Res. 130 (3), 498–509. doi:10.1016/s0377-2217(99)00407-5
Wei, Y., Huang, C., Li, J., and Xie, L. (2016). An evaluation model for urban carrying capacity: a case study of China's mega-cities. Habitat Int. 53, 87–96. doi:10.1016/j.habitatint.2015.10.025
Wu, C. D., and Lung, S. C. (2016). Application of 3-D urbanization index to assess impact of urbanization on air temperature. Sci. Rep. 6, 24351. doi:10.1038/srep24351
Zhang, C., Juan, Z., Luo, Q., and Xiao, G. (2016). Performance evaluation of public transit systems using a combined evaluation method. Transport Pol. 45, 156–167. doi:10.1016/j.tranpol.2015.10.001
Zhang, Z. B., Liu, R., and Huang, K. (2014). Annual report on the healthy development of China’s new urbanization. Beijing, China: Press of Social Science.
Zhao, J., and Chai, L. (2016). A novel approach for urbanization level evaluation based on information entropy principle: a case of Beijing. Phys. Stat. Mech. Appl. 430, 114–125.
Zhou, D., Xu, J., Wang, L., and Lin, Z. (2015). Assessing urbanization quality using structure and function analyses: a case study of the urban agglomeration around Hangzhou Bay (UAHB), China. Habitat Int. 49, 165–176. doi:10.1016/j.habitatint.2015.05.020
Keywords: green urbanization, efficiency measure, projection and improved analysis, SBM model, Sichuan province
Citation: Chen R and Lu H (2021) PCA-SBM Model Green Urbanization Performance Assessment in China. Front. Energy Res. 9:637820. doi: 10.3389/fenrg.2021.637820
Received: 04 December 2020; Accepted: 07 January 2021;
Published: 10 February 2021.
Edited by:
Yin Long, The University of Tokyo, JapanReviewed by:
Yiqiong Wu, Xi’an Jiaotong University, ChinaChi-Hua Chen, Fuzhou University, China
Yao-Huei Huang, Fu Jen Catholic University, Taiwan
Copyright © 2021 Chen and Lu. This is an open-access article distributed under the terms of the Creative Commons Attribution License (CC BY). The use, distribution or reproduction in other forums is permitted, provided the original author(s) and the copyright owner(s) are credited and that the original publication in this journal is cited, in accordance with accepted academic practice. No use, distribution or reproduction is permitted which does not comply with these terms.
*Correspondence: Haochun Lu, aGFvY2x1QGdtYWkuY29t