 Zhaoyang Qu1,2
 Yunchang Dong1,2*Nan Qu3Huashun Li4Mingshi Cui5Xiaoyong Bo1,2Yun Wu6
 Sylvère Mugemanyi1
- 1School of Electrical Engineering, Northeast Electric Power University, Jilin, China
- 2Jilin Engineering Technology Research Center of Intelligent Electric Power Big Data Processing, Jilin, China
- 3State Grid Jiangsu Electric Power Co., Ltd., Nanjing, China
- 4State Grid Jilin Electric Power Co., Ltd., Jilin, China
- 5State Grid Inner Mongolia Eastern Electric Power Co., Ltd., Hohhot, China
- 6Zhejiang Windey Co., Ltd., Hangzhou, China
In the process of the detection of a false data injection attack (FDIA) in power systems, there are problems of complex data features and low detection accuracy. From the perspective of the correlation and redundancy of the essential characteristics of the attack data, a detection method of the FDIA in smart grids based on cyber-physical genes is proposed. Firstly, the principle and characteristics of the FDIA are analyzed, and the concept of the cyber-physical FDIA gene is defined. Considering the non-functional dependency and nonlinear correlation of cyber-physical data in power systems, the optimal attack gene feature set of the maximum mutual information coefficient is selected. Secondly, an unsupervised pre-training encoder is set to extract the cyber-physical attack gene. Combined with the supervised fine-tuning classifier to train and update the network parameters, the FDIA detection model with stacked autoencoder network is constructed. Finally, a self-adaptive cuckoo search algorithm is designed to optimize the model parameters, and a novel attack detection method is proposed. The analysis of case studies shows that the proposed method can effectively improve the detection accuracy and effect of the FDIA on cyber-physical power systems.
Introduction
With the continuous development of information technology, the interaction between information flow and energy flow in power systems is becoming more and more frequent (Yu and Xue, 2016; Xu et al., 2018; Qu et al., 2019). By integrating computing systems, communication networks and physical environments, traditional power systems have evolved into cyber-physical power systems (CPPS) (Yang et al., 2019; He et al., 2020). In the process of production management and dispatch control in smart grids, cyber systems are increasingly inseparable. The integration of renewables is threatening the secure operation of today’s CPPS because of inherent uncertainties of renewable power generations (Li et al., 2018; Li et al., 2020). At the same time, however, some vulnerabilities in the cyber system may be exploited by attackers, posing serious threats to the physical system across cyber-physical spaces (Li et al., 2019). They can even cause the temporary paralysis of important infrastructure (Adhikari et al., 2017). FDIAs are advanced and sustainable data integrity attacks in the CPPS. By modifying the collected measurement data, the system state estimation will be biased and the power grid will be damaged by the incorrect action of switches (Liang et al., 2016). The cyber security of CPPS has gradually attracted people’s attention. Furthermore, how to effectively identify the FDIA has become an urgent problem to be solved in the safe and stable operation of power systems.
In recent years, FDIAs in the CPPS have become a hot topic in power system studies. The FDIA was first proposed in Liu et al. (2011). The relevant principles are explained. It is assumed that the attacker can successfully attack the power system by bypassing the traditional bad data detection method when fully grasping the grid topology information and related parameters. But in reality, it is more difficult for an attacker to obtain this information. From the attacker’s perspective, research has shown that FDIA can be launched without fully grasping the topology information (Liu et al., 2015). A sequential pattern mining method was proposed in Pan et al. (2015) to accurately extract power system interference and network attack patterns from heterogeneous time synchronization data. This method does not have a suitable division scheme to determine the classification boundary. Through feature engineering to reconstruct new features, a new method of processing abnormal data was proposed (Wang et al., 2019), and then a power system attack detection model based on machine learning was constructed. Existing features were reconstructed in that method, which increased the computational cost. The mechanism and method of FDIA under DC and AC models were studied, and an attack detection method based on the CNN-GRU hybrid model was proposed (Li et al., 2019). The optimal fusion estimation method was designed by adding a compensation factor to study the detection of FDIA attack signal under CPPS (Gao et al., 2019). However, there is no explanation on how to choose the appropriate compensation factor.
At present, the CPPS sensing equipment is gradually increasing, and the amount of data is increasing. The recognition accuracy of traditional methods can no longer meet the increasing actual demand. At the same time, new types of FDIAs are emerging endlessly. Even if the topology information is not fully mastered, it can bypass the traditional detection mechanism to launch attacks.
In summary, the existing research on the detection of FDIAs based on machine learning has the following limitations: 1) less collaborative consideration of cyber and physical data characteristics, unilateral attack detection methods find it difficult to identify complex cyber-physical attacks. 2) The features of the initial CPPS data are complex, and feature selection and transformation directly affect the validity and accuracy of the detection results, and effective feature mining techniques are required. 3) Attack detection speed is an important factor in actual engineering, and it is necessary to increase the model calculation speed.
According to the consideration of the complex characteristics of the CPPS data, this paper proposes a method for identifying the FDIA in the CPPS based on cyber-physical genes. The main contributions of this paper are as follows:
(1) From the perspective of cyber and physical integration of power systems, the concept of “FDIA genes” is proposed. Through the melting processing of information features, the largest information coefficient is introduced for feature selection, and a subset of gene features that are useful for attack detection are screened, and the high-dimensional problem of data features is solved.
(2) An FDIA gene extraction model is constructed based on a stack auto-encoding network (SAE). An unsupervised pre-training encoder is set to extract attack genes, and a supervised fine-tuning classifier is set to classify attacks. Deep learning is used to automatically learn and extract the abstract FDIA gene, which can better represent the essential attributes of the FDIA.
(3) A self-adaptive cuckoo search algorithm (SACS) is proposed to solve and optimize the initialization parameters of the detection model. Historical data are trained and network parameters are fine-tuned to accurately identify the FDIA.
The rest of this paper is organized as follows: according to the principle and characteristics of false data injection attacks, cyber-physical FDIA genes are defined, and the optimal attack gene feature set is selected with the maximum information coefficient in FDIA Gene Definition and Feature Selection. The SAE is constructed to extract FDIA genes in .FDIA Detection Model A self-adaptive cuckoo algorithm is proposed to solve the model parameter optimization problem, the FDIA detection method based on SACS-SAE is designed to identify attacks in Attack Detection Method Based on SACS-SAE. Case Studies demonstrates simulation results on case studies, and finally, the conclusions are drawn in Conclusion.
FDIA Gene Definition and Feature Selection
FDIAs are a new type of attack against the CPPS. The attacker uses the measurement data of the power system as the target of the attack, and builds the attack vector based on the state estimation equation. Vulnerabilities in the detection mechanism of poor state estimation data are used to tamper with the measurement data at will, prompting the power grid to incorrectly estimate the current operating state. In turn, it will affect the power generation control and dispatch operation of the CPPS, causing system malfunctions. This attack is highly concealed and difficult to be detected. We analyze the principles and characteristics of the FDIA in the CPPS, use the bio-inspired concept of genes, and define the cyber-physical FDIA gene.
Principles of the FDIA
Assuming that the attacker has obtained the complete information of the CPPS, then an FDIA can be constructed. Moreover, it is not discovered by the traditional bad data detection mechanism. As a result, the state estimation result of the power system is wrong. The process under the direct current system can be described in Eq. (1):
Where Za is the tampered measurement data, Z is the actual measurement, H is the Jacobian matrix of the power system, θ is the state of the power system, a is the false value injected by the attacker, and e is the amount of error generated in the measurement process.
If c is the false data, it should be satisfied in Eq. (2):
Where W is the diagonal matrix of the measurement error, and the residual expression is shown in Eq. (3):
From the above equation, when the attacker masters the Jacobian matrix, as long as the injected false data satisfy a = Hc, the measured data can be tampered with and the traditional bad data detection method can be bypassed to realize the FDIA.
The features of the FDIA in the CPPS are summarized as follows:
(1) The FDIA has a cross-domain interaction in the cyber-physical space. The attacker comprehensively considers the characteristics of cyber-physical coupling, and utilizes cyber-attacks technology to detect, invade, elevate, and control the cyber system. Then the attacker will launch physical attacks such as disconnecting the knife switch to undermine the security of the power system.
(2) The evolution mechanism of FDIA behavior is complicated. A coordinated attack is a finely designed multi-step attack, including the evolution of network behavior over time, and the coordination of multiple attackers that change over space.
(3) The FDIA is hereditary and variant. The same type of attack has the common characteristics of the family. The attack changes the form of the attack through the outer event encapsulation, but the nature of the attack has not changed, making it difficult to identify the attack after the variant.
Cyber-Physical FDIA Genes
The phasor measurement unit has been widely used in the CPPS, providing nearly real-time voltage phase, current phase, and other measurement values for power system personnel (Li et al., 2019) as physical data in the attack detection process. Simultaneously, various intrusion detection systems are deployed in the CPPS. Among them, the collected communication flow, network log and other data are regarded as cyber data. The data of the physical system, and the data of the cyber system together form the cyber-physical data.
The biological gene is the most essential factor used to distinguish different species or different individuals of the same species. It is also the most credible basis for judging the same species or the same individual. Genetic recombination and variation control the family heritability and diversity of organisms (Hagai et al., 2018; Qu et al., 2020).
If the potential key data features that control the law of the FDIA behavior can be found from the original cyber-physical data, the types of attacks can be more effectively detected. Drawing lessons from the idea of the biological gene, the cyber-physical FDIA gene is defined as follows: in the CPPS data set containing the attack, select the key samples in the attack activity, and extract the characteristic data pieces that contain the attack behavior information. First remove the redundant and useless characteristic information, and then perform the self-learning of the inherent law of the characteristic combination change through the process of mining, the genes of the nature of the attack are obtained, and the type of attack can be detected through the uniqueness of each attack gene.
Optimal Attack Gene Feature Set Selection
Due to the increasing number and type of controlled components, the number of key features in the CPPS is relatively large. Data parameters usually have complex properties such as nonlinear correlation, non-functional dependency, and redundancy. For example, the fluctuation of voltage, phase, and frequency show similar fluctuations, indicating that there is a certain degree of redundancy among them (Qu et al., 2018). However, traditional feature selection methods find it difficult to capture the non-functional dependency between features.
Considering that the high-dimensional characteristics, nonlinear correlation, and non-functional dependency of CPPS data have caused serious obstacles in the research and application process. Under the condition of supervised learning, this paper proposes an improved maximum correlation minimum redundancy attack gene feature selection method considering the maximum information coefficient (MIC). The maximum correlation minimum redundancy algorithm determines the optimal set of gene features by calculating the mutual information between different features and categories (Dai et al., 2016). Nevertheless, it is difficult to capture the non-functional dependency between features in CPPS data (Yang et al., 2018). The MIC between features is analyzed using the method of grid partition and mutual information. Given feature x with the probability density p(x) and feature y with the probability density p(y), and the joint probability density is p (x, y), the mutual information I (x, y) between them is shown in Eq. (4):
The set F formed by features < x, y> is cut using grid G. By changing the position of the dividing point, the mutual information value in each sub-grid is calculated, and the maximum mutual information value of the entire grid G is obtained. The maximum mutual information of F under grid G is shown in Eq. (5):
Where F|G means that the set F is divided by the grid G, and the maximum normalized I*(F, x, y) values obtained by changing different cutting points form the characteristic matrix M(F)x,y in Eq. (6):
The maximum information coefficient is shown in Eq. (7):
Where the range of MIC(F) is [0,1], and B(n) is the upper limit of the grid size. If B(n) is too large, the data in set F may be gathered in a small part of the sub-grid, and if B(n) is too small, less data can be searched. Generally, the effect is best when B(n) = n0.6 (Law et al., 2019), and this value is also used in this paper. The greater the MIC between features and categories, the stronger the correlation, and the greater the impact on the final classification results. The greater the MIC between features, the stronger the substitutability between features, that is, the stronger the redundancy. The process of quantitative analysis of correlation and redundancy is shown as follows:
Where C represents the correlation between the feature set F and the attack category c, and R represents the redundancy between the features in the set F. F and |F| are the feature set and the number of features, xi represents the ith feature, and c represents the category label. MIC (xi, c) represents the maximum information coefficient between feature i and the target category, and MIC (xi, xj) represents the maximum information coefficient between feature i and feature j.
The optimal attack gene feature set realizes feature selection from the perspective of feature correlation and redundancy. This requires the selected set to meet the conditions of maximum correlation and minimum redundancy. The following criteria are used for comprehensive consideration in Eq. (10):
Assuming that the original feature set is F, the optimal feature subset F(m-1) of m-1 features has been obtained. The process of selecting the mth feature from the remaining F-F(m-1) features should be satisfied in Eq. (11):
At the same time, with the update and development of terminal equipment, CPPS feature information may gradually increase, and the optimal feature set can still be supplemented according to Eq. (8).
Gene Feature Set Selection Process
The algorithm flow is as follows:
Input: original attack feature set F, category label c.
Output: the optimal attack gene feature set F'.
(1) Discretize the continuous data in the feature set F, and the initial value of the feature set F′ is a null value.
(2) Calculate the maximum information coefficient of each feature and category label c, and remove irrelevant and weakly related features.
(3) Find the feature Fi that maximizes Eq. (8) in F, add it to the optimal attack feature set F′, and delete the feature Fi from F.
(4) Repeat step 3) and continue to select features from the remaining features in feature set F.
(5) Obtain the optimal FDIA gene feature set F′.
FDIA Detection Model
On the basis of attack gene feature selection, the self-learning ability of a stacked autoencoder (SAE) network is used to further extract abstract genes.
Extracting Attack Genes with Unsupervised Pre-Training Encoder.
An SAE detection model mainly includes two parts: an unsupervised pre-training encoder and a supervised fine-tuning classifier. The detection model uses the cyber-physical optimal attack gene feature set after the above feature selection method as the input layer, and the type of attack on the system is used as the output layer of the neural network. Where the physical layer includes physical factors such as voltage, current, and phase angle, and the cyber layer includes information factors such as communication traffic and alarm logs. The SAE detection model is shown in Figure 1.
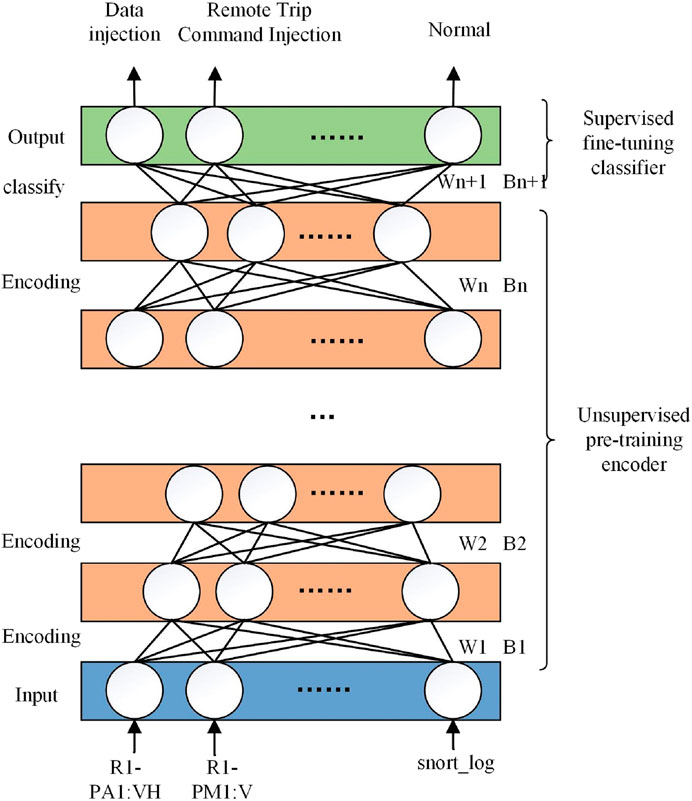
FIGURE 1. SAE detection model structure.
An autoencoder neural network is constructed. The input layer and output layer of the network are kept as much the same as possible, so that the low-dimensional data of the hidden layer extracted from the intermediate gene can represent the original data. This process does not require labels for supervised training. The layer-by-layer greedy training method is used to pre-train each layer of the neural network, and the network parameters are initialized layer by layer. The cyber and physical features are abstracted layer by layer and coded into low-dimensional data features to reduce the difficulty of model training.
In Eq. (11) and Eq. (12), L and Z are encoders and decoders, X = {X1, X2,....., Xn} is the feature to be encoded, w refers to the weight parameter, b refers to the deviation value, and S refers to the activation function sigmoid:
The loss function is defined as follows:
By minimizing the loss function, the most suitable set of weight parameters (w, b) are obtained to make the neural network optimal. The data are encoded multiple times to obtain the cyber-physical attack gene after dimensionality reduction.
Supervised Fine-Tuning Classifier
The supervised fine-tuning classifier Softmax is constructed for the final attack detection step. The neurons in the output layer are set to N. For N-type CPPS attacks, each neuron represents a type of attack. After the detection is completed, only one neuron of the N output layer neurons has a value of 1, and the remaining N-1 neurons are all 0. The attack mode represented by the neuron with the value of one is the detected attack. The Softmax algorithm is defined in Eq. (16):
Where i represents the category index, Yi represents the probability that the detection result is the ith category, xi is the input value of the Softmax classifier, and the total number of categories is N.
In order to prevent the parameters from falling into the local optimum, the labeled data set is used for reverse fine-tuning. By comparing the label result with the classification result, the backpropagation algorithm is used to adjust the model parameters. All layer parameters of the entire SAE detection model reach the global optimum as much as possible.
When the SAE detection model adjusts the optimized parameters, the initial parameter setting requirements are higher. The objective function of the initial parameters of the model is expressed in Eq. (17):
Where n is the total number of samples, y′(i) represents the expected output sample, and y(i) represents the actual output sample.
Attack Detection Method Based on SACS-SAE.
The initial parameter values of the model are critical to the accuracy of the model (Xing et al., 2019). The initial parameters after unsupervised pre-training have the disadvantages of slow convergence and easily fall into local optimum. Aiming at this problem, a self-adaptive cuckoo search (SACS) algorithm is proposed to optimize the initial parameters of the SAE model. And on this basis, a new method of FDIA detection in the CPPS based on SACS-SAE is obtained.
Model Parameter Optimization
The cuckoo algorithm has the advantages of being a simple model, has few parameters, and strong versatility, which is often used to find the optimal solution of the model (Chitara et al., 2018). However, the step size factor and discovery probability are usually fixed values, which leads to a lack of flexibility and adaptability in the algorithm. A self-adaptive strategy is introduced to optimize this problem.
In the self-adaptive cuckoo algorithm, all bird nests are calculated in each iteration to save the best bird nest storage. The specific algorithm flow is as follows:
Step (1) Randomly generate n initial positions of the bird’s nest [x1(0), x2(0),..., xn(0)]. They correspond to the initial weight and threshold parameters of the SAE network model, and the neural network trains the model according to the parameter values. The result is calculated according to Eqs. (18)Eqs. (19).
Where xi is the position of the ith bird’s nest in the tth generation, α is the step-length control factor,
Both μ and v obey normal distribution; β is 1.5, and the value of ϕ is as follows:
Step (2) Generally, the larger the step size factor α0, the stronger the global search ability, but the algorithm convergence accuracy decreases; the smaller the value, the more the optimization accuracy improves, but the convergence speed is slower. In the standard cuckoo algorithm, this value is set to a fixed value, which makes the algorithm’s convergence process lack self-adaptability. This paper creates dynamic settings as shown in Eq. (22):
Where ti represents the current number of iterations, and tmax represents the maximum number of iterations. The value of α0 will gradually decrease with the increase of the number of iterations, to ensure that the step size is gradually reduced, the algorithm satisfies the global search in the early stage, and the optimization accuracy is improved in the later stage.
Step (3) Integrating the above process, the expression of the new individual generated by the self-adaptive cuckoo algorithm is as follows:
Step (4) Calculate all bird’s nests in each iteration, and save the best bird’s nest position xd(0).
Step (5) After obtaining a new generation of bird’s nest positions, use better bird’s nest positions to replace the poorer bird’s nest positions of the previous generation to obtain a set of better bird’s nest positions ek = [x1(k), x2(k),..., xn(k)].
Step (6) Generate a random number rand in the range of [0,1]. If rand >pa, then discard some of the solutions, and use the preferred random walk to generate the same number of new solutions. As shown in Eq. (24):
Where xj(t) and xk(t) represent two random solutions of the t-th generation.
Step (7) Discovery probability pa is generally a fixed value of 0.25, which determines whether the current solution is retained. In order to prevent the algorithm from falling into the local optimum, the cuckoo algorithm is further improved: the discovery probability pa is dynamically set, and it gradually increases as the search progresses. In the later stage of the evolution, the global search and local search in the algorithm can be balanced. The convergence accuracy of the algorithm is improved as a whole to avoid falling into the local optimum. As shown in Eq. (25):
Where pa represents the discovery probability of the bird’s nest, pa,max represents the maximum discovery probability, ti represents the current iteration number, and tmax represents the maximum iteration number.
Step (8) After obtaining a new set of bird’s nest positions, according to the objective function, the bird’s nest position with better performance is replaced with the bird’s nest position with poor performance in ek. So far we get the latest set of bird’s nest positions Qk = [x1(k), x2(k), …, xn(k)].
Step (9) Find the best bird’s nest position xd(k) in Qk, if the maximum number of iterations is not reached, return to step 4) to continue searching and optimizing, otherwise output the best position xd(k).
Step (10) According to the value corresponding to the optimal bird’s nest position xd(k) as the initial parameters of the model, the forward training and reverse adjustment of the model are performed.
SACS-SAE Attack Detection Steps
The SACS is employed for solving the objective function in order to improve the convergence accuracy. So far, the attack detection steps based on the SACS-SAE detection method are as follows.
Step (1)There are non-numerical and infinite values in the data, which seriously affect model training. The entire data containing non-numerical and infinite values are deleted. The detection problem is a multi-classification problem, so the category attribute should be converted to one-hot encoding form. For example, the type of event 1 can be converted to (1, 0, 0,..., 0), and event 41 can be converted to (0, 0,..., 0, 1).
There is a large gap in the value of different features in the original data, which is prone to large errors. The original data are normalized, and the characteristic data are mapped to the range of [−1, 1] according to Eq. (26). Where xi is the attribute value of a certain column, xmin is the minimum value of the column attribute, and xmax is the maximum value of the column attribute.
Step (2) After obtaining the standardized data set, use the maximum information coefficient to calculate the correlation between the feature and the category, and the redundancy between the feature and the category, and screen the optimal cyber-physical attack gene feature set based on the maximum mutual information coefficient.
Step (3) Construct an unsupervised pre-training encoder to encode the original data and reduce the dimensionality. The greedy training method is used to train each layer of the network layer by layer, initialize the model parameters, and deeply extract the abstract genes of the input gene feature set to reduce the difficulty of model training.
Step (4) Construct a supervised fine-tuning classifier, followed by a Softmax classifier after the coding layer. The network weights and thresholds initialized by unsupervised pre-training are utilized as the position vector of the bird's nest, and the objective function of the model is utilized as the fitness function of the bird’s nest, and the optimal solution is continuously iterated.
Step (5) After initializing the network parameters using the adaptive cuckoo algorithm, on this basis, reverse adjustment and optimization is used to train the neural network parameter weights. CPPS data injection attacks are detected, and the operation and maintenance personnel will take corresponding actions based on the detection results.
Case Studies
The ICS data set is used as a test of the CPPS cyber-attacks detection system in this paper. The ICS data set is the analog CPPS data provided by Mississippi State University (Adhikari et al., 2016). The three-bus and two-wire transmission system used in the data set is modified from IEEE three machines and nine nodes. The system frame configuration is shown in Figure 2. Various intelligent electronic devices interact, supplemented by network monitoring equipment such as the SNORT and Syslog systems. G1 and G2 are generators, and PDC refers to the phasor data concentrator, which is responsible for storing and displaying synchronized data and recording historical data of the system. R1 to R4 are intelligent electronic devices (IEDs) that can open or close the circuit breakers (BR1 to BR4), and each IED corresponds to a circuit breaker. The IED is used with a distance protection scheme, which makes the circuit breaker trip automatically when a fault is detected, but it cannot be verified whether it is caused by an actual fault or an information attack. At the same time, the operation and maintenance personnel can also manually issue commands to the IED to trip the circuit breakers BR1 to BR4 during line maintenance.
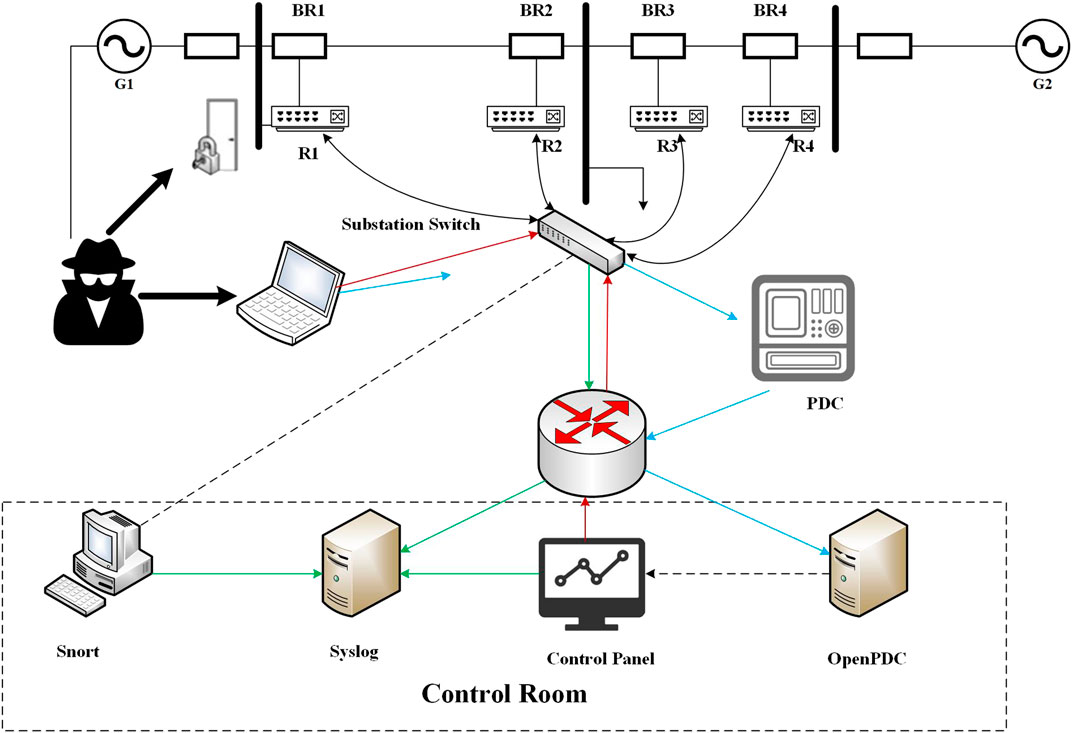
FIGURE 2. ICS structure.
There are 15 sets of data in the ICS data set, each of which contains about 5000 pieces of information, divided into training set and test set according to the ratio of 8: 2. The measurement data mainly includes PMU, snort log information, control panel, and relay records, etc. It mainly includes six scene types:
(1) Normal: the power system is operating normally and no abnormality occurs.
(2) Short-circuit fault: a short-circuit fault occurs on the line, and the fault may occur in different positions of the line.
(3) Line maintenance: operation and maintenance personnel manually issue a trip command, and usually disable one or more IEDs.
(4) Remote trip command injection attack: command injection attack on single relay (R1-R4) or double relay (R1 and R2, R3 and R4), and send a trip command to the IED.
(5) Relay setting change attack: by disabling the function of IED R1/R2/R3/R4, it cannot be tripped due to faults or commands, causing faults at different locations on the transmission line.
(6) Data injection attack: simulate this situation by modifying the values of parameters such as voltage, current, and sequence components, resulting in different positions of L1 or L2 (10%–19%, 20%–79%, 80%–90%) A failure occurs.
The proportions of data in the six scenarios are 1: 3: 1: 2: 9: 2, which are divided into 37 event types (not including 31–34) according to the location where the fault occurs. The details are shown in Table 1.
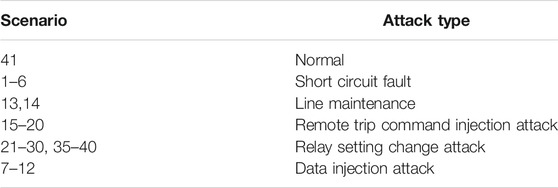
TABLE 1. Scene event description.
Evaluation Criteria
In the process of CPPS attack detection, evaluation indicators such as training time, test time, accuracy (AC), and precision (P) are used to measure the performance of the model. Where the definition of accuracy and precision are shown in Eqs. (27)Eqs. (28).
Where TP (true positive) is the number of records that correctly identify the normal situation, TN (true negative) is the number of records that correctly identify the attack, FP (false positive) is the number of records that incorrectly identify the normal situation, FN (false negative) is the number of records that incorrectly identify the attack, training time is represented by Ttrain, and test time is represented by Ttest.
Simulation Environment
This simulation is carried out in an Intel CPU 2.29 GHz, 128G memory, 64-bit hardware environment and Windows 10 workstation environment, and is implemented using the Python language and TensorFlow framework. Some initial parameter settings of SAE are shown in Table 2.
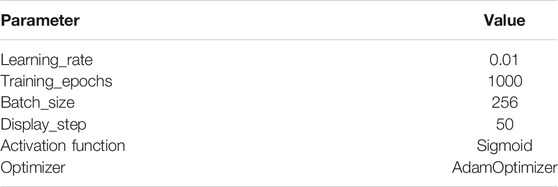
TABLE 2. SAE parameters.
Case Analysis
In order to verify the effectiveness of the proposed method of the FDIA detection in the CPPS, this paper designs two cases:
Case 1: The influence of different network parameters is analyzed on the accuracy of the case.
The key factors such as SACS initialization parameters, the detection effectiveness of the selected optimal gene feature set, and the number of hidden layers of the gene extraction network are discussed. Under the condition of other parameters remaining unchanged, a certain parameter is analyzed.
Case 2: The machine learning algorithm and the SACS-SAE detection method are analyzed for differences in detection accuracy and detection speed. KNN, SVM, random forest, decision tree, XGBOOST and other algorithms, and the SACS-SAE detection method proposed in this paper are used for comparative analysis.
The data is divided into 15 groups. For each group of data, it is divided into a training set and a test set at a ratio of 9: 1. At the same time, a 10-fold cross-validation method is used to optimize the model parameters as much as possible. The simulation is carried out on each data set, and then the detection accuracy of the 15 sets of data is averaged as the final result.
(1) Influence analysis of model parameters
(1) The influence of parameter initialization on detection results
The number of hidden layers of the gene extraction network is set to 3, and all feature parameters are used for training to analyze the degree of influence of different initialization parameters on the model. The result is shown in Figure 3.
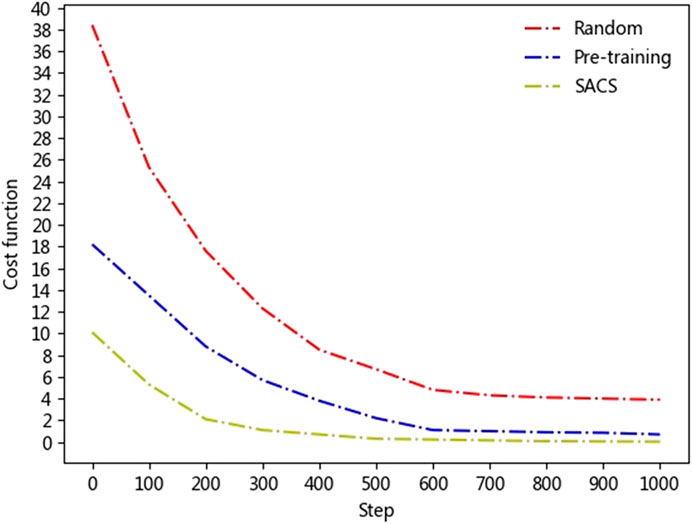
FIGURE 3. Comparison of different initialization parameters.
The results show that the loss function and neural network convergence speed are better than the other two methods after SACS initialization parameters. The main reason is that the FDIA detection process is a non-convex optimization problem, and there are many local optimal solutions. At the same time, in the deep network BP algorithm optimization process, the error gradually decreases, and the problem of “gradient diffusion” is prone to occur. After pre-training initialization, the parameters can be initialized to a suitable place, but it is still difficult to achieve the global optimum. The initial parameters obtained by SACS have been fine-tuned to converge the training process to a more ideal state, and the model training speed has also been improved.
(2) The influence of optimal attack gene feature set selection on detection results
The maximum correlation minimum redundancy algorithm is improved to determine the cyber-physical optimal attack gene feature set, and the feature correlation ranking is shown in Figure 4.
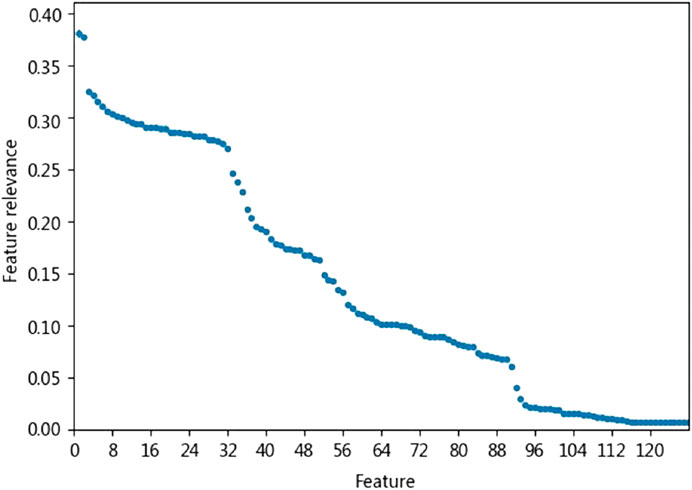
FIGURE 4. Attack gene feature correlation ranking.
In the process of selecting the optimal attack gene feature, about 75% of the 128 gene features can provide high learning value, and the two features with the highest correlation are R1 and R2’s A phase voltage phase angle, respectively. The features are selected according to the above content, and the optimal feature subset is determined to include 56 features such as A-C phase voltage, phase angle, phase current, and snort log information. In order to verify the effectiveness of this method, three different model structures are set up: Model 1 (the first 32 features in relevance ranking), Model 2 (the optimal feature selection is 56 features), and model 3 (the first 96 features in relevance ranking). The number of hidden layers of the network is set to 3, and the adaptive cuckoo algorithm is used to initialize the parameters. The analysis result is shown in Figure 5.
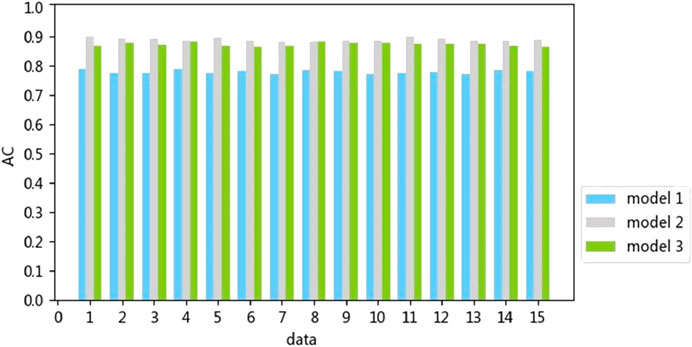
FIGURE 5. Comparison of different attack gene feature numbers.
The results show that the accuracy of the model trained with the first 32 gene features is significantly lower than the other two models. The reason is that there are relatively few selected features and some effective information is missing. The accuracy of Model two is slightly higher than Model 3, and its training time is shorter than Model 3. The reason is that Model 3 has a large gene feature dimension, and there are some redundant features and weakly related features. The model is affected by these features to a certain degree, which increases the complexity of the model training process, resulting in a slight decrease in recognition accuracy. When the optimal attack gene feature set proposed in this paper is selected, a relatively balanced state can be achieved between the model detection accuracy and the training time. At the same time, the optimal cyber-physical attack gene feature selection method proposed in this paper has been verified not only to improve the accuracy of model detection, but also to accelerate the effectiveness of model training.
(1) The influence of the number of hidden layers of gene extraction on the detection result
The number of hidden layers of the network in deep learning is critical to the abstract gene extraction results. On the premise that the initialization parameters and the optimal gene feature set are determined, five different hidden layer experiments are set up. The most suitable one is selected as the depth of the gene extraction network for the FDIA detection model. The comparative analysis result is shown in Figure 6.
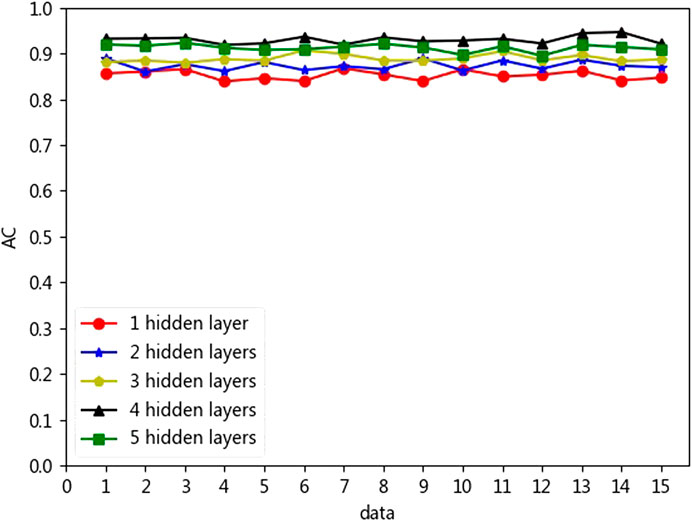
FIGURE 6. Detection results with different hidden layers of attack gene extraction.
As shown in Figure 7, the training time increases greatly as the number of hidden layers increases, while the test time is maintained at about 1 s to complete. As the number of hidden layers increases, the hidden abstract genes in the data are deeply extracted, but at the same time, the training time in the deep learning model increases significantly, which can easily lead to overfitting. When the detection model is set with four hidden layers, the accuracy rate is the largest, and the average accuracy rate reaches 93.7%.
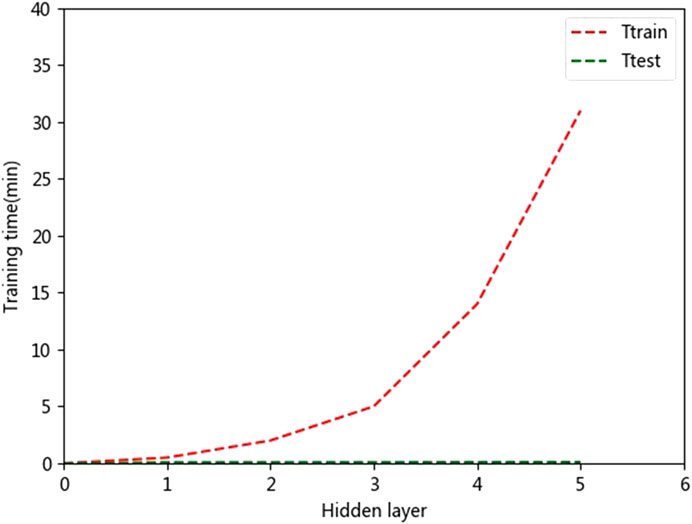
FIGURE 7. Model training time with different hidden layers of gene extraction.
(2) Comparison and analysis with traditional detection methods
Six detection methods including KNN, SVM, random forest, decision tree, XGBOOST, and SACS-SAE are selected for comparative analysis. For other algorithms, the optimal results are selected for comparison after multiple parameter adjustments. As shown in Figure 8, the results show that in terms of accuracy, the SACS-SAE detection method with four hidden layers has better performance than the other traditional machine learning methods. The reason is that the stack auto-encoding network has a strong expression ability, combined with the global optimization ability of the SACS. The recognition accuracy has been significantly improved compared with other algorithms.
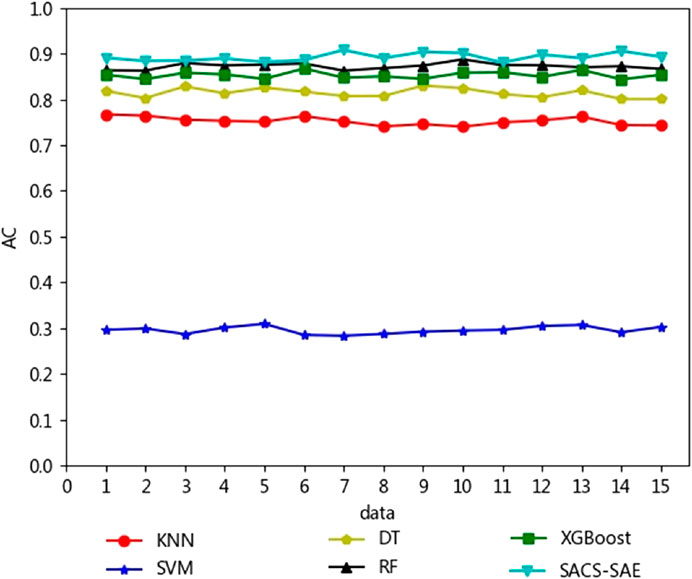
FIGURE 8. Detection results with different detection methods.
As shown in Figure 9, after the algorithm with the maximum information coefficient is improved for genetic feature selection, the recognition accuracy and training time are better than the original feature selection to a certain extent, which proves the effectiveness and universality of the method. However, in terms of training model time, the KNN algorithm has the fastest training speed, and the detection model proposed in this paper has a relatively large number of hidden layers and a complex network, and the model training speed is relatively slow. The results of AC, P, Ttrain, and Ttest of the attack detection algorithm before and after gene feature selection are shown in Table 3.
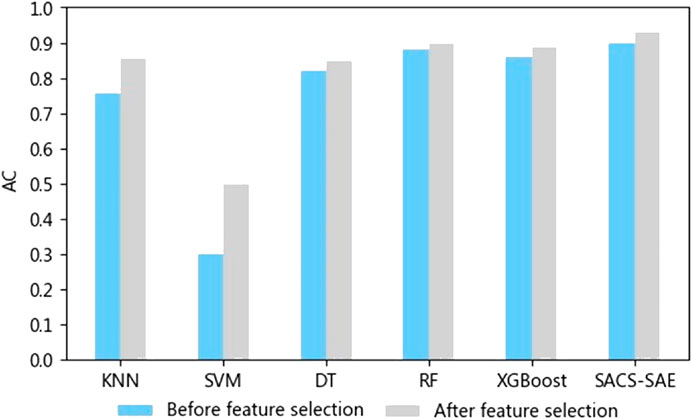
FIGURE 9. The influence of attack gene feature selection with different methods.
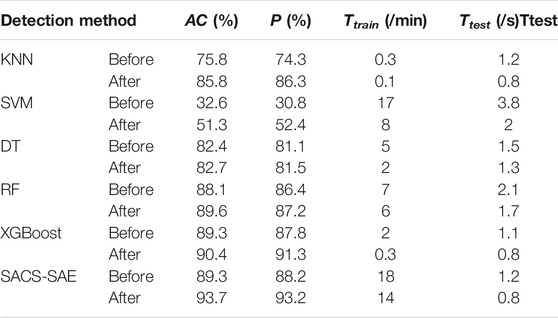
TABLE 3. Comparison of performance with different models.
Conclusion
From a data-driven perspective, a bio-inspired concept of genes is introduced to provide a new idea for the detection of FDIAs in the CPPS.
(1) The maximum information coefficient is used to analyze the correlation and redundancy in the features to determine the optimal attack gene feature set. The analysis of case studies shows that the selection of gene features will affect the results of attack detection. The attack gene feature selection method in this paper achieves a good balance in terms of detection accuracy and training time.
(2) A stack auto-encoding network is constructed for the abstract extraction of genes, and a method for detecting FDIAs based on SACS-SAE is proposed. The analysis of case studies shows that the proposed method is suitable for CPPS attack detection in high-dimensional space, and the detection accuracy and precision rate are both over 90%, and the identification accuracy is better than traditional methods. The amount of hidden layers is not as high as it could be. In the attack identification process, a suitable number of hidden layers needs to be selected.
(3) The loss function and the training convergence speed perform better after SACS initialization parameters.
However, the structure of the deep network model is complex and the model training time is long. In order to speed up the model training process, the dynamic optimization method of the learning rate and other parameters in the training process will be considered in future work.
Data Availability Statement
The original contributions presented in the study are included in the article/Supplementary Material, further inquiries can be directed to the corresponding author.
Author Contributions
ZQ: data curation, writing and software. YD: supervision, writing, reviewing and editing. NQ: conceptualization and methodology. HL: project administration. MC: software and formal analysis. XB: reviewing and editing. YW: validation and editing. SM: software and editing. All the co-authors reviewed and contributed to the revision of the manuscript
Funding
This work is supported by the State Key Program of National Natural Science Foundation of China (No. 51437003), the Science and Technology Development Plan of Jilin Province (No. 20200401097GX), and the Science and Technology Development Plan of Jilin Province (No. 20180201092GX).
Conflict of Interest
NQ was employed by the company State Grid Jiangsu Electric Power Company Limited, China. HL was employed by the company State Grid Jilin Electric Power Company Limited, China. MC was employed by the company State Grid Inner Mongolia Eastern Electric Power Company Limited, China. YW was employed by the company Zhejiang Windey Company Limited, China.
The remaining authors declare that the research was conducted in the absence of any commercial or financial relationships that could be construed as a potential conflict of interest.
References
Adhikari, U., Morris, T. H., and Pan, S. (2017). Applying hoeffding adaptive trees for real-time cyber-power event and intrusion classification. IEEE Trans. Smart Grid 9 (5), 4049–4060. doi:10.1109/TSG.2017.2647778
Adhikari, U., Morris, T. H., and Pan, S. (2016). Applying non-nested generalized exemplars classification for cyber-power event and intrusion detection. IEEE Trans. Smart Grid 9 (5), 3928–3941. doi:10.1109/TSG.2016.2642787
Chitara, D., Niazi, K. R., Swarnkar, A., and Gupta, N. (2018). Cuckoo search optimization algorithm for designing of a multimachine power system stabilizer. IEEE Trans. Ind. Applicat. 54 (4), 3056–3065. doi:10.1109/tia.2018.2811725
Dai, J., Li, Y., He, K., and Sun, J. (2016). R-fcn: Object detection via region-based fully convolutional networks. Pro. NIPS. arXiv preprint. arXiv:1605.06409, 379–387.
Gao, L., Chen, B., and Yu, L. (2019). Fusion-based FDI attack detection in cyber-physical systems. IEEE Trans. Circuits syst. II: express briefs 67 (8), 1487–1491. doi:10.1109/TCSII.2019.2939276
Hagai, T., Chen, X., Miragaia, R. J., Rostom, R., Gomes, T., Kunowska, N., et al. (2018). Gene expression variability across cells and species shapes innate immunity. Nature 563 (7730), 197–202. doi:10.1038/s41586-018-0657-2
He, R., Xie, H., Deng, J., Feng, T., Lai, L. L., and Shahidehpour, M. (2020). Reliability modeling and assessment of cyber space in cyber-physical power systems. IEEE Trans. Smart Grid 11, 3763–3773. doi:10.1109/TSG.2020.2982566
Law, R., Li, G., Fong, D. K. C., and Han, X. (2019). Tourism demand forecasting: a deep learning approach. Ann. Tourism Res. 75, 410–423. doi:10.1016/j.annals.2019.01.014
Li, Y., and Zeng, J. (2019). Improved convolutional neural network based detection method for false data injection attack on power grid. Automation Electric Power Syst. 43 (20), 97–104. doi:10.7500/AEPS20180919001
Li, Y., Li, Z., and Chen, L. (2019). Dynamic state estimation of generators under cyber attacks. IEEE Access 7, 125253–125267. doi:10.1109/access.2019.2939055
Li, Y., Wang, C., Li, G., Wang, J., Zhao, D., and Chen, C. (2020). Improving operational flexibility of integrated energy system with uncertain renewable generations considering thermal inertia of buildings. Energ. Convers. Management 207, 112526. doi:10.1016/j.enconman.2020.112526
Li, Y., Yang, Z., Li, G., Zhao, D., and Tian, W. (2018). Optimal scheduling of an isolated microgrid with battery storage considering load and renewable generation uncertainties. IEEE Trans. Ind. Electronics 66 (2), 1565–1575. doi:10.1109/TIE.2018.2840498
Liang, G., Zhao, J., Luo, F., Weller, S. R., and Dong, Z. Y. (2016). A review of false data injection attacks against modern power systems. IEEE Trans. Smart Grid 8 (4), 1630–1638. doi:10.1109/TSG.2015.2495133
Liu, X., Bao, Z., Lu, D., and Li, Z. (2015). Modeling of local false data injection attacks with reduced network information. IEEE Trans. Smart Grid 6 (4), 1686–1696. doi:10.1109/tsg.2015.2394358
Liu, Y., Ning, P., and Reiter, M. K. (2011). False data injection attacks against state estimation in electric power grids. ACM Trans. Inf. Syst. Secur. 14 (1), 1–33. doi:10.1145/1952982.1952995
Pan, S., Morris, T., and Adhikari, U. (2015). Classification of disturbances and cyber-attacks in power systems using heterogeneous time-synchronized data. IEEE Trans. Ind. Inf. 11 (3), 650–662. doi:10.1109/tii.2015.2420951
Qu, Z., Dong, Y., Liu, S., Shen, Z., Yu, J., and Li, Y. (2020). Bioimmunological method based security technology of ubiquitous power internet of things. Automation Electric Power Syst. 44 (2), 1–12. doi:10.19718/j.issn.1005-2992.2019-03-0038-06
Qu, Z., Dong, Y., Qu, N., Wang, L., Li, Y., Zhang, Y., et al. (2019). Survivability evaluation method for cascading failure of electric cyber physical system considering load optimal allocation. Math. Probl. Eng. 2019, 1–15. doi:10.1155/2019/2817586
Qu, Z., Zhang, Y., Qu, N., Wang, L., Li, Y., and Dong, Y. (2018). Method for quantitative estimation of the risk propagation threshold in electric power CPS based on seepage probability. IEEE Access 6, 68813–68823. doi:10.1109/access.2018.2879488
Wang, D., Wang, X., Zhang, Y., and Jin, L. (2019). Detection of power grid disturbances and cyber-attacks based on machine learning. J. Inf. Security Appl. 46, 42–52. doi:10.1016/j.jisa.2019.02.008
Xing, X., Sun, Q., Zhang, P., and Li, M. (2019). Research on distribution network fault recovery and reconstruction based on deep-first search and colony algorithms. J. Northeast Electric Power Univ. 39 (3), 38–43. doi:10.19718/j.issn.1005-2992.2019-03-0038-06
Xu, L., Guo, Q., Yang, T., and Sun, H. (2018). Robust routing optimization for smart grids considering cyber-physical interdependence. IEEE Trans. Smart Grid 10 (5), 5620–5629. doi:10.1109/TSG.2018.2888629
Yang, F., Xu, Y., Qian, Y., Li, Z., Sheng, G., and Jiang, X. (2018). Application of correlation analysis techniques in feature extraction and selection for DC partial discharge signals of XLPE cables. Power Syst. Technol. 42 (5), 1653–1660. doi:10.13335/j.1000-3673.pst.2017.1866
Yang, M., Wang, J., and Du, J. (2019). The complement of the missing data based on the extreme learning machine and granger test in wind power. J. Northeast Electric Power Univ. 39 (5), 9–16. doi:10.19718/j.issn.1005-2992.2019-05-0009-08
Keywords: cyber-physical power system (CPPS), false data injection attacks (FDIAs), cyber-physical attack genes, stacked autoencoder network, cuckoo search algorithm (CS), attack detection
Citation: Qu Z, Dong Y, Qu N, Li H, Cui M, Bo X, Wu Y and Mugemanyi S (2021) False Data Injection Attack Detection in Power Systems Based on Cyber-Physical Attack Genes. Front. Energy Res. 9:644489. doi: 10.3389/fenrg.2021.644489
Received: 21 December 2020; Accepted: 01 February 2021;
Published: 17 March 2021.
Edited by:
Liang Chen, Nanjing University of Information Science and Technology, ChinaReviewed by:
Jun Yin, North China University of Water Conservancy and Electric Power, ChinaShaoyan Li, North China Electric Power University, China
Copyright © 2021 Qu, Dong, Qu, Li, Cui, Bo, Wu and Mugemanyi. This is an open-access article distributed under the terms of the Creative Commons Attribution License (CC BY). The use, distribution or reproduction in other forums is permitted, provided the original author(s) and the copyright owner(s) are credited and that the original publication in this journal is cited, in accordance with accepted academic practice. No use, distribution or reproduction is permitted which does not comply with these terms.
*Correspondence: Yunchang Dong, NTk1MjQ1NzAwQHFxLmNvbQ==