 Qinhao Xing
 Meng Cheng
 Shuran Liu
 Qianliang Xiang
- Department of Power Consulting in Smart Grids and Digitalization, ABB Investment (China) Ltd., Beijing, China
The intermittency of wind and solar power generation brings risks to the safety and stability of the power system. In order to maximize the utilization of renewables, optimal control and dispatch methods of the Distributed Energy Resources including the generators, energy storage and flexible demand are necessary to be researched. This paper proposes an optimization and dispatch model of an aggregation of Distributed Energy Resources in order to facilitate the integration of renewables while considering the benefits for dispatchable resources under time-of-use tariff. The model achieves multi-objective optimization based on the constraints of day-ahead demand forecast, wind and solar generation forecast, electric vehicles charging routines, energy storage and DC power flow. The operating cost, the renewable energy utilization and the revenues of storages and electric vehicles are considered and optimized simultaneously through the min–max unification method to achieve the multi-objective optimization. The proposed model was then applied to a modified IEEE-30 bus case, demonstrating that the model is able to reconcile all participants in the system. Sensitivity analysis was undertaken to study the impact of initial states of the storages on the revenues to the resource owners.
Introduction
The continuous climate change is expediting the energy reform worldwide in order to develop a greener and sustainable future. In the power sector, the installation capacity of renewables, e.g. solar and wind, has been increased dramatically. According to the Renewables 2020 by IEA, 90% of the newly increased generation resources are renewable energy in 2020. The net increase of renewable generation capacity was predicted to be 7% in 2021 as historical high (IEA, 2020). China, as the second largest economy in the world, has announced the “China carbon-neutral Target” recently. By 2030, the non-fossil fuel resource will reach 25%. This indicates great market for renewables, i.e., the solar and wind generation reach 1200 GW by 2030 and hence approximately 75 GW new installation per year. By 2060, the carbon-neutral target will be reached.
However, the generation output from wind and solar relies on natural resources availability, which are usually intermittent and uncontrollable. Moreover, the substitution of fuel generation plants with renewable resources plants will threaten the power system transient stability by curtailing system inertia, since the renewable resources plants are electrically isolated from grid (Seneviratne and Ozansoy, 2016). With the foreseeable high integration of renewables, two main challenges remain to be solved in order to operate the power system securely and efficiently. One is to enhance the utilization of renewable output, and the other is to maintain the system stability as a result of the uncontrollable generation output. It can be seen that the power system requires sufficient reserve with fast response to mitigate the impact of high renewable penetration.
Traditional power systems provide a unidirectional energy flow from generation to consumption as showed in Figure 1. Generation adjusts the power outputs in accordance to the variations of consumption, and in the meantime provides ancillary service to maintain the power system balance. Following the increasing integration of renewables, the replacement of conventional fossil-fuel generation reduces the available reserve capacity to flexibly adjust the generation output. The integration of renewables at the distribution level changes the power flow from unidirectional to bidirectional. The operation of power system is hence more complex to maintain the balance between generation and consumption.
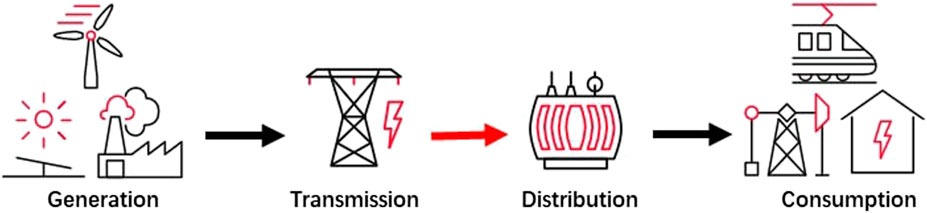
FIGURE 1. Schematic diagram of the traditional power system.
In order to maintain the balance between generation and consumption, other mechanisms have been proposed in addition to the flexible regulation of conventional generators.
Energy storage is considered as a flexible and high-efficient dispatchable resource to maintain the power balance and hence improve the system security and reliability. The flexible charging and discharging of storage will counteract the instability of renewable generation, and in the meantime improve the renewable utilization. Castillo and Gayme (2014) listed the various ancillary services the energy storage is able to offer within economic-effective system penetrated by non-dispatchable renewable energy resources based on the definition of “grid-scale energy storage”. Su and Abbas El Gamal (2013) modeled the exact power imbalance gap caused by wind power intermittent output, leading to a specific value of energy storage capacity needed to cover the imbalance through stochastic control. Wang et al., 2013 aggregated the battery energy storage and super-capacitor to stabilize the solar power output variations. Previous research study verified the necessity and feasibility to apply the energy storage with renewable integration.
In addition, flexible regulation of power consumption from the demand is also considered as an alternative option to maintain the power balance. One of the flexible demand regulation solutions is demand response (DR), which achieves customers shifting power usage following dispatch needs. Typical types of DR include industrial production lines (Alkadi et al., 2013) and temperature-controlled demand (Zhang et al., 2013).
Following the decarbonization in the transport sector, the Electric Vehicles (EVs) have been largely deployed and considered as a flexible demand as the power consumption of charging of an EV can be adjusted according to power system conditions.
Except for the technical feasibility evaluation, the business model of renewable generation, storage and flexible demand has also drawn attentions by researches. The economic dispatch at present always packaged or collaborated the storage and renewable generation when they used identical grid port and achieved the comprehensive revenue maximum. Chen and Zhao (2020) treated the storage-wind power integration as a single market participant, and the objective function included the profit of the integration to reach a maximum. Li et al., 2015 modeled different scenarios to compare the case of storage and wind power generation as one entity in the electricity market with the case of running storage and wind power generation independently. The results showed that the integrated case held a remarkable profit increase. Ge et al., 2020 established a solar power generation-storage cooperative game model. The offer-bid actions for the solar and storage to participate in electricity market were simulated. Yuan et al., 2016 proposed an economic dispatch model of virtual power plant consisting of wind and solar generation, gas and storage. The conclusion turned out that the storage is able to reduce the generation cost and improve the renewables utilization.
Likewise, DR encourages the end-users to curtail load during peak load period in response to financial incentives. PJM divided DR into Emergency Response and Economic Response based on dispatch needs and response capability, and accordingly provides different levels of compensation. DR resources are allowed to bid and compete with power market to achieve economic dispatch results (PJM INT, 2020). Similarly, the vehicle-to-grid technology (V2G) allows EV to adjust behaviors under electricity market circumstance for revenues. Ma et al., 2012 built the model of EV benefit, showing that the EV had minor impact to power system with significant profit gained. Ansari et al. (2015) introduced a bidding strategy of EV in ancillary service market based on the autoregressive integrated moving average model, which fully considered the uncertainties of market environment.
Considering the optimal dispatch of the energy storage and flexible demand, the future power system will be a system of friendly interaction among the generation source, load and energy storage, as present in Figure 2 and named as an Integrated Energy System (IES). Through the continuous improvement in the electricity market mechanism and the digital technologies, most of the IESs are operated by aggregators, who host multiple types of generations and flexible resources, supplying power for the load within regions, and seeking for the profit maximum. Under the energy dispatch of aggregators, the energy internet will be formulated which enables the generation, load and energy storage to participate in the energy trading and system operation to improve the utilization level of renewables efficiently and economically.
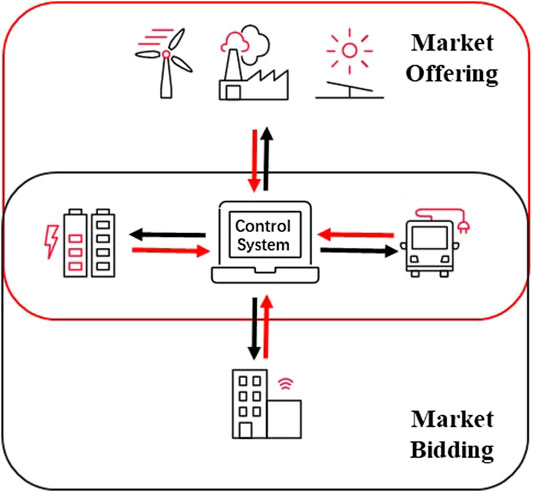
FIGURE 2. Basic formation of integrated energy system.
According to the literature review, a number of the studies have presented the technical feasibility of flexible resources coupling with PV or wind turbine for renewable energy utilization. There are also studies on the trading strategies based on system forecasting within electricity markets. However, most of the studies were focusing on the simple cooperation between one type of flexible resource with the conventional energy system. The interactions and dispatch of multiple energy resources under the regional energy aggregator have hardly been discussed in depth. Based on the discussion above, this paper established a coordinated optimal day-ahead dispatch model for regional IES based on the time-of-use (TOU) tariff considering the participation for the energy aggregator, energy resource owners, and the power flow distribution in grid. The model contains the distributed generators, storages and EVs. A multi-objective mixed-integer linear programming (MILP) problem was formulated considering the maximization of the whole system profit, maximization of renewable energy outputs and the maximization on revenues of storage/EVs’ simultaneously based on the optimal method. Case studies on a modified IEEE 30-bus system were undertaken to verify the benefits of the proposed optimal dispatch method.
Typical Dispatch Resources for Optimization
The dispatchable resources of the IES in the model are depicted as follows.
(1) Thermal generation: As the main supplier of electricity, the thermal power output can be flexibly adjusted in order to achieve supply-demand balance of power in real time. Thermal generation plays an essential role for the stability and safety of power system.
(2) Wind generation: Wind power output is related to wind speed, thus presents significant volatility and uncertainty. In the meanwhile, the typical output curve usually shows an inverse-peak characteristic. As a result, storage devices are usually needed to mitigate the output variations of wind generation.
(3) Photovoltaic power stations: PVs typically operate and generate power output during daytime and reach the peak at midday. The operational cost of PVs is relatively low, compared with the fixed cost of PV equipment.
(4) Storage device: As the flexible dispatching device, energy storage plays an important role in the utilization of renewables, which supports to maintain the safety and efficient operation of power system. Energy storage devices can not only absorb the redundant power, but also play the role of reserve power during the peak period and achieve the load shifting of the power system.
(5) Load: Load is the consumer of electricity. Typical load curves reach a peak during midday and a valley in the evening. Various kinds of load show different external characteristic curves. Power system operations need to forecast the load variations, allowing the generation schedule to meet the load power requirements.
(6) Electric vehicles: Electric vehicles (EVs) can be treated as a special load, and the charging load behaviors are usually hard to predict in long time scale. Meanwhile, EVs can also be treated as energy storage device following the development of V2G technology. Incentive signals such as real-time price may encourage EV users to discharge during peak period in the daytime and charge during the valley load period at night. EVs will play an important role in terms of load shifting and improving system operating efficiency in the future.
Formulation of the Optimal Dispatch Model
Based on the operational constraints and distributed energy equipment mentioned above, this paper establishes an optimal day-ahead dispatch model and formed a MILP problem considering multiple objectives, including maximizing the total system profits, storage and EV profits, and renewable utilization level. The details of the optimization model are formulated as follows.
Objective Functions
Objective 1: Maximize the Profit of the Entire System
The total system profit is the interest of the aggregator, equal to the difference between revenue from load and energy cost. The revenue consists of the payment from load consumption and storage/EV electricity charge. The cost consists of the marginal costs, operating costs, start-up costs of thermal generators (Liu and Du, 2018), the levelized cost of electricity (LCOE) for wind turbines and PVs, and the cost of electricity sold to the system from storage and EVs. The expression of objective 1 is as follows.
where T is the total dispatch horizon, equal to 24. D represents the number of load buses. ES and E denote the number of storage devices and EVs respectively.
Objective 2: Maximize the Profit of Storage/EV Owners
In order to encourage the storage/EV owners to integrate the dispatch of energy, the profit of storage/EV owners is considered to be one of the objective functions during dispatch.
Objective 3: Maximize the Generation Output From Renewables
Considering the popularity of clean energy consumption, the generation output from renewable resources owners is considered to be one of the objective functions during dispatch.
Constraints
System Constraints
Constraint 1: Power Balance
The real-time total power generation is required to meet the power consumption of demand.
Constraint 2: Line Flow Capacity Limit
Line flow capacity refers to the allowable maximum power flow for a branch, which is decided by the power losses, wire temperature and system stability.
For clarification, the transmission line in this paper is modeled as a classical direct current (DC) power flow model (Stott et al., 2009). Thus the line voltage P.U. value is considered as 1, and the line flow capacity limit is considered a fixed constant value. The details of the approximations is briefly explained in the Appendix.
Thermal Power Unit Constraints
Thermal power unit constraints include maximum/minimum output level constraints in Eqs. 6 and 7, ramping up/down constraints in Eqs. 9, minimum on/off time constraints in Eqs. 10 and 11, and start-up cost constraint in Eq. 12. Constraints (13)–(17) represent the thermal unit commitment status and the coupling relationships.
Wind Generation Constraints
Wind generation constraints include the maximum/minimum output constraints in (18), (19).
PV Constraints
PV constraints include the maximum/minimum output constraints in (20)(21).
Storage Constraints
Storage constraints include the state of charge (SoC) constraints in (22), charge/discharge power constraints in (23)(24), charge/discharge efficiency in (25), and the cyclic balance constraint in (26), which requires the SoC of energy storage to return to the initial status in the final interval.
EV Constraints
For computational convenience, the optimization model assumes that EVs can participate in the dispatch throughout the whole 24 h horizon, and the battery material features of all EVs are same. The model considers the EVs as clusters based on geographical locations of EV charging stations. The constraints on EVs include the state of charge (SoC) constraints of EV clusters in (27), charging/discharging power limits in (28)(29), the efficiency constraints on charging and discharging in (30), the constraints that simulate the driving habits of EV users in (31)(32), and the cyclic balance constraint in (33), which requires the SoC of EV cluster to return to the initial status in the final interval. In order to meet the travel demand of EV users, EVs is pre-set to guarantee more than 80 and 60% of battery charge at 7am and 16pm in this paper.
Formulation of the Multi-Objective Problem
Many researches have been applying multi-objective optimization problem (MOP) as IES solution approaches. An elaborate literature review of MOP researches is present in Jing et al., 2019, which listed and summarized previous studies by objective considerations, modeling types, decision-making methods, and solving engines. The top 2 popular MOP solving methods are still genetic algorithm and weighted-sum algorithm. A figure of statistical results on occurrence frequency of MOP solving strategies and decision-making approaches, pointing out that most of the existing researches have been only focusing on problem modeling and algorithm formulation, while ignoring the decision-making discussion. Among the papers that have considered decision-making process, the most frequent method is still subjective decision-making.
This paper considers a weighed-sum algorithm in MOP with subjective decision-making on the weighing factors. The min–max unification on the objectives is applied to transfer the multi-objective problem to a single objective problem. It is necessary to standardize each objective function which neglect the magnitude differences of each objective function so that the weighting factors can be defined.
The min–max unification process is given below.
Minimum objective unification:
Maximum objective unification:
The reformulated problem with weight coefficient method is:
Solution Approach
The flow chart in Figure 3 depicts the proposed multi-objective optimization model and the solution process. Major steps of this method are summarized as follows.
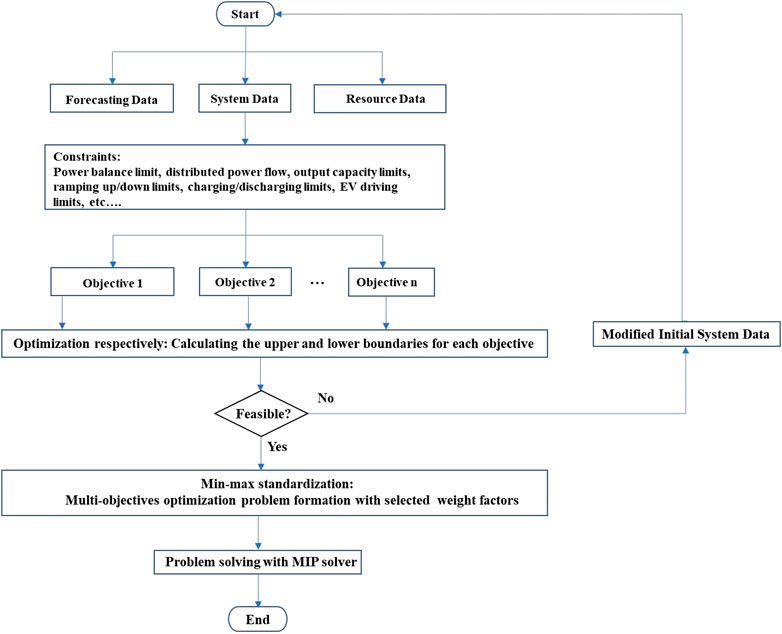
FIGURE 3. Flowchart of the proposed multi-objective optimization model and the solution process.
Step 1: Input data of forecasting values, system data and resources parameters. The forecasting values include the forecasting wind power output, forecasting solar power output, and forecasting demand power output. The system data includes the network topology and line flow capacity limits. The resources parameters include the capacity limits, ramping limits, start-up costs, marginal costs, operational costs, and minimum on/off time requirements of thermal units. The capacity limits and LCOE for wind turbines and PVs, the state of charge capacity limits and charging/discharging power limits on energy storages and EVs are also the input data.
Step 2: Set system constraints including the power balance constraint, power flow limit constraints, maximum output capacity limits and ramping up/down limits for thermal units, wind generators and PVs, maximum capacity limits, charging/discharging limits and charging/discharging efficiency limits for energy storages and EVs, and EV driving habit limits.
Step 3: Solve each single-objective problem and calculate the upper and lower boundaries for all objective values. If the one or more optimization problems are infeasible, the input data needs to be modified and the whole process starts again.
Step 4: Combine the single objective problems using the min–max uniformization to formulate the one multi-objective problem with the pre-set weighting factors.
Step 5: The multi-objective problem is solved with the mix-integer programming solver.
Case Study
Case Overview
The case study was undertaken based on a modified standard IEEE-30 bus case, including 2 thermal generators, 2 PVs, 2 wind generators, 2 storage devices, and 4 EV clusters. The dispatch horizon span is 24 h, with each time interval of 1 h. The parameters of thermal generators and renewables are shown in Table 1. The parameters of storage devices and EVs are displayed in Table 2. Figure 4 presents the system information of the modified IEEE-30 bus case. Figure 5 shows the forecast of wind power, solar power and the load curve.
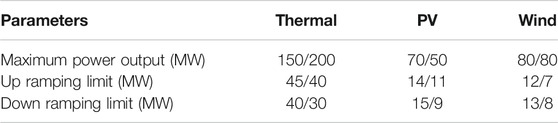
TABLE 1. Parameters of thermal generators and renewables.
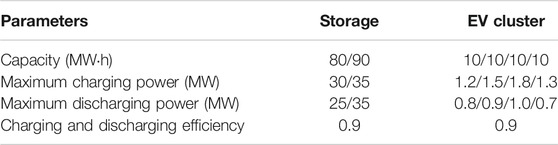
TABLE 2. Parameters of storage and EV.
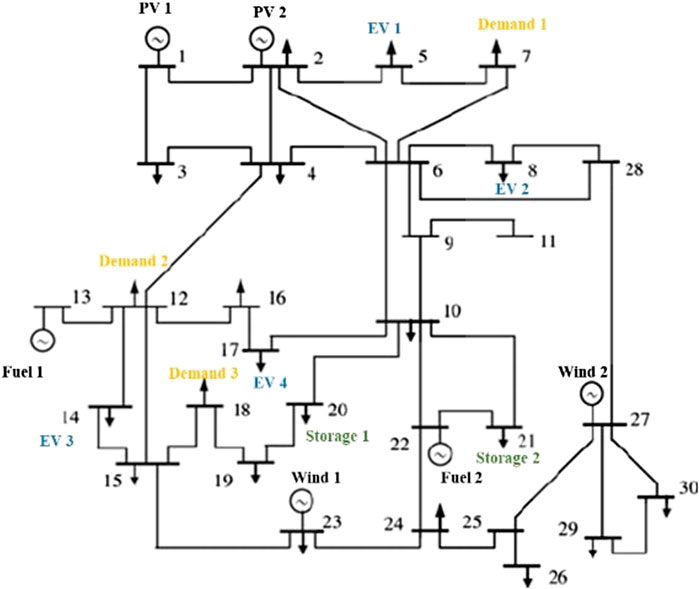
FIGURE 4. Modified IEEE-30 bus system.
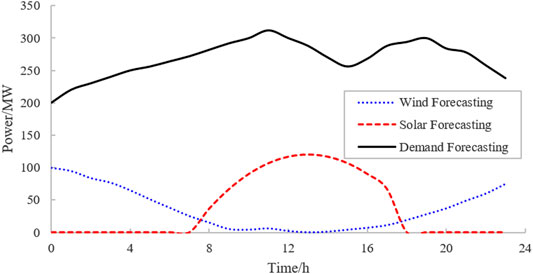
FIGURE 5. Forecast Variation of Renewable Power and load level.
The MILP optimization problem contains 1,056 variables, including 144 binary variables. All algorithms are implemented in Yalmip based on MATLAB. The problem solved with CPLEX 20.1. The MILP gap is set as 0.1%.
The marginal generation costs on fuel generators, the levelized cost of electricity for wind turbines and PVs, utilization payment rates and storage/EV selling rate are present in Table 3. The levelized cost of electricity for wind power and solar power are based on the price from National Development and Reform Commission in China (National Development and Reform Commission., 2019; National Development and Reform Commission., 2020), and the marginal cost for fuel generation is the procurement price of fuel generation (National Energy Administration., 2018). While the production cost of wind and solar power is close to zero, the levelized cost of electricity for wind and solar power represents the average net present cost over equipment life time circle and tends to be raised to cover the fixed investments (e.g. equipment investment, installation fees, labor cost).

TABLE 3. Generation marginal cost.
The utilization payment rate follows the industrial TOU tariff, showing in Table 4. It is assumed that the storage/EV can sell power to the system with 0.8 times of the tariff.

TABLE 4. Electricity price and storage/EV Selling Rate with TOU Tariff.
Results and Analysis of Multi-Objective Optimization
As aforementioned, the optimization model is first standardized by solving three single-objective optimization problems to maximize system profit, maximize the profits of storage and EV owners, and maximize the output of renewables. The function values under different objectives optimized with mentioned constraints and data are shown in Table 5. The upper and lower bounds for the three single-objective optimization problems are
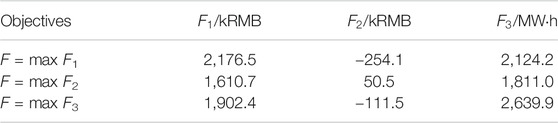
TABLE 5. Function values with different optimization objectives.
Table 5 shows that F1 and F3 are positively correlated, showing that maximizing system profit will increase the output of renewables as a result of the lower costs of renewables. F1 and F2 are negatively correlated, namely the strategy of maximizing grid profits will reduce the profits of storage devices and EVs, and vice versa. If the profit of storage devices and EVs owners takes the priority, the grid will first purchase power from storage devices and EVs instead of the cheaper thermal power units during peak hours. The profit of generators is hence decreased. Therefore, the single-objective optimization of F1 and F2 is incompatible.
The results shown in Table 4 are used as input parameters to solve the multi-objective optimization model which is a mixed-integer programming problem solved by CPLEX. The weighting factors are set as [ω1, ω2, ω3] = [0.3,0.3,0.4] for F1, F2, and F3, representing their importance in the objective function (35). The optimization result is shown in Table 6, demonstrating this multi-objective optimization method can fully take the factors of different subjects into account.
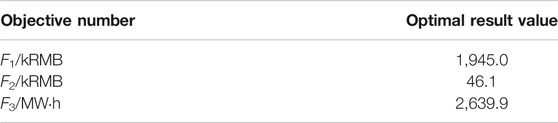
TABLE 6. Objective values under multi-objective optimization.
Figures 6 and 7 show the charging/discharging schedule obtained from the multi-objective optimization, which demonstrates the energy storage and EVs are quite active under the incentive of TOU tariff to gain much profits from charging/discharging behaviors. The TOU tariff is present as broken line, and the changing/discharging power is showed as bar.
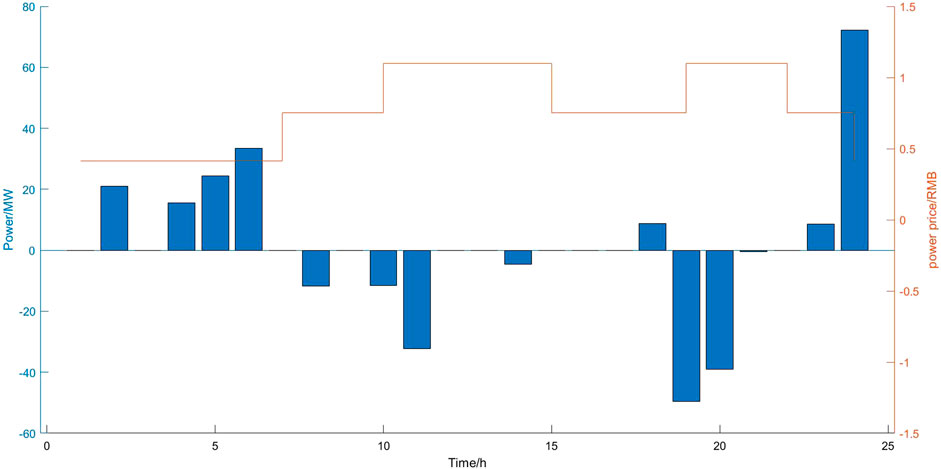
FIGURE 6. Charging and discharging of storage.
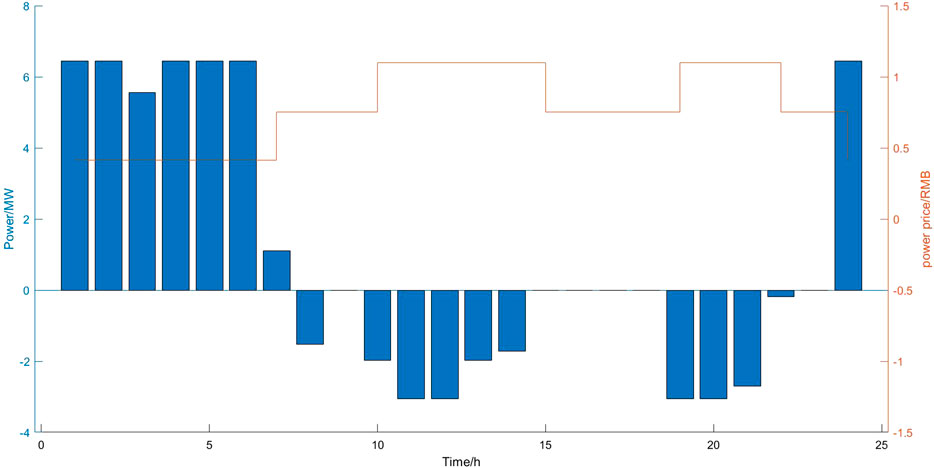
FIGURE 7. Charging and discharging of EV clusters.
Another two case studies were carried out to verify the benefits of the optimal dispatch with various dispatchable resources. The case settings are given below, where Scenario 3 is the identical case mentioned above.
Scenario 1: Thermal power units are included in the system, without renewables, storage devices, or EVs.
Scenario 2: The system includes thermal power units and renewables, without storage devices or EVs.
Scenario 3: Thermal power, renewables, storage and EVs are all included in the system.
The profits of power system and the owner of storage devices/EVs in each scenario are compared in Table 7. Considering scenarios 1 and 2, the cost of power supply dramatically decreases with the participation of renewables, which holds a comparative lower cost and leads to higher revenue. Scenarios 2 and 3 show that with the participation of storage devices and EVs, the profit of the power system slightly decreases. It is because a part of the profit of the power system is transferred to the owner of storage devices and EVs. Moreover, the total profit of the power system and storage/EV increases slightly.
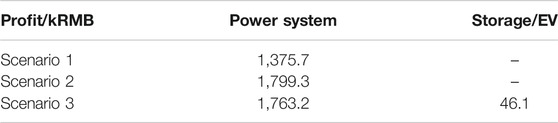
TABLE 7. Profits of grid and storage/EV under each scenario.
With the renewable generation penetrated in scenario 2 and 3, the storage/EV may stabilize the variation of renewable generation output, as well as a flatter output of fuel generation output. Figure 8 shows the overall output curves of thermal power units with and without storage device/EV. Due to the lower LCOE for renewable generation, the thermal units tend to be utilized after renewable generation reaches the maximum output capability, leading to the severe fluctuation of thermal output in scenario 2 synchronized with the fluctuation of wind/solar forecasting. With the participation of storage and EVs in scenario 3, it can be seen that the output of the thermal power units is smoother due to storage and EVs buffering the variations of renewable output. The system peak-valley gap is also reduced significantly, and thus improves the operating efficiency of the power system.
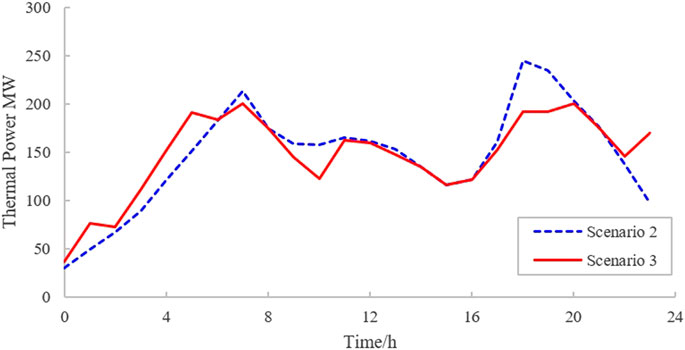
FIGURE 8. Comparison of thermal power output curves.
Impacts of the Initial Charging Status of Storage Device
The initial charging status of the energy storage device will impact the charging behaviors of the storage device over the whole dispatch horizon, which in turn affects the overall profitability of the grid and storage/EV. Figure 9 shows the evaluation of various initial charge of storage on the profits of different entities based on Scenario 3. The storage/EV profit is almost constant when the initial SoC is less than 0.4, while shows a linear decrease with the increase of initial charging status. The generation profit shows a completely opposite trend with storage/EV profit. Thus, from the perspective of storage/EV owners, an initial SoC lower than 0.4 would promise a better revenue from the dispatch of energy aggregator.
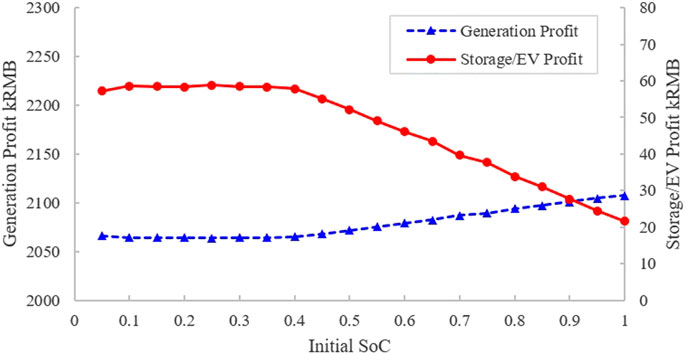
FIGURE 9. Influence of initial charging status of storage/EV on profits.
Figure 10 presents a further proof of the conclusion made above, which compared the charging/discharging activities of two cases: initial SoC = 0.3 and initial SoC = 0.7. The magnitudes of charging/discharging activities in the former case present a more active storage in the dispatch, leading to better revenue and profit for the owner.
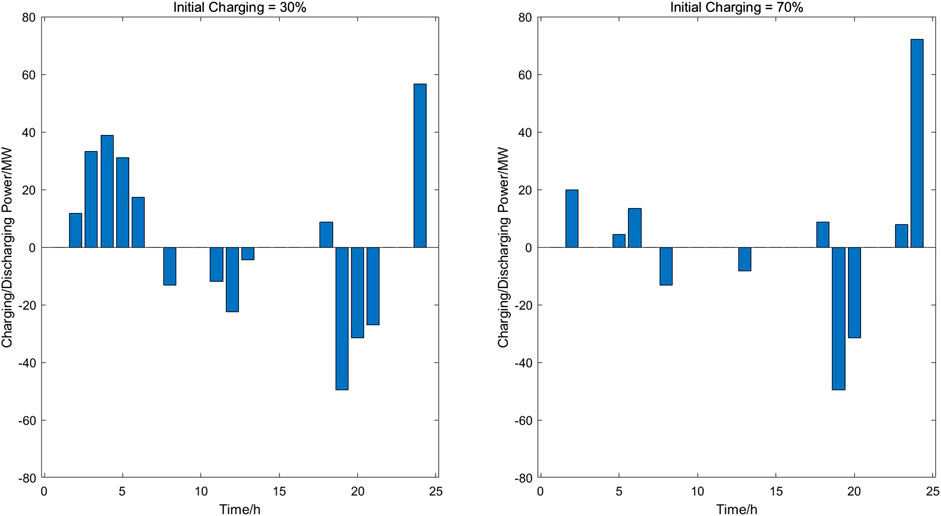
FIGURE 10. Charging and discharging behaviors under different initial charging status.
Conclusion
This paper proposes an optimization and dispatch model of the energy aggregator of DERs including generators, flexible electric charging loads and energy storages in order to facilitate the integration of renewables while considering the benefits for all energy resources under the time-of-use tariff. A multi-objective optimal dispatch model was developed considering the constraints of the DER operational requirements, power network flows and the end user comforts. Based on the IEEE 30-bus system, by integrating significant renewable resources, case studies were carried out to verify the benefits of the proposed model and dispatch methods.
The multi-objective optimization results were obtained in the case studies, which verifies that both the benefits of the aggregation and the storage device/EV were optimized. Results also showed that through the dispatch of the energy storage devices and EVs, the fluctuations of renewables were smoothed, the peak-valley difference of the system was reduced. In the meantime, the frequent regulations of conventional generators were reduced. A sensitivity analysis was undertaken which indicates that the initial state of charge for the storage has an impact on the charging/discharging schedules, thus may impact the profit of the storage/EV owners for participating in the dispatch.
Data Availability Statement
The raw data supporting the conclusions of this article will be made available by the authors, without undue reservation.
Author Contributions
QX contributed toward supervision, conceptualization, methodology and writing—review and editing. MC and SL contributed toward supervision, review and editing. QX contributed toward model building. HX and TC contributed toward data collection and initial analysis.
Funding
This research was fully funded by the National Natural Science Foundation of China under Grant 51961135101.
Conflict of Interest
Author QX, MC, SL, QX, HX, and TC were employed by the company ABB Power Grids Investment (China) Ltd.
The handling editor declared a past co-authorship with one of the authors MC.
Acknowledgments
The authors would like to sincerely acknowledge the kind supports and research exchanges from Tianjin University and other project cooperative members.
Appendix
The typical alternating current (AC) transmission model is showed in Appendix Figure A1. The expressions of AC transmission line power flow are in Eq. 38.
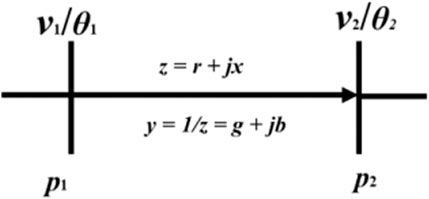
FIGURE A1. AC transmission line model.
The DC power flow derivation is showed in Knight et al., 1972, which is based on multiple approximation: line conductance ignored, phase angle close to zero, line voltage P.U. set as constant, and line susceptance equal to the reciprocal of reactance. The formations are present in (39)-(42). The DC transmission line power flow is Eq. 43. Appendix Figure A2 shows the DC transmission line model.
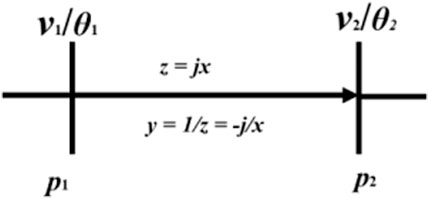
FIGURE A2. DC transmission line model.
Nomenclature
T total dispatch horizon, equal to 24
SF the shift distribution factor matrix
Map the position transformation matrix for branches of system
D the number of load buses
ES the number of energy storage devices
E the number of EV clusters
α efficiency factor of wind generator
β the efficiency factor of PV
References
Ansari, M., Al-Awami, A. T., Sortomme, E., and Abido, M. A. (2015). Coordinated bidding of ancillary services for vehicle-to-grid using fuzzy optimization. IEEE Trans. Smart Grid 6 (1), 261–270. doi:10.1109/tsg.2014.2341625
Castillo, A., and Gayme, D. F. (2014). Grid-scale energy storage applications in renewable energy integration: a survey. Energy Convers. Manag. 87, 885–894. doi:10.1016/j.enconman.2014.07.063
Chen, Y., and Zhao, D. (2020). Multi-objective optimization model for multi-form energy storage coordinated scheduling with wind power. Electr. Meas. Instrumentation 11, 1–9. doi:10.2172/1762045
Alkadi, N. E., Starke, M. R., and Ma, O. (2013). Assessment of industrial load for demand response across western interconnect. New York, NY, United States. Oxford University Press. https://www.osti.gov/servlets/purl/1111445.
Ge, R., Zhang, L., and Chai, J. (2020). Cooperative game model of energy storage power station and photovoltaic power station in power market environment. Renew. Energy Resour. 38 (04), 545–553. doi:10.1016/s0038-092x(98)90019-6
IEA. (2020). Renewables 2020. Available at: https://www.iea.org/reports/renewables-2020 (Accessed December 5, 2020).
Knight, D. G., Crisan, O., and Higgins, T. J. (1972). Power systems engineering and mathematics. IEEE Trans. Syst. Man, Cybern. SMC 3 (6), 650.
Li, D., Liu, J., and Liu, Y. (2015). Power market linkage game analysis considering wind and storage. Power Syst. Technol. 39 (004), 1001–1007. doi:10.17950/ijer/v3s10/1003
Liu, C., and Du, P. (2018). Participation of load resources in day-ahead market to provide primary-frequency response reserve. IEEE Trans. Power Syst. 33 (5), 5041–5051. doi:10.1109/tpwrs.2018.2818948
Ma, Y., Houghton, T., Cruden, A., and Infield, D. (2012). Modeling the benefits of vehicle-to-grid technology to a power system. IEEE Trans. Power Syst. 27 (2), 1012–1020. doi:10.1109/tpwrs.2011.2178043
National Development and Reform Commission. (2019). Notice of the National development and reform Commission on improving the on-grid tariff policy for wind power. Available at: https://www.ndrc.gov.cn/xxgk/zcfb/tz/201905/t20190524_962453.html (Accessed January 11, 2021).
National Development and Reform Commission. (2020). Notice of the National Development and Reform Commission on matters related to the 2020 photovoltaic power grid tariff policy. Available at: https://www.ndrc.gov.cn/xxgk/zcfb/tz/202004/t20200402_1225031.html (Accessed January 11, 2021).
National Energy Administration. (2018). 2018 National electricity price regulatory. Available at: http://www.nea.gov.cn/138530255_15729388881531n.pdf (Accessed January 11, 2021).
PJM INT. (2020). Manual 11: energy and ancillary services market operations. Available at: https://www.pjm.com/markets-and-operations/demand-response/∼/media/documents/manuals/m11.ashx (Accessed December 10, 2020).
Seneviratne, C., and Ozansoy, C. (2016). Frequency response due to a large generator loss with the increasing penetration of wind/PV generation – a literature review. Renew. Sustain. Energy Rev. 57, 659–668. doi:10.1016/j.rser.2015.12.051
Stott, B., Jorge, J., and Alsaç, O. (2009). DC power flow Revisited. IEEE Trans. Power Syst. 24 (3), 1290–1300. doi:10.1016/j.rser.2015.12.051
Su, H.-I., and Abbas, E. G. (2013). Modeling and analysis of the role of energy storage for renewable integration: power balancing. IEEE Trans. Power Syst. 28 (4), 4109–4117. doi:10.1109/tpwrs.2013.2266667
Wang, H., Yang, X., and Zhang, M. (2013). A hybrid energy storage control strategy to smooth the fluctuations of photovoltaic systems. Power Syst. Technol. 37 (009), 2452–2458. doi:10.3390/su11051324
Yuan, G., Chen, S., and Liu, Y., (2016). Virtual power plant economic dispatch based on time-of-use power price. London: Power System Technology.
Zhang, W., Lian, J., Chang, C.-Y., and Kalsi, K. (2013). Aggregated modeling and control of Air conditioning loads for demand response. IEEE Trans. Power Syst. 28 (4), 4655–4664. doi:10.1109/pesgm.2014.6939498
Keywords: flexible demand, multi-objectives optimal dispatch, renewable power utilization, distributed energy resouces, time-of-use tariff, min–max unification
Citation: Xing Q, Cheng M, Liu S, Xiang Q, Xie H and Chen T (2021) Multi-Objective Optimization and Dispatch of Distributed Energy Resources for Renewable Power Utilization Considering Time-of-Use Tariff. Front. Energy Res. 9:647199. doi: 10.3389/fenrg.2021.647199
Received: 29 December 2020; Accepted: 08 February 2021;
Published: 22 April 2021.
Edited by:
Yue Zhou, Cardiff University, United KingdomReviewed by:
Rui Jing, Institute of Urban Environment (CAS), ChinaXiaolong Jin, Technical University of Denmark, Denmark
Copyright © 2021 Xing, Cheng, Liu, Xiang, Xie and Chen. This is an open-access article distributed under the terms of the Creative Commons Attribution License (CC BY). The use, distribution or reproduction in other forums is permitted, provided the original author(s) and the copyright owner(s) are credited and that the original publication in this journal is cited, in accordance with accepted academic practice. No use, distribution or reproduction is permitted which does not comply with these terms.
*Correspondence: Qinhao Xing, cWluaGFvLnhpbmdAaGl0YWNoaWFiYi1wb3dlcmdyaWRzLmNvbQ==