 Boya Zhang
 Shukuan Bai
 Yadong Ning
- Key Laboratory of Ocean Energy Utilization and Energy Conservation of Ministry of Education, School of Energy and Power Engineering, Dalian University of Technology, Dalian, China
Energy issues are closely related to the development of human society and economy. Embodied energy is the total direct and indirect energy consumption required for the production of goods and services. In the context of the intensifying development of economic globalization and prosperity of international trade, embodied energy is considered as a better indicator to comprehensively reflect the nature of a country’s energy use than the direct energy use. The development of trade in value added (TiVA) accounting and global value chain theory has brought new ideas to embodied energy research. This study applies TiVA accounting to the study of embodied energy and establishes a complete framework to decompose the sources, destinations, and transfer routes of embodied energy in a country’s exports, and comprehensively depicts the embodied energy flows in China’s exports at the country and sector levels as an instance. The results show that China exports large amounts of embodied domestic energy use, and export is an important factor for the rapid growth of China’s energy and emissions. At the country level, the United States and EU28 are traditional major importers of China, and developing countries, such as Brazil, India, and Indonesia, are emerging markets. China’s embodied energy flows to different importers vary in terms of trade patterns, flow routes, and the embodied domestic energy intensities. At the sector level, the light industry and the services create more benefits, whereas manufacturing, such as chemicals and metal products, consumes more energy, and there is a mismatch between the main sectors that create economic benefits from exports and the main sectors that consume energy for exports. These results indicate that embodied energy of China’s exports has a great impact on global energy consumption and carbon emission, and the optimizing of China’s export embodied energy structure is conducive to global energy conservation and emission reduction. This article strongly suggests the importance of the global value chain decomposition framework in embodied energy research.
Introduction
Energy is a basic element of the social economy, and the available energy both limits and governs the structure of human economies (Costanza, 1980). The huge economic growth and human welfare improvements are coupled with ever-increasing energy depletion. The primary world energy consumption rose sharply from 361.52 EJ in 1995 to 583.90 EJ in 2019 (BP, 2019). On the other hand, owing to the rapid development of the global economy and industrialization, the massive emissions resulting from the combustion of fossil energy have become a leading cause of global climate change. Sustainable energy development and combating climate change have become key issues of global concern. Meanwhile, the emerging economic globalization has accelerated the spatial separation of production and consumption in global supply chains, connecting economic development in one country with energy use in another country through good flows in international trade. Such separation no longer limits the energy import (by countries) to the context of direct import of energy products and can also improve the import of energy-intensive intermediate and final products to achieve the goal of reducing domestic energy consumption (Wiedmann et al., 2015). Simultaneously, this kind of spatial separation occurs to carbon emissions related to fossil fuel energy embodied in the products. Such carbon emission flows related to the embodied fossil fuel energy may result in carbon leakage if only the carbon emitted domestically is taken into account, without considering carbon embodied in imported goods and emitted in the exporting countries (Wyckoff and Roop, 1994). And many studies on international trade, embodied energy, and emissions demonstrated that the embodied flows of energy and emissions may cause the consequence of carbon leakage (Mongelli et al., 2006; Lin and Sun, 2010; Cui et al., 2015). With the development of international trade and increasing production globalization, energy flows among countries are becoming increasingly intricate, as are the carbon emissions related to these energy flows. Direct domestic energy consumption can no longer completely delineate the nature of a country’s energy use, and therefore, “embodied energy” is considered to be a more appropriate measure. In the context of global action to tackle climate change and carbon emission reduction, trade embodied energy (especially embodied fossil fuel energy) is closely related to the transfer and flows of carbon emissions, and may even cause carbon leakage, which is not conducive to global emission reduction. Therefore, it is of great significance to study the flows of energy embodied in trade, especially fossil fuel energy.
Embodied energy is the total direct and indirect energy consumption required for the production of goods and services (Bullard and Herendeen, 1975). Input-output analysis is the main method used to measure embodied energy. In recent decades, research on embodied energy using input-output analysis has been developed in a spurt with the continuous improvement of input-output technology, along with the growing enrichment of energy statistics in various countries and different input-output databases. The related literature can be divided according to the research scale, including the global level (Bortolamedi, 2015; Chen and Wu, 2017; Jiang et al., 2020), multilateral country level (Wu and Chen, 2019; Zhang et al., 2019), bilateral country level (Yang et al., 2014; Tao et al., 2018), single-country level (Costanza, 1980; Lenzen, 1998; Machado et al., 2001; Lam et al., 2019; Wang and Yang, 2020), region level (Sun et al., 2017; Guo et al., 2020a; Zheng et al., 2020), city level (Chen and Chen, 2015; Guo et al., 2015, 2020b), and sector level (Liu et al., 2012, Liu et al., 2020a, b; Sun et al., 2016; Guo et al., 2019). There are also numerous studies regarding the research of embodied energy of different energy varieties, such as coal (Xia et al., 2017; Wu and Chen, 2018), oil (Tang et al., 2012; Wu and Chen, 2019; Wang and Yang, 2020), natural gas (Kan et al., 2019, 2020), biomass (Ji et al., 2020), and nuclear energy (Cortés-Borda et al., 2015). “Complex network analysis” is also commonly used in embodied energy research (An et al., 2015; Chen and Chen, 2015; Yang et al., 2015; Sun et al., 2016; Chen et al., 2018; Liu et al., 2019; Tang et al., 2019). Chen conducted a comprehensive analysis of the abundance of literature related to embodied energy and concluded that embodied energy can provide a well-integrated perspective on energy consumption and demand, and as embodied energy has been used in academics, issues related to China have been holding a high level of attention (Chen et al., 2019).
China is the largest energy consumer and CO2 emitter in the world, and its energy issue has attracted worldwide attention. China is also the largest trading country and the primary trading partner of many countries. In recent years, China’s huge international trade surplus has received unprecedented attention, and it has become a reason for bilateral trade friction. Compared with imported products from developed countries and regions, China’s export products have lower value added and higher energy consumption and emissions per unit export trade volume, which will inevitably lead to the imbalance of energy consumption and emission flows. On the one hand, it has brought great pressure on domestic energy resources and the environment; on the other hand, it has also aroused international concern and even criticism about the growth of China’s energy demand and emissions, and various “China threat theories” have emerged in an endless stream. In recent years, with respect to the context of global action to tackle climate change, “China’s climate threat theory” is also on the rise. However, regarding the studies on embodied energy, the fact that China is a net exporter of energy contradicts this “threat theory” to some extent in terms of energy use (Tang et al., 2012; Cui et al., 2015; Wu and Chen, 2017; Jiang et al., 2020; Wang and Ge, 2020). Many empirical analyses on carbon emission embodied in China’s export also suggested that the scale of carbon emission embodied in China’s foreign trade is very large (Shui and Harriss, 2006; Weber et al., 2008; Lin and Sun, 2010; Su and Ang, 2013). A large amount of energy and carbon emissions embodied in China’s exports meet the consumption of other countries and regions (especially developed countries), which has changed the pattern of global energy consumption and carbon emissions to a certain extent. The embodied fossil fuel energy in China’s exports is not only closely related to embodied carbon emissions, but also an important factor driving China’s energy consumption. Studies on the energy (especially fossil fuel energy) embodied in China’s exports are significant for China’s energy conservation and emission reduction, as well as the global emission reduction and combating climate change. Conversely, previous research on China’s embodied energy is mostly limited to the gross value measure at the national, regional, or sector levels, as well as the net energy transfer in China’s international or domestic regional trade (Gao et al., 2018; Tang et al., 2019; Guo et al., 2020a; Liu et al., 2020a; Zheng et al., 2020).
Studies on detailed energy flows embodied in China’s international trade are as important as the amount of embodied energy in international trade; however, previous studies have seldom depicted the detailed energy flow routes, except for the gross value and the net flow value and directions. In addition, there is still a lack of comprehensive analyses at various levels. Moreover, most of the existing research is based on gross value accounting. Due to the deepening of the international division of labor in production and the in-depth development of intermediate goods trade, intermediate goods may cross borders back and forth. Therefore, the energy embodied in export goods is not limited to domestic sources and can come from foreign countries. Imports may also include the domestic energy that was previously exported. Nevertheless, the analysis based on gross value accounting cannot separate these parts from the total embodied energy. Moreover, previous studies often use the domestic energy use coefficient to replace the coefficients of other countries when it comes to import and export issues and to deduct the embodied energy of imported intermediate products in exports, resulting in large inaccuracies in the results. It is difficult to analyze the source of embodied energy in a country’s imports and exports, nor to ascertain the real destinations of the energy embodied in the exported intermediates because of the restrictions on energy data and corresponding input-output data, as well as the limitation of gross value accounting itself. With the advent of trade in value added (TiVA) accounting and the development of the global value chain theory, the sources, destinations, and transfer routes of the value added in international trade can be completely decomposed; these harbor new ideas for embodied energy research.
In 2012, the WTO (World Trade Organization) and OECD (Organization for Economic Co-operation and Development) launched the “Measurement of Trade in Value Added” joint research project. Several international organizations, such as the European Union and United Nations Conference on Trade and Development (UNCTAD) have also conducted statistical studies on TiVA (OECD and WTO, 2011). This work has promoted the mainstreaming of TiVA statistics and made it a permanent part of the official international statistical system. The measurement of the global value chain based on TiVA accounting has been widely adopted. “Global value chain” is also called “vertical specialization,” and it has many related labels (such as “value chain cutting,” “outsourcing production,” “production non-integration,” “production fragmentation,” “multi-level production,” and “product internal specialization”) (Hummels et al., 2001). Balassa proposed a kind of continuous production process in which product is divided into a vertical trade chain, which extends to many countries, and the interconnectivity of this production process is gradually enhanced. Each country focuses on a specific stage in the production process and adds value according to its comparative advantage. This global division phenomenon is defined as vertical specialization (Balassa, 1965). However, because of the restrictions on data and calculation methods, the research on vertical specialization remained at the case study level until Hummels defined a narrow concept of vertical specialization and put forward a quantitative index of systematic measurement, which made it possible to measure the global value chain (Hummels et al., 2001). Since then, the methodology has been developed continuously (Koopman et al., 2008, 2010, 2012, 2014; Wang et al., 2009; Daudin et al., 2011; Johnson and Noguera, 2012; Stehrer, 2012; Timmer et al., 2014). Finally, Wang et al. compared the TiVA accounting method (with the gross value accounting system) from the perspective of gross exports and decomposed the total exports into 16 terms (consisting of 12 value added items and 4 double-counting items), thereby, realizing the complete decomposition of gross exports (Wang et al., 2014); the decomposition framework of the global value chain accounting is thus complete.
The TiVA accounting and global value chain decomposition framework have brought new ideas to embodied energy research, and in particular, because of the abundance of the global input-output data, some studies have adopted this measure to analyze embodied energy (Liu et al., 2019, 2020b); however, these analyses were only conducted at the country aggregate level and focused on the construction sector. There is still a lack of detailed analyses of China’s export embodied energy flows. In addition, in the process of completing the final decomposition framework, the importance of the forward linkage and backward linkage measures at the sector level has been stressed, owing to the fact that forward linkage focuses on the source sectors that initially consume the energy, whereas the backward linkage focuses on the sectors that finally export products (Wang et al., 2014). However, this difference has not been considered in previous studies at the sector level, and the analysis of embodied energy at the sector level was mostly conducted for a certain sector, with relatively little analysis of the differences between the various sectors. Following the global value chain decomposition framework, this study decomposes a country’s gross export into 17 terms and energy embodied in the gross exports into 13 terms (respectively, according to the sources and final destinations of value added and energy consumption). Then, using the decomposed components, this study provides a detailed analysis of China’s export embodied energy at both country and sector levels according to the comprehensive aspects of gross value, trade patterns, sources, and destinations. Furthermore, a new indicator of energy intensity is proposed in this study to evaluate the real domestic energy cost of economic benefits in exports. Overall, considering China’s exports as an example, this article shows the detailed routes (from sources to the final destinations) to depict the embodied energy flows along the global value chain. On one hand, it is conducive to analyze the impact of China’s export embodied energy on global energy consumption; on the other hand, it can describe the flow of energy-related carbon emissions. Moreover, this study is the basis and conducive to describe the real energy transfer between countries, and the research framework of this study is also applicable to the study of embodied carbon emissions and other embodied flows.
The remainder of this article is organized as follows. In section “Methodology and Data,” the methodology and data sources are introduced. In section “Empirical Result,” the empirical results are analyzed in detail. Section “Discussion and Implications” presents a discussion of the relevant results, and the conclusions and outlooks are presented in section “Conclusion and Outlooks.”
Methodology and Data
Methodology
The multi-region input-output (MRIO) analysis is commonly used to measure the embodied resource and environmental flows across regions. Almost all the decomposition methods in the recent vertical specialization and TiVA literature are rooted in the work of Leontief (1936). Table 1 provides a fundamental framework for the MRIO table. According to the basic input-output model, all gross output of country s must be used as either intermediate goods or final goods at home (or abroad):
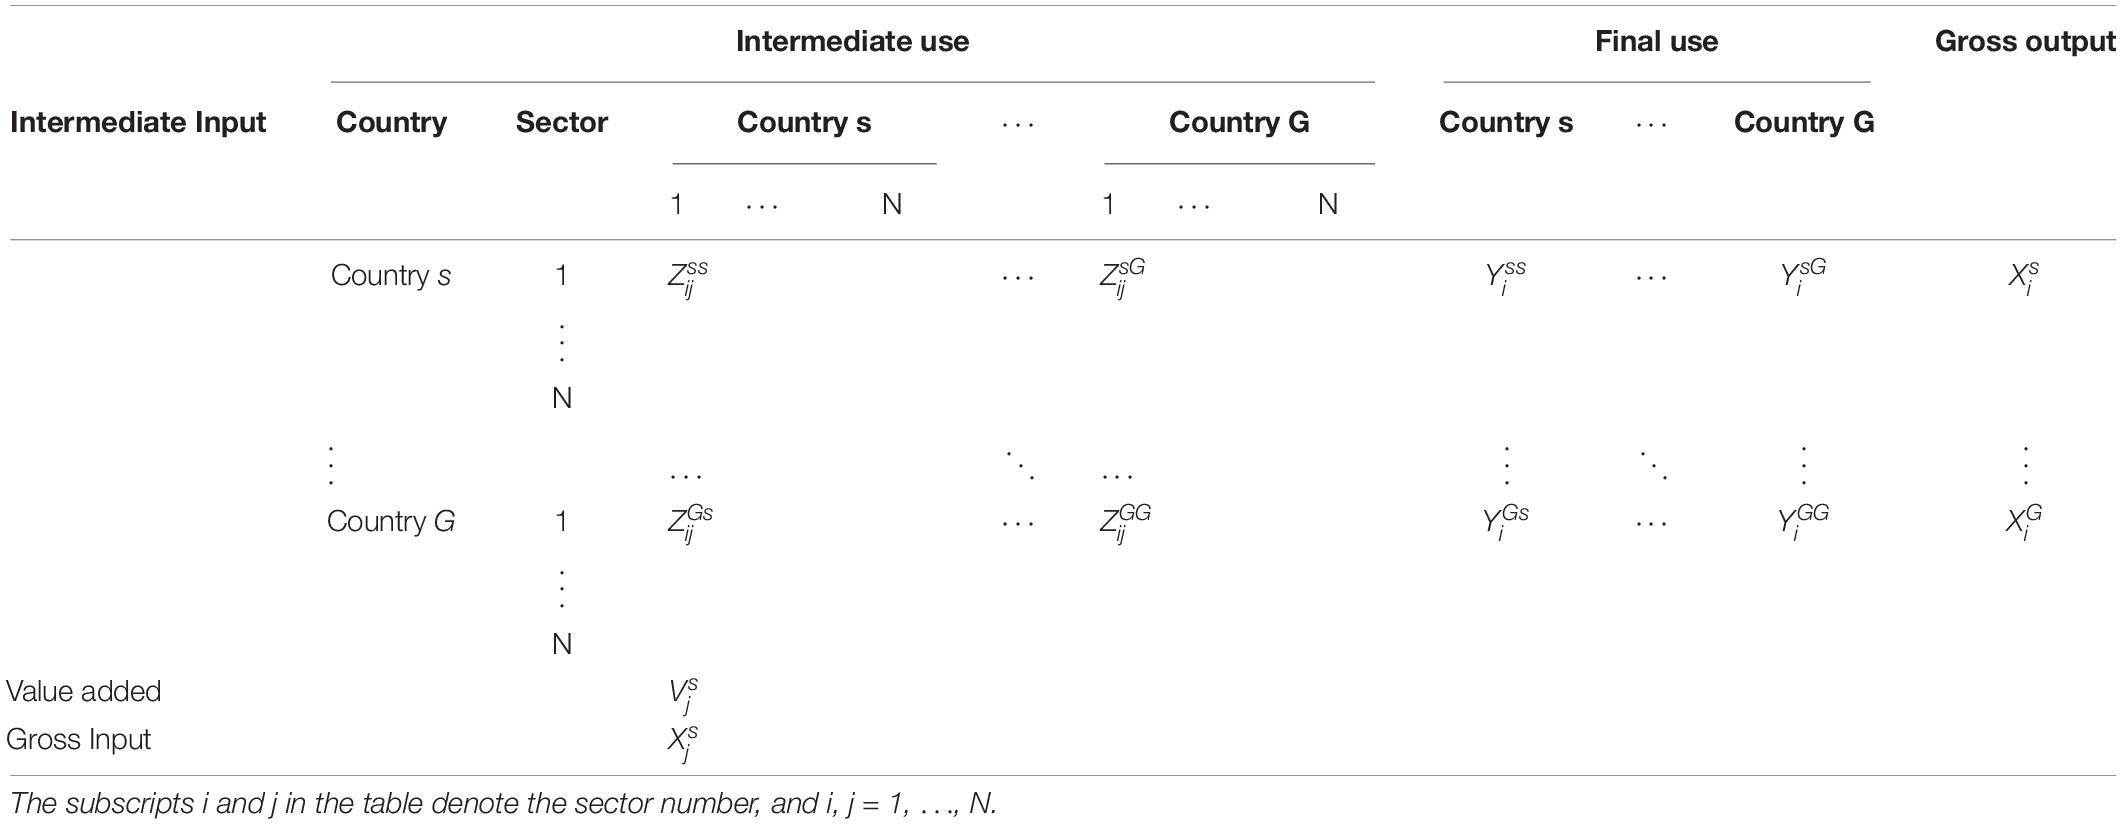
Table 1. Basic framework of a multi-region input-output table.
where Xs (Xr) denotes the gross output of country s (country r), and Asr (Ass) is the direct input coefficient matrix, which gives the intermediate use in country r (country s) of goods produced in country s, and each element of it equals the corresponding intermediate use divide gross input, i.e., aij = zij/ xj. Ysr (Yss) denotes the final use in country r (country s) of goods produced in country s. It can be expressed in matrix form as follows:
After rearranging equation (2), we can obtain the following:
where Bsr is the total requirements matrix, which gives the total requirement to produce a unit of gross output of country r needed from country s (similar for Bss, BGs, BsG, and BGG). Ys (YG) is the gross final goods produced in country s (country G), including domestic use Yss (YGs) and abroad use ().
Subsequently, we denote the direct energy use coefficient matrix as F, and ; each submatrix in it is the diagonal matrix of the sectoral direct energy use coefficient. For instance, ; its elements are denoted by . is the direct energy use coefficient of sector j in country s, and is the direct energy use of sector j in country s. Then, we can obtain the gross direct energy use vector (i.e., ; each element represents the gross direct energy use of the corresponding country) as follows:
The gross exports of country s, Es, includes the intermediate exports () and final goods exports (), that is, . The corresponding energy use embodied in the gross exports of country s (GEEXs) can be denoted as: .
As a significant contribution to the global value chain and TiVA accounting, a country’s exports to another country are completely decomposed into 16 components (Wang et al., 2014). This study follows the decomposition framework proposed by Wang et al. (2014) and further splits the fifth term of their decomposition framework into two parts according to the final destination, and the process is detailed in Appendix. Thus, this study decomposes a country’s bilateral exports into 17 terms in line with the sources, absorbed destinations, and flow routes of value added. The final decomposition equation is expressed as follows:
where Esr is the total exports of country s to country r, and Vs is the value added coefficient diagonal matrix of country s, in which each element is the value added coefficient of sector j in country s, and , is the value added of the corresponding sector. Lss is the local Leontief inverse matrix; , and Er* is the gross export of country r. And the meaning and acronym of each term in equation (5) are as follows:
(1) DVA_FIN is the domestic value added in the final exports and absorbed in the direct importer.
(2) DVA_INT is the domestic value added in intermediate exports and absorbed in the direct importer.
(3) DVA_INTrexI1 is the domestic value added in the intermediate exports and re-exported by the direct importer to a third country to produce domestic final use.
(4) DVA_INTrexF is the domestic value added in the intermediate exports and used by the direct importer to produce final goods and used in the third country.
(5) DVA_INTrexI2 is the domestic value added in intermediate exports and used by the direct importer to produce intermediate goods and re-exported to the third country to produce their exports to the fourth country.
(6) DVA_INTrexI3 is the domestic value added in intermediate export and used by the direct importer to produce intermediate goods and re-exported to the third country to produce their exports to the direct importer.
(7) RDV_FIN is the domestic value added in intermediate exports and returns home via final imports.
(8) RDV_Final2 is the domestic value added in intermediate exports and returns home via final imports from the third country.
(9) RDV_INT is the domestic value added in intermediate exports and returns home via intermediate imports.
(10) DDC_FIN is the pure double-counting from domestic source due to final exports production.
(11) DDC_INT is the pure double-counting from domestic source due to intermediate exports production.
(12) MVA_FIN is the value added from the direct importer used in the final exports.
(13) MVA_INT is the value added from the direct importer used in intermediate exports.
(14) MDC is the pure double-counting sourced from the direct importer.
(15) OVA_FIN is the value added from the third country used in the final exports.
(16) OVA_INT is the value added from the third country used in the intermediate exports.
(17) ODC is the pure double-counting sourced from the third country.
Following this decomposition framework, we decompose the gross energy embodied in the exports of country s to country r (GEEXsr) into 13 parts as follows:
The decomposition framework of the embodied energy in exports is presented in Figure 1, and the terms in equation (6) correspond to each term in the figure. Thus, we can measure the domestic content of energy and value added embodied in a country’s gross exports.
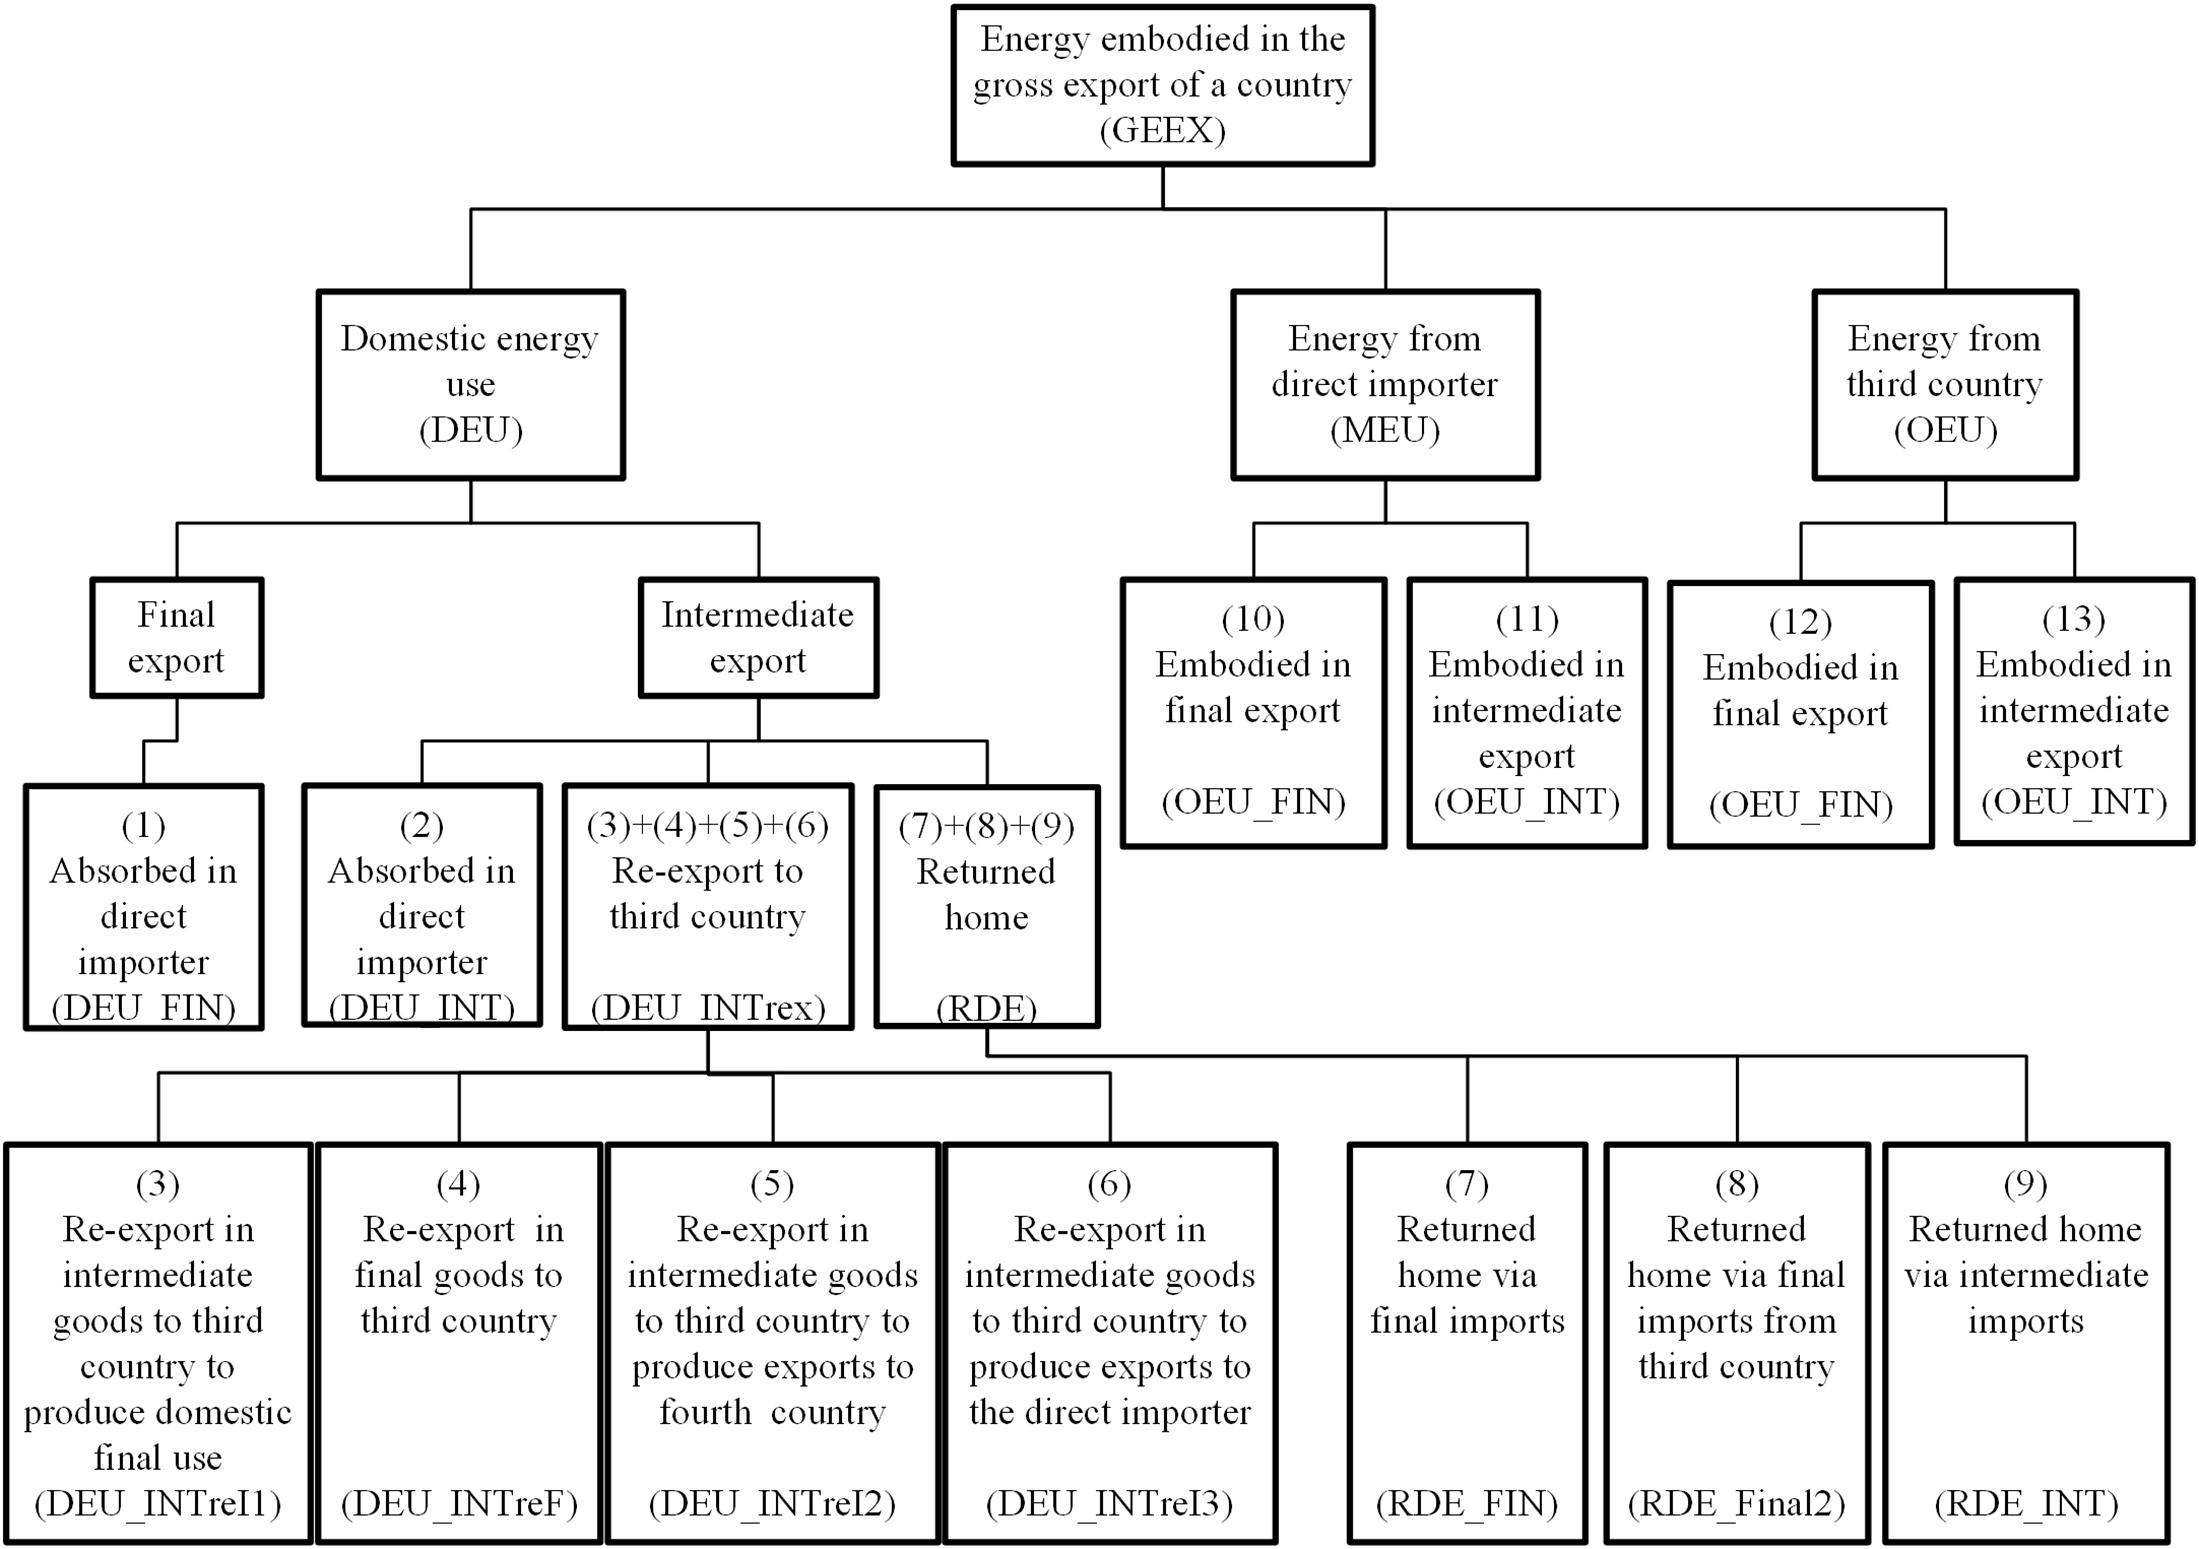
Figure 1. Decomposition framework of gross energy embodied in exports.
To analyze the real situation of domestic energy use and economic gains, this study defines a new measure of energy intensity (export embodied domestic energy intensity, EMDEI), representing a country’s domestic energy consumption for creating a unit of domestic value added through export; the formulas for the country aggregate and bilateral country levels are as follows:
Country aggregate level:
Bilateral country level:
where DEU and DVA are the sums of the first to the ninth term in equations (6) and (5), respectively, denoting the gross value of the domestic content embodied in the country’s exports at the corresponding level; the superscript s denotes the exporter and r denotes the direct importer.
As mentioned in the previous section, the exports (accounting based on forward and backward linkages) are equal at the country level but differ at the sector level; this distinction has been disregarded in previous embodied energy studies. A sector’s gross export embodied energy (or value added) based on the forward linkage focuses on the source sector, including the energy (or value added) of a given sector and embodied in the gross exports of all sectors in this country, whereas the measure based on backward linkage focuses on the final export sector, including the gross energy (or value added) from all sectors in the country embodied in a given sector’s gross exports. For instance, in a two-sector country case, the export value of sector 1 is 60 units and the value of sector 2 is 40 units based on the forward linkage measure, and the values change to 35 and 65 units, respectively, based on the backward linkage measure. The country aggregation is the same (100 units) (An illustration refers to Supplementary Figure 1). These two measures are expressed in the following equations:
where and are the sector aggregations of the first to ninth terms in equations (6) and (5); “fw” and “bw” in the subscript represent the forward and backward linkage measures, respectively. The forward linkage measure is the sum across the columns along the row, whereas the backward linkage measure is the sum across the rows along the column. Thus, the EMDEI at the sector level can be calculated as follows:
Forward linkage based:
Backward linkage based:
Data Sources
The MRIO tables used in this study were derived from the world input-output Database (WIOD) (Timmer et al., 2015) and were released in 2016. The series of world input-output tables (WIOTs) cover 28 EU (European Union) countries and 15 other major economies, along with the “rest of the world region” (ROW) for the period 2000-2014 (for specific countries and regions, refer to Supplementary Table 1). The corresponding energy data were derived from the Joint Research Center of the European Commission (Corsatea et al., 2019). The Joint research center provides two sets of data, including total energy use and emission-related energy use, and the emission-related energy use data were used in this study. This article decomposes the gross export of China to other countries and regions covered in the WIOT, along with the gross energy embodied in the export for the period 2000–2014. In this study, 18 sectors (merged of the 56 sectors in the original WIOTs) in China were analyzed at the sector aggregate level, the details are listed in Table 2.
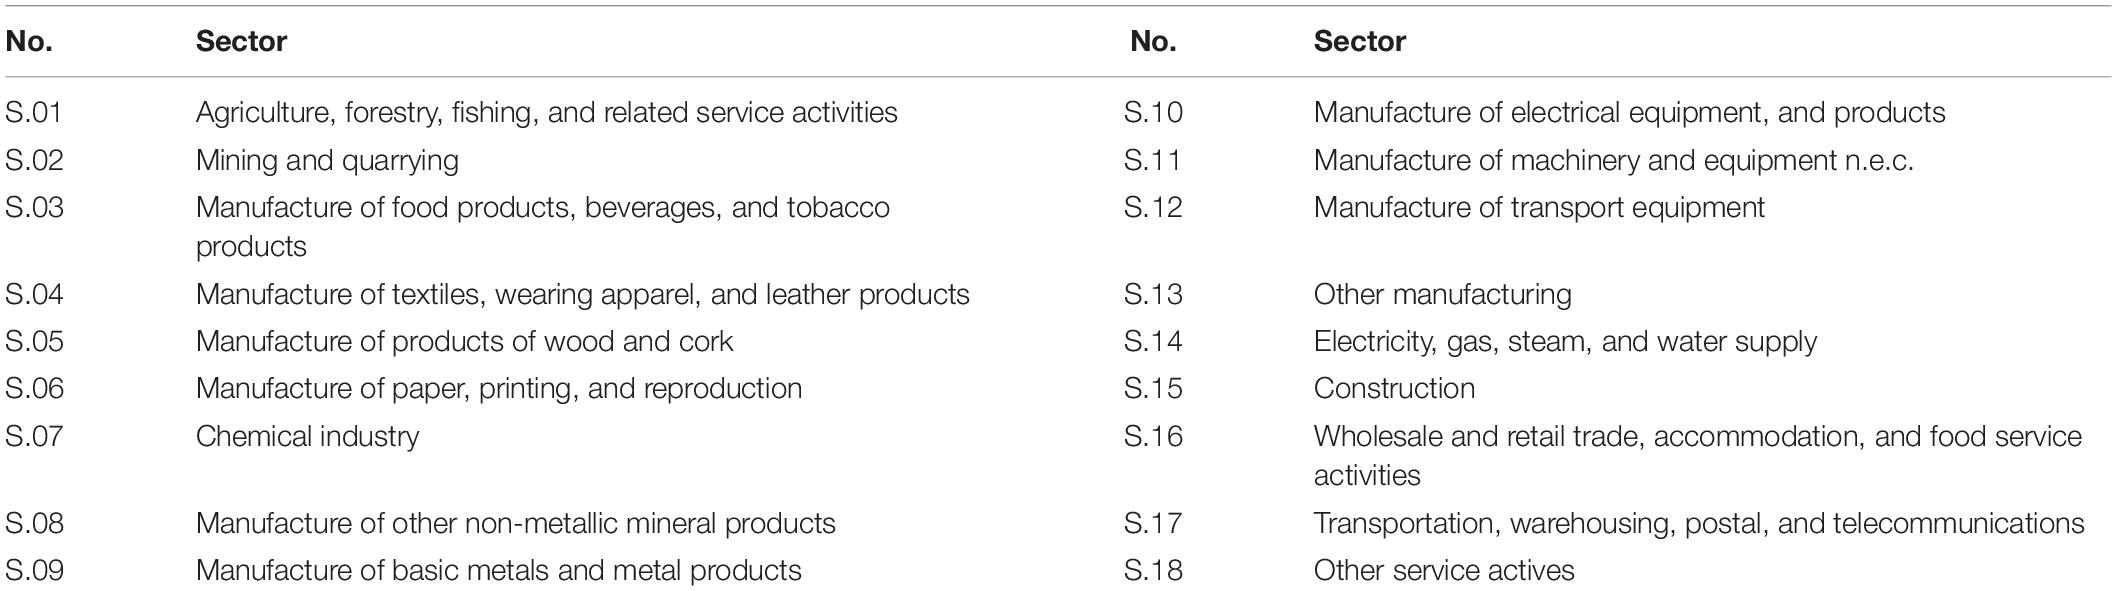
Table 2. Sectors and numbers.
Empirical Results
Analysis at Country Aggregate Level
Based on equations (5) and (6), this study decomposes China’s exports to the 43 importers covered in the WIOT for the period 2000–2014, and the results at country aggregate level are presented in this section.
The decomposition results of China’s gross exports (17 terms) and gross exports embodied energy (13 terms) are shown in the stacked bars in Figure 2, along with the domestic value added (DVA) (gross exports embodied domestic energy use, DEU) proportion of China’s total GDP (total energy use) shown in the line charts. China’s gross export increased from 262 billion dollars in 2000 to 2,425 billion dollars in 2014, with only a slight dip caused by a global recession in 2009. DVA_FIN and DVA_INT (the domestic value added in final exports and intermediate exports and absorbed in the direct importer) dominated the gross exports, DVA_INTrexI1 (the domestic value added in the intermediate exports and re-exported by the direct importer to a third country to produce domestic final use), DVA_INTrexF (the domestic value added in the intermediate exports and used by the direct importer to produce final goods and used in the third country), OVA_FIN (the value added from the third country used in the final exports), and OVA_INT (the value added from the third country used in the intermediate exports) also accounted for significant proportions, along with the growing pure double-accounting part [that included DDC_FIN (the pure double-counting from domestic source due to final exports production), DDC_INT (the pure double-counting from domestic source due to intermediate exports production), MDC (the pure double-counting sourced from the direct importer), and ODC (the pure double-counting sourced from the third country)]. What should be noted is that the pure double counting in the exports is due to the intermediates across borders back and forth in international trade. This part grows as the intermediate trade and processing trade are increasing in recent decades. And the traditional gross value accounting, these double countings are also calculated as part of a country’s gross exports, although they do not create any value added (whether domestic or foreign). The DVA proportion of China’s total GDP reflects, to some extent, the dependence on the export of China’s economic development, which showed an increasing trend before 2007 and a decreasing trend thereafter. The proportion reached a peak of 28.8% in 2006 and stabilized at approximately 20% in 2013 and 2014, equivalent to the level in 2002.

Figure 2. Decomposed terms of gross export and corresponding embodied energy and the domestic content share in total China’s GDP and energy use. The graphs are provided for (A) gross export and (B) gross export embodied energy.
The gross energy use embodied in China’s exports (GEEX) showed the same tendency as the gross exports before 2008 and increased from 8,600 PJ in 2,000 to 29,600 PJ in 2007, while showing a different trend since 2008. After the global financial crisis, the GEEX picked up slightly in 2010; after 2011, it stabilized at 30,000 PJ. DEU_FIN and DEU_INT (domestic energy use embodied in the final exports and intermediate exports and absorbed in the direct importer) accounted for over 70% of the GEEX, whereas DEU_INTrexI1 (the domestic energy use embodied in the intermediate exports and re-exported by the direct importer to a third country to produce domestic final use), DEU_INTrexF (the domestic energy use embodied in the intermediate exports and used by the direct importer to produce final goods and used in the third country), OEU_FIN (the energy use from the third country used in the final exports), and OEU_INT (the energy use from the third country used in the intermediate exports) dominated the remainder. The DEU proportion of China’s gross energy use showed the same trends as the economic results throughout the study period, peaking in 2006 at 40% and stabilizing in 2013 and 2014 at approximately 26%. The proportion of DEU each year was slightly higher than the corresponding DVA proportion, implying that China’s exports are more domestic energy-intensive than its domestic consumed products.
According to the trade pattern, the gross export can be classified as final trade [including DVA_FIN, MVA_FIN (the value added from the direct importer used in the final exports), and OVA_FIN] and intermediate trade [including the remainder 14 terms in equation (5)]. Correspondingly, the GEEX can be divided into GEEFX [gross energy embodied in final exports, including DEU_FIN, MEU_FIN (the energy use from the direct importer used in the final exports), and OEU_FIN] and GEEIX [gross energy embodied in intermediate exports, including the remaining 10 terms in equation (6)]; the decomposition results by trade pattern can be found in Supplementary Figure 2. The final trade accounted for more than half of China’s total exports, and at the end of the study period, the share decreased to approximately 50%. The GEEFX accounted for over half of the GEEX before 2013, and the GEEIX exceeded 50% in 2013 and 2014.
In terms of the sources, the value added and energy embodied in China’s exports can be divided into domestic and foreign contents, namely, DVA and FVA [foreign value added embodied in export, including MVA_FIN, MVA_INT (the value added from the direct importer used in intermediate exports), OVA_FIN, and OVA_INT]; DEU and FEU [foreign energy embodied in exports, including MEU_FIN, MEU_INT (the energy use from the direct importer used in intermediate exports), OEU_FIN, and OEU_INT]; the pure double-counting terms of exports are excluded, and the details can be found in the Supplementary Figure 3. Domestic sources dominated throughout the study period, with the DVA accounting for over 80% and DEU accounting for over 90% in most years. The proportion of domestic energy in China’s exports was higher than that of the DVA, which indicates that the role of China’s exports in creating economic benefits was less than that of stimulating energy consumption. The share of FVA was larger than the share of FEU, implying that China’s exports drove more foreign economy compared to its dependence on foreign energy, especially during the period 2002-2008, in which China’s exports showed extensive growth.
The EMDEI (export-embodied domestic energy intensity) of China can be calculated using equation (7). In contrast to the commonly used energy intensity in exports (gross energy consumption divided by gross exports), the EMDEI used in this study measures the domestic energy use when creating a unit of domestic value added through exports and is supposed to be a more effective index to evaluate the relationship between energy use and economic growth driven by a country’s exports. The results of China’s EMDEI for the period 2000-2014 are shown in Figure 3. The EMDEI of gross export decreased from 35.8 kJ/dollar in 2000 to 13.4 kJ/dollar in 2014. The energy intensity of the export products was higher than that of products consumed domestically, which further reflected that China’s export product structure tended to be highly energy-dependent; although this phenomenon has improved since 2007, the export product structure still needs to be improved. The embodied domestic energy intensity of China’s exports has been declining, mainly due to the general improvement in the energy efficiency of domestic production and partly due to the structural optimization of export products. The most striking finding is that China’s EMDEI in gross exports continuously declined after 2003, and the EMDEI of the intermediate exports was always higher than that of the final exports, indicating that China needs to pay more energy cost to obtain economic benefits through the export of intermediate goods more than that of final goods.
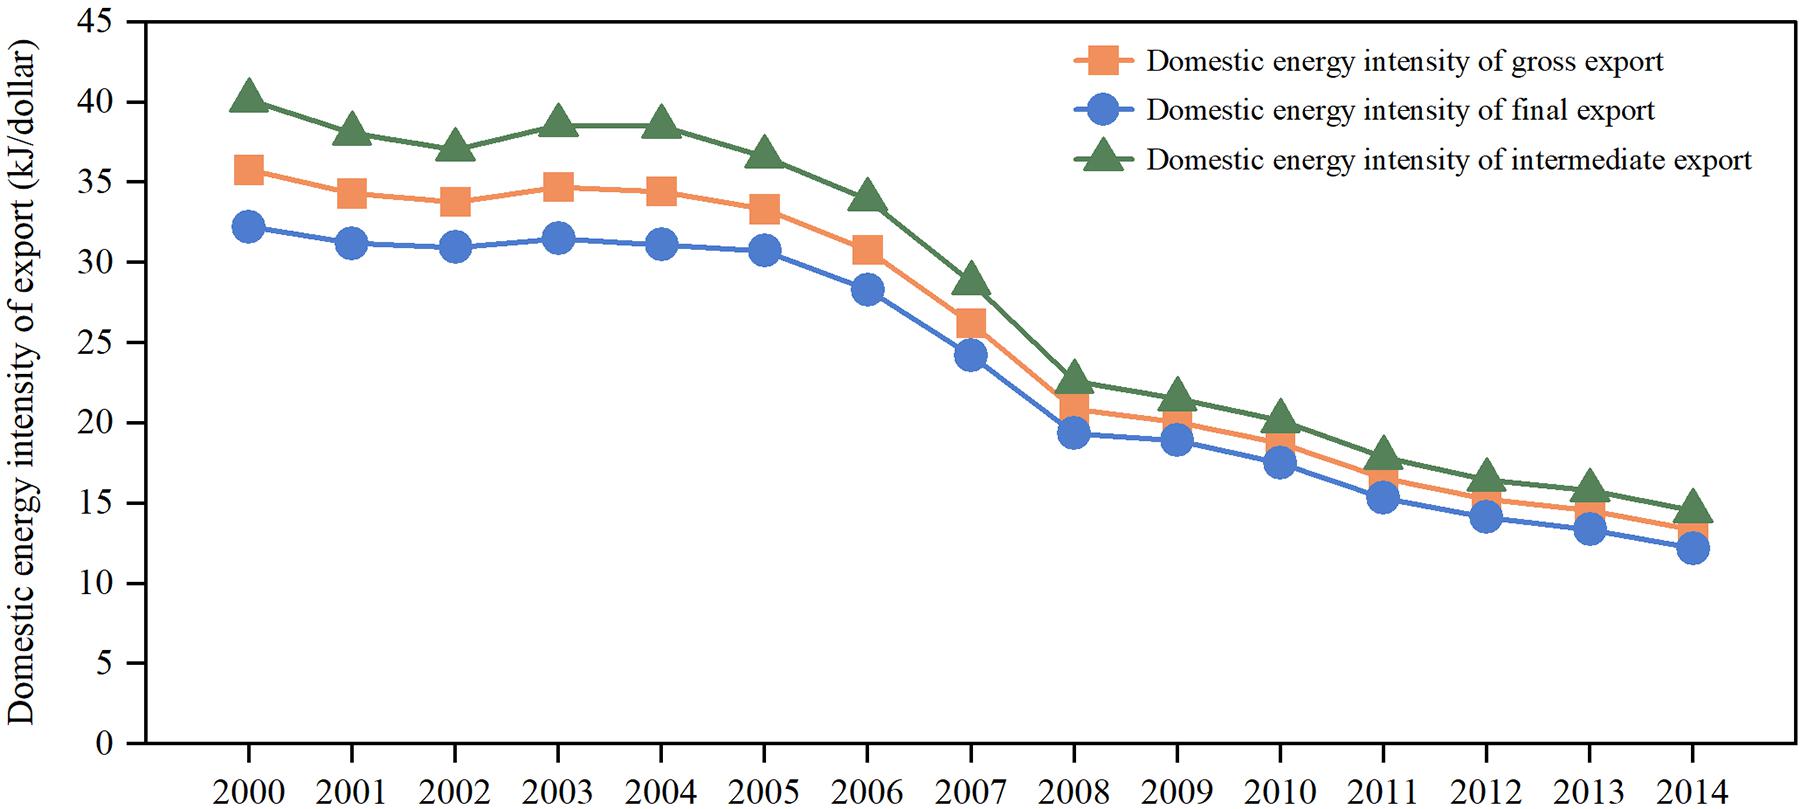
Figure 3. Embodied domestic energy intensity of China’s exports.
Analysis at Bilateral Country Level
Analysis at the country aggregate level can only present an overview of energy flows embodied in China’s exports. The analysis of the energy embodied in China’s exports to different economies can provide further information based on spatial heterogeneity. The distribution of China’s GEEX is presented in Figure 4, along with the proportions of the energy embodied in the final exports. 28 EU countries covered in the WIOT are analyzed as one region in this study, that is, EU28. According to the figure, the rest of the world (ROW), the United States, EU28, Japan, and Korea were the top five importers of China in terms of the gross export embodied energy, accounting for over 60% of China’s GEEX calculated during the whole study period; the United States is the largest individual importer except for the country groups, such as ROW and EU28. In addition, developing countries, like Brazil, India, and Indonesia, accounted for a growing proportion.
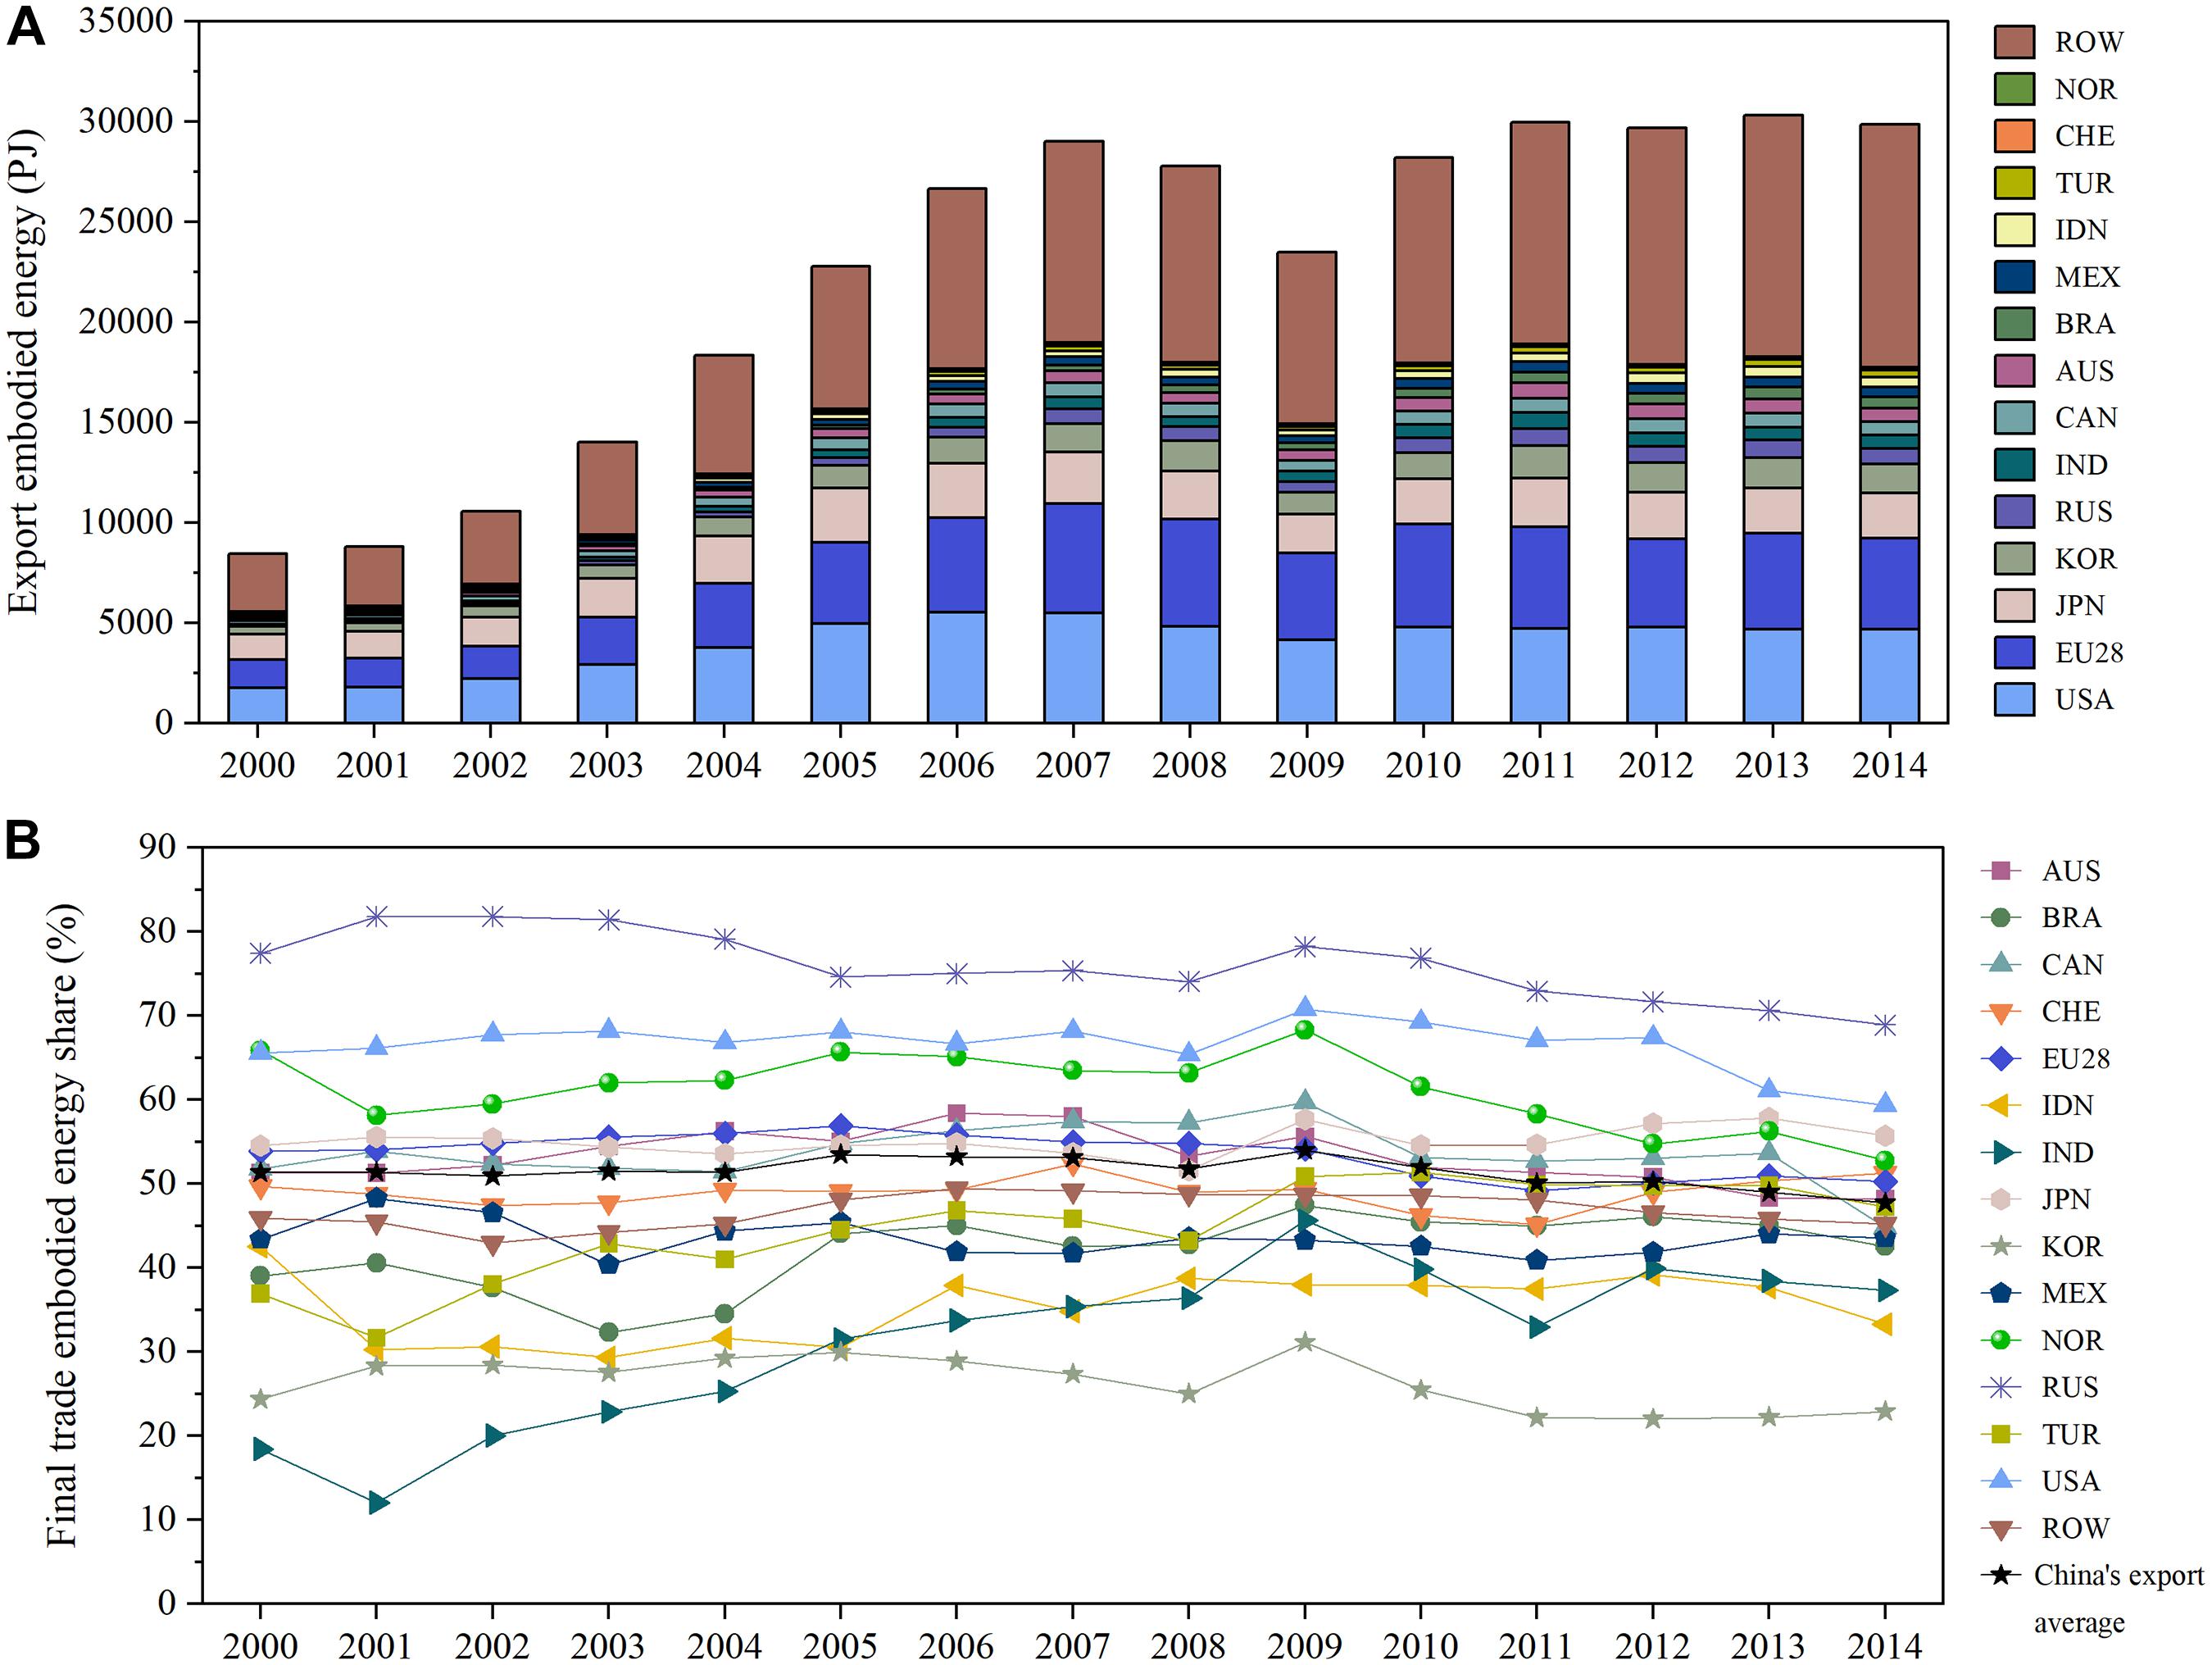
Figure 4. Energy embodied in China’s export to each importer and the corresponding proportion of energy embodied in final exports; graphs are provided for (A) gross export embodied energy and (B) proportion of final export embodied energy.
Trade patterns of embodied energy varied widely between the importers of China’s exports, and according to Figure 4, the GEEFX proportions of the GEEX in China’s exports to each importer (hereinafter referred to as “the proportion” in this paragraph) varied significantly. The proportion of China’s exports to Russia was the largest, followed by the exports to the United States and Norway. In addition, except for the top three countries, the proportions of exports to Japan, EU28, Australia, and Canada were higher than the proportion of China’s aggregate exports. The proportion of exports to India was the lowest before 2004, and since then, South Korea has occupied the last rank. Except for these two importers, the proportions of exports to the Czech Republic, Turkey, Mexico, Brazil, Indonesia, and ROW were lower than the proportion of China’s aggregate exports in most years during the study period. To sum up, the embodied energy is exported to developed economies, mainly through final goods, and to developing economies, mainly through intermediates.
The analysis of the GEEX sources can reveal the dependence of China’s exports on different energy sources. The GEEX sources of export to the importers are shown in Figure 5, and three types of energy sources were analyzed in this study, including domestic energy, energy from the direct importer, and energy from the third-party (energy from all countries and regions except for China and the direct importer). Domestic energy supplied the vast majority of export energy demand, over 87% as calculated, and foreign sources were mainly from a third-party, with a small part also from direct importers themselves. The domestic share was higher in 2000 as a whole and lower in 2007 and 2014. The source mix varied for different importers; the DEU share of exports to the United States was the lowest, whereas the share of exports to Korea was higher than the share of exports to other economies. The DEU share of exports to India ranked third in 2000 and 2005 and was replaced by Mexico in 2010 and 2014. The share of energy from the importer itself was larger in China’s exports to Russia and ROW than to other importers, while the share of energy from the third-party in exports to Brazil and the United States was the highest.
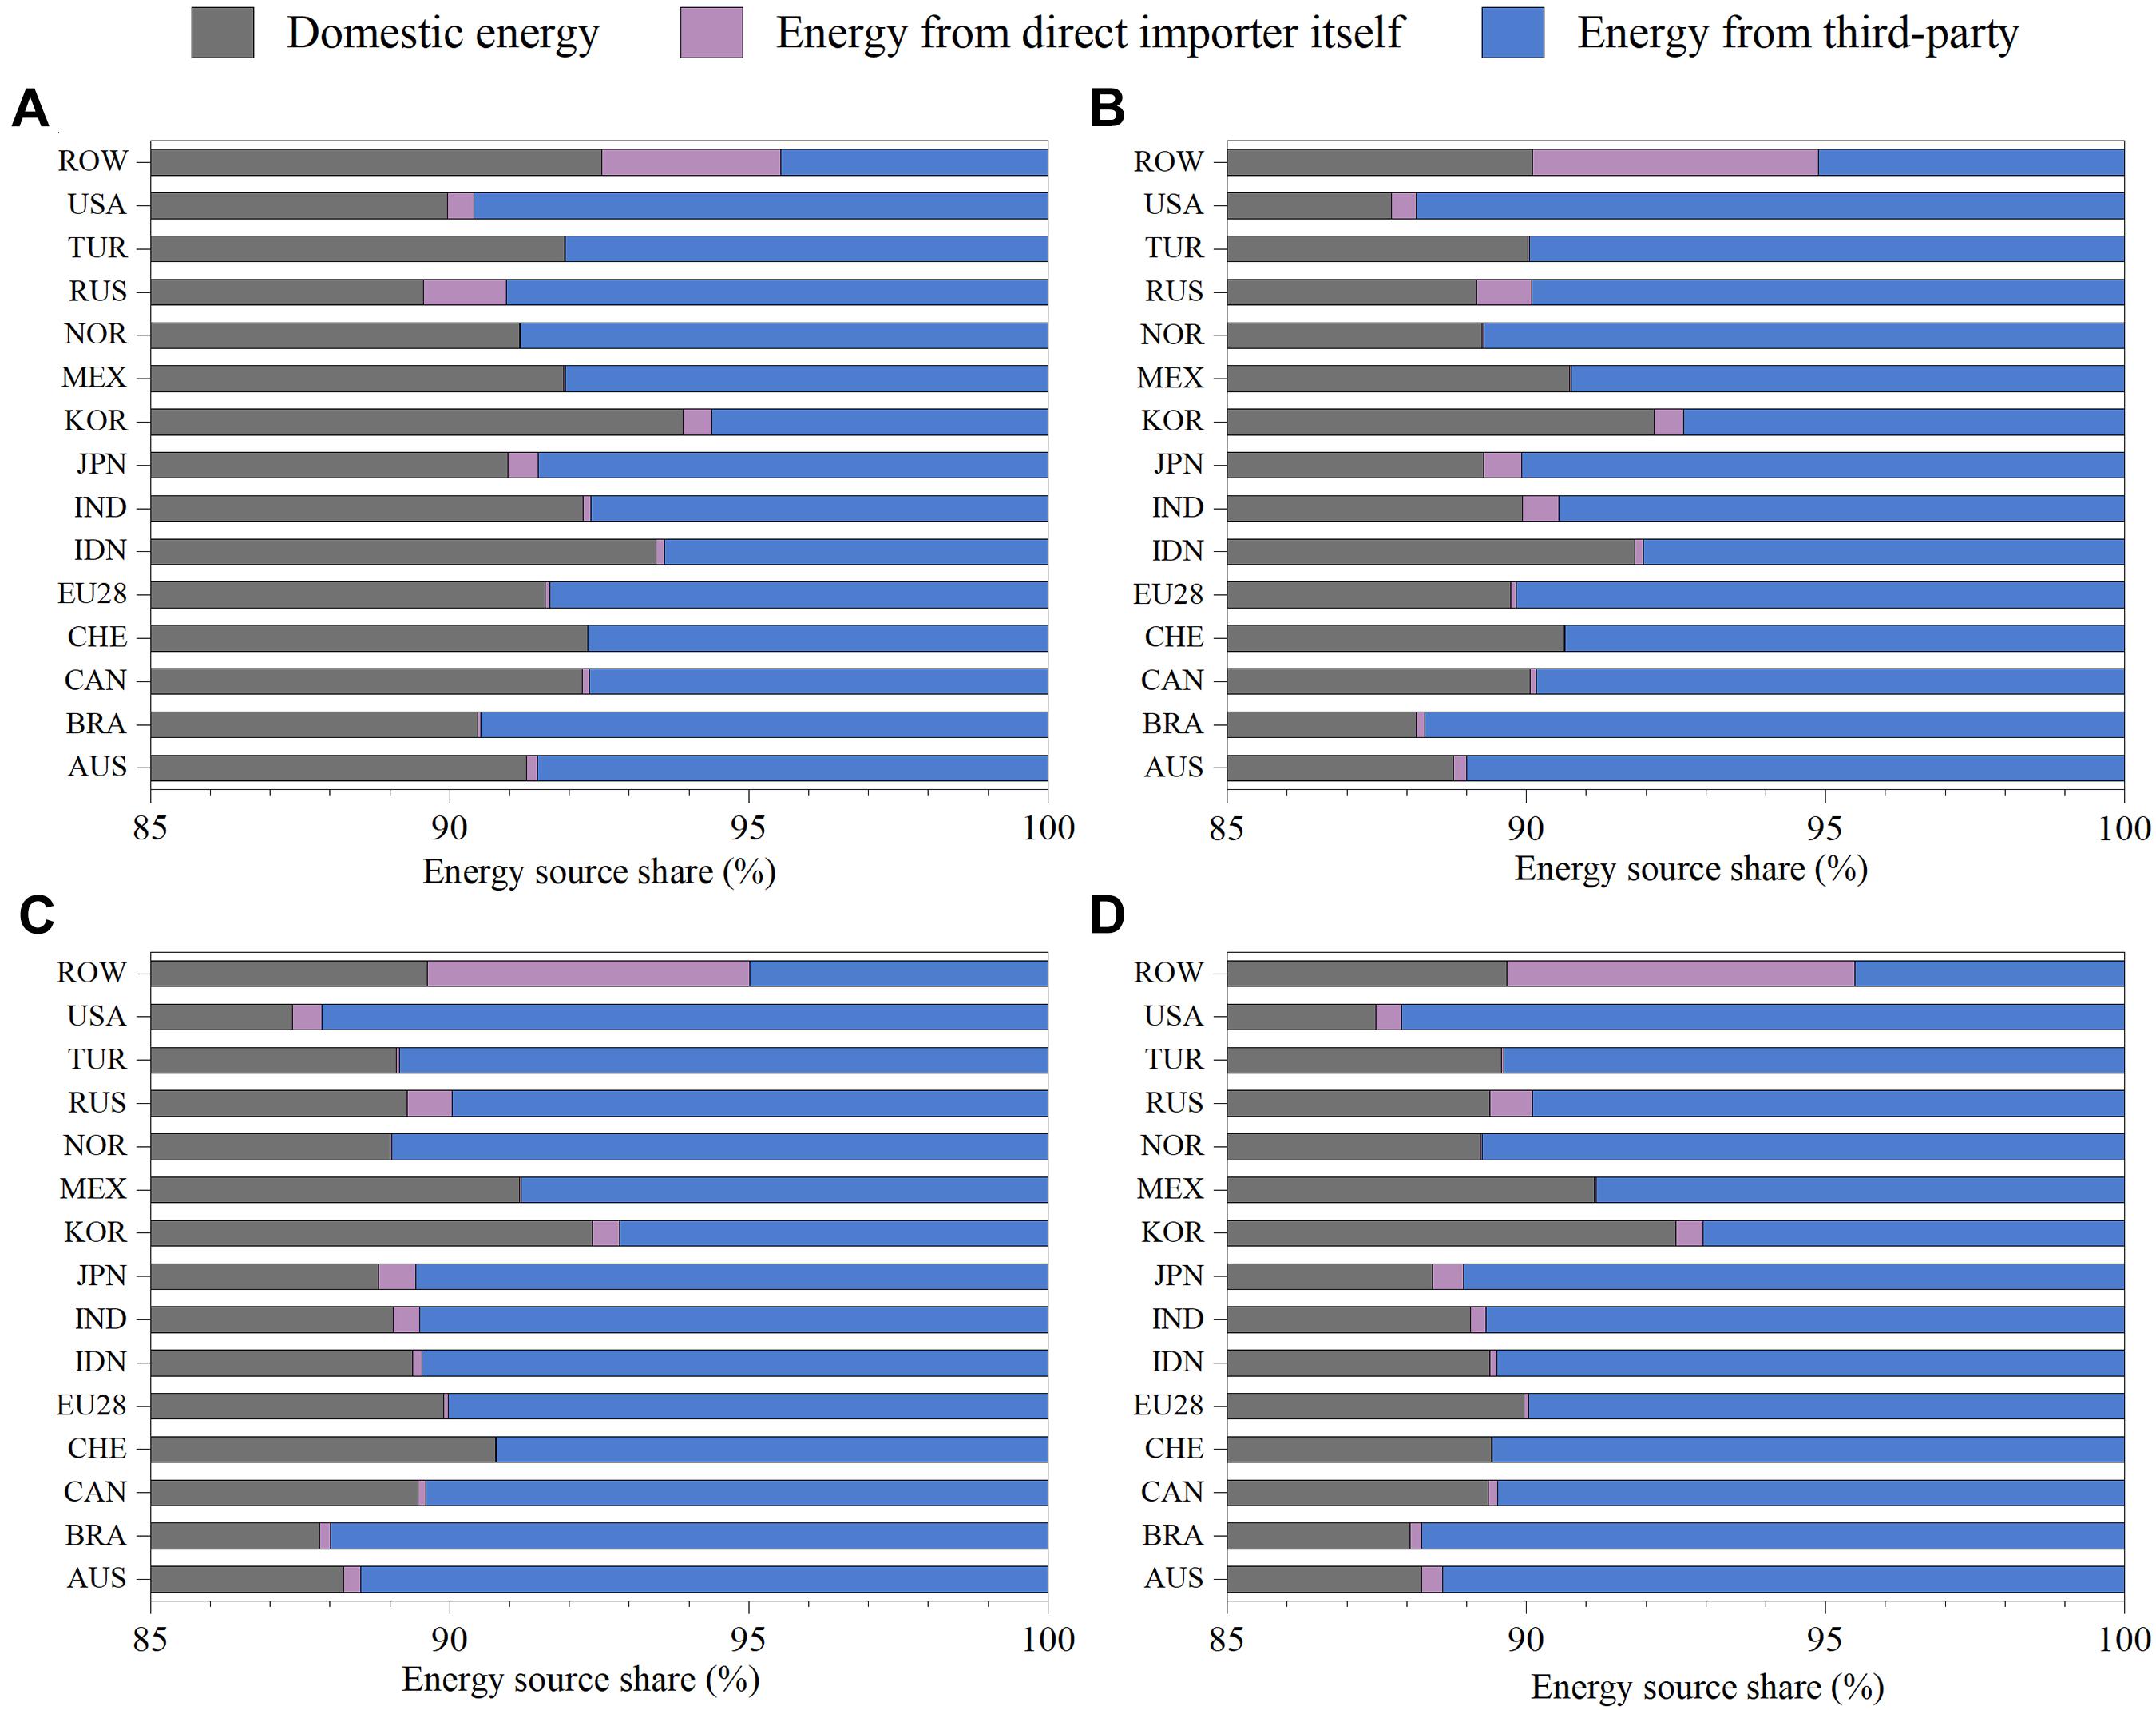
Figure 5. Embodied energy sources of China’s export to each importer; graphs are provided for (A) 2000, (B) 2005, (C) 2010, and (D) 2014.
The GEEX does not come from one source, and the DEU is not completely absorbed by the direct importers. Figure 6 shows the destinations where the DEU was finally absorbed, and three types of final destinations were analyzed in this study, including the direct importer, the third-party (energy absorbed in all countries and regions except for China and the direct importer), and returned home (absorbed in China), and the energy absorbed in the former two destinations is the part of domestic energy that is really exported to foreign countries and regions. In general, over 70% of domestic value added was absorbed in the direct importers for export to most countries. The share that is absorbed in direct importer was higher, the corresponding value chain of the export products was shorter. The share of DEU absorbed by the direct importer in exports to the United States was the highest, followed by the export to Russia, Brazil, Australia, and Japan. The share of DEU returned home in exports to Korea was evidently higher than those of exports to other importers. The share of DEU absorbed by the third-party in exports to Mexico was the highest, followed by the exports to Korea.
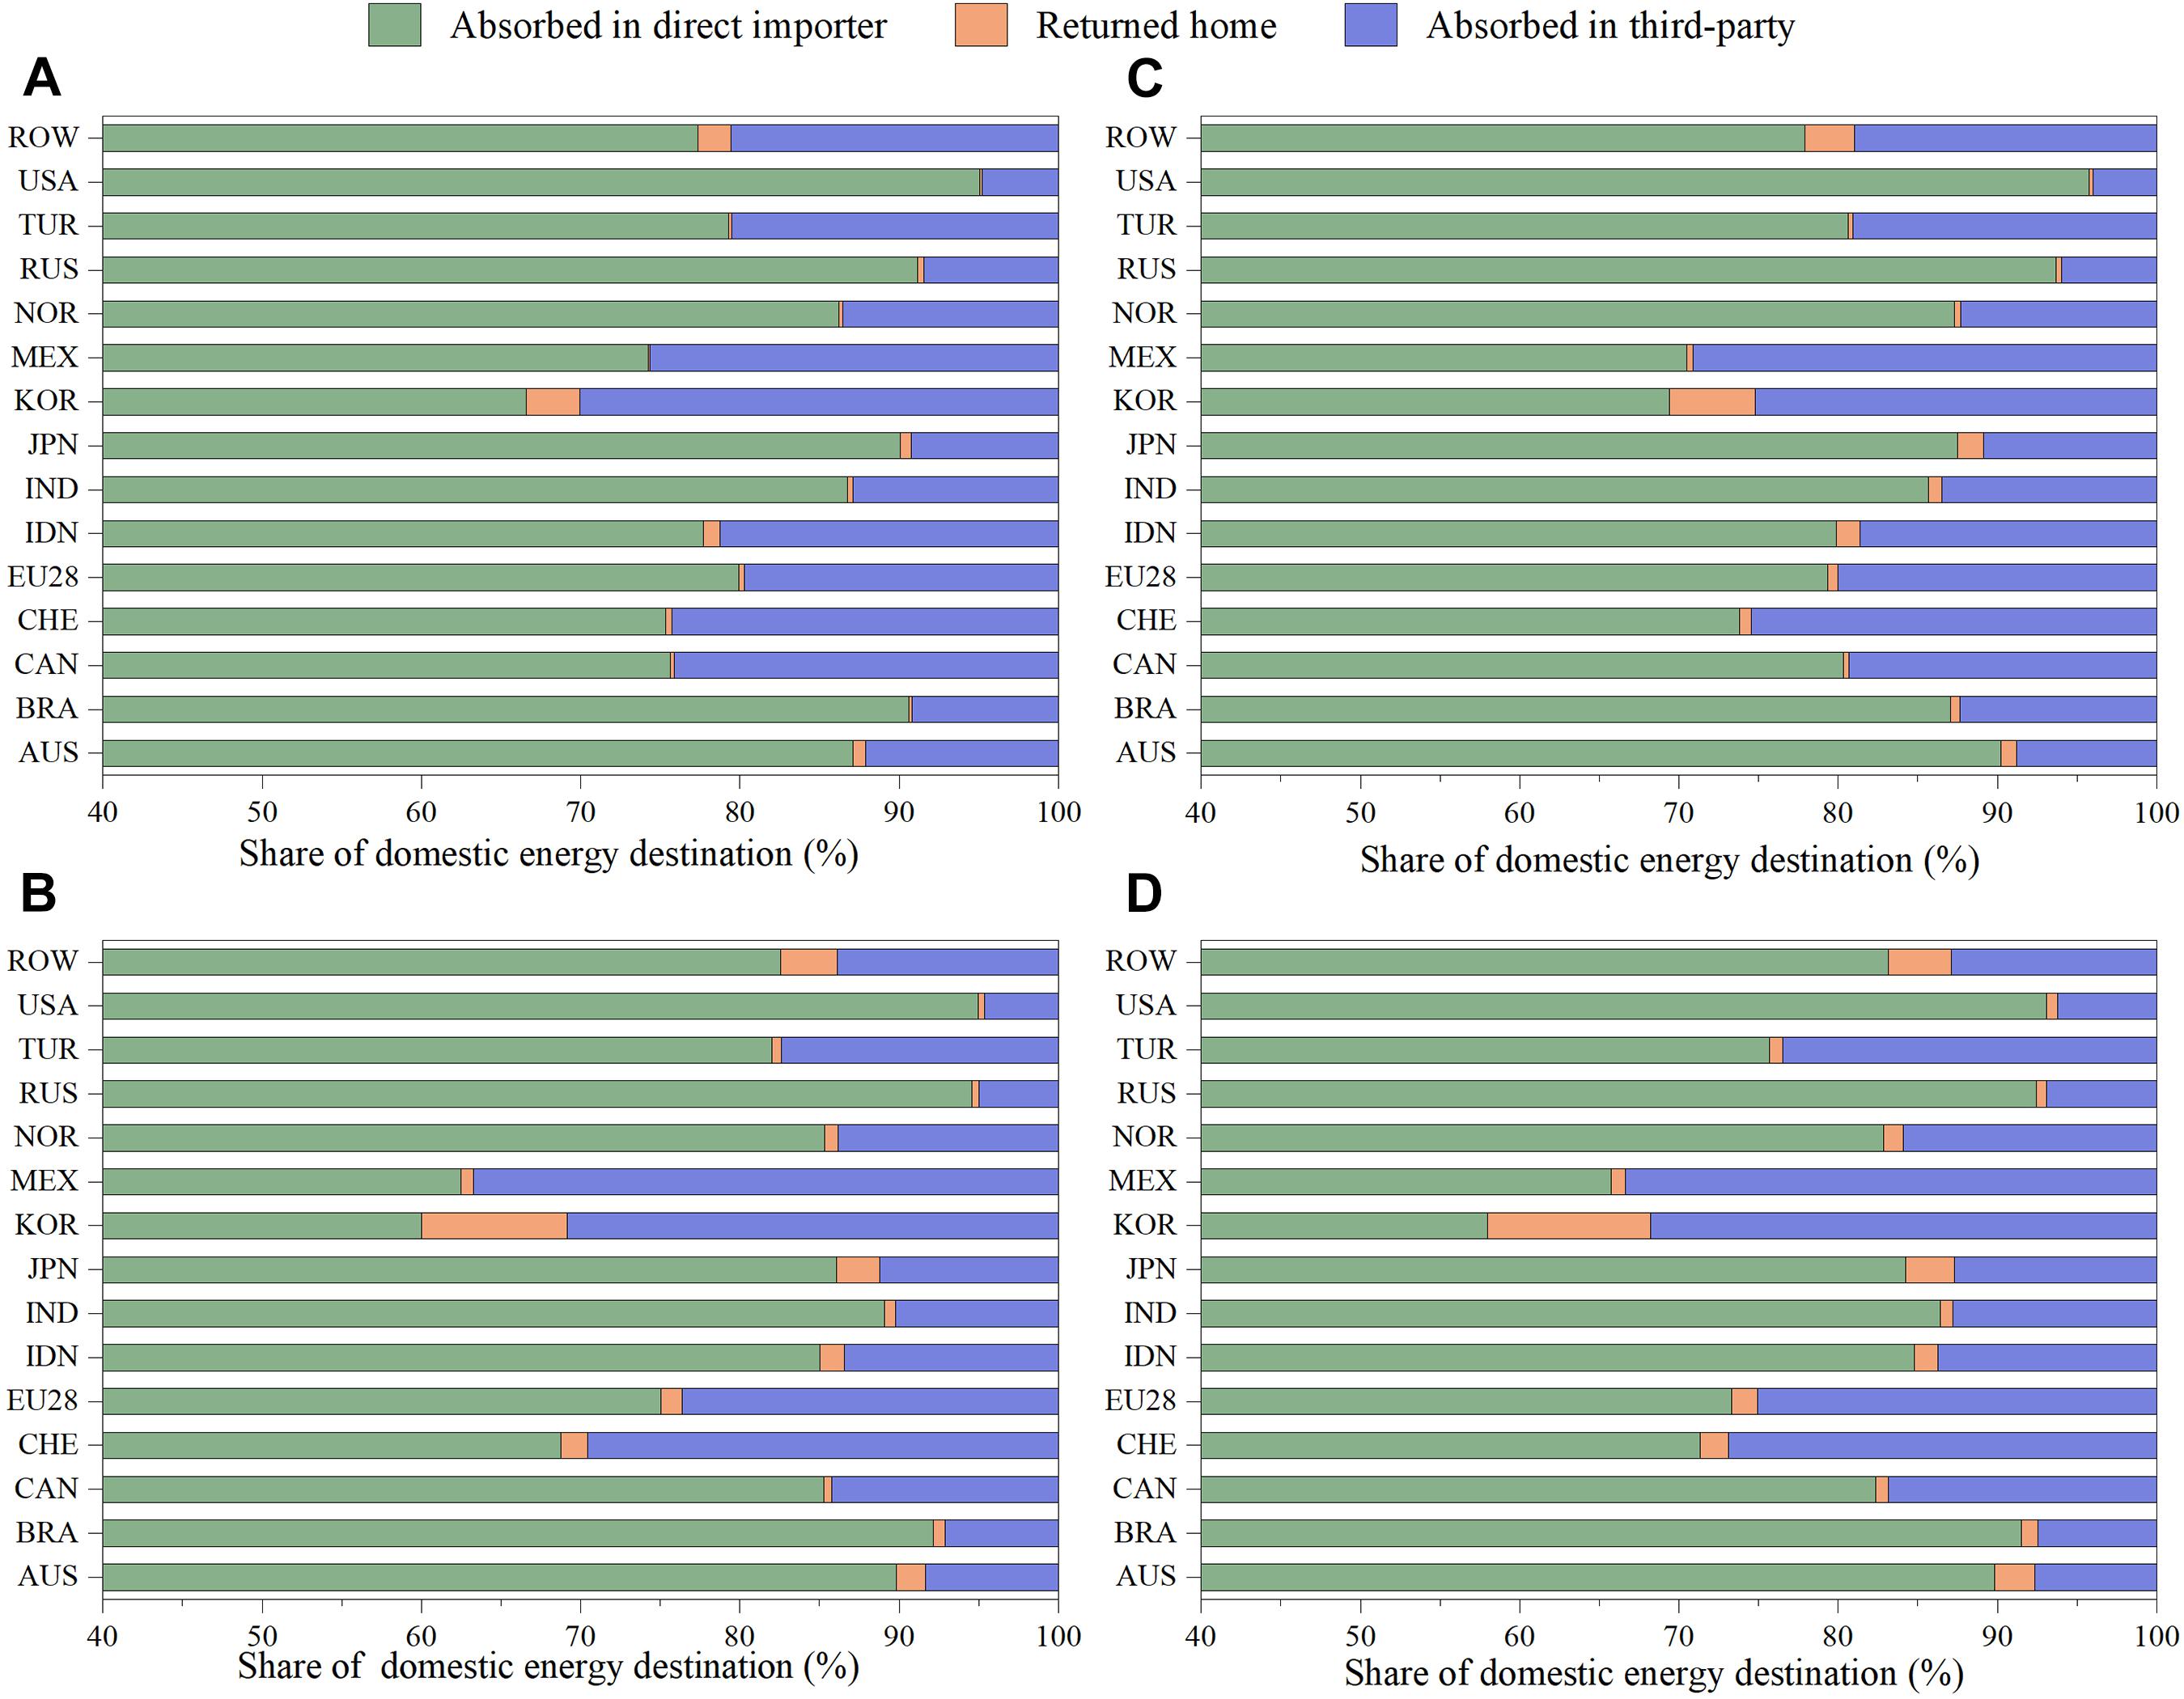
Figure 6. Final destination of embodied domestic energy in China’s export to each importer; graphs are provided for (A) 2000, (B) 2005, (C) 2010, and (D) 2014.
The EMDEI varies among importers, and differences exist in final exports and intermediate exports. The details of EMDEI in the gross exports, final exports, and intermediate exports (to each importer) can be found in Supplementary Figure 4. The EMDEI generally showed a significant decline in the gross exports and final exports, and the range of difference among importers in the final export was the smallest, whereas in intermediate exports it was the largest. The EMDEI in the gross exports decreased from 30 kJ/dollar to 48 kJ/dollar to less than 20 kJ/dollar in the exports to all the importers. In 2014, the EMDEI in the gross exports to India was the highest, followed by the EMDEI in the gross exports to Korea and Turkey; the EMDEI in gross exports to Russia was the lowest, followed by the EMDEI in the gross exports to ROW, Norway, the Czech Republic, and EU28. The EMDEI in the final exports decreased from 27 kJ/dollar to 38 kJ/dollar to less than 15 kJ/dollar in exports to all the importers. In 2014, the EMDEI in the final exports to Mexico was the highest, followed by the EMDEI in the final exports to Turkey, India, Brazil, Australia, EU28, and the United States, and the EMDEI in final export to Russia was the lowest, followed by the EMDEI in the final exports to ROW, the Czech Republic, Korea, Japan, and Norway. For EMDEI in intermediate exports, the value varied in a wide range among economies, and the value in the intermediate exports to India (in 2001 and 2002) and Korea were largest, whereas the value in the intermediate exports to Russia was lower than that in the intermediate exports to other economies. In 2014, the EMDEI in the intermediate exports to Korea was much higher than that of others, whereas in the intermediate exports to Russia it was the lowest, followed by the United States, Norway, and Japan. Except for Korea, both China’s intermediate and final exports to developing economies have higher export-embodied domestic energy intensities, while its exports to developed economies have lower embodied domestic energy intensities. However, the domestic energy intensity of China’s intermediate and final export to the United States varies highly; the final export to the United States has a higher domestic energy intensity than the final export of other countries. However, in the case of intermediate export, the United States has a lower domestic energy intensity than the intermediate export of other countries; this is because the final products that the United States imports from China are mainly clothing, textiles, and other manufacturing products having a high energy intensity, whereas the intermediate imports include services having a low energy intensity.
Analysis at Sector Aggregate Level
Analysis at the sector level can provide further information about the energy flows embodied in China’s exports according to sector heterogeneity. In this study, we have segregated the decomposition results based on equations (5) and (6) according to 18 sectors, and the results at the sector aggregate level are presented in this section. As mentioned in the previous section, the analysis at the sector level shows a distinction between the forward and backward linkage measures. The forward linkage measure focuses on the source sector, including the energy (or value added) from this sector, and is embodied in the gross exports of other sectors, whereas the backward linkage measure focuses on the export sector, including all the energy (or value added) from other sectors, and is embodied in this given sector’s gross exports.
The domestic value added and energy embodied in each sector’s gross exports are shown in Figure 7. The sector mix differed widely between the forward and backward linkage measures. As for DVA (the embodied domestic value added) based on the forward linkage measure, the top three sectors were S.18 (other service activities), S.16 (wholesale and retail trade, accommodation, and food service activities), and S.10 (manufacture of electrical equipment and products); S.10, S.04 (manufacture of textiles, wearing apparel, and leather products), and S.16 (wholesale and retail trade, accommodation, and food service activities) were the top three sectors based on the backward linkage measure. For DEU (the gross embodied domestic energy) based on the forward linkage measure, S.14 (electricity, gas, steam, and water supply) was undisputedly the largest, followed by S.09 (Manufacture of basic metals and metal products) and S.07 (chemical industry), whereas the top three sectors based on the backward linkage measure were S.10, S.09, and S.07. Except for that S.10 ranks top three in terms of both its contribution to DVA and DEU based on the two measures; there is a mismatch between the main sectors that create the economic benefits from the exports and the main sectors that consume energy for the exports. In general, the light industry and the services create more benefits, whereas manufacturing, such as chemicals and metal products, consumes more energy.
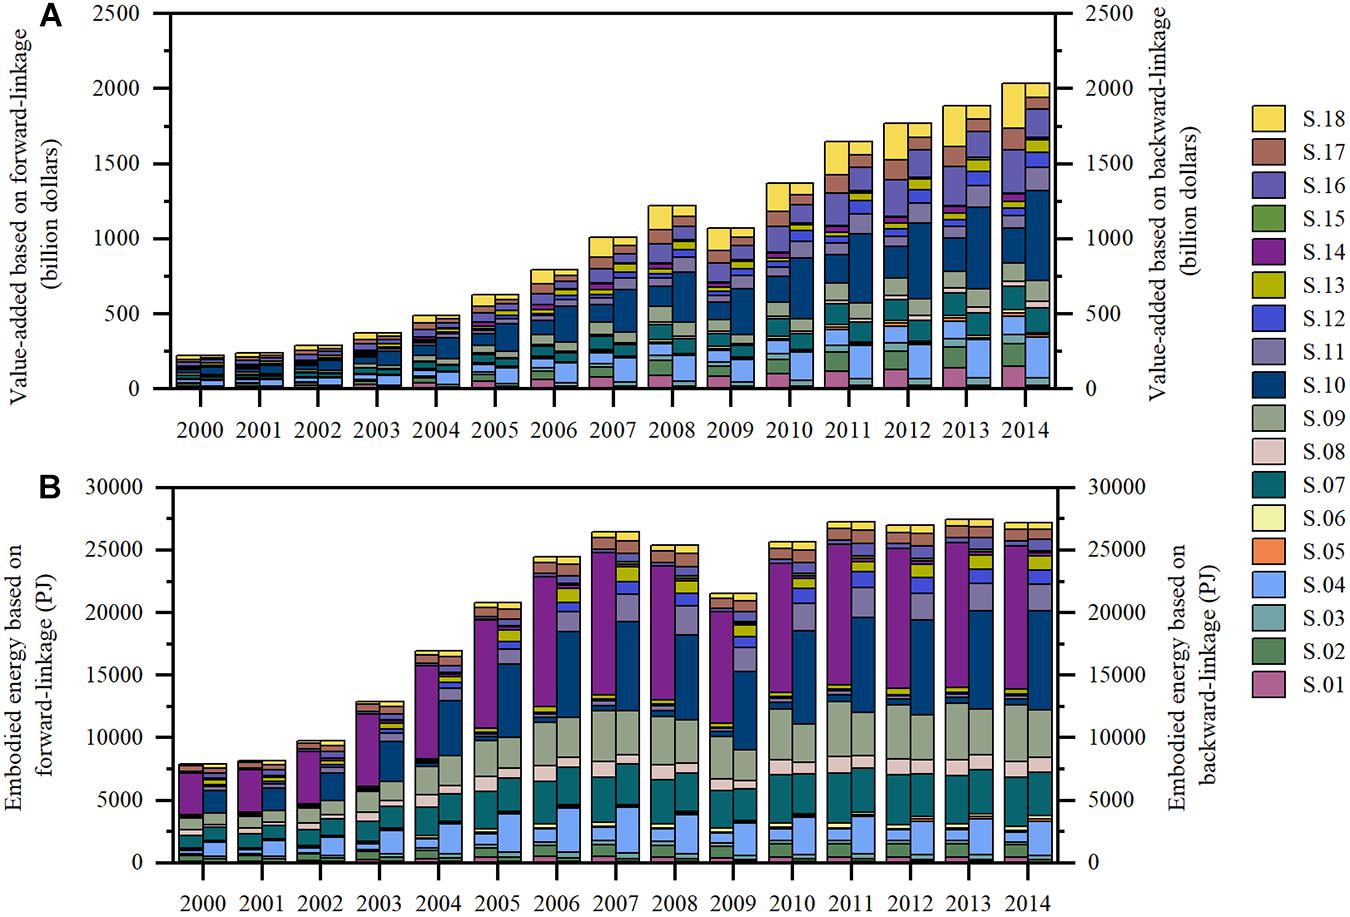
Figure 7. Export embodied domestic value added and domestic energy at sector aggregate level based on forward and backward linkages; graphs are provided for (A) domestic value added embodied in each sector’s export and (B) domestic energy embodied in each sector’s export.
The export patterns of the sectors differ greatly, and Figure 8 presents the GEEFX (energy use embodied in gross final exports) proportion of the GEEX (energy use embodied in gross exports) in each sector (hereinafter referred to as “the proportion” in this section) based on the backward linkage and forward linkage measures. When using the forward linkage measure, the proportions of the sectors can be divided into four grades: the first grade includes S.13 (other manufacturing) and S.04 (manufacture of textiles, wearing apparel, and leather products), of which the proportions were much higher than other sectors (over 75%), implying that the energy in these sectors was almost exported embodied in the final goods; the second grade includes S.03 (manufacture of food products, beverages, and tobacco products), S.10 (manufacture of electrical equipment and products), S.01 (agriculture, forestry, fishing, and related service activities), S.11 (manufacture of machinery and equipment n.e.c), and S.12 (manufacture of transport equipment), of which the proportions ranged between 55% and 70%; the third grade includes S.05 (manufacture of products of wood and cork), S.14 (electricity, gas, steam, and water supply), S.16 (wholesale and retail trade, accommodation, and food service activities), S.06 (manufacture of article, printing, and reproduction), S.18 (other service activities), S.07 (chemical industry), S17 (transportation, warehousing, postal, and telecommunications), S.09 (manufacture of basic metals and metal products), S.02 (mining and quarrying) after 2003, and S.08 (manufacture of other non-metallic mineral products) before 2010, of which the proportions ranged between 40% and 55%; and the last grade included S.15 (construction), S.02 before 2003 and S.08 after 2010, of which the proportions were lower than 40%. The situation differed when using the backward linkage measure, and the proportions of sectors can be clearly divided into three grades: the first grade includes S.13, S.03, and S.04, of which the proportions were higher than 80%, implying that the energy exported through these sectors almost embodied in the final goods; the second grade includes S.11, S.10, S.12, and S.01 for most years, of which the proportions were higher than 50%; the third grade includes the other sectors, of which the proportions were almost lower than 40%, and the proportion of construction sector (S.15) in this grade was approximately 0 for most years because this sector scarcely directly exported products.
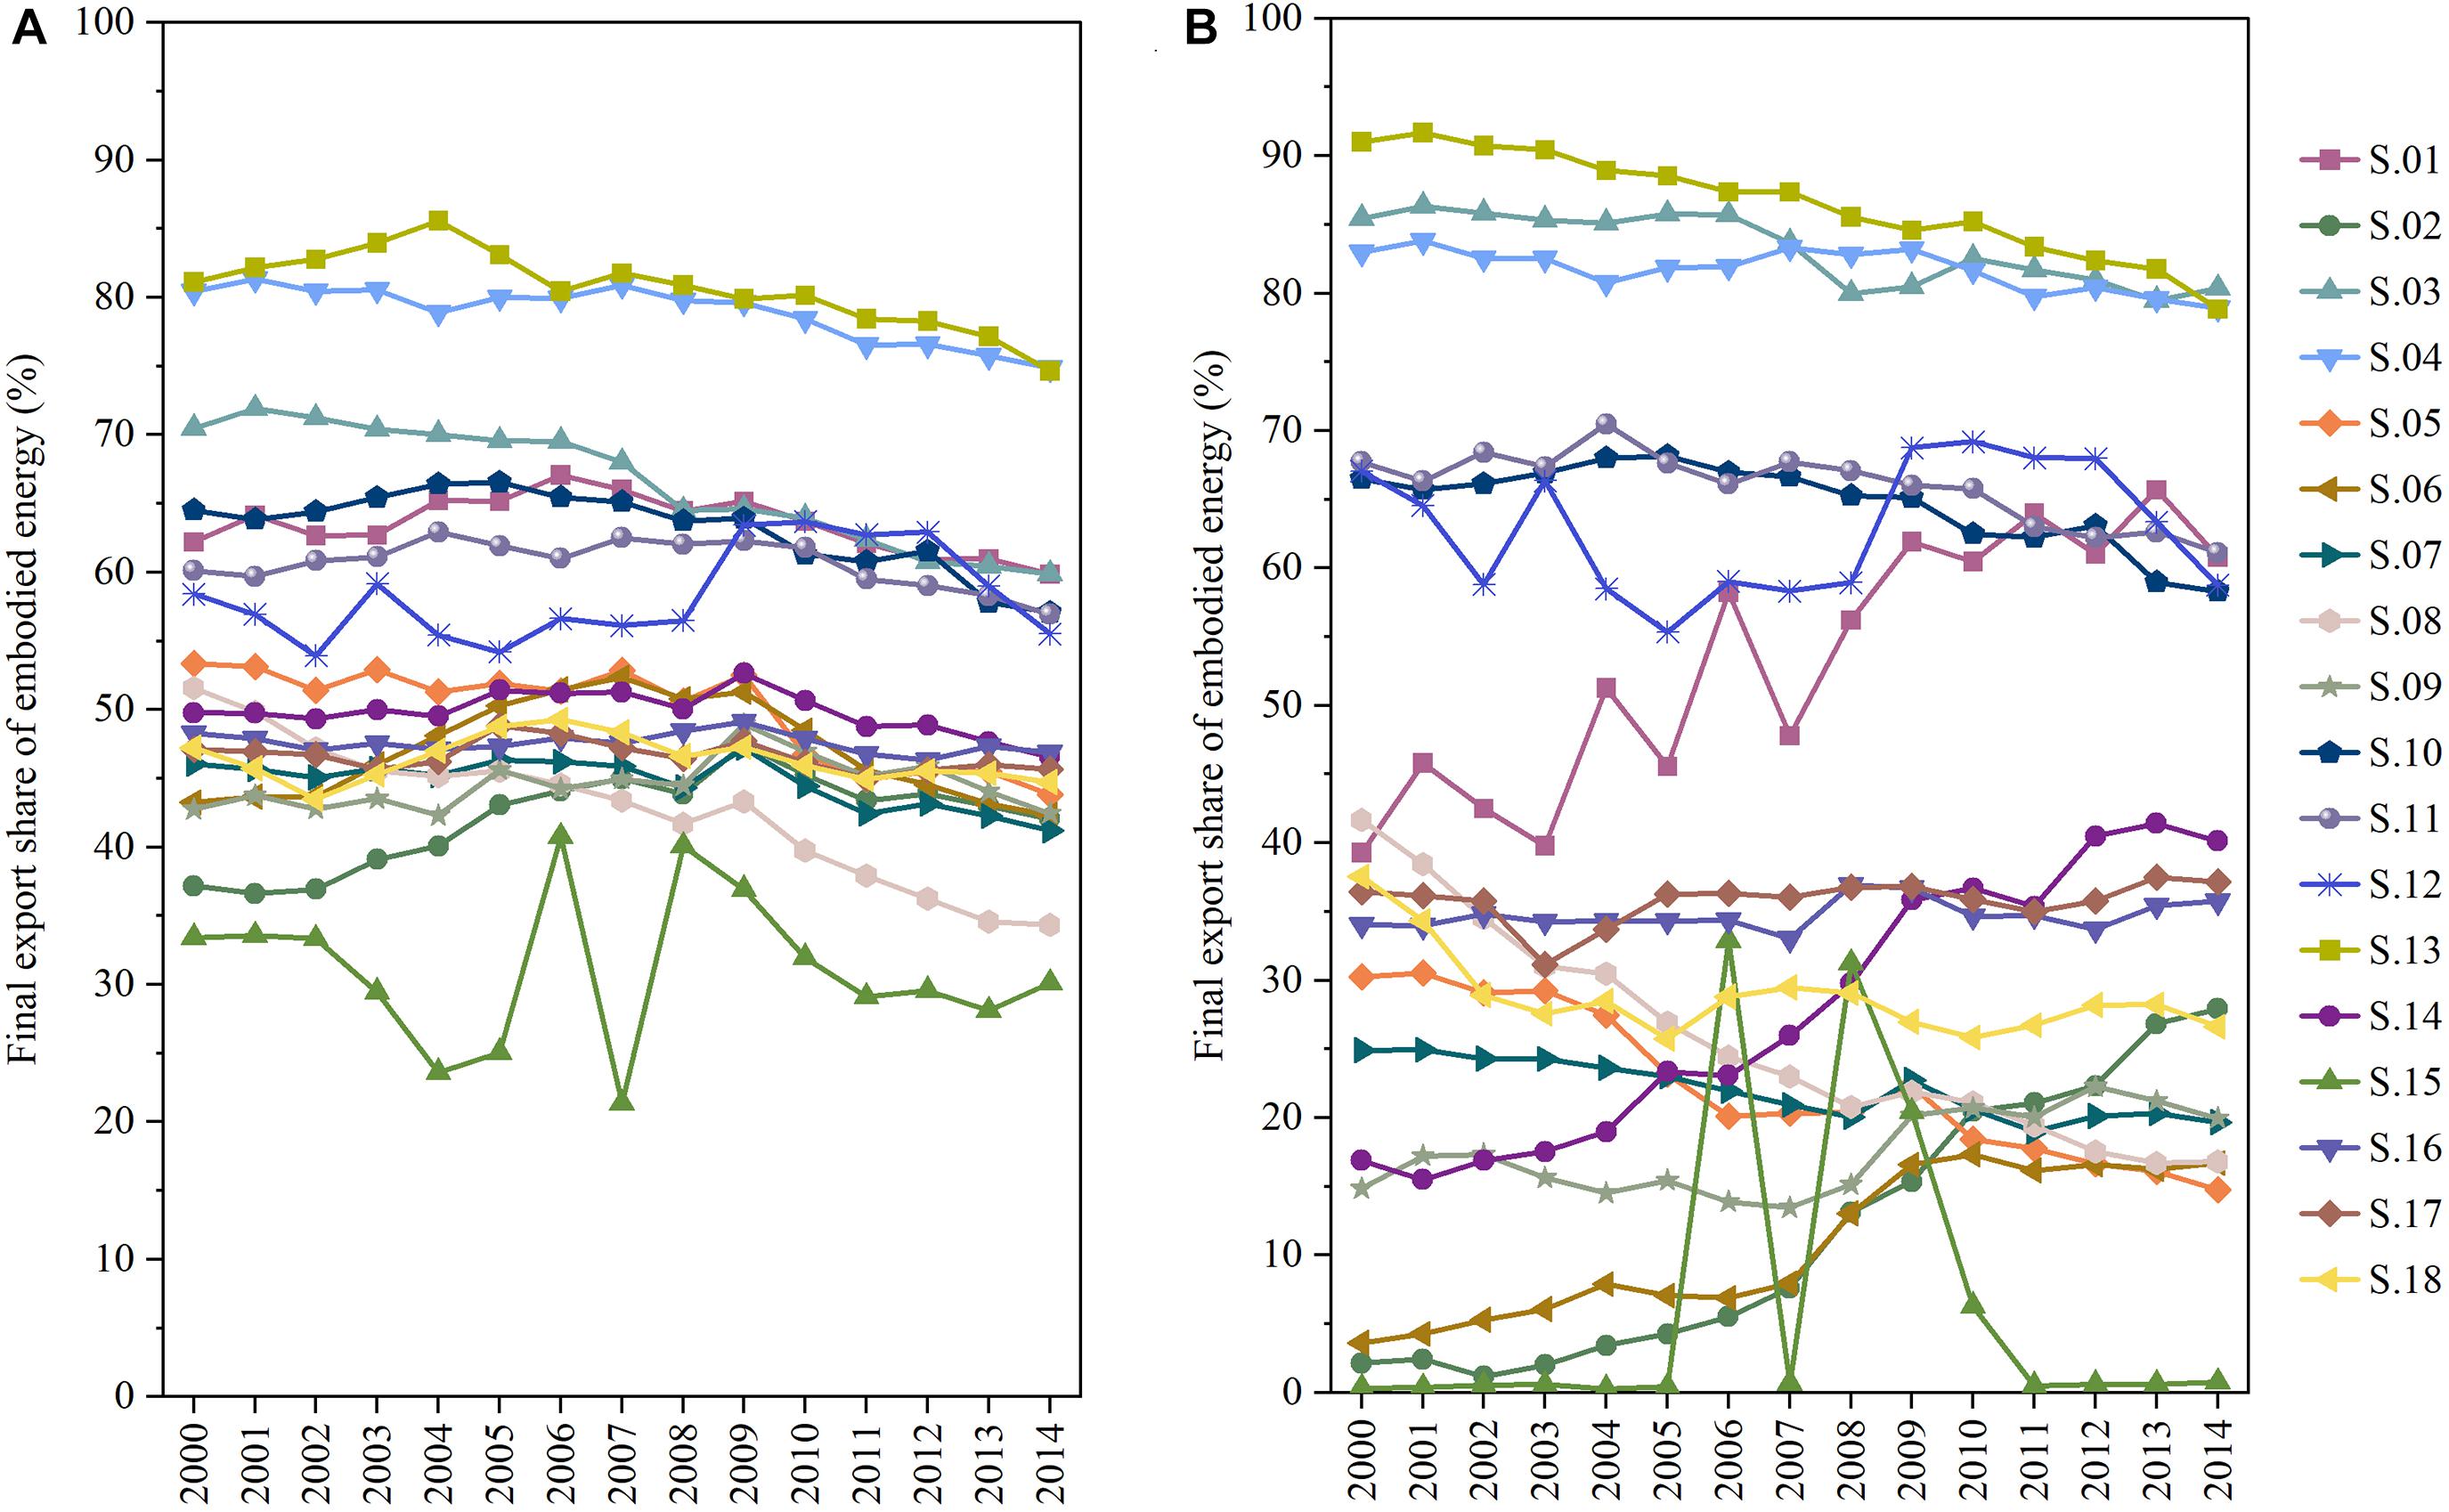
Figure 8. Share of final export embodied energy in the sector’s gross export embodied energy; graphs are provided for (A) forward linkage and (B) backward linkage.
Figure 9 shows the sources of the GEEX in each sector. The domestic source generally dominated each sector’s GEEX, followed by the energy from the third-party, and the share of energy from the direct importer was the least. Based on the forward linkage measure, the sector ranks by domestic source share differed in various years; for example, the domestic energy share of S.02 (mining and quarrying) and S.15 (construction) ranked as the lowest two in 2005 and 2010, respectively, whereas S.13 (other manufacturing) had the lowest domestic source share in 2014. However, when using the backward linkage measure, the sector ranks of the domestic source share were relatively stable, and S.14 (electricity, gas, steam, and water supply), S.02, S.08 (manufacture of other non-metallic mineral products), and S.09 (manufacture of basic metals and metal products) ranked in the top four, and S.10 (manufacture of electrical equipment and products) occupied the bottom position.
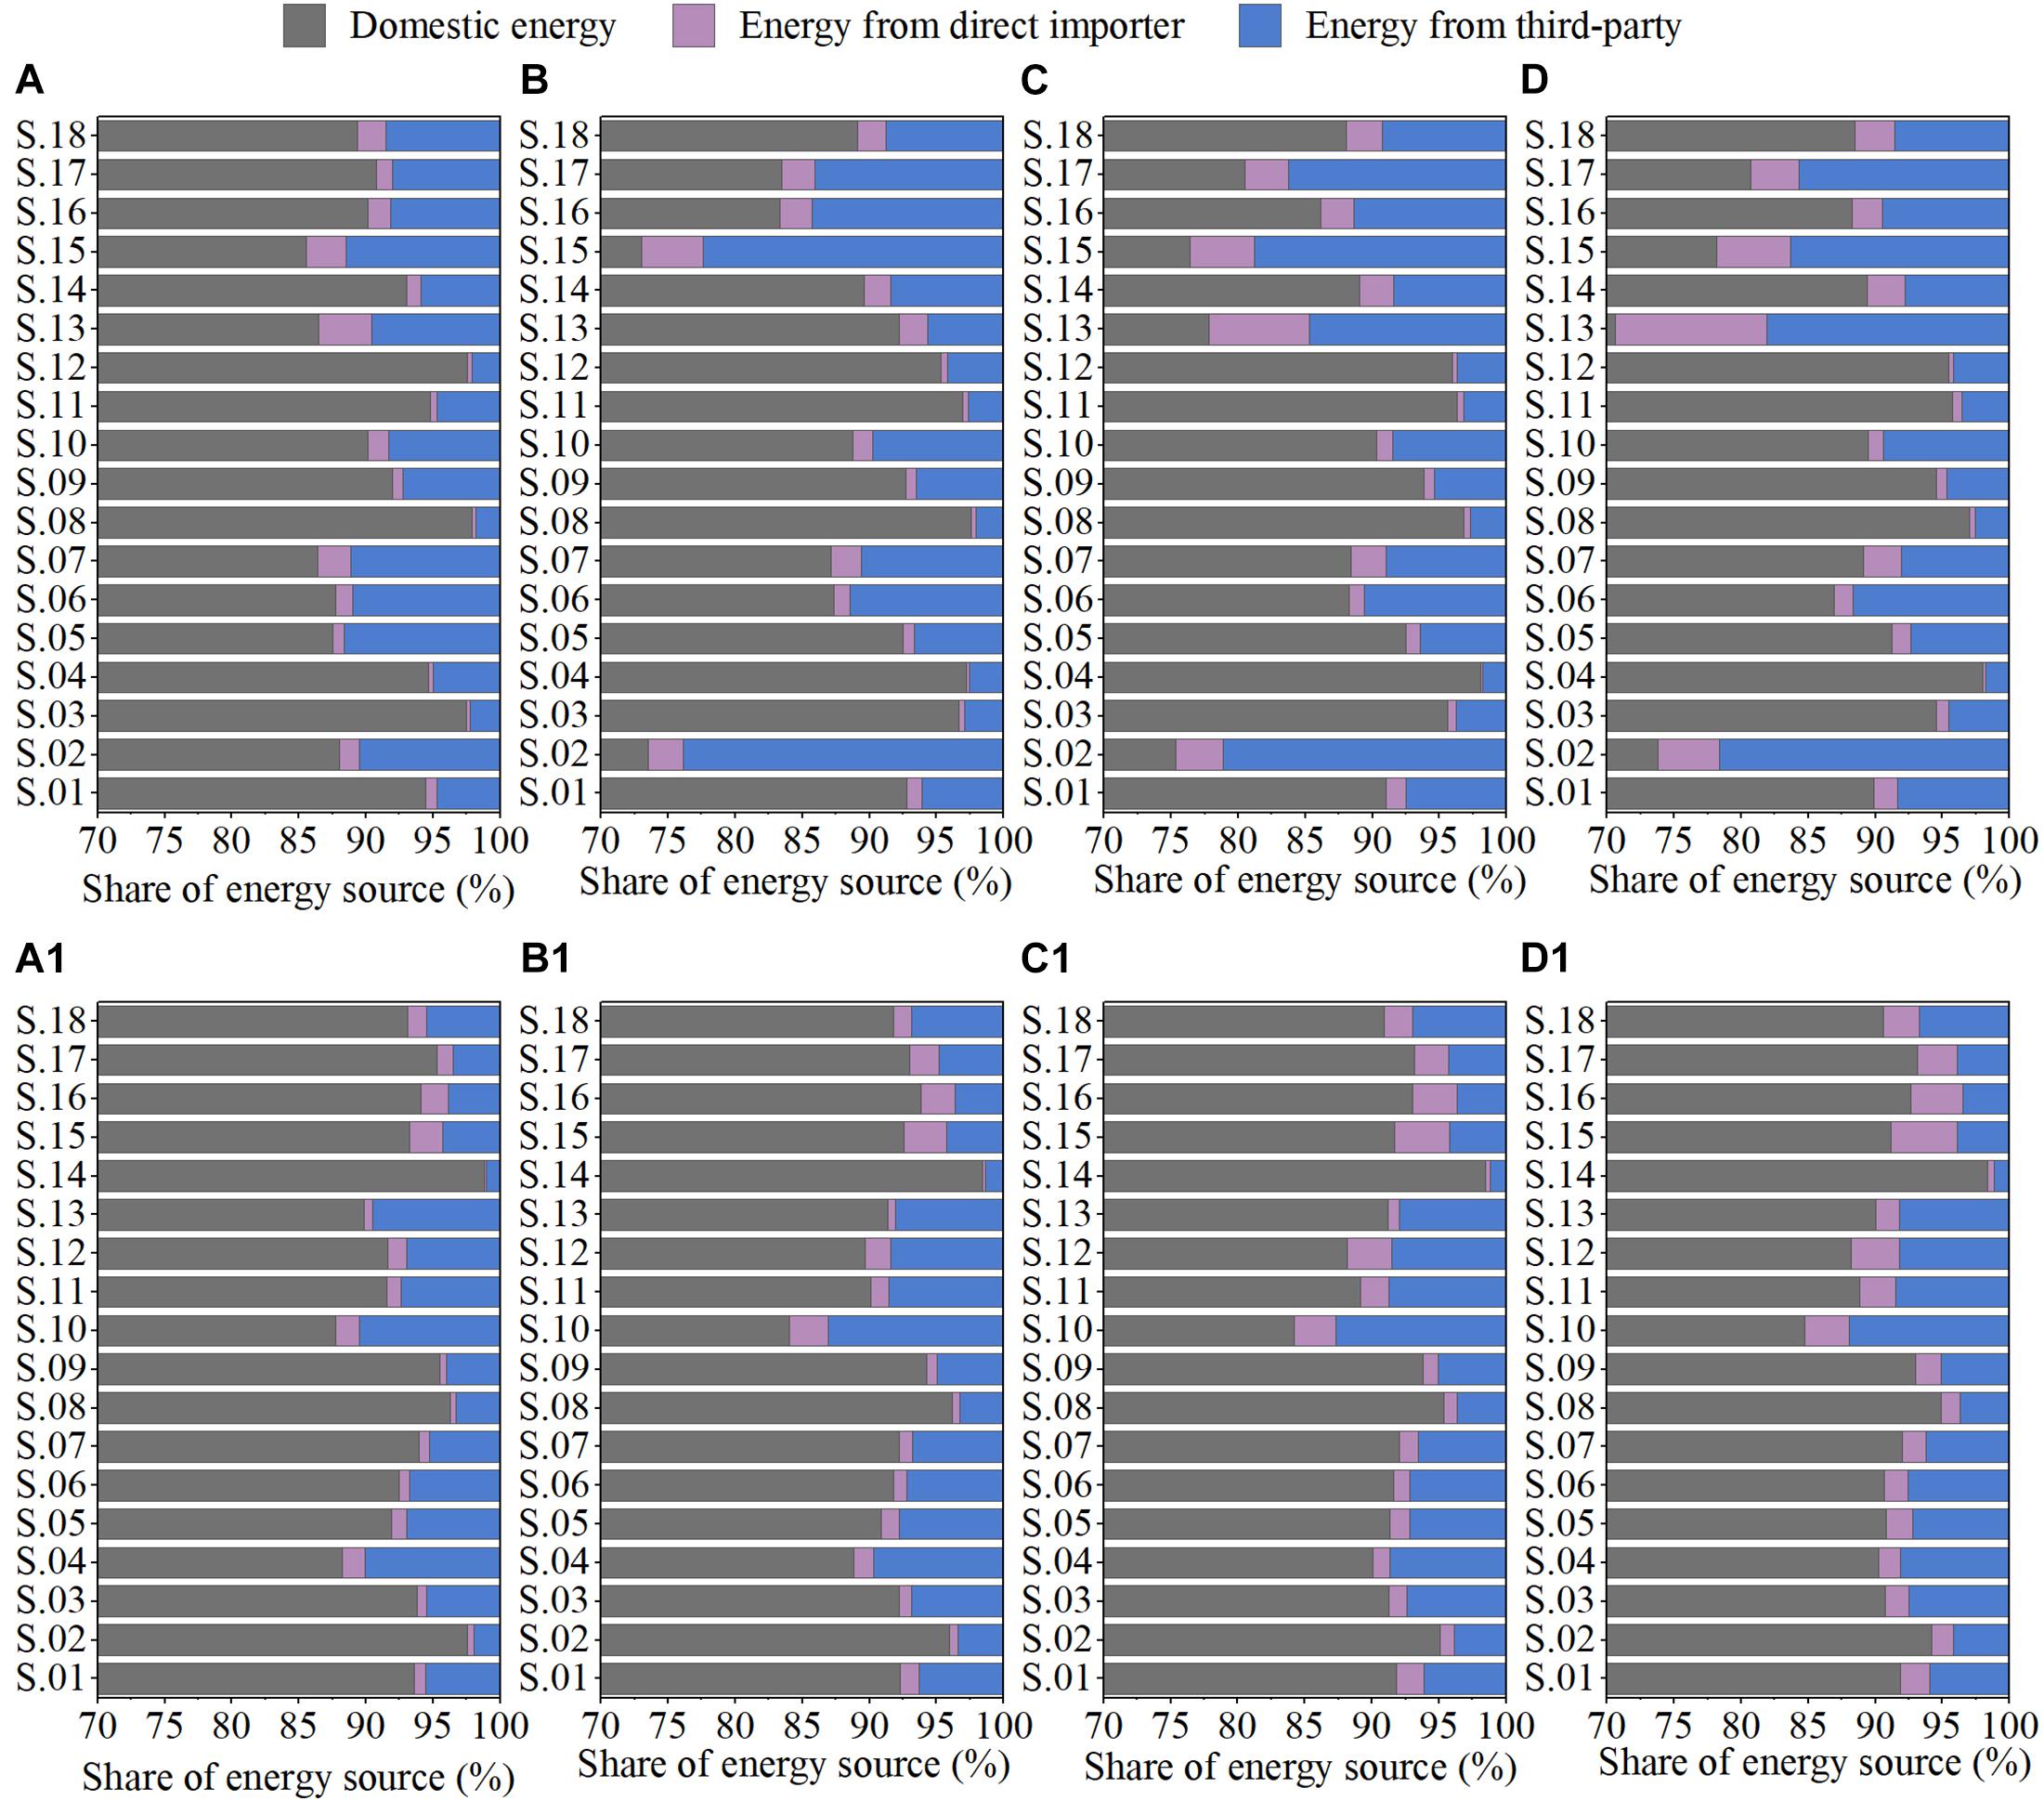
Figure 9. Embodied energy source of each sector’s export; graphs are provided for forward linkage-based measure in (A) 2000, (B) 2005, (C) 2010, and (D) 2014 and backward linkage-based measure in (A1) 2000, (B1) 2005, (C1) 2010, and (D1) 2014.
Figure 10 presents the share of destinations where the DEU of each sector is finally absorbed. Based on the forward linkage measure, over 75% of the DEU in each sector was absorbed by the direct importers, and the proportions in S.13 (other manufacturing), S.04 (manufacture of textiles, wearing apparel, and leather products), S.03 (manufacture of food products, beverages, and tobacco products), and S.01 (agriculture, forestry, fishing, and related service activities) ranked in the top four. In general, the share that finally returned home grew over time. The share that was finally absorbed by the third-party was higher in S.02 (mining and quarrying), S.07 (chemical industry), and S.09 (manufacture of basic metals and metal products) than in other sectors. When using the backward linkage measure, the share of DEU that was absorbed by the direct importer in S.13, S.03, S.04, and S.01 ranked in the top four, similar to the results obtained using the forward linkage measure; the shares in S.02 and S.09 ranked the lowest in 2000 and 2005, whereas S.07 took the place of S.09 in 2010 and 2014. The share that finally returned home also grew over time in most of the sectors, and this share in S.02, S.07, and S.09 was relatively larger than in other sectors. The share that was finally absorbed by the third-party in S.02, S.07, and S.09 ranked in the top three, whereas the share in S.03, S.04, and S.13 ranked in the bottom three.
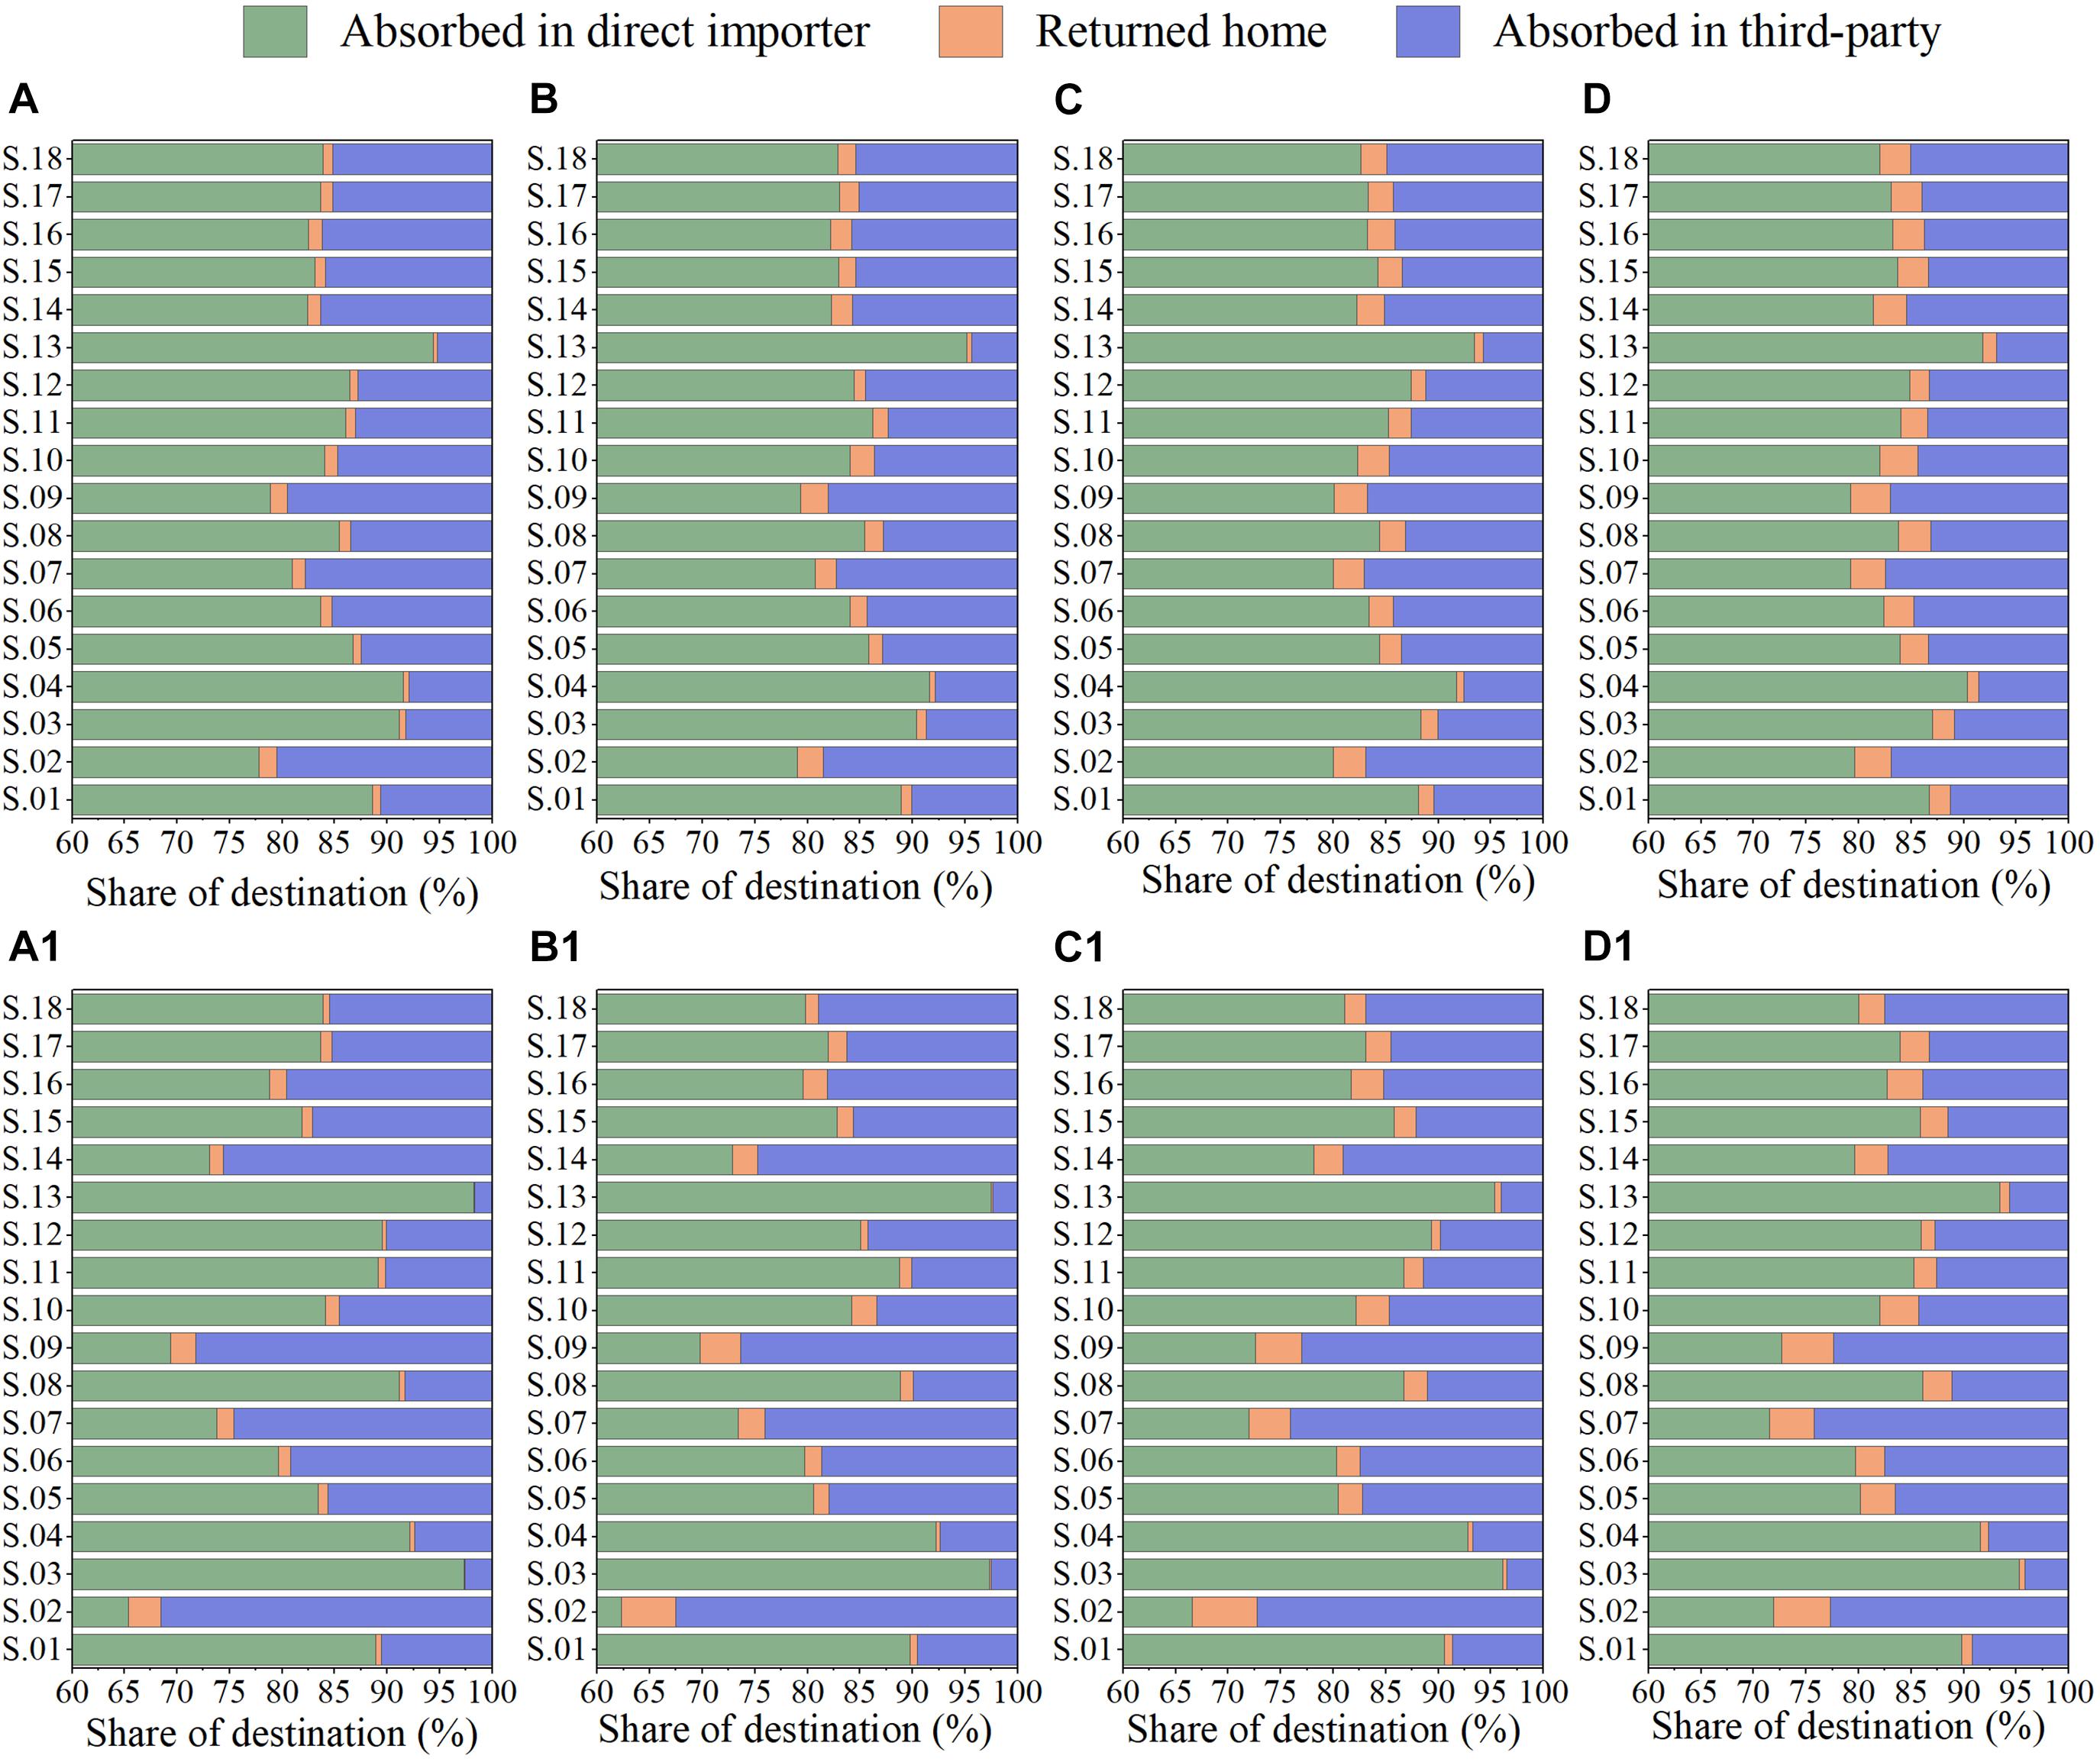
Figure 10. Embodied domestic energy destination of each sector’s export; graphs are provided for forward linkage-based measure in (A) 2000, (B) 2005, (C) 2010, and (D) 2014 and backward linkage-based measure in (A1) 2000, (B1) 2005, (C1) 2010, and (D1) 2014.
The sector EMDEI measures the domestic energy use for creating a unit of domestic value added through exports, that is, the energy cost of economic income derived from the exports for each sector, and the result is shown in Figure 11. Moreover, the forward linkage-based EMDEI of a sector actually means the energy use in this sector for the country to create a unit domestic value added through exports. Based on this measure, the EMDEI of S.14 (electricity, gas, steam, and water supply) was much higher than the value of other sectors, and the value in 2014 was approximately 230 kJ/dollar, equivalent to 40% of the value in 2000. The EMDEI of S.08 (manufacture of other non-metallic mineral products) ranked second, declining from 102 kJ/dollar in 2000 to 40 kJ/dollar in 2014, and different from the tortuous downward trend of other sectors, the value of this sector smoothly ascended to the peak in 2004 to later decline. The EMDEIs of S.09 (manufacture of basic metals and metal products) and S.07 (chemical industry) ranked third and fourth, respectively, and that of S.06 (manufacture of article, printing, and reproduction) stably ranked fifth after 2005. In 2014, except for the top five sectors, S.13 (other manufacturing) had the highest value, followed by S.02 (mining and quarrying), S.04 (manufacture of textiles, wearing apparel, and leather products), and S.05 (manufacture of products of wood and cork). The value of S.16 (wholesale and retail trade, accommodation, and food service activities) was the lowest, followed by those of S.15 (construction) and S.10 (manufacture of electrical equipment and products).

Figure 11. Export embodied domestic energy intensity of each sector; the graphs are provided for (A) forward-linkage based measure and (B) backward-linkage based measure.
The backward linkage-based EMDEI of each sector calculates the energy use to create a unit domestic value added in the whole country through exports in this sector. Based on this measure, the EMDEI of S.14 was much higher than the value of other sectors, but much lower than the value based on the forward linkage measure. The EMDEIs of S.08, S.09, and S.07 ranked second, third, and fourth, respectively, the same as the forward linkage-based measure, and the EMDEIs of other sectors showed a downward trend and were generally higher than those based on the forward linkage measure. In 2014, except for the mentioned top four sectors, the EMDEI of S.06 was the highest, followed by that of S.02 and S.15, whereas the value of S.16 was the lowest, followed by that of S.18 (other service activities), S.01 (agriculture, forestry, fishing, and related service activities), and S.03 (manufacture of food products, beverages, and tobacco products). In addition, the EMDEIs of the chemical industry and metal and non-metallic equipment manufacturing industries were the highest (based on the forward and backward-linkage measures), implying that these sectors need to pay the greatest cost of energy when China creates domestic economic benefits through exports. The costs of energy were also higher for these sectors to create economic income through exports than as compared to other sectors. Therefore, improving the export structure and reduce the proportion of these sectors’ products in total exports, as well as fundamentally improving the technical level of these sectors and promote their energy efficiency in production are conducive for China’s energy conservation.
Analysis at Sector-Country Level
The results at the country aggregate and bilateral country levels are presented in the previous subsections, along with the results obtained at the sector aggregate level. Figure 12 shows the energy flows embodied in China’s export at the sector-country level in 2000 and 2014. In each chord diagram, the nodes in the upper half (proceeding clockwise from “S.01” to “S.18”) represent the DEU in each sector’s export (based on backward linkage measure), and “Foreign energy” represents the foreign energy embodied in China’s export; these nodes are source nodes, representing the energy sources of China’s GEEX (energy embodied in gross exports). The nodes proceeding clockwise from “CHN” to “Third-party” in the lower half represent the destinations where the embodied energy is finally absorbed. The destination node of “CHN” represents the DEU (domestic energy embodied in exports) that is exported at first and finally returns home and is absorbed by China; the node of “Third-party” represents the gross value of the DEU that was absorbed by the third-party. The lines from the source nodes to the destination nodes represent the scales of the embodied energy flows.
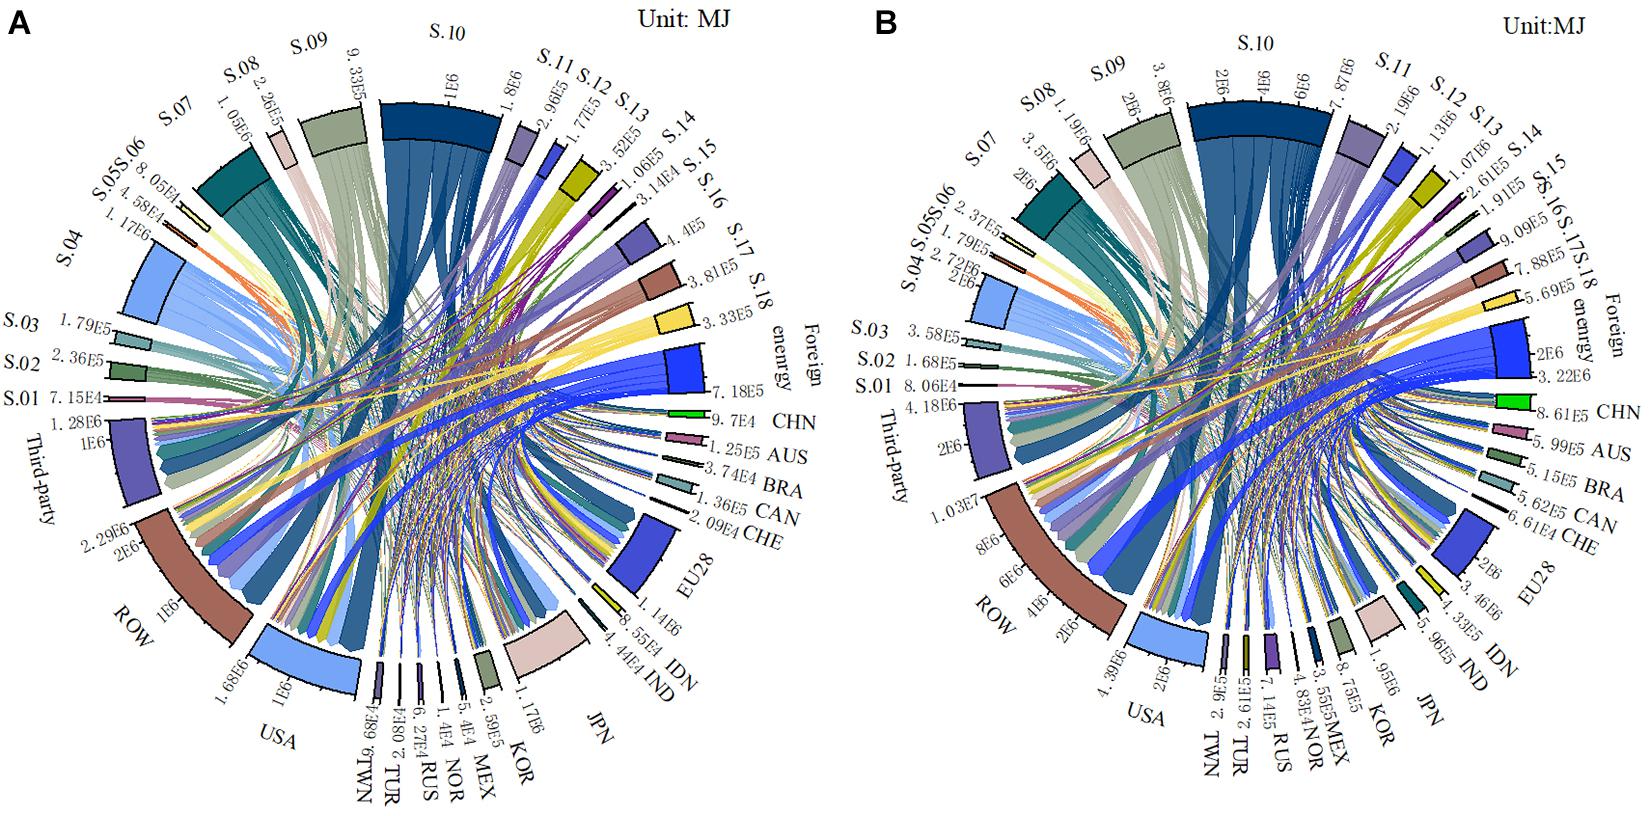
Figure 12. Embodied energy flows in China’s export at the sector-country level; graphs are provided for (A) 2000 and (B) 2014.
As shown in Figure 12, the details of the results over these two years vary significantly; a few examples are given below. Comparing the results of 2014 to 2000, the scale of China’s GEEX increased, and the foreign energy share also slightly increased. The share of the DEU that returned home also increased significantly; the main sources were S.09 (manufacture of basic metals and metal products) and S.10 (manufacture of electrical equipment and products). The sector share decreased evidently in S.01 (agriculture, forestry, fishing, and related service activities), S.02 (mining and quarrying), S.03 (manufacture of food products, beverages, and tobacco products), S.04 (manufacture of textiles, wearing apparel, and leather products), S.16 (wholesale and retail trade, accommodation, and food service activities), S.17 (transportation, warehousing, postal, and telecommunications), and S.18 (other service activities), while increased obviously in S.08 (manufacture of other non-metallic mineral products), S.09, S.10, S.11 (manufacture of machinery and equipment n.e.c), and S.12 (manufacture of transport equipment). The destinations of sectors also varied, and some sectors showed their unique distribution of destinations, while for other sectors, the distribution of importers was ranked by their gross import volume from China. For instance, the GEEX of S.13 (other manufacturing) was mainly absorbed by the United States and EU28, while the ROW was China’s largest importer in 2000. The share of S.13 to ROW increased evidently. In general, the GEEX was mainly absorbed by the EU28, ROW, and third-party in both years.
Overall, the United States and EU28 have been China’s largest energy importers, except for the ROW and Japan (whose share fell sharply in 2014). Therefore, this study further analyzes these two key importers more specifically. The detailed energy flows embodied in China’s export to the United States in 2014 are shown in Figure 13, and the energy flows embodied in China’s exports to the United States in 2000 and exports to EU28 in 2000 and 2014 can be found in Supplementary Figures 5–7.
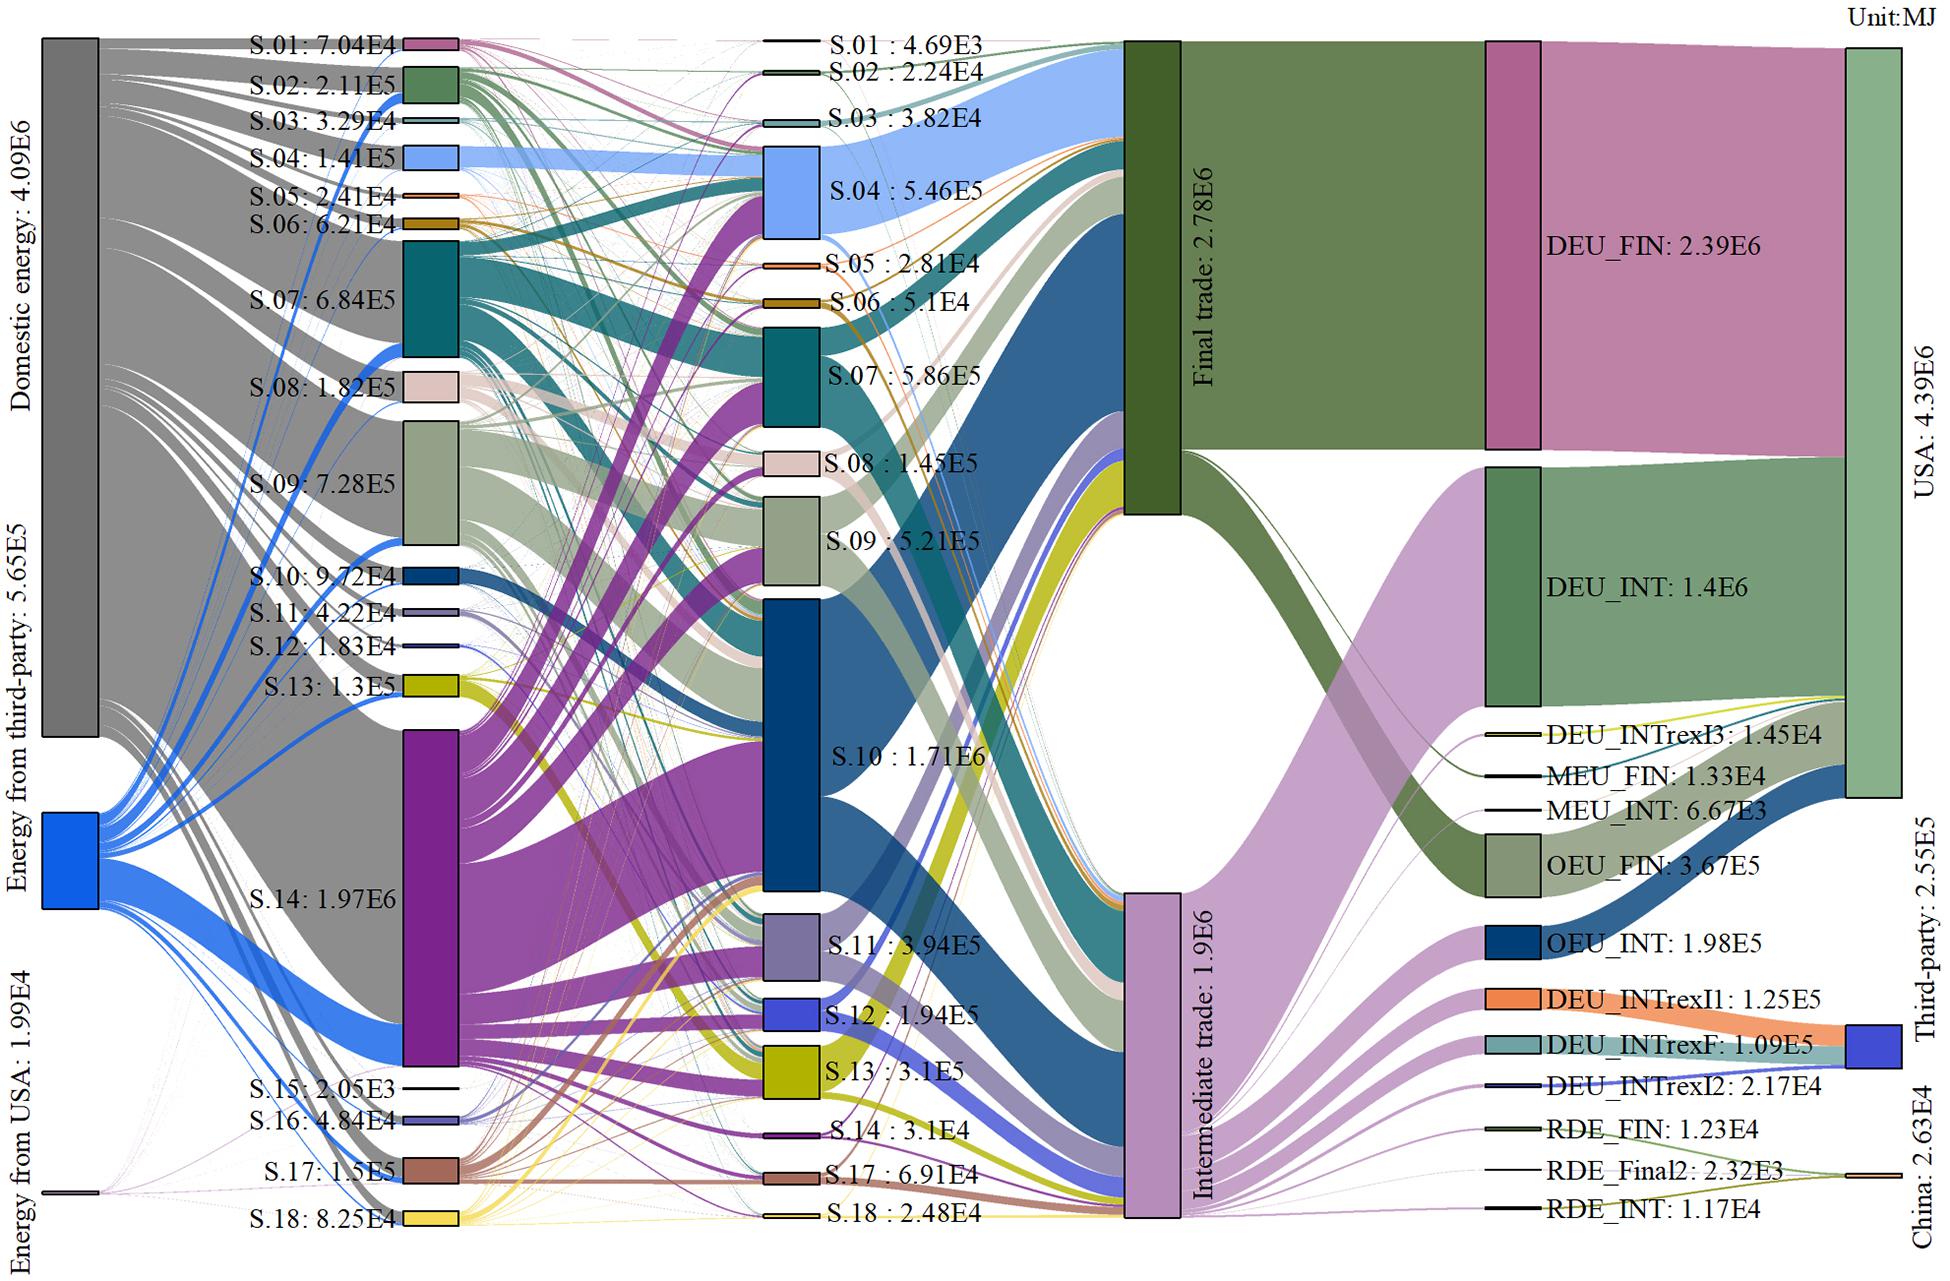
Figure 13. Energy flows embodied in China’s export to the United States in 2014.
As shown in Figure 13, from left to right, the first column represents t, which is the total energy embodied in China’s export to the United States in 2014 from different sources, including domestic energy (that is, from China), energy from third-party (that is from other countries and regions except for China and the United States), and energy from the United States itself. The second column represents the forward linkage sectors that initially consume domestic energy (or foreign energy in intermediates) to produce products. The line between domestic energy and each sector is the domestic energy directly used for each sector’s production, while the other two sources are the foreign intermediate goods directly used for each sector’s production. The third column represents the backward linkage sectors that finally export products to the United States, and the line from the second column to the third column is the flow of the total energy embodied in China’s exports to the United States in the domestic value chain stage. The fourth column shows the export patterns, that is, the energy embodied in the final products and embodied in the intermediate products. The fifth column contains 13 parts, which are the 13 terms in GEEX decomposition framework of this article, and represents the transfer routes of the embodied energy flows. The last column represents the final destination where the embodied energy of China’s exports is finally absorbed, including energy that is absorbed in the United States, energy that is absorbed by third parties (other countries and regions except for China and the United States), and energy that returns to China and is absorbed.
Comparing the results of exports to the United States for the year 2014 (referring to Figure 13) with that of 2000 (referring to Supplementary Figure 5), the overall size of the embodied energy flows increased by a factor of 1.5, whereas the share of domestic sources decreased slightly and the share of third-party sources increased. The sector mix based on both the forward and backward linkages changed in a way. The top five source sectors were S.14 (electricity, gas, steam, and water supply), S.07 (chemical industry), S.09 (manufacture of basic metals and metal products), S.08 (manufacture of other non-metallic mineral products), and S.02 (mining and quarrying) in 2000, while changed slightly to S.14, S.09, S.07, S.02, and S.08 in 2014. The top five export sectors were S10 (manufacture of electrical equipment and products), S.04 (manufacture of textiles, wearing apparel, and leather products), S.13 (other manufacturing), S.07, and S.09 in 2000, while S.10, S.07, S.04, S.09, and S.11 (manufacture of machinery and equipment n.e.c) ranked in the top five in 2014. In addition, no energy was exported to the United States through S.15 (construction) and S.16 (wholesale and retail trade, accommodation, and food service activities). Furthermore, the share of energy embodied in the intermediate exports increased obviously in 2014. As for the final destination, the share of domestic energy absorbed by the United States decreased slightly, whereas that of the other two increased slightly.
At the sector level, the structures of energy source sectors and export sectors were relatively different. In 2014, as for the source sector, S.14 (electricity, gas, steam, and water supply), S.09 (manufacture of basic metals and metal products), and S.07 (chemical industry) contributed the most, whereas S.10 (manufacture of electrical equipment and products), S.07, and S.04 (manufacture of textiles, wearing apparel, and leather products) exported the most. There were also significant differences in the transfer between the forward and backward sectors. For example, the energy used in S.04 was mainly exported to the United States through S.04 itself, but the energy used in S.14 was mainly exported through other sectors. In addition, the energy used in S.15 (construction) and S.16 (wholesale and retail trade, accommodation, and food service activities) was exclusively exported to the United States through other sectors. Trade patterns also differed among the sectors, as the exports of S.04, S.10, and S.13 (other manufacturing) were mainly through final goods while intermediate export was the main way for the export of S.07, S.12 (manufacture of transport equipment), and S.17 (transportation, warehousing, postal, and telecommunications).
Comparing the results of exports to the EU28 for the year 2014 (referring to Supplementary Figure 7) with those obtained for 2000 (referring to Supplementary Figure 6), it can be found that the overall scale of the embodied energy flows increased by 2.4 times, whereas the share of domestic source decreased, and the share of the third-party source and energy from EU28 itself both increased. There were no significant changes in the source sector mix, except for an obvious increase in S.13 (other manufacturing) and a decrease in S.08 (manufacture of other non-metallic mineral products) and S.17 (transportation, warehousing, postal, and telecommunications). The top five export sectors were S.10 (manufacture of electrical equipment and products), S.07 (chemical industry), S.04 (manufacture of textiles, wearing apparel, and leather products), S.09 (manufacture of basic metals and metal products), and S.18 (other service activities) in 2000, but changed to S.10, S.07, S.09, S.04, and S.11 (manufacture of machinery and equipment n.e.c) in 2014. The share of the energy embodied in the final exports increased obviously, whereas that of the intermediate exports decreased. As for the final destination, the share of the domestic energy that was absorbed by the EU28 decreased evidently, and the shares that returned home and was finally absorbed by the third-party both increased.
In 2014, as for the source sectors, S.14 (electricity, gas, steam, and water supply), S.09 (manufacture of basic metals and metal products), and S.07 (chemical industry) contributed the most, while S.10 (manufacture of electrical equipment and products), S.07, and S.09 exported the most as the backward sectors. Notably, the embodied energy flows of China’s exports to EU28 differed considerably from those of China’s exports to the United States in various details. For instance, the source sector structures in both cases were similar; although the backward sector mix was similar in 2014, it differed widely in 2000. S.18 (other service activities) accounted for a significant share of the gross embodied energy flows from China to EU28 as a backward sector, sourcing from S.14 and S.18 itself, while the embodied energy of China’s exports to the United States seldom flows through S.18 directly. Furthermore, there were some energy flows exported to EU28 through S.15 (construction) and S.16 (wholesale and retail trade, accommodation, and food service activities) despite a decrease in the share in 2014, whereas in the case of United States, there was no direct export through these two sectors. Another difference is the trade pattern of S.10 (in the case of EU28), the export pattern of S.10 was represented by a 50/50 split between the final and intermediate exports in 2014. Additionally, the share of intermediate exports in 2014 increased evidently compared with the share in 2000, which is inconsistent with the evolution of the export trade pattern distribution of China’s total exports to EU28. However, in the case of exports to the United States, the evolution of the export trade pattern of S.10 was consistent with the trend of China’s total exports to the United States, showing the trend of an increase in the intermediate export exports.
Discussion and Implications
At the country aggregate level, China exported a large amount of embodied energy, while other countries avoid a large amount of domestic energy use by consuming China’s products. Since the energy data used in this study are emission-related energy use, it suggests that China also exported large amounts of carbon emissions to meet the demand for other countries and regions, which shows that China’s exports have changed the global energy consumption and carbon emission pattern to a certain extent. Taking both the embodied energy and the economy into consideration, the role of exports in China’s economic development and energy consumption showed an initial rise followed by a decline, while peaking in 2006. Moreover, according to the decomposition of China’s gross exports, there is a growing share of pure double countings, which cannot be recognized and excluded in the traditional gross value accounting and lead to an overestimation of the gross exports volume. Thus, the TiVA accounting and global value-chain theory used in this study do perform better in international trade analysis. The share of domestic energy in the two patterns of trade, that is, the final exports and intermediate exports, was similar to the trade pattern share of value added. Each of these two export routes accounted for approximately half of the gross value of the exports, which was inconsistent with the trend that the share of intermediate trade was in a rapid expansion globally, due to China’s downstream position in the global value chain and its participation in global production through the processing and assembly of supplied materials. The ratio of domestic content in gross exports indicates the ability to create value added per unit of energy consumption. The ratio rising means that there are some local market advantages, such as a low cost of transportation or low cost of high-skilled labor (Liu et al., 2020a). The ratio of domestic content in China’s gross export showed a decreasing trend before 2007 and an increasing trend thereafter, reflecting the growing competitiveness of China’s exports in the later study period. The higher the proportion of domestic components of embodied energy, on the one hand, it can be considered that exports are more dependent on domestic energy supply, or that the domestic self-sufficiency rate of export embodied energy is relatively high. But from another point of view, about 90% of the fossil energy embodied in China’s exports is supplied domestically, indicating that China mainly acts as a supplier of fossil energy in its export production and its participation in the global value chain. The energy intensity of the export products was higher than that of products consumed domestically, which further reflected that China’s export product structure tended to be highly energy-dependent; the domestic energy intensity of the intermediate exports was higher than that of the final exports, indicating that China needs to pay more energy cost to obtain economic benefits through the export of intermediate goods more than that of final goods. This result suggests that China’s participation in global production is more inclined towards high-energy consumption, even upstream of the production chain, and is more inclined to be an energy supplier with high-energy consumption and low income, rather than to be in the research and development stage of low-energy consumption and high income. Previous literature has shown that China’s energy intensity and carbon intensity are higher than those of many developed countries. Developed countries imported products with high energy intensity and carbon intensity from China to reduce their domestic energy use and carbon emissions and to reach their carbon emission reduction targets. However, from a global point of view, the imbalances of energy and carbon intensities between China and developed countries may lead to a growth of global carbon emissions, which increases the risk of global carbon leakage. Thus, optimizing the energy structure and declining the energy intensity of China’s exports are conducive to energy conservation and emission reduction in China and the whole world.
At the bilateral country level, the United States and EU28 are the top two importers, and the shares of Brazil, India, and Indonesia are also increasing. The embodied energy is exported to developed economies mainly through final goods, and to developing economies mainly through intermediates. Russia is a special case because China’s exports to Russia are mainly concentrated in the fields of clothing, instruments, mechanical and electrical transport equipment, raw materials, chemical products, and agricultural products; these are mainly final goods. Compared with China’s exports to other importers, China’s export structure to South Korea is more in favor of energy-intensive intermediates. The exports to Korea are mainly concentrated in low-end mechanical and electrical products, base metals, and chemical products, and the export structures can be further improved. The embodied domestic energy intensities of China’s intermediate exports differ significantly among importers, whereas the energy intensities of the final exports differ slightly, which is due to the greater difference in the importer distribution of China’s intermediate exports. Except for Korea, both China’s intermediate and final exports to developing economies, such as Mexico, India, Indonesia, and Turkey, have higher export-embodied domestic energy intensities, while its exports to developed economies, such as Norway, Japan, EU28, and the Czech Republic have lower embodied domestic energy intensities. Therefore, the international trade between China and emerging markets needs to be emphasized and embodied flows of fossil fuel energy and carbon emissions in these trades may be an increasingly important factor of global emission reduction.
At the sector aggregate level, there is a big difference based on the forward and backward linkage measures, whether for embodied value added analysis or embodied energy analysis. In general, the light industries and the services create more benefits, whereas manufacturing sectors, such as chemicals and metal products, consume more energy. There is a mismatch between the main sectors that create the economic benefits from the exports and the main sectors that consume energy for the exports. In fact, the transfer process between the forward-linkage sectors and backward-linkage sectors of energy flows is the energy transfer process in domestic value chains. The imbalances between the forward linkage and backward linkage measures are the effects of domestic value chains. Thus, the differences between the forward and backward linkage measures at the sector level deserve more attention. S.14 (electricity, gas, steam, and water supply) is the upstream sector of the production chain, and most of the energy embodied in exports is initially consumed in this sector. The energy in S.15 (construction) is almost exported embodied in the export of other sectors, and thus is easily neglected in the research of energy export. The construction sector is a special sector that needs attention in the study of export embodied energy. The domestic energy embodied in the exports of S.02 (mining and quarrying), S.07 (chemical industry), and S.09 (manufacture of basic metals and metal products) are more often absorbed by the third-party than the domestic energy embodied in other sectors’ exports, because the production chains related to these sectors are longer, and thus, it is easier for these sectors to participate in global production. Therefore, enhancing the competitiveness of these sectors in global trade and promoting the energy efficiency of their productions are conducive to improving China’s position in the global value chain and achieve the country’s goal of energy reduction. The EMDEI of S.14 is significantly higher than that of other industries, and the energy consumption of this sector is mainly due to the production of electricity; therefore, optimizing the power supply structure of China may effectively improve China’s export embodied energy intensity, and is conducive to China’s energy conservation and emission reduction. In addition, the EMDEIs of the chemical industry and metal and non-metallic equipment manufacturing industries are the highest (based on the forward and backward-linkage measures), implying that these sectors need to pay the greatest cost of energy when China creates domestic economic benefits through exports. Additionally, the costs of energy are also higher for these sectors to create economic income through exports than as compared to other sectors. Therefore, improving the export structure and reducing the proportion of these sectors’ products in total exports, as well as fundamentally improving the technical level of these sectors and promoting their energy efficiency in production are conducive to China’s energy reservation and emission reduction, as well as to the global emission reduction.
At the sector-country level, the domestic energy embodied in some sectors showed a unique distribution of destinations, although, for many sectors, the distribution of importers was ranked by their total import volume from China. In addition, the energy source and export sectors have extremely different structures, and the energy flows from the source sector to the export sector reflect the embodied energy transfer routes in the domestic supply chain. The embodied energy flows of China’s exports to the EU28 are relatively different from those in exports to the United States. Although EU28 and the United States are both major importers of China, the flow routes of the export embodied energy vary significantly, and even in their domestic value chain stage, the flow routes between the source and export sectors are different.
Conclusion and Outlooks
This study presents a detailed analysis of the energy embodied in China’s exports at the country aggregate, bilateral country, sector aggregate, and sector-country levels in terms of the gross value, trade patterns, energy sources, and domestic energy destinations. The export embodied domestic energy intensity is calculated to show the energy cost required to create a unit domestic value added through exports. The major conclusions are as follows.
(1) In terms of total volume, China’s export embodied energy is very large, and the domestic energy use proportion of China’s gross energy use was high (although declining after 2006, but still at 26% at the end of the study period), and to a certain extent, China’s embodied fossil fuel energy exports have changed the pattern of world energy consumption, as well as the carbon emission. This finding well confirms China’s unique position as a “world processing plant” in international trade, and proves that export is an important factor that cannot be ignored to promote the rapid growth of China’s energy and emissions. Optimizing the energy structure of China’s exports is conducive to energy conservation and emission reduction in China and the whole world.
(2) The proportion of domestic energy in China’s exports was higher than that of the domestic value added; China’s exports in creating economic benefits were less than that of stimulating energy consumption. The energy intensity of the export products was higher than that of products consumed domestically, and China’s export structure is still characterized by high-energy consumption and needs to be continuously optimized. China’s participation in global production is more inclined to high-energy consumption, even in the upstream of the production chain, and is more in the initial energy-input stage of high-energy consumption and low-income than in the research and development stage of low-energy consumption and high-income. Optimizing the structure of export products in China, can not only improve China’s position in the global production chain, and enhance its competitiveness in high-end industries with low energy intensity, but is also conducive to global energy reservation and emission reduction.
(3) At the country level, the United States and EU28 are traditional major importers of China, and developing countries, such as Brazil, India, and Indonesia, are emerging markets. Embodied energy exported to developed importers is mainly through final goods, and to developing regions, mainly through intermediates. In general, the domestic energy cost per unit of economic income (through exports) to developed countries is lower than that of exports to developing countries. Therefore, the international trade between China and emerging markets needs to be emphasized, and embodied flows of fossil fuel energy and carbon emissions in these trades may be an increasingly important factor of global emission reduction.
(4) At the sector level, the light industry and the services create more benefits, whereas manufacturing, such as chemicals and metal products, consumes more energy, and there is a mismatch between the main sectors that create economic benefits from exports and the main sectors that consume energy for exports. The differences between the forward and backward linkage measures at the sector level require more attention. The sectors of electrical equipment manufacturing and products, mining and quarrying, chemical industry, manufacture of basic metals and metal products, and construction sector are the key sectors that need more attention in the study of export embodied energy. The costs of domestic energy to benefit from the exports of chemical, metal, and non-metal equipment manufacturing sectors are the highest among all sectors, and China should not only improve the export structure and reduce the proportion of products from these sectors in total exports but also fundamentally improve the technical level of these sectors and promote their energy efficiencies.
(5) The domestic energy embodied in some sectors showed a unique distribution of destinations. There is a large gap in the flow routes of the energy embodied in China’s exports to different importers, and even in their domestic value chain stages, the flow routes between the domestic sectors are different. Therefore, it is of great significance and importance to conduct detailed studies on the sources, destinations, and transfer routes of energy flows embodied in China’s international trade from the perspectives of the trade-in value added method and the global value chain.
This article provides a basic framework for the study of embodied flows based on the global value chain theory and trade in value added accounting. As a stage achievement, this article makes a detailed analysis of the embodied energy flows of China’s exports. The main deficiency of this article lies in the lag of the research period caused by data limitation. The world input-output tables have a strong lag and cannot reflect the latest information, and it is necessary to improve the timeliness of research. Besides, this study can be further deepened, such as switching importers and exporters, in order to analyze the net energy transfer in bilateral trade. Moreover, the research framework of this article is also applicable to the study of carbon emissions embodied in international trade and has an important reference role for the flow and transfer of carbon emissions embodied in international trade.
Data Availability Statement
The raw data supporting the conclusions of this article will be made available by the authors, without undue reservation.
Author Contributions
BZ, SB, and YN made substantial contributions to the conception of the work, and to its drafting and/or critical revision, and approved for publication. All authors contributed to the article and approved the submitted version.
Funding
This study was supported by the National Natural Science Foundation of China (71873021 and 71573029).
Conflict of Interest
The authors declare that the research was conducted in the absence of any commercial or financial relationships that could be construed as a potential conflict of interest.
Acknowledgments
Financial support from the National Natural Science Foundation of China is deeply acknowledged. The authors would like to thank the comments and suggestions of reviewers for their important help in improving the quality of this article.
Supplementary Material
The Supplementary Material for this article can be found online at: https://www.frontiersin.org/articles/10.3389/fenrg.2021.649163/full#supplementary-material
References
An, Q., An, H., Wang, L., Gao, X., and Lv, N. (2015). Analysis of embodied exergy flow between Chinese industries based on network theory. Ecol. Model. 318, 26–35. doi: 10.1016/j.ecolmodel.2015.01.020
Balassa, B. (1965). Trade liberalisation and “revealed” comparative advantage. Manchester Sch. 33, 99–123. doi: 10.1111/j.1467-9957.1965.tb00050.x
Bortolamedi, M. (2015). Accounting for hidden energy dependency: the impact of energy embodied in traded goods on cross-country energy security assessments. Energy 93, 1361–1372. doi: 10.1016/j.energy.2015.09.127
BP (2019). Statistical Review of World Energy. Available online at: https://www.bp.com/en/global/corporate/energy-economics/statistical-review-of-world-energy.html (accessed December 19, 2020)
Bullard, C. W., and Herendeen, R. A. (1975). The energy cost of goods and services. Energy Policy 3, 268–278. doi: 10.1016/0301-4215(75)90035-X
Chen, B., Li, J. S., Wu, X. F., Han, M. Y., Zeng, L., Li, Z., et al. (2018). Global energy flows embodied in international trade: a combination of environmentally extended input-output analysis and complex network analysis. Appl. Energy 210, 98–107. doi: 10.1016/j.apenergy.2017.10.113
Chen, G. Q., and Wu, X. F. (2017). Energy overview for globalized world economy: source, supply chain and sink. Renew. Sustain. Energy Rev. 69, 735–749. doi: 10.1016/j.rser.2016.11.151
Chen, J., Zhou, W., and Yang, H. (2019). Is embodied energy a better starting point for solving energy security issues?–based on an overview of embodied Energy-Related research. Sustainability 11:4260. doi: 10.3390/su11164260
Chen, S., and Chen, B. (2015). Urban energy consumption: different insights from energy flow analysis, input-output analysis and ecological network analysis. Appl. Energy 138, 99–107. doi: 10.1016/j.apenergy.2014.10.055
Corsatea, T. D., Lindner, S., Arto, I., Román, M. V., Rueda-Cantuche, J. M., Velázquez Afonso, A., et al. (2019). World Input-Output Database Environmental Accounts. no. 1831-9424. Luxembourg: Publications Office of the European Union.
Cortés-Borda, D., Guillén-Gosálbez, G., and Jiménez, L. (2015). Assessment of nuclear energy embodied in international trade following a world multi-regional input-output approach. Energy 91, 91–101. doi: 10.1016/j.energy.2015.07.117
Costanza, R. (1980). Embodied energy and economic valuation. Science 210, 1219–1224. doi: 10.1126/science.210.4475.1219
Cui, L., Peng, P., and Zhu, L. (2015). Embodied energy, export policy adjustment and China’s sustainable development: a multi-regional input-output analysis. Energy 82, 457–467. doi: 10.1016/j.energy.2015.01.056
Daudin, G., Rifflart, C., and Schweisguth, D. (2011). Who produces for whom in the world economy? Can. J. Econ. 44, 1403–1437. doi: 10.1111/j.1540-5982.2011.01679.x
Gao, C., Su, B., Sun, M., Zhang, X., and Zhang, Z. (2018). Interprovincial transfer of embodied primary energy in China: a complex network approach. Appl. Energy 215, 792–807. doi: 10.1016/j.apenergy.2018.02.075
Guo, S., Han, M., Yang, Y., and Di, H. (2020a). Embodied energy flows in China’s economic zones: Jing-Jin-Ji, Yangtze-River-Delta and Pearl-River-Delta. J. Clean. Prod. 268:121710. doi: 10.1016/j.jclepro.2020.121710
Guo, S., Li, Y., Hu, Y., Xue, F., Chen, B., and Chen, Z. (2020b). Embodied energy in service industry in global cities: a study of six Asian cities. Land Use Policy 91:104264. doi: 10.1016/j.landusepol.2019.104264
Guo, S., Shen, G., Yang, J., Sun, B., and Xue, F. (2015). Embodied energy of service trading in Hong Kong. Smart Sustain. Built Environ. 4, 234–248. doi: 10.1108/SASBE-08-2014-0046
Guo, S., Zheng, S., Hu, Y., Hong, J., Wu, X., and Tang, M. (2019). Embodied energy use in the global construction industry. Appl. Energy 256:113838. doi: 10.1016/j.apenergy.2019.113838
Hummels, D., Ishii, J., and Yi, K. M. (2001). The nature and growth of vertical specialization in world trade. J. Int. Econ. 54, 75–96. doi: 10.1016/s0022-1996(00)00093-3
Ji, X., Liu, Y., Meng, J., and Wu, X. (2020). Global supply chain of biomass use and the shift of environmental welfare from primary exploiters to final consumers. Appl. Energy 276:115484. doi: 10.1016/j.apenergy.2020.115484
Jiang, L., He, S., Tian, X., Zhang, B., and Zhou, H. (2020). Energy use embodied in international trade of 39 countries: spatial transfer patterns and driving factors. Energy 195:116988. doi: 10.1016/j.energy.2020.116988
Johnson, R. C., and Noguera, G. (2012). Accounting for intermediates: production sharing and trade in value added. J. Int. Econ. 86, 224–236. doi: 10.1016/j.jinteco.2011.10.003
Kan, S., Chen, B., Meng, J., and Chen, G. (2020). An extended overview of natural gas use embodied in world economy and supply chains: policy implications from a time series analysis. Energy Policy 137:111068. doi: 10.1016/j.enpol.2019.111068
Kan, S. Y., Chen, B., Wu, X. F., Chen, Z. M., and Chen, G. Q. (2019). Natural gas overview for world economy: from primary supply to final demand via global supply chains. Energy Policy 124, 215–225. doi: 10.1016/j.enpol.2018.10.002
Koopman, R., Powers, W., Wang, Z., and Wei, S. (2010). Giving Credit Where Credit is Due: Tracing Value Added in Global Value Chains. NBER Working Paper 16426. Cambridge, MA: National Bureau of Economic Research, doi: 10.3386/w16426
Koopman, R., Wang, Z., and Wei, S. (2008). How Much of Chinese Exports is Really Made in China? Assessing Domestic Value-Added When Processing Trade is Pervasive. NBER Working Paper 14109. Cambridge, MA: National Bureau of Economic Research, doi: 10.3386/w14109
Koopman, R., Wang, Z., and Wei, S. (2012). Estimating domestic content in exports when processing trade is pervasive. J. Dev. Econ. 99, 178–189. doi: 10.1016/j.jdeveco.2011.12.004
Koopman, R., Wang, Z., and Wei, S. (2014). Tracing Value-Added and double counting in gross exports. Am. Econ. Rev. 104, 459–494. doi: 10.1257/aer.104.2.459
Lam, K. L., Kenway, S. J., Lane, J. L., Islam, K. M. N., and Bes De Berc, R. (2019). Energy intensity and embodied energy flow in Australia: an input-output analysis. J. Clean. Prod. 226, 357–368. doi: 10.1016/j.jclepro.2019.03.322
Lenzen, M. (1998). Primary energy and greenhouse gases embodied in Australian final consumption: an input-output analysis. Energy Policy 26, 495–506. doi: 10.1016/S0301-4215(98)00012-3
Leontief, W. (1936). Quantitative input and output relations in the economic system of the United States. Rev. Econ. Stat. 18, 105–125. doi: 10.2307/1927837
Lin, B., and Sun, C. (2010). Evaluating carbon dioxide emissions in international trade of China. Energy Policy 38, 613–621. doi: 10.1016/j.enpol.2009.10.014
Liu, B., Zhang, L., Liu, C., Wang, D., Sun, J., Luther, M., et al. (2019). Measuring energy poverty based on energy embodied in exports of vertical specialisation trade in the construction sector. Energy Build. 196, 157–168. doi: 10.1016/j.enbuild.2019.05.022
Liu, B., Zhang, L., Sun, J., Wang, D., Liu, C., Luther, M., et al. (2020a). Analysis and comparison of embodied energies in gross exports of the constrcution sector by means of their value-added origins. Energy 191:116546. doi: 10.1016/j.energy.2019.116546
Liu, B., Zhang, L., Sun, J., Wang, D., Liu, C., Luther, M., et al. (2020b). Composition of energy outflows embodied in the gross exports of the construction sector. J. Clean. Prod. 248:119296. doi: 10.1016/j.jclepro.2019.119296
Liu, Z., Geng, Y., Lindner, S., Zhao, H., Fujita, T., and Guan, D. (2012). Embodied energy use in China’s industrial sectors. Energy Policy 49, 751–758. doi: 10.1016/j.enpol.2012.07.016
Machado, G., Schaeffer, R., and Worrell, E. (2001). Energy and carbon embodied in the international trade of Brazil: an input-output approach. Ecol. Econ. 39, 409–424. doi: 10.1016/s0921-8009(01)00230-0
Mongelli, I., Tassielli, G., and Notarnicola, B. (2006). Global warming agreements, international trade and energy/carbon embodiments: an input–output approach to the Italian case. Energy Policy 34, 88–100. doi: 10.1016/j.enpol.2004.06.004
OECD and WTO (2011). Trade in Value-Added: Concept, Methodologies and Challenges (Joint OECD-WTO note). Available online at: http://www.oecd.org/sti/ind/49894138.pdf (accessed December 19, 2020)
Shui, B., and Harriss, R. (2006). The role of CO2 embodiment in US–China trade. Energy Policy 34, 4063–4068. doi: 10.1016/j.enpol.2005.09.010
Stehrer, R. (2012). Trade in Value Added and the Value Added in Trade. WIIW Working Paper 81. Available online at: https://wiiw.ac.at/trade-in-value-added-and-the-valued-added-in-trade-dlp-2620.pdf (accessed December 19, 2020).
Su, B., and Ang, B. (2013). Input–output analysis of CO2 emissions embodied in trade: competitive versus non-competitive imports. Energy Policy 56, 83–87. doi: 10.1016/j.enpol.2013.01.041
Sun, X., An, H., Gao, X., Jia, X., and Liu, X. (2016). Indirect energy flow between industrial sectors in China: a complex network approach. Energy 94, 195–205. doi: 10.1016/j.energy.2015.10.102
Sun, X., Li, J., Qiao, H., and Zhang, B. (2017). Energy implications of China’s regional development: new insights from multi-regional input-output analysis. Appl. Energy 196, 118–131. doi: 10.1016/j.apenergy.2016.12.088
Tang, M., Hong, J., Liu, G., and Shen, G. Q. (2019). Exploring energy flows embodied in China’s economy from the regional and sectoral perspectives via combination of multi-regional input-output analysis and a complex network approach. Energy 170, 1191–1201. doi: 10.1016/j.energy.2018.12.164
Tang, X., Zhang, B., Feng, L., Snowden, S., and Höök, M. (2012). Net oil exports embodied in China’s international trade: an input-output analysis. Energy 48, 464–471. doi: 10.1016/j.energy.2012.10.010
Tao, F., Xu, Z., Duncan, A., Xia, X., Wu, X., and Li, J. (2018). Driving forces of energy embodied in China-EU manufacturing trade from 1995 to 2011. Resour. Conserv. Recycl. 136, 324–334. doi: 10.1016/j.resconrec.2018.04.021
Timmer, M. P., Dietzenbacher, E., Los, B., Stehrer, R., and de Vries, G. J. (2015). An illustrated user guide to the world Input-Output database: the case of global automotive production. Rev. Int. Econ. 23, 575–605. doi: 10.1111/roie.12178
Timmer, M. P., Erumban, A. A., Los, B., Stehrer, R., and de Vries, G. J. (2014). Slicing up global value chains. J. Econ. Perspect. 28, 99–118. doi: 10.1257/jep.28.2.99
Wang, Q., and Ge, S. (2020). Uncovering the effects of external demand on China’s coal consumption: a global input-output analysis. J. Clean. Prod. 245:118877. doi: 10.1016/j.jclepro.2019.118877
Wang, Q., and Yang, X. (2020). German’s oil footprint: an input-output and structural decomposition analysis. J. Clean. Prod. 242:118246. doi: 10.1016/j.jclepro.2019.118246
Wang, Z., Powers, W., and Wei, S. (2009). Value Chains in East Asian Production Networks – An International Input-Output Model Based Analysis. USTIC Working Paper. Available online at: https://www.usitc.gov/publications/332/EC200910C.pdf (accessed December 19, 2020)
Wang, Z., Wei, S., and Zhu, K. (2014). Quantifying International Production Sharing at the Bilateral and Sector Level. NBER Working Paper 19677. Cambridge, MA: National Bureau of Economic Research, doi: 10.3386/w19677
Weber, C., Peters, G., Guan, D., and Hubacek, K. (2008). The contribution of Chinese exports to climate change. Energy Policy 36, 3572–3577. doi: 10.1016/j.enpol.2008.06.009
Wiedmann, T. O., Schandl, H., Lenzen, M., Moran, D., Suh, S., West, J., et al. (2015). The material footprint of nations. Proc. Natl. Acad. Sci. U.S.A. 112, 6271–6276. doi: 10.1073/pnas.1220362110
Wu, X. F., and Chen, G. Q. (2017). Global primary energy use associated with production, consumption and international trade. Energy Policy 111, 85–94. doi: 10.1016/j.enpol.2017.09.024
Wu, X. F., and Chen, G. Q. (2018). Coal use embodied in globalized world economy: from source to sink through supply chain. Renew. Sustain. Energy Rev. 81, 978–993. doi: 10.1016/j.rser.2017.08.018
Wu, X. F., and Chen, G. Q. (2019). Global overview of crude oil use: from source to sink through inter-regional trade. Energy Policy 128, 476–486. doi: 10.1016/j.enpol.2019.01.022
Wyckoff, A., and Roop, J. (1994). The embodiment of carbon in imports of manufactured products: implications for international agreements on greenhouse gas emissions. Energy Policy 22, 187–194. doi: 10.1016/0301-4215(94)90158-9
Xia, X., Chen, B., Wu, X., Hu, Y., Liu, D., and Hu, C. (2017). Coal use for world economy: provision and transfer network by multi-region input-output analysis. J. Clean. Prod. 143, 125–144. doi: 10.1016/j.jclepro.2016.12.142
Yang, R., Long, R., Yue, T., and Shi, H. (2014). Calculation of embodied energy in Sino-USA trade: 1997-2011. Energy Policy 72, 110–119. doi: 10.1016/j.enpol.2014.04.024
Yang, Y., Poon, J., Liu, Y., and Bagchi-Sen, S. (2015). Small and flat worlds: a complex network analysis of international trade in crude oil. Energy 93, 534–543. doi: 10.1016/j.energy.2015.09.079
Zhang, Z., Xi, L., Su, B., Zhao, Y., Song, W., Liu, Y., et al. (2019). Energy, CO2 emissions, and value added flows embodied in the international trade of the BRICS group: a comprehensive assessment. Renew. Sustain. Energy Rev. 116:109432. doi: 10.1016/j.rser.2019.109432
Zheng, H., Li, A., Meng, F., and Liu, G. (2020). Energy flows embodied in China’s interregional trade: case study of Hebei Province. Ecol. Model. 428:109061. doi: 10.1016/j.ecolmodel.2020.109061
Appendix
In Wang et al. (2014), the gross exports of country s to country r were decomposed into 16 terms using equation (A1):
where Esr is the total exports of country s to country r, and Vs is the value added coefficient diagonal matrix of country s, in which each element is the value added coefficient of sector j in country s (similar for Vr and VT). Lss is the local Leontief inverse matrix. Er^* is the gross export of country r. The meaning and acronym of each term in equation (A1) are as follows:
(T1) is the domestic value added in the final exports and absorbed in the direct importer.
(T2) is the domestic value added in intermediate exports and absorbed in the direct importer.
(T3) is the domestic value added in the intermediate exports and re-exported by the direct importer to a third country to produce domestic final use.
(T4) is the domestic value added in the intermediate exports and used by the direct importer to produce final goods and used in the third country.
(T5) is the domestic value added in intermediate exports and used by the direct importer to produce intermediate goods and re-exported to the third country to produce their exports to other countries (except for the original exporter, country s).
(T6) is the domestic value added in intermediate exports and returns home via final imports from country r.
(T7) is the domestic value added in intermediate exports and returns home via final imports from the third country.
(T8) is the domestic value added in intermediate exports and returns home via intermediate imports.
(T9) is the pure double-counting from domestic source due to final exports production.
(T10) is the pure double-counting from domestic source due to intermediate exports production.
(T11) is the value added from the direct importer used in the final exports.
(T12) is the value added from the direct importer used in intermediate exports.
(T13) is the pure double-counting sourced from the direct importer.
(T14) is the value added from the third country used in the final exports.
(T15) is the value added from the third country used in the intermediate exports.
(T16) is the pure double-counting sourced from the third country.
What should be noted in this decomposition framework is that, in the fifth terms (T5), only export from the third country (country t) to the original exporter (country s) are excluded from country t’s total export. However, there is still a part of exports are consumed by country r, and related value added from country‘s embodied in this part of exports are absorbed in country r, and it should be split from (T5). In the formula, when u = r, , represents the domestic value added in intermediate export and is used by the direct importer to produce intermediate goods and re-exported to the third country to produce their exports back to the direct importer. From the perspective of the final absorbed destination of the domestic value added embodied in country s, this part should be calculated separately, since it represents the domestic value added of the exporter, country s, and is absorbed in the direct importer, country r, through the third country, country t. This transfer route is different from other flows. Thus, in this study, the fifth term (T5) in Wang et al. (2014) is divided according to the final absorbed destination. Namely, we divided (T5) into two parts, ur in one part and u = r in the other as follows:
Thus, this article decomposes the gross exports of a country into 17 terms according to the original sources, final destinations, and transfer routes of the value added embodied in the exports.
Keywords: embodied energy, global value chain, export, input-output analysis, trade in value added
Citation: Zhang B, Bai S and Ning Y (2021) Embodied Energy in Export Flows Along Global Value Chain: A Case Study of China’s Export Trade. Front. Energy Res. 9:649163. doi: 10.3389/fenrg.2021.649163
Received: 04 January 2021; Accepted: 29 March 2021;
Published: 04 May 2021.
Edited by:
Xu Tang, China University of Petroleum, ChinaReviewed by:
Xiangyun Gao, China University of Geosciences, ChinaFeng Dong, China University of Mining and Technology, China
Copyright © 2021 Zhang, Bai and Ning. This is an open-access article distributed under the terms of the Creative Commons Attribution License (CC BY). The use, distribution or reproduction in other forums is permitted, provided the original author(s) and the copyright owner(s) are credited and that the original publication in this journal is cited, in accordance with accepted academic practice. No use, distribution or reproduction is permitted which does not comply with these terms.
*Correspondence: Yadong Ning, bmluZ3lkQGRsdXQuZWR1LmNu