 Hao Li
 Qiancheng Rui
 Wei Yu
- College of Electrical, Energy and Power Engineering, Yangzhou University, Yangzhou, China
A non-equilibrium molecular dynamics simulation method is conducted to study the thermal conductivity (TC) of silicon nanowires (SiNWs) with different types of defects. The impacts of defect position, porosity, temperature, and length on the TC of SiNWs are analyzed. The numerical results indicate that SiNWs with surface defects have higher TC than SiNWs with inner defects, the TC of SiNWs gradually decreases with the increase of porosity and temperature, and the impact of temperature on the TC of SiNWs with defects is weaker than the impact on the TC of SiNWs with no defects. The TC of SiNWs increases as their length increases. SiNWs with no defects have the highest corresponding frequency of low-frequency peaks of phonon density of states; however, when SiNWs have inner defects, the lowest frequency is observed. Under the same porosity, the average phonon participation of SiNWs with surface defects is higher than that of SiNWs with inner defects.
Introduction
A one-dimensional material system is the smallest size structure that can be used for efficient electronic and optical transmission (Xia et al., 2003; Hsu et al., 2015) and has unique heat transfer properties (Wang et al., 2018). It is considered to be an ideal choice for semiconductor materials. Silicon nanowire (SiNW) is a typical one-dimensional material, and there are many mature methods to obtain this material, such as laser ablation, thermal evaporation, chemical vapor deposition, template method, solution method, and hydrothermal method (Yang et al., 2014). It has not only stable semiconductor characteristics of macroscopic silicon material but also field emission (Frederick et al., 1999), thermal conductivity (TC) (Zhang and Zhang, 2013), visible photoluminescence (Feng et al., 2000), and quantum confinement effects (Kobayashi and Hiramoto, 2008) that are different from bulk silicon materials. Therefore, SiNWs can be widely applied in microelectronic device, nanophotonic devices, optoelectronic devices, and new energy (Boukai et al., 2008; Laik et al., 2008; Chen et al., 2018; Anufriev and Nomura, 2019; Zhang et al., 2019).
The TC is an important thermoelectric performance parameter of the material, and the research on the TC of SiNWs plays an important role in its application, especially in the field of microelectronics. Therefore, many investigations have been conducted to explore the heat transfer performance of SiNWs. The experimental measurement of the TC of a single SiNW at low temperature indicates that it is much lower than the bulk value (Li et al., 2003) and shows linear temperature dependence alternative to the conventional T3 dependence (Bourgeois et al., 2007; Chen et al., 2008). By adjusting the structures, the TC of SiNWs can be tuned. For instance, the fishbone SiNWs allow more flexibility in controlling the heat conduction as compared with pristine SiNWs (Maire et al., 2018). Molecular dynamics simulation is a feasible and reasonable way to learn the mechanism of TC of SiNWs and the impact of some influencing factors that cannot be considered by the experiment. The numerical results obtained by Volz and Chen (1999) indicate that the TC of SiNWs is about two orders of magnitude lower than that of silicon bulk materials, and this trend has also been confirmed in experiments. The atomistic computation conducted by Markussen et al. (2008) shows that ultrathin pristine SiNWs with diameters ranging from 1 to 5 nm at room temperature have highly anisotropic heat conductance. Chen et al. (2011) found that the TC of SiNWs decreases with its surface-to-volume ratio (SVR) and is linearly related to SVR for all cross-sectional geometry when the cross-sectional area is > 20 nm2. Mingo et al. (2003) compared three methods for predicting TC of SiNWs vs. temperature and found the method employing full phonon dispersion relations of the material is better than the traditional Callaway and Holland models. Through simulations, Donadio and Galli (2010) found that the presence of a crystalline/amorphous interface has a significant influence on the TC of thin SiNWs. Based on the non-equilibrium molecular dynamics method using Stillinger–Weber potential model and Nose–Hoover thermostat, Wang et al. (2009) predicted the TC of SiNWs. From the results, we can see that the reciprocal of the TC has a linear relationship with the length, and the TC dependence on temperature is consistent with the experimental results.
In addition, regulating the TC of SiNWs is of great significance to its application. Besides the abovementioned factors, such as temperature and size, introducing defects into SiNWs is also an important method. At room temperature, by doping isotopes, the TC of SiNWs can reduce exponentially (Yang et al., 2008). The TC of SiNWs with roughened surfaces is lower compared with that of the pristine ones, and its value is smaller under a smaller roughness wavelength and larger amplitude (Liu and Chen, 2010). For SiNWs, the TC can decrease close to two orders of magnitude due to the comprehensive influence of surface ripples and core defects (Zago et al., 2012). By raising the percentage of random vacancy defects, linearly decreased TC of SiNWs is observed in the results obtained from SW potential, and non-linearly decreased TC is observed in the results based on Tersoff interatomic potential. It indicates that vacancy defects can promote the efficiency of thermoelectric energy conversion of SiNWs (Shahraki and Zeinali, 2015). A simulation conducted by Zhan et al. (2014) indicated that the stacking faults can greatly reduce the TC of the SiNW, and the extrinsic stacking faults can induce a larger reduction than the twin boundary and intrinsic stacking faults. Yang et al. (2014) compared and analyzed the TC of silicon materials under different porosities, and the TC decreased with the increase of the porosity. Romano et al. (2012) computed the effective TC of porous SiNWs using the phonon Boltzmann transport equation and found the correlation between the phononic TC, the porosity, and surface-to-volume ratio.
In summary, the defects have a significant influence on the regulation of TC of SiNWs. However, research on the regulation mechanism of defects on the TC of SiNWs, especially the impact of spatial defects, is still limited. To this end, based on a non-equilibrium molecular dynamics simulation method, this paper conducts a numerical study that explores the defect location, porosity, and other factors impacting TC of SiNWs along with the impact mechanism.
Molecular Dynamics Simulation on the TC of Defective SiNWs
Construction of Defective SiNWs
The SiNWs can be obtained by arranging the Si atoms regularly and repeatedly. As shown in Figure 1A, all SiNWs in the current study contain six Si spores and have a size of 3.258 nm in the x and y directions. To investigate the impact of porosity and temperature, SiNWs in the z direction have 200 Si spores and the length of 108.6 nm. In addition, SiNWs with lengths of 48.87, 70.59, and 152.04 nm are also constructed. Holes are dug into the inside or surface of the complete SiNWs to construct two types of defective SiNWs.
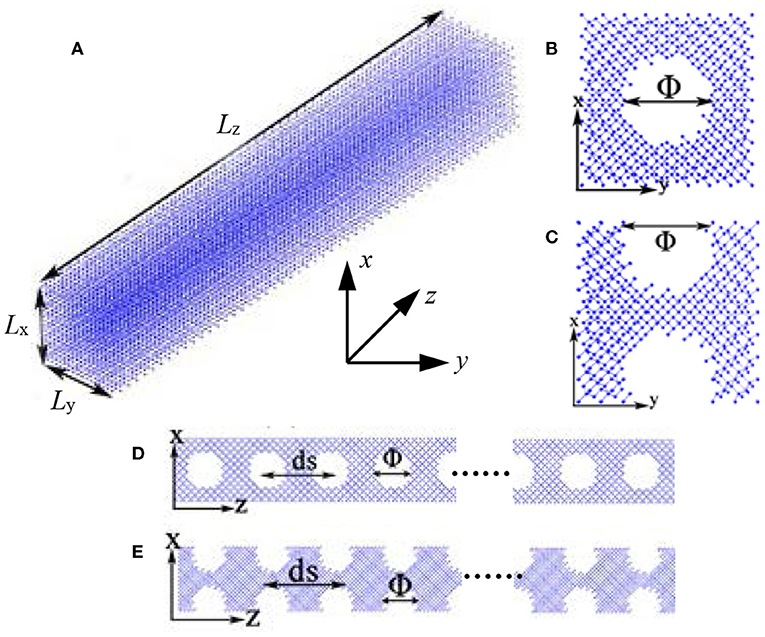
Figure 1. Schematic of SiNWs in the current study: (A) SiNW with no defect, (B) left cross-sectional view of SiNW with inner defects, (C) left cross-sectional view of SiNW with surface defects, (D) front cross-sectional view of SiNW with inner defects, and (E) front cross-sectional view of SiNW with surface defects.
The SiNWs with surface defects and inner defects are shown in Figures 1B–E, respectively. In these figures, the Φ and ds represent the diameter of the sphere defect and the distance between two adjacent sphere defects. In the current study, ds is 5.43 nm, and the Φ and ds are all the same for SiNWs with inner and surface defects. For the SiNWs with inner defects, the sphere center coordinates of the sphere defect can be expressed as (1.629, 1.629, n × 5.43), where n is an integer from 1 to 20. Correspondingly, for the SiNWs with surface defects as shown in Figures 1C–E, center coordinates of the sphere defect in up and low surfaces, and the sphere center coordinates are (0, 1.629, n × 5.43) and (3.258, 1.629, n × 5.43), where n is an integer from 1 to 20 as well.
Porosity, ε, can be changed by adjusting the diameter of the sphere defect and is defined as
where Vdefects is the volume of defects and Vtotal is the volume of complete SiNWs. In this study, Φ of 4, 6, 8, 10, 12, 13, 14, and 15 Å are applied, and the corresponding porosities are 0.58, 1.96, 4.64, 9.07, 15.68, 19.94, 24.91, and 30.64%, respectively.
Simulation Method
The non-equilibrium molecular dynamics simulation method of velocity-exchanging method (Müller-Plathe, 1997) is applied to determine the TC of various SiNWs in this paper. The SiNWs are divided into 54 layers with the single-layer thickness of about 2 nm in the z direction, and the number of atoms in each layer is about 1,000 to ensure the accuracy and authenticity of statistics. Based on the velocity-exchanging method, the hot and cold areas are established, and the highest atom velocity in the cold area is exchanged with the lowest atom velocity in the hot area.
During initialization, periodic boundary conditions are selected in the direction of heat flow (the z direction), and free boundary conditions are selected in the other two directions. The interaction between Si atoms is described by the Tersoff potential function (Tersoff, 1989; Volz and Chen, 1999). A simulation time step is set as 0.5 fs, and the initial system temperature is set as 500 K. During the simulation, the system will first run 2 million steps under the NVT system to reach steady-state equilibrium, and then the system will run 400 million steps under the NVE and perform velocity exchanging. When the system is stable, the average temperature, T, of each layer can be obtained by following the formula (2) according to the Boltzmann energy equalization theorem.
where N, m, and v are the atom number in the statistical area, the atomic mass, and the atomic velocity, respectively. kB is the Boltzmann constant. After determining the temperature of each layer, the TC of SiNWs can be calculated by
where vh is the velocity in the hot area, vc is the velocity in cold area, t is the running time, S is the system cross-sectional area, and z is the coordinate position of the particle.
In the current study, the TC of SiNWs under each porosity and temperature is simulated several times by adjusting the random number in the speed initialization. Note that the thermal conductivities presented in the figures are the average values.
Results and Discussions
The TC of Defective SiNWs
Figure 2A shows the TC of two defective SiNWs with various porosities obtained by formula (3). As the porosity increases, the TC of both defective SiNWs with surface and inner defects decreases. When the porosity is up to 30%, the TC of defective SiNWs approaches 1.14 W/m∙K and the impact of porosity tends to be flat. Under the same porosity and temperature of 500 K, the TC of SiNWs with surface defects is always higher than that of SiNWs with inner defects. In addition, by comparing these TC at 300 and 500 K in the Figure 2A, under the same porosity, TC at 300 K is always higher than that at 500 K.
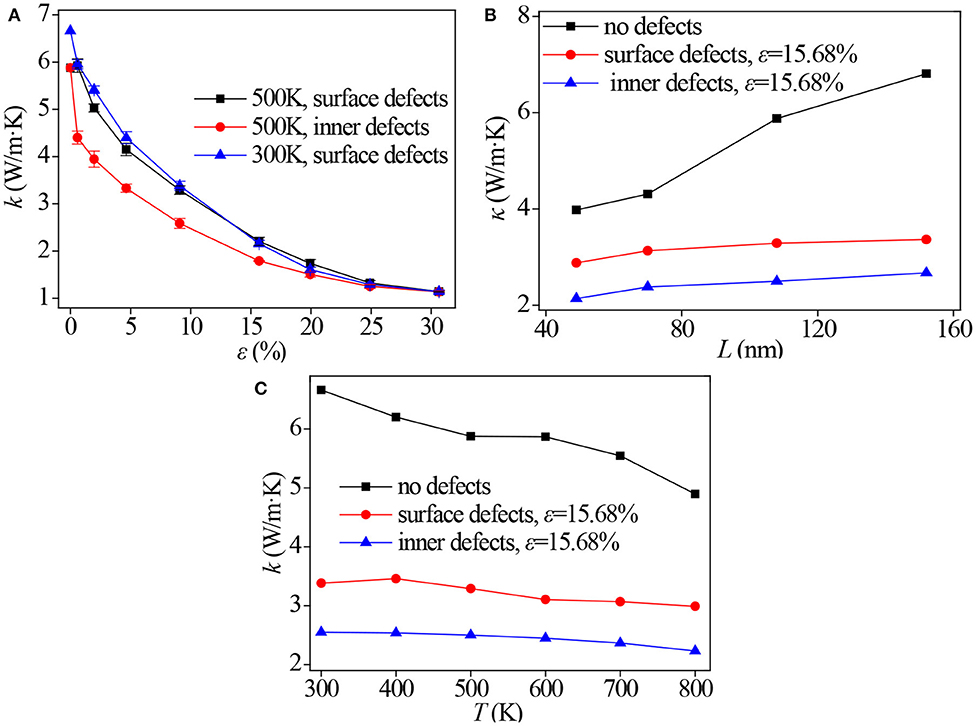
Figure 2. Thermal conductivity of defective SiNWs. (A) Influence of porosity, (B) influence of length, and (C) influence of temperature.
On the macroscale, the TC is a physical parameter of the material which does not change with the size of the material. However, for the low-dimensional materials, the TC of the material is related to the length of the material due to the size effect. For this reason, the TC of three types of SiNWs with different lengths is analyzed. As shown in Figure 2B, the TC of SiNWs with no defects increases significantly as the length increases, while that of SiNWs with surface and inner defects increases slightly with the increase in length, and the increasing trend is gentle.
As mentioned above, the TC of SiNWs varies in temperature. The TC of SiNWs with no defects and the TC of SiNWs with surface and inner defects, both having a porosity of 15.68% when the temperature is 300–800 K, are studied. As indicated in Figure 2C, the TC of SiNWs with no defects decreases significantly with increasing temperature and is much higher than that of SiNWs with defects, while the TC of SiNWs with surface and inner defects decreases slightly with increases in temperature. It also can be seen that, when the temperature stays the same, the TC of SiNWs with surface defects is always higher than that of SiNWs with inner defects.
Phonon Density of States of Defective SiNWs
The phonon density of states reflects the frequency distribution of phonons in a material. When phonons are concentrated in the low-frequency region, it indicates that the thermal resistance of the material is relatively high. Therefore, the difference in the TC of the material can be effectively explained by analyzing the phonon density of states, which can be calculated as (Sokhan et al., 2000; Pang et al., 2014).
where Δn is the modulus of the lattice vibration in the interval from ω to (ω + Δω). Since the total modulus is equal to the total degrees of freedom, and if a simple crystal has N atoms
where ωm is the maximum frequency. The Δn can be calculated as
where dq is the vertical distance between the two equal frequency planes and ds is the area element. By incorporating Equations (5) and (6) into Equation (4), the phonon density of states can be obtained by the following equation (7)
Figure 3 shows the total of local phonon densities of states of SiNWs with no defects and SiNWs with surface defects and inner defects both with porosity of 15.68%. It can be seen that the corresponding frequency of peaks of phonon density of states for SiNWs with no defects is the highest and that for the SiNWs with inner defects is the lowest. Therefore, SiNWs with no defects have the maximum TC. Furthermore, as shown in Figure 3, atoms at the typical characteristic positions are selected to reflect the typical local phonon density of states of the SiNW. For the SiNWs with no defects, the peak of phonon density of states of selected atomic is close to that of the total density of states, and the frequency of the peak is about 15.33 THz. The peak frequency of phonon density of states of SiNWs with surface defects is relatively lower than that of SiNWs with no defects. In addition, a few peaks arise in the low-frequency region. Therefore, it is explained that the TC of SiNWs with surface defects is lower than that of SiNWs with no defects, which is mainly caused by surface scattering of phonons. However, obvious peaks at the low-frequency region are observed for SiNWs with inner defects, which deviate obviously by comparing with SiNWs with no defects and SiNWs with surface defects. However, low frequency leads to a decrease in its TC. It gives the reason why the TC of SiNWs with inner defects is always lower than that of SiNWs with surface defects under the same porosity.
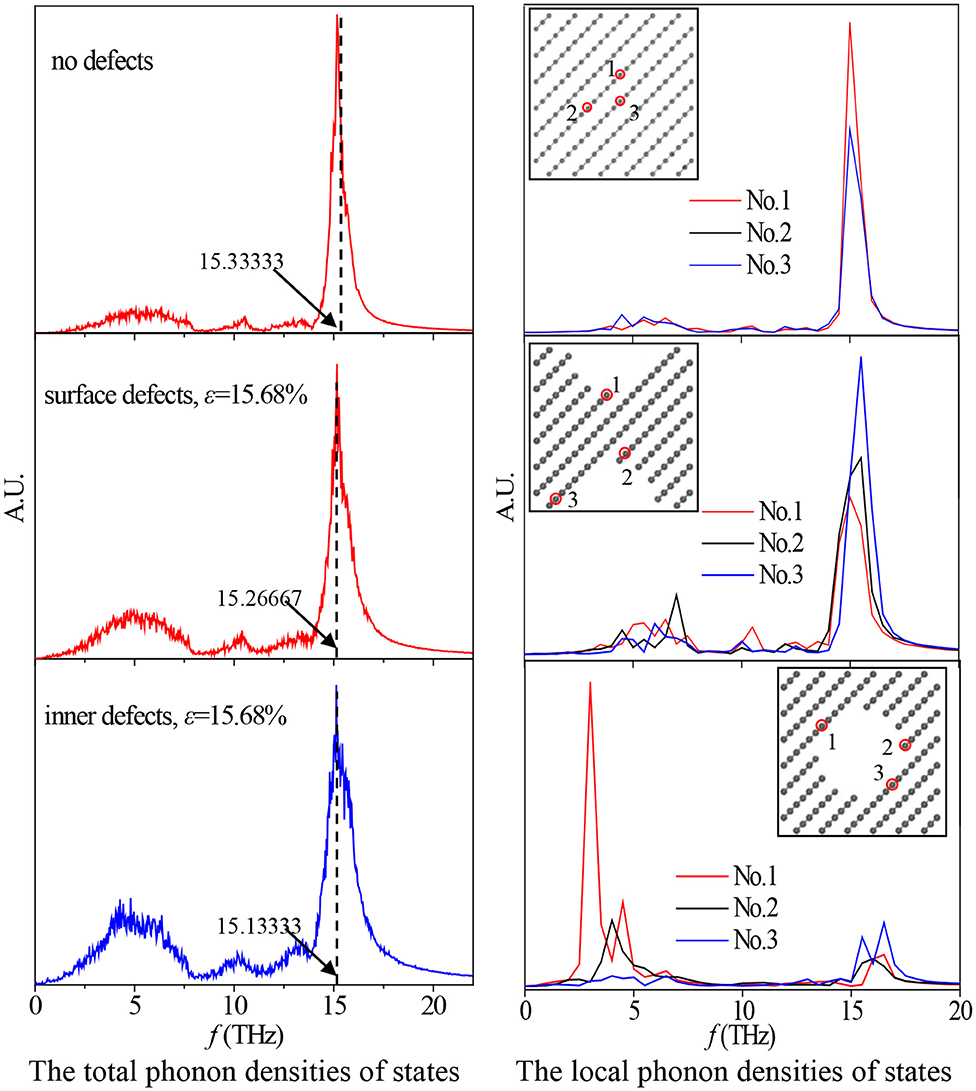
Figure 3. The phonon density of states of different types of defective SiNWs.
Phonon Participation
Phonon participation, P (Xia et al., 2003), during transportation process can be applied to characterize the localization of the vibration mode, of which the size reflects the participation degree of atoms in the phonon mode during heat transfer. For example, during the heat transfer process, if only one atom in the system with the number of N participates in the energy transfer process, the value of P will be 1/N. If all the atoms in the system participate in the energy transfer process, the value of P will be 1. Therefore, phonon participation of the material can effectively and intuitively reveal the difference in the TCs of SiNWs with different defects. The phonon participation can be calculated as follows:
where N and u are the total number and velocity of atom.
Figure 4 shows the phonon participation of SiNWs with no defects and two defective SiNWs with porosity of 15.68%. It can be seen in Figure 4 that the average phonon participation of SiNWs with no defects during the heat transfer process is about 0.4828, which is higher than that of SiNWs with surface defects (the average value is 0.3886) and SiNWs with inner defects (the average value is 0.3448). These results verify that the TC of SiNWs with no defects is higher than that of SiNWs with defects, and the TC of SiNWs with surface defects is higher than that of SiNWs with inner defects under the same porosity.
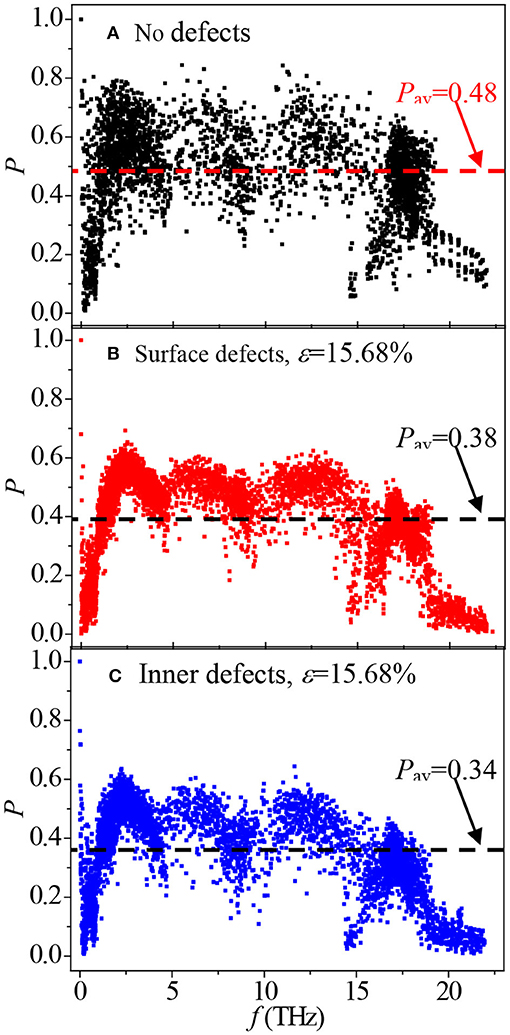
Figure 4. Phonon participation of SiNWs with different defects during heat transfer.
Conclusions
In this paper, a non-equilibrium molecular dynamics simulation method of velocity-exchanging method is used to investigate the TC of defective SiNWs with different types of defects. The influences of defect position, porosity, length, and temperature on the TC of SiNWs are discussed, and the regulation mechanism of defect position on the TC of SiNWs is revealed. The main conclusions are as follows.
(1) Under the same porosity, SiNWs with surface defects have higher TC than SiNWs with inner defects. The TC of SiNWs gradually decreases with the increase of porosity. If the porosity is > 30%, the TC of defective SiNWs tends to be flattened by the porosity.
(2) At the same temperature, the TC of SiNWs with no defects is higher than that of SiNWs with defects, and the TC of SiNWs with surface defects is higher at the same porosity. With the increase of temperature, the TC of SiNWs decreases, and the impact of temperature on the TC of SiNWs with no defects becomes more obvious.
(3) Affected by the scale effect, the TC of SiNWs increases as their length increases.
(4) SiNWs with no defects have the highest corresponding frequency of low-frequency peaks of phonon density of states; however, when SiNWs have inner defects, the lowest frequency is observed.
(5) The phonon participation of SiNWs with no defects is much higher than that of SiNWs with defects. When porosity stays the same, the average phonon participation of SiNWs with surface defects is higher than that of SiNWs with inner defects.
Data Availability Statement
The raw data supporting the conclusions of this article will be made available by the authors, without undue reservation.
Author Contributions
HL and XW conducted the simulations and prepared the article. XW and QR contributed to analysis of simulation data. WY contributed to design of structure, discussions of the results, and article preparation. All authors contributed to the article and approved the submitted version.
Funding
This work was supported by the National Natural Science Foundation of China (51876184) and the Natural Science Foundation of the Jiangsu Higher Education Institutions of China (20KJB470006).
Conflict of Interest
The authors declare that the research was conducted in the absence of any commercial or financial relationships that could be construed as a potential conflict of interest.
References
Anufriev, R., and Nomura, M. (2019). Coherent thermal conduction in silicon nanowires with periodic wings. Nanomaterials 9:142. doi: 10.3390/nano9020142
Boukai, A. I., Bunimovich, Y., Tahir-Kheli, J., Yu, J. K., Goddard, W. A., and Heath, J. R. (2008). Silicon nanowires as efficient thermoelectric materials. Nature 451, 168–171. doi: 10.1038/nature06458
Bourgeois, O., Fournier, T., and Chaussy, J. (2007). Measurement of the thermal conductance of silicon nanowires at low temperature. J. Appl. Phys. 101:e016104. doi: 10.1063/1.2400093
Chen, J., Zhang, G., and Li, B. W. (2011). A universal gauge for thermal conductivity of silicon nanowires with different cross sectional geometries. J. Chem. Phys. 135:204705. doi: 10.1063/1.3663386
Chen, R., Hochbaum, A. I., Murphy, P., Moore, J., Yang, P., and Majumdar, A. (2008). Thermal conductance of thin silicon nanowires. Phys. Rev. Lett. 101:105501. doi: 10.1103/PhysRevLett.101.105501
Chen, X., Bi, Q., Sajjad, M., Wang, X., Ren, Y., Zhou, X. W., et al. (2018). One-dimensional porous silicon nanowires with large surface area for fast charge-discharge lithium-ion batteries. Nanomaterials 8:285. doi: 10.3390/nano8050285
Donadio, D., and Galli, G. (2010). Temperature dependence of the thermal conductivity of thin silicon nanowires. Nano Lett. 10, 847–851. doi: 10.1021/nl903268y
Feng, S. Q., Yu, D. P., Zhang, H. Z., Bai, Z. G., and Ding, Y. M. (2000). The growth mechanism of silicon nanowires and their quantum confinement effect. J. Cryst. Growth 209, 513–517. doi: 10.1016/S0022-0248(99)00608-9
Frederick, C. A., Wong, K. W., Tang, Y. H., Zhang, Y. F., Bello, I., Lee, S., et al. (1999). Electron field emission from silicon nanowires. Appl. Phys. Lett. 75, 1700–1702. doi: 10.1063/1.124794
Hsu, C., Liao, Y. C., Tsai, Y. T., Yeh, H., and Wu, C. (2015). Multiple silicon nanowires with enzymatic modification for measuring glucose concentration. Micromachines 6, 1135–1142. doi: 10.3390/mi6081135
Kobayashi, M., and Hiramoto, T. (2008). Experimental study on quantum confinement effects in silicon nanowire metal-oxide-semiconductor field-effect transistors and single-electron transistors. J. Appl. Phys. 103:053709. doi: 10.1063/1.2874247
Laik, B., Eude, L., Pereiraramos, J. P., Cojocaru, C. S., Pribat, D., and Rouviere, E. (2008). Silicon nanowires as negative electrode for lithium-ion microbatteries. Electrochim. Acta. 53, 5528–5532. doi: 10.1016/j.electacta.2008.02.114
Li, D. Y., Wu, Y. Y., Kim, P., Shi, L., Yang, P. D., and Majumdar, A. (2003). Thermal conductivity of individual silicon nanowires. Phys. Rev. Lett. 83, 2934–2936. doi: 10.1063/1.1616981
Liu, L., and Chen, X. (2010). Effect of surface roughness on thermal conductivity of silicon nanowires. J. Appl. Phys. 107:033501. doi: 10.1063/1.3298457
Maire, J., Anufriev, R., Hori, T., Shiomi, J., Volz, S., and Nomura, M. (2018). Thermal conductivity reduction in silicon fishbone nanowires. Sci. Rep. 8, 1–8. doi: 10.1038/s41598-018-22509-0
Markussen, T., Jauho, A. P., and Brandbyge, M. (2008). Heat conductance is strongly anisotropic for pristine silicon nanowires. Nano Lett. 8, 3771–3775. doi: 10.1021/nl8020889
Mingo, N., Yang, L., Li, D. Y., and Majumdar, A. (2003). Predicting the thermal conductivity of si and ge nanowires. Nano Lett. 3, 1713–1716. doi: 10.1021/nl034721i
Müller-Plathe, F. A. (1997). Simple nonequilibrium molecular dynamics method for calculating the thermal conductivity. J. Chem. Phys. 106, 6082–6085. doi: 10.1063/1.473271
Pang, J. W. L., Chernatynskiy, A., Larson, B. C., Buyers, W. J. L., Abernathy, D. L., McClellan, K. J., et al. (2014). Phonon density of states and anharmonicity of uo2. Phys. Rev. B 89:115132. doi: 10.1103/PhysRevB.89.115132
Romano, G., Di Carlo, A., and Grossman, J. C. (2012). Mesoscale modeling of phononic thermal conductivity of porous si: Interplay between porosity, morphology and surface roughness. J. Comput. Electron. 11, 8–13. doi: 10.1007/s10825-012-0390-2
Shahraki, M. G., and Zeinali, Z. (2015). Effects of vacancy defects and axial strain on thermal conductivity of silicon nanowires: a reverse nonequilibrium molecular dynamics simulation. J. Phys. Chem. Solids 85, 233–238. doi: 10.1016/j.jpcs.2015.06.001
Sokhan, V. P., Nicholson, D., and Quirke, N. (2000). Phonon spectra in model carbon nanotubes. J. Chem. Phys. 113, 2007–2015. doi: 10.1063/1.482007
Tersoff, J. (1989). Modeling solid-state chemistry: interatomic potentials for multicomponent systems. Phys. Rev. B. 39, 5566–5568. doi: 10.1103/PhysRevB.39.5566
Volz, S. G., and Chen, G. (1999). Molecular dynamics simulation of thermal conductivity of silicon nanowires. Appl. Phys. Lett. 75, 2056–2058. doi: 10.1063/1.124914
Wang, J., Gao, W., Zhang, H., Zou, M. H., Chen, Y. P., and Zhao, Y. J. (2018). Programmable wettability on photocontrolled graphene film. Sci. Adv. 4:eaat7392. doi: 10.1126/sciadv.aat7392
Wang, S. C., Liang, X. G., Xu, X. H., and Ohara, T. (2009). Thermal conductivity of silicon nanowire by nonequilibrium molecular dynamics simulations. J. Appl. Phys. 105:014316. doi: 10.1063/1.3063692
Xia, Y., Yang, P., Sun, Y., Wu, Y., Mayers, B., Gates, B. D., et al. (2003). One-dimensional nanostructures: synthesis, characterization, and applications. Adv. Mater. 15, 353–389. doi: 10.1002/adma.200390087
Yang, L., Yang, N., and Li, B. (2014). Extreme low thermal conductivity in nanoscale 3d si phononic crystal with spherical pores. Nano Lett. 14, 1734–1738. doi: 10.1021/nl403750s
Yang, N., Zhang, G., and Li, B. (2008). Ultralow thermal conductivity of isotope-doped silicon nanowires. Nano Lett. 8, 276–280. doi: 10.1021/nl0725998
Zago, M., Casalegno, A., Santoro, C., and Marchesi, R. (2012). Water transport and flooding in dmfc: experimental and modeling analyses. J. Power Sources 217, 381–391. doi: 10.1016/j.jpowsour.2012.06.022
Zhan, H. F., Zhang, Y. Y., Bell, J. M., and Gu, Y. T. (2014). Thermal conductivity of si nanowires with faulted stacking layers. J. Phys. D Appl. Phys. 47:015303. doi: 10.1088/0022-3727/47/1/015303
Zhang, C., Li, J., and Chen, Y. (2019). Improving the energy discharging performance of a latent heat storage (LHS) unit using fractal-tree-shaped fins. Appl. Energ. 259:114102. doi: 10.1016/j.apenergy.2019.114102
Keywords: molecular dynamics simulations, silicon nanowires, defects, thermal conductivity, phonon density of states
Citation: Li H, Rui Q, Wang X and Yu W (2021) Molecular Dynamics Simulations on Influence of Defect on Thermal Conductivity of Silicon Nanowires. Front. Energy Res. 9:664891. doi: 10.3389/fenrg.2021.664891
Received: 06 February 2021; Accepted: 15 March 2021;
Published: 08 April 2021.
Edited by:
Chengbin Zhang, Southeast University, ChinaCopyright © 2021 Li, Rui, Wang and Yu. This is an open-access article distributed under the terms of the Creative Commons Attribution License (CC BY). The use, distribution or reproduction in other forums is permitted, provided the original author(s) and the copyright owner(s) are credited and that the original publication in this journal is cited, in accordance with accepted academic practice. No use, distribution or reproduction is permitted which does not comply with these terms.
*Correspondence: Wei Yu, d2VpeXVAeXp1LmVkdS5jbg==