 Wu Guohua
 Duan Zhiyong3
 Ji Dongxu
- 1Information and Monitoring Center, Shenzhen Urban Public Safety and Technology Institute, Shenzhen, China
- 2Harbin Institute of Technology, Shenzhen, China
- 3Nuclear Power Institute of China, Chengdu, China
- 4School of Science and Engineering, Chinese University of Hong Kong, Shenzhen, China
A fault diagnosis can quickly and accurately diagnose the cause of a fault. Focusing on the characteristics of nuclear power plants (NPPs), this study proposes a distributed fault diagnosis method based on a back propagation (BP) neural network and decision tree reasoning. First, the fault diagnosis was carried out using the BP neural network and decision tree reasoning, and then a global fusion diagnosis was performed by fusing the resulting information. Second, the key technologies of the BP neural network and decision tree sample construction were studied. Finally, the simulation results show that the proposed distributed fault diagnosis system is highly reliable and has strong diagnostic ability, enabling efficient and accurate diagnoses to be realized. The distributed fault diagnosis system for NPPs provides a solid foundation for future research.
Introduction
Nuclear power plants (NPPs) produce a large number of monitoring signals. For example, a typical alarm system has nearly 2,000 alarms (Mo et al., 2007). This complexity increases the difficulty of judging the current state of the NPP. With the application of digital instrumentation and control systems, this scenario becomes more obvious. This study focuses on how to improve the NPP intelligence. The operational support (Wang et al., 2016; Peng et al., 2018), fault prediction and health management (Li et al., 2018; Fan et al., 2019), and nuclear accident emergency decision-making (Zhao et al., 2015; Zhao, 2016) are the key parts of NPP intelligence. At the same time, the fault diagnosis can be used to obtain key signals from a large amount of data, allowing the current operation state of the NPP to be determined. This is the key technology for improving the NPP intelligence (see Figure 1) (Elnokity et al., 2012).
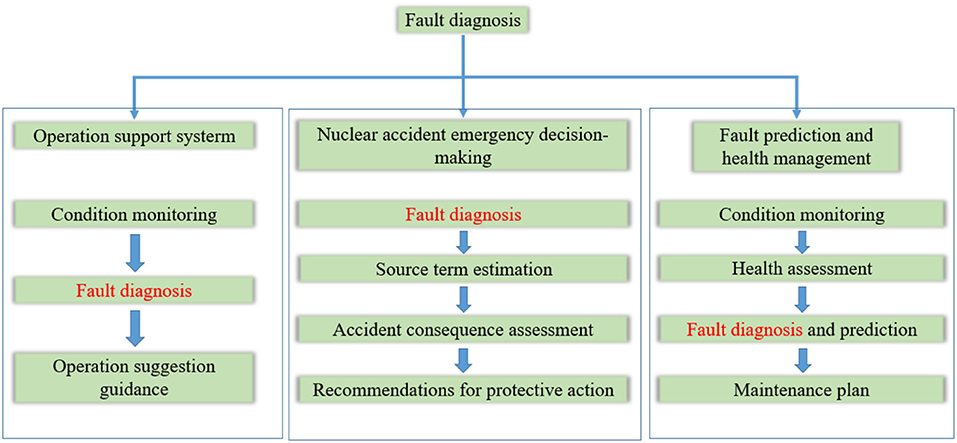
Figure 1. Application of fault diagnosis in Nuclear power plants (NPPs).
Many fault diagnosis methods for the NPPs have been developed, including those based on neural networks (Seker et al., 2003; Mo et al., 2007; Hadad et al., 2011), Bayesian networks (Friedman et al., 2017; Gheisari and Meybodi, 2017; Li et al., 2018), dynamic uncertainty causal graphs (Zhou and Zhang, 2017), and signed directed graphs (Liu et al., 2016). The fault diagnosis can be divided into data-driven, signal processing, and model-based methods (see Figure 2) (Ma and Jiang, 2011). The data-driven methods rely on a data model to obtain the fault state and often use neural networks or principal component analysis (Hines and Garvey, 2007; Li et al., 2017). The signal-based methods operate in the time domain and employ techniques such as wavelet analysis, time–frequency analysis, and spectral analysis (Ma and Jiang, 2011). There are two main approaches for the model-based fault diagnosis. One approach is based on the use of an expert knowledge, e.g., expert systems (Kramer and Palowitch, 1987; Vila-Francés et al., 2013). The other approach is based on a graph theory, i.e., the model graphically displays relationships between various parameters and faults, such as in a Bayesian network (Kang and Golay, 1999; Li and Ueno, 2017; Li et al., 2017; Li and Mahadevan, 2018), first principle model (Pantelides and Renfro, 2013), signed directed graph (Liu et al., 2016), and uncertain causality graph (Khakzad et al., 2011).
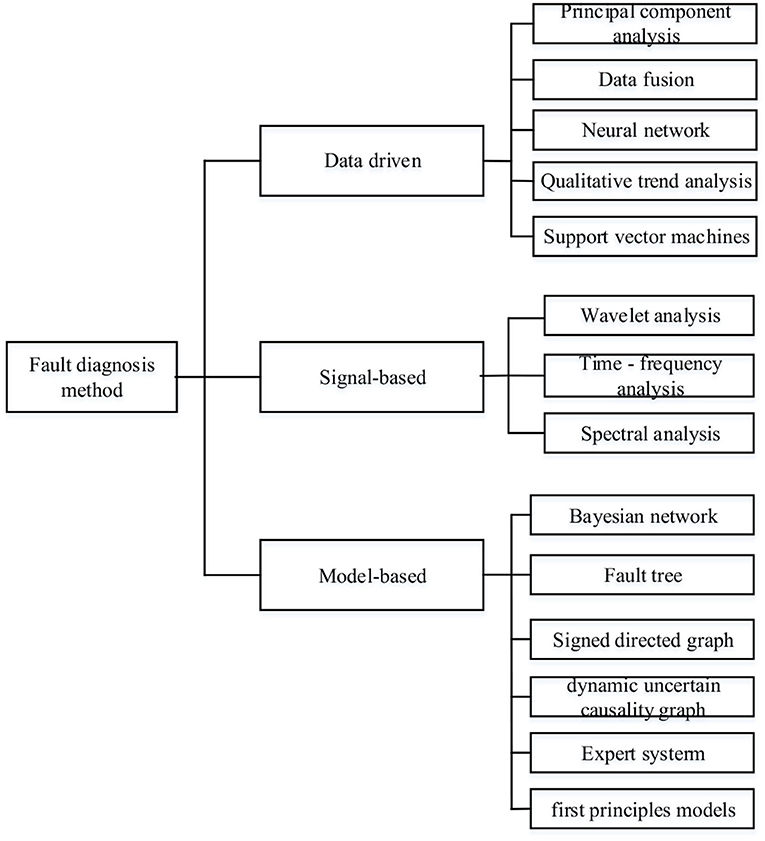
Figure 2. Classification of common fault diagnosis methods.
In the early application of fault diagnosis, the expert systems were mainly used to identify faults through the reasoning between specific parameters and the associated faults (Marseguerra et al., 2003). With the advancement in research, the data-driven methods have gradually become more popular for fault diagnosis, such as neural networks and principal component analysis (Embrechts and Benedek, 2004; Liu et al., 2014). Although the data-driven approach can quickly and accurately find the relationship between the data and fault diagnosis, it is a “black box” tool, meaning that it is difficult to determine the relationship between the system parameters and the signs of a fault (Zhu et al., 2006). Due to extensive study in the data-driven methods, the fault diagnosis has started to adopt the knowledge map approach (see Figure 3). However, with the application of knowledge graph, it is difficult to obtain a complex model of NPPs. Therefore, this study seeks machine learning of threshold method (less data dependence) to complete the fault diagnosis.
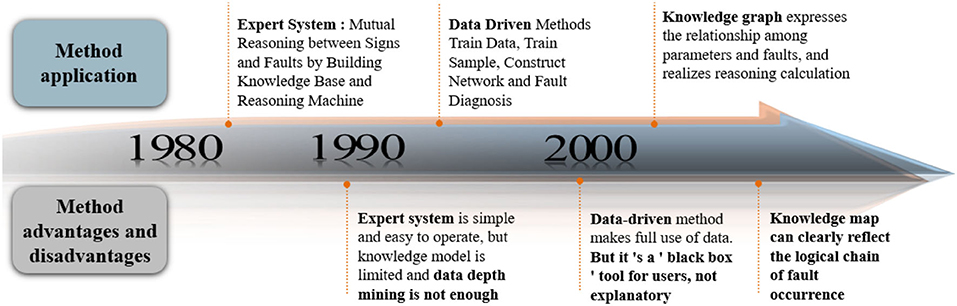
Figure 3. Development history of NPP fault diagnosis methods.
The NPPs are complex industrial systems in which each piece of equipment or subsystem completes the own task. Based on the function and structure of NPPs, they can be described as typical distributed systems. The various fault mechanisms of NPPs mean that the traditional methods struggle to complete fault diagnosis. The distributed diagnosis method takes into account the characteristics of the system and decomposes the complex fault diagnosis task into simple subsystems. Each subsystem uses an appropriate method and knowledge to solve the task. Finally, the diagnosis results for the subsystem were calculated by a process known as information fusion to provide the operator with a decision (Liu et al., 2016). This diagnosis strategy (as shown in Figure 4) has been widely used for fault diagnosis in large-scale complex systems in the aerospace and chemical industries, among many others (Liu et al., 2014).
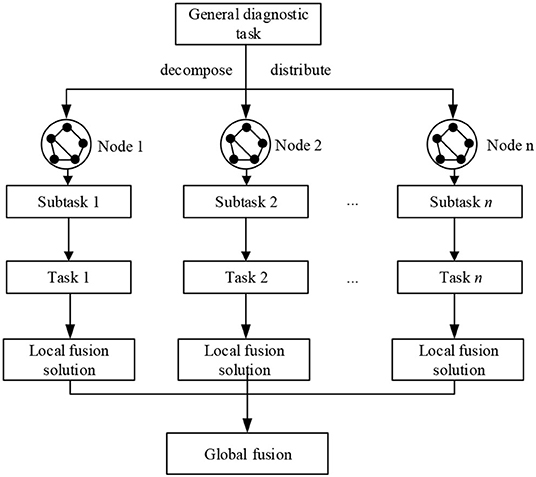
Figure 4. Logic diagram of distributed fault diagnosis.
The main problems with fault diagnosis in complex systems, such as NPPs, are as follows:
(1) The problems mainly include the complexity of the diagnosis, the limitation of the diagnosis method, and the uncertainties associated with the relevant knowledge. The existing models cannot accurately and quickly express the relationship in terms of the parameter coupling and uncertainties. This directly affects the reliability of the diagnosis results. It is difficult to construct a complete and accurate model that effectively expresses the relationships involved in the system.
In this study, the relationship between parameters is obtained by a neural network, and the complex NPP system is decomposed by a distributed neural network. The relationship between models is simplified by the distributed neural network. The proposed method then uses information fusion to improve the accuracy of fault diagnosis.
(2) The parameters involved in the accident initially change very slowly. Obtaining key information plays a very important role in fault diagnosis. The parameters of the accident change slowly in the early stages and do not exceed their thresholds. Since these weak parameter changes caused by the fault are difficult to identify, it is difficult to achieve early fault diagnosis. For example, in the early stages of accidents involving the loss of coolant, the parameters such as the containment pressure and temperature slowly rise/fall (without exceeding their thresholds), and it is difficult to identify the early signals. Thus, this study describes the generation of samples for machine learning from the trends of these parameters, which enables the speed of diagnosis to be enhanced.
Fault diagnosis, as a form of artificial intelligence (i.e., pattern recognition), is a critical and complex part of technology. This study focuses on the engineering and technical problems encountered in fault diagnosis with the aim of satisfying the real-time and accuracy requirements of diagnosis in NPPs. The method and results reported in this study will be of great significance in the further improvement of the NPP fault diagnosis.
Artificial Neural Network
The basic units of neural networks are called artificial neurons. The artificial neurons are models of biological nerves and are generally divided into an input, an output, and an activation function. The structure of these neurons is shown in Figure 5 (Mo et al., 2007).
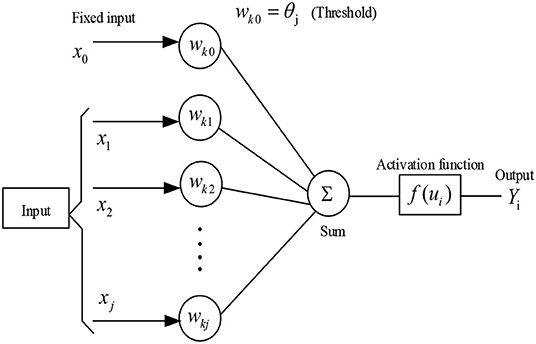
Figure 5. Basic structure of a single-layer neural network.
The inputs can be considered as data and they are processed by the neurons to simulate the artificial neurons. The relationship between the quantities in Figure 5 is as follows:
where xj is the input signal, w is the internal structure of the neuron, ui is the connection weight (i.e., the binding strength), θj is the threshold, f (ui) is an activation function, and Yi is the output signal. The activation function acts as a linear or non-linear function. The structure of the neural network is explained in the following subsections.
Back Propagation Neural Network
Back propagation (BP) neural networks use a multi-layer feed forward structure for machine learning. The standard three-layer network structure is shown in Figure 6 (Rohde et al., 2011).
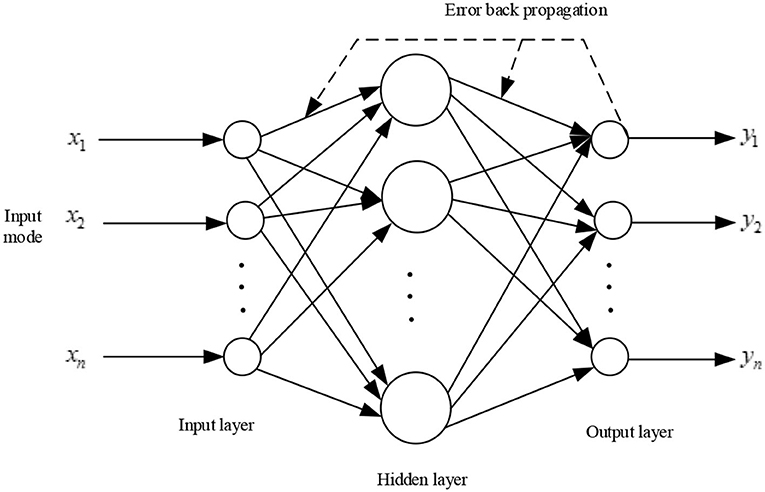
Figure 6. Back propagation (BP) network model.
The BP learning is divided into two parts: forward propagation and pre-propagation. The output of forward propagation in each layer is transmitted only to the neurons in the next layer. If the output layer cannot attain the desired output, it will transfer data through backpropagation and then modify the input connection weights of the neurons until the error reached the required degree of accuracy.
The principle of the BP neural network is through input and the hidden layer get output. Then the error between the actual output and the output is calculated, and the error function is used to adjust the connection weights between the layers of the network and the threshold of the neurons. When the error requirements are met, the relationship between input and output is established, so this method can be used to solve problems such as pattern recognition and classification (Liu et al., 2015).
Neural Network for Fault Diagnosis
To realize fault diagnosis in NPPs, first it is necessary to obtain data to process the samples and then apply machine learning to the samples to obtain a neural network diagnosis model. After the training model has been obtained, when the data undergo processing for input to the neural network, output is the type of fault. A diagnosis flowchart is shown in Figure 7.
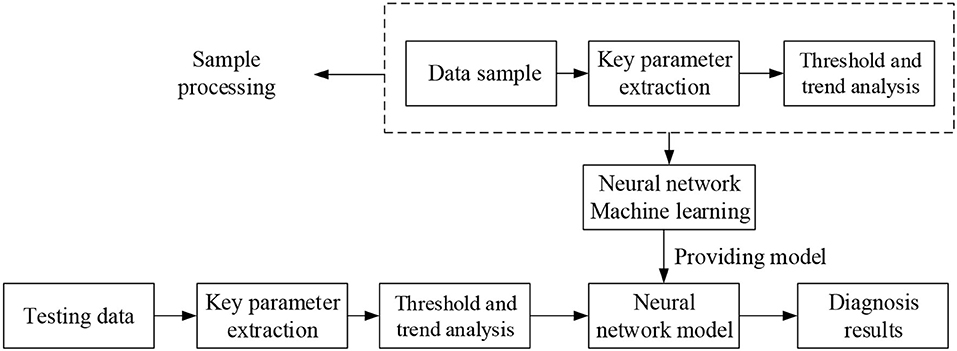
Figure 7. Framework of neural network for fault diagnosis.
Sample Construction Using Thresholds and Trends
The training samples are constructed according to the trend of the parameters. The trend is specified as either “rising,” “declining,” or “normal.” This method can identify abnormalities before the parameters reach their thresholds. However, some parameters also exhibit upward or downward trends when the NPP is in normal operation. Therefore, we must consider the normal fluctuation range of the parameters.
Combined with the operation data from an NPP simulator, the changes in parameters can be analyzed. For different operating conditions, we can modify the normal values and the upper and lower bounds of the parameter fluctuations. This method not only reduces the difficulty of neural network training but also solves the problem of BP network diagnosis in different conditions.
As shown in Figure 8, a value of 0.75 represents the situation when a parameter rises and exceeds the upper limit of normal fluctuation, or when the parameter exceeds the upper threshold. This threshold reduces the size of the BP sample. A parameter that is decreasing and falls below the lower limit of normal fluctuation is represented by a value of 0.25. The scenario in which a parameter is falling, but still exceeds the upper limit of normal fluctuation, is expressed by a value of 0.5 as shown in Figure 8. This can be understood as the parameter approaching the normal range. Similarly, a parameter that is below the lower limit of fluctuation but is increasing is represented by a value of 0.5, as shown in Table 1.
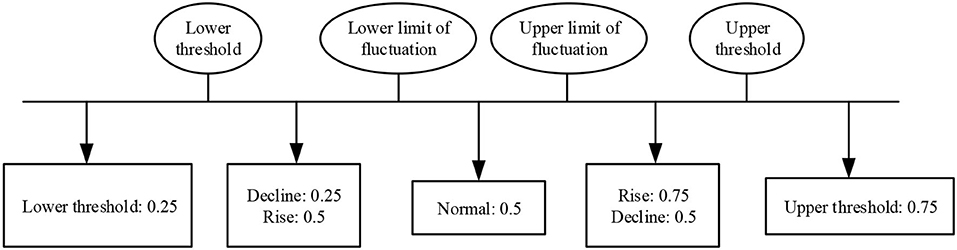
Figure 8. Parameter status division and representation.
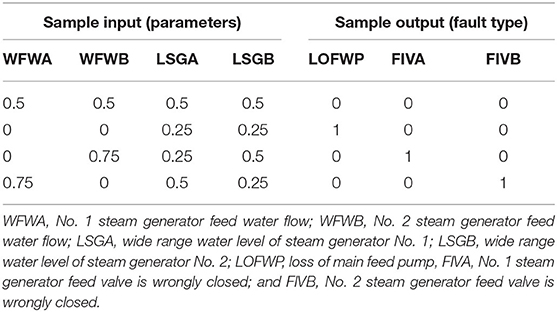
Table 1. Parameter thresholds combined with trends for sample construction.
Decision Tree for Fault Diagnosis
Theory
A decision tree is a tree structure that is used to classify data records. A leaf node of this tree represents a record set. The tree is established according to the different values of the available data. By establishing nodes and branches, a decision tree can be generated (Han and Kambr, 2001). Recently, the inductive learning of decision trees is widely used in risk assessment and fault diagnosis. The basic idea of decision trees is shown in Figure 9.
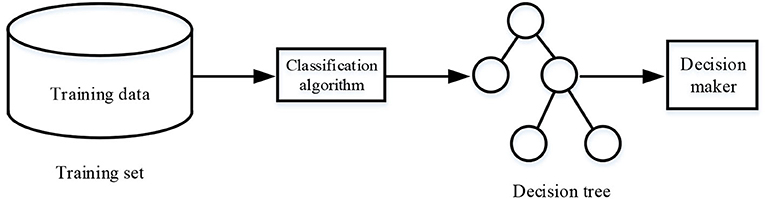
Figure 9. Flowchart of decision trees.
This classification in a tree structure is simple and easy to understand. Each path from the root node to the leaf node corresponds to an IF-THEN rule. The relationships between parameters and the outputs were clearly expressed.
Distributed Framework of Decision Tree Model
When the decision tree method is used to solve diagnosis tasks, it is necessary to establish a decision tree model. The diagnosis results of each sub-diagnosis system are comprehensively solved to obtain the final diagnosis results. This is similar to the construction of BP neural network samples. The decision tree model makes up for the poor interpretability of “black box” BP neural networks. Additionally, the algorithm selects the characteristic parameters that can distinguish all kinds of faults as the root node and intermediate node of the decision tree. This greatly simplifies the rules and reduces the complexity of reasoning. The accuracy of the results can be improved by combining the decision tree method with a BP neural network. Figure 10 shows the decision tree model for “containment monitoring” and the “main coolant system.”
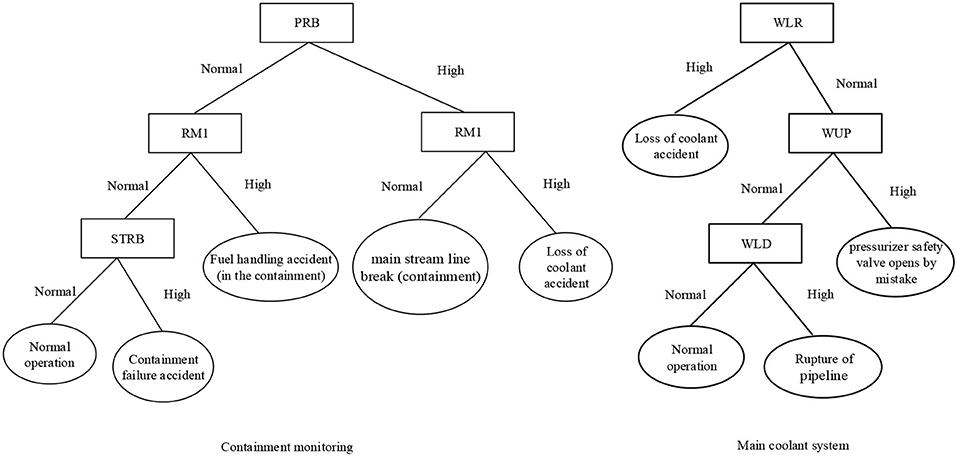
Figure 10. Decision tree model of containment monitoring and the main coolant system (RM1, radioactivity level in the containment; PRB, pressure in the containment; WLR, the main coolant leakage flow rate; WUP, pressurizer safety valve flow; and WLD, lower leakage pipeline flow).
In Figure 10, each rectangle represents a monitoring parameter and each ellipse represents an accident type. Each path from root node to leaf node can be transformed into corresponding IF-THEN rules. For example:
IF (PRB = “high” and RM1 = “normal”), THEN fault type = “main stream line break (containment)”
IF (PRB = “high” and RM1 = “high”), THEN fault type = “loss of coolant accident”
IF (PRB = “normal” and RM1 = “high”), THEN fault type = “fuel handling accident (containment).”
The fault diagnosis system is divided into multiple sub-diagnosis systems, each incorporating the corresponding monitoring parameters. When a fault occurs, it may affect the parameters of multiple subsystems. Therefore, the decision tree model established for each subsystem is only preliminarily solved in the sub-task space, and rules may not be sufficient for the diagnosis. Through the reasoning between various systems, the diagnosis can be accurately completed, which is a characteristic of the distributed diagnosis method.
Evidence Theory
Based on the diagnosis results for each NPP subsystem, it is necessary to adopt an appropriate method to achieve an overall decision. An evidence theory is a kind of uncertain reasoning and decision-making method that can handle inaccurate, uncertain, and fuzzy problems. As a good decision model, the evidence theory has been widely used in multi-sensor information fusion, target recognition, and uncertain information decision-making (Uren et al., 2016).
Basic Principles of Evidence Theory
Multi-source information fusion, known as data fusion, was proposed in the 1970's (Dempster, 1967). The data fusion improves the decision-making process when the available information is uncertain, but it can give rise to ambiguous and contradictory problems. The Dempster–Shafer theory (DST) fusion model requires mutual exclusion between the elements using evidence rules. For Θ = {θ1, θ2, …, θn}, evidence A and B, the basic corresponding functions m1 and m2, and the DST evidence combination rules are (Smarandache and Dezert, 2006):
where K is the degree of conflict between evidence A and B. A larger value of K implies that there is more conflict between evidence A and B. For multiple pieces of evidence mi, the fusion of results given by Equation (3) can be regarded as new evidence, which is then integrated into the next piece of evidence mi.
The DST fusion theory is based on two fusion models: the classic model (DSmC) and the hybrid model (DSmH). The fusion rule of DSmC is defined as
The fusion rule of DSmH is defined as
where
Suppose that the identification framework consists of two elements, i.e., Θ = {θ1, θ2}, and there are two independent and reliable sources of evidence, E1 and E2. The reliability assignment of the corresponding elements is presented in Table 2.
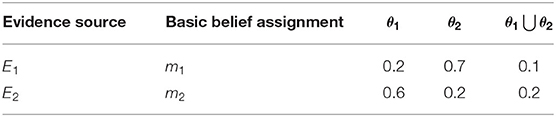
Table 2. Basic trust distribution table.
Therefore, for multiple pieces of evidence, obtaining the final consistent fusion decision results requires the support of evidence theory. The fusion results under different fusion rules are given as follows:
According to the DS fusion rules in Equations (3) and (4), the fusion results are
According to the DST classical model fusion rules in Equation (5), the fusion results are
Under the distributed diagnosis strategy, the task of the system is divided into various subtask spaces. The information fusion is then carried out using evidence theory. Finally, the single or concurrent fault is identified.
Distributed Integration Method
Assume that the diagnostic results for a subsystem at a given time are as listed in Table 3, where θ1 − θ7 represent seven different fault types. The faults can be diagnosed by the following different diagnostic subsystems.

Table 3. Fusion examples.
1. The union set of elements in the identification framework of diagnostic subsystems is the basic element of the identification framework. The refined unified identification framework is Θ = {θ1, θ2, θ3, θ4, θ5, θ6, θ7}.
2. The rule based on the evidence theory produces an “explosion” when the number of elements is too large. The aim of this identification framework is to extract useful information from the evidence by setting a threshold. When the reliability value of a fault in the diagnostic subsystem exceeds the threshold, as for θ4 and θ7 in Table 3, the remaining elements θ1, θ2, θ3, θ5, and θ6 are merged into one element Θ, which represents the set of elements other than θ4 and θ7. The reliability value of is the sum of the reliability values of its elements. Finally, the reliability values of each piece of evidence under the new identification framework are normalized to obtain the results listed in Table 4.
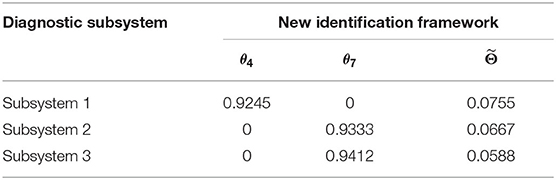
Table 4. Identification framework after refinement and coarsening.
The DST fusion rule can then be used with the DST rule applied for the fusion of evidence with small conflict rates. The final fusion results are presented in Table 5.
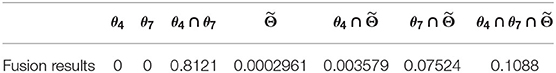
Table 5. Final fusion results.
Framework of Distributed Fault Diagnosis
The NPP fault diagnosis system adopts a distributed frame structure. The structure is shown in Figure 11, and it mainly includes a knowledge base, fault diagnosis, and global-level fusion diagnosis. The knowledge base integrates the BP neural network fault-diagnosis knowledge with the decision tree model-reasoning knowledge.
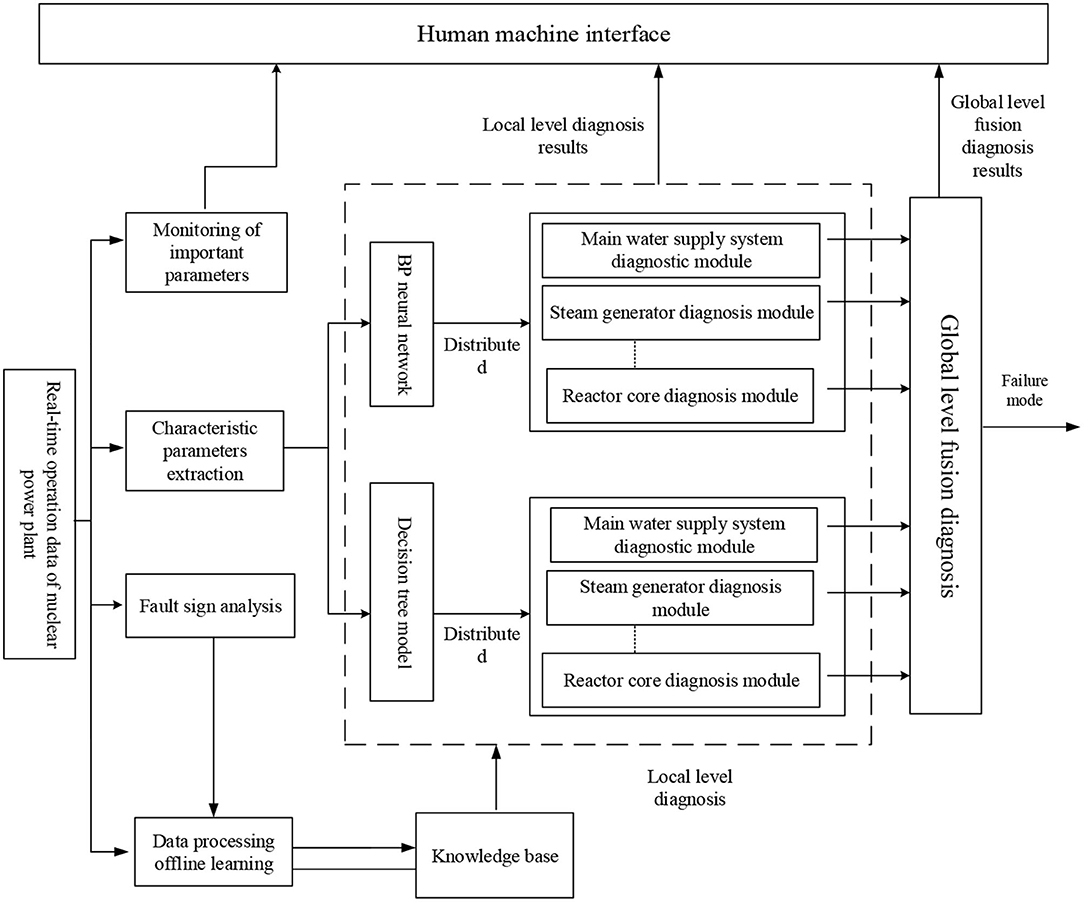
Figure 11. Structure of distributed fault diagnosis system for NPPs.
Case Studies
To verify the diagnostic ability of the distributed fault diagnosis system for a single fault, random faults were inserted into a simulator. The distributed fault diagnosis system provided real-time operation data for the NPP through the operation database and then identified the fault types.
The division of systems in the distributed fault diagnosis of NPPs is based on the distributed principles. The diagnosis tasks are decomposed and assigned to each diagnosis module. The subsystem division methods are based on (1) system structure, (2) system function, and (3) time series. After considering the importance of each system of safe operation, monitoring parameters, and other factors, this study uses a method based on the combination of system structure and function to divide the subsystems. The main monitoring parameters of each subsystem are listed, and the resultants are divided into reactor core system, containment monitoring system, radiation dose monitoring system, main water supply system, steam generator, main line steam system, main coolant system, equipment-valve system, equipment-pump system.
The sample is achieved by a software PCTRAN simulator. It was taken as the data source for the present study and it is a reactor transient and accident simulation software developed by the Micro-Simulation Technology Company (United States). As PCTRAN can be operated on a personal computer, it is convenient for nuclear power operation staff and researchers to study. Since its first release in 1985, the Micro-Simulation Technology Company has developed many versions of PCTRAN to suit different types of NPP (Po, 2004).
Steam Generator Tube Rupture Accident
After running the simulator under normal working conditions for 40 s, a tube rupture accident in the No. 1 steam generator, covering 100% of the cross-sectional area of the tube, was generated. The steam generator and the main water supply system successively diagnosed the tube rupture fault. The probability of the fault occurrence in the other seven diagnostic modules remained close to zero. This indicates the normal operation of the subsystem. The fusion diagnosis obtains the final fusion decision results. The diagnostic results of the BP neural network method are shown in Figures 12–14. The diagnostic results of the decision tree model are shown in Figures 15–17.
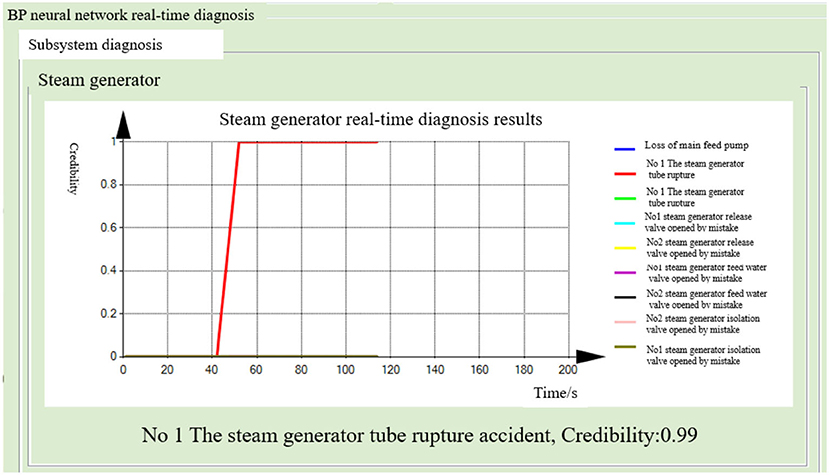
Figure 12. Real-time diagnosis result of steam generator (BP neural network method).
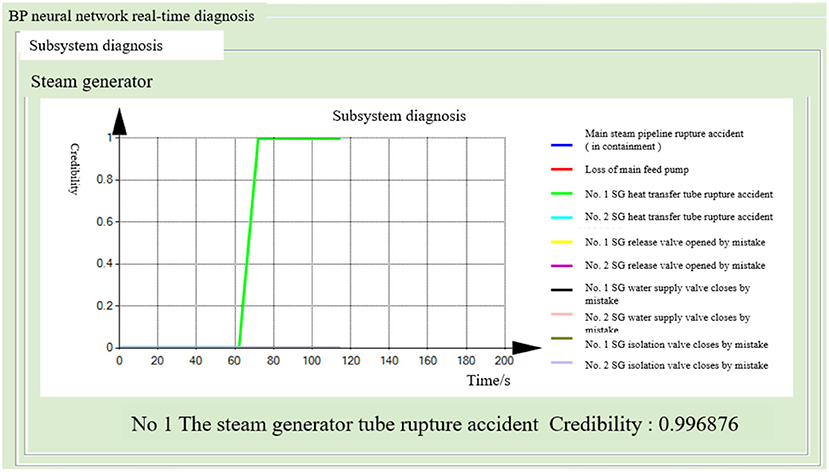
Figure 13. Real-time diagnosis results of the main water supply system (BP neural network).
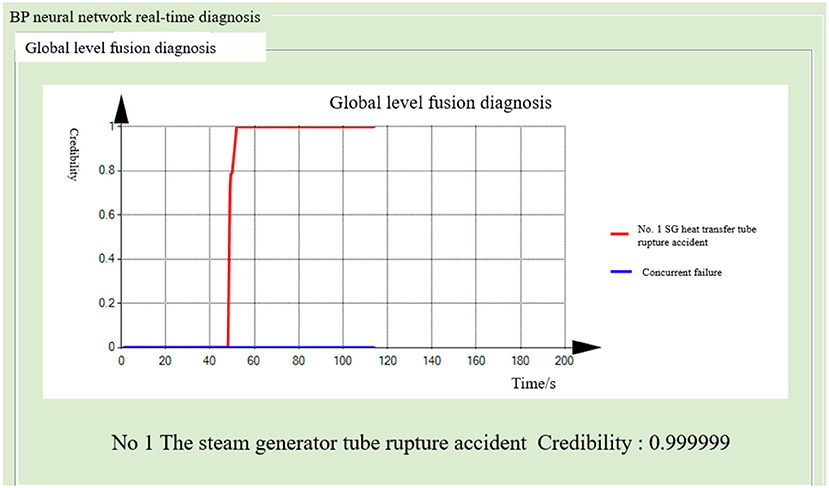
Figure 14. Global-level fusion diagnosis results (BP neural network method).
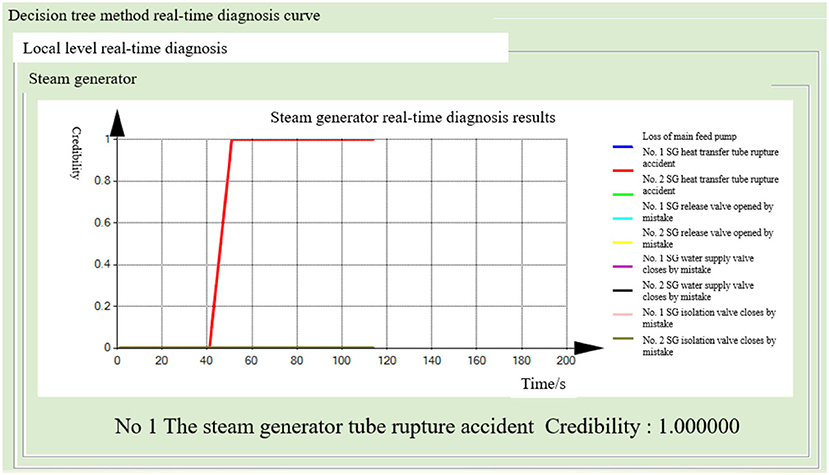
Figure 15. Real-time diagnosis result of steam generator (decision tree method).
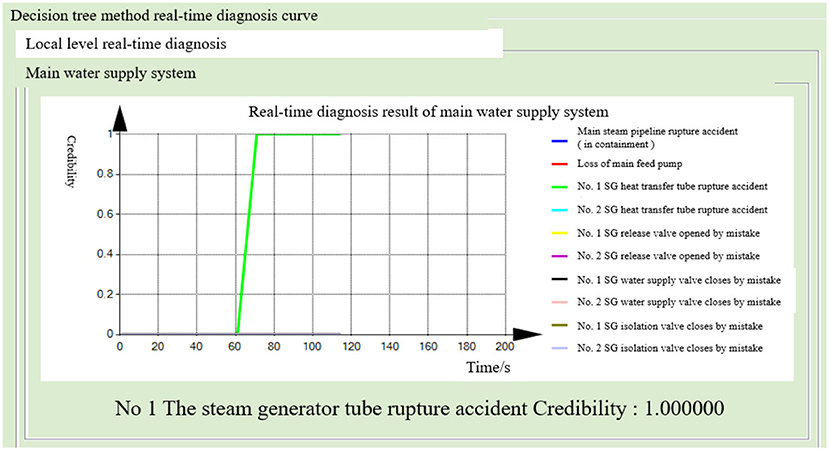
Figure 16. Real-time diagnosis results of the main water supply system (decision tree method).
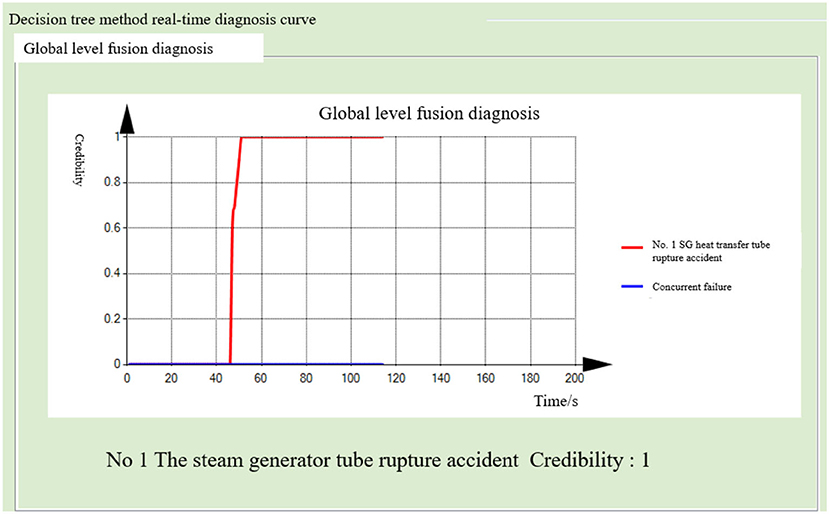
Figure 17. Global-level fusion diagnosis result (decision tree method).
Both the BP neural network method and the decision tree model obtained the correct diagnosis results in a short time, with the steam generator module diagnosing the fault earlier than the main water supply system. This is because the steam generator module can quickly diagnose such faults by monitoring the leakage flow and other parameters. When the fault occurs, the flow increases rapidly. As the main water supply system is monitoring the steam generator water level and other parameters, the symptoms are relatively slow to appear, so the fault diagnosis takes a longer time. In addition, the probability of fault-occurring results is improved by the mutual verification of both the methods.
Loss of Coolant Accident
The nuclear power simulator was operated under normal conditions for 40 s, and then a loss of coolant accident from a hole measuring 3 cm2 was inserted. After 10 s, the probability of the coolant loss accident exceeded 90% in the main coolant system, containment monitoring, and radiation dose monitoring modules of the distributed fault diagnosis system. Three sets of evidence pointed to the coolant loss accident, while the probability of the failure in the remaining six sub-modules remained close to zero. The diagnosis results of the BP neural network method and decision tree model method are shown in Figures 18, 19.
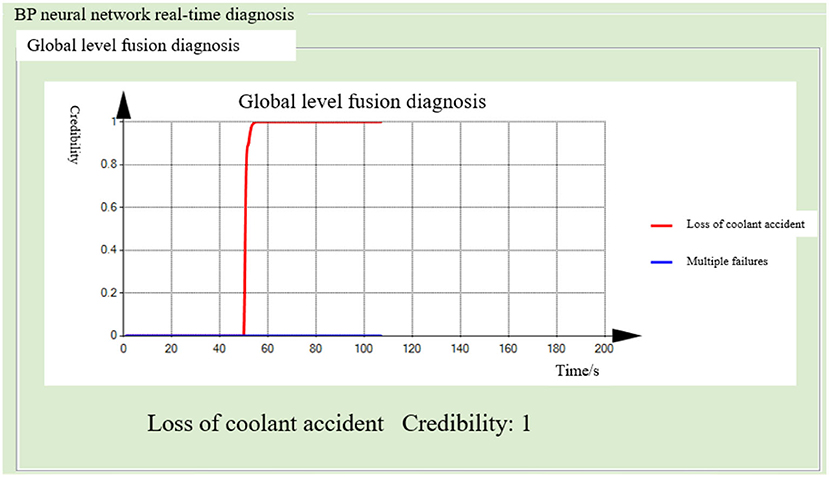
Figure 18. Global-level fusion diagnosis result (BP neural network method).
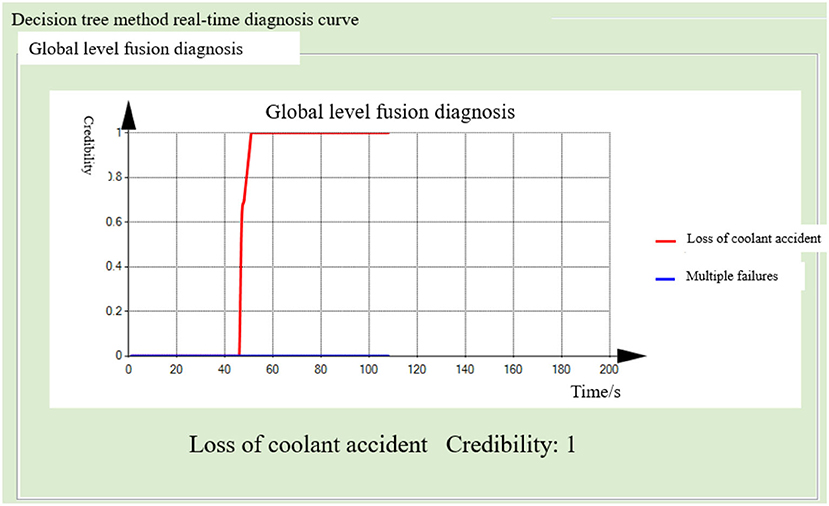
Figure 19. Global-level fusion diagnosis result (decision tree method).
The time difference between the two methods for fault diagnosis is not obvious, because the threshold method combined with the trend of the parameters is used to monitor the operation state of each parameter, which improves the diagnosis speed. However, the decision tree reasoning method selects the characteristic parameters that have the greatest effect on fault classification as nodes, and it does not require all signs to appear. Therefore, for some faults, the decision tree method has a faster diagnosis speed.
Conclusion
According to the proposed distributed diagnosis method, the identification of faults in NPPs was decomposed into several subsystems. The steam generator tube rupture accident and loss of coolant accident, respectively, use BP neural network and decision tree, for fault diagnosis. Through the distributed diagnosis, the diagnosis results of different subsystems were merged. This method not only reduces the number of samples in machine learning but also increases the speed of sample learning. The threshold value of parameters was obtained to construct sample, and the speed of diagnosis was improved by obtaining the trend of parameters. Information fusion was used for the diagnosis results, thus reducing the complexity of the fusion process and improving the accuracy of the diagnosis results. The simulation results show the superiority of the method proposed in this study.
The diagnosis ability of the distributed fault diagnosis system for NPPs can be extended to different power conditions. The fault diagnosis of NPPs after the protection intervention will be the topic of future research.
Data Availability Statement
The raw data supporting the conclusions of this article will be made available by the authors, without undue reservation.
Author Contributions
All authors listed have made a substantial, direct and intellectual contribution to the work, and approved it for publication.
Funding
This work was supported by National Key Research and Development Program (2019YFC0810705), National Key Research and Development Program (2018YFC0810601), and R&D projects in key areas of Guangdong Province (2019B111102002).
Conflict of Interest
The authors declare that the research was conducted in the absence of any commercial or financial relationships that could be construed as a potential conflict of interest.
References
Dempster, A. P. (1967). Upper and lower probabilities induced by a multivalued mapping. Ann. Mathemat. Statist. 38, 325–339. doi: 10.1214/aoms/1177698950
Elnokity, O., Mahmoud, I. I., Refai, M. K., and Farahat, H. M. (2012). ANN based sensor faults detection, isolation, and reading estimates – SFDIRE: applied in a nuclear process. Ann. Nucl. Energy 49, 131–142. doi: 10.1016/j.anucene.2012.06.003
Embrechts, M. J., and Benedek, S. (2004). Hybrid identification of nuclear power plant transients with artificial neural networks. IEEE T Ind. Electron. 51, 686–693. doi: 10.1109/TIE.2004.824874
Fan, J., Fan, J., Liu, F., Qu, J., and Li, R. (2019). A Novel Machine Learning Method Based Approach for Li-ion Battery Prognostic and Health Management. Salt Lake City: IEEE Access. doi: 10.1109/ACCESS.2019.2947843
Friedman, J. S., Droulez, J., Bessière, P., Lobo, J., and Querlioz, D. (2017). Approximation enhancement for stochastic Bayesian inference. Int. J. Approx. Reason. 85, 139–158. doi: 10.1016/j.ijar.2017.03.007
Gheisari, S., and Meybodi, M. R. (2017). A New reasoning and learning model for cognitive wireless sensor networks based on bayesian networks and learning automata cooperation. Comp. Netw. 124, 11–26. doi: 10.1016/j.comnet.2017.05.031
Hadad, K., Pourahmadi, M., and Majidi-Maraghi, H. (2011). Fault diagnosis and classification based on wavelet transform and neural network. Prog. Nuclear Energy 53, 41–47. doi: 10.1016/j.pnucene.2010.09.006
Han, J., and Kambr, M. (2001). Data Mining: Concepts and Techniques. Beijing: Higher Education Press.
Hines, J. W., and Garvey, D. (2007). Process and equipment monitoring methodologies applied to sensor calibration monitoring. Qual. Reliab. Eng. Int. 23, 123–135. doi: 10.1002/qre.818
Kang, C. W., and Golay, M. W. (1999). A Bayesian belief network-based advisory system for operational availability focused diagnosis of complex nuclear power systems. Expert Syst. App. 17, 21–32. doi: 10.1016/S0957-4174(99)00018-4
Khakzad, N., Khan, F., and Amyotte, P. (2011). Safety analysis in process facilities: comparison of fault tree and Bayesian network approaches. Reliabil. Eng. System Safety 96, 925–932. doi: 10.1016/j.ress.2011.03.012
Kramer, M. A., and Palowitch, B. L. (1987). A rule-based approach to fault diagnosis using the signed directed graph. AIChE J. 33, 1607–1078. doi: 10.1002/aic.690330703
Li, C., and Mahadevan, S. (2018). Efficient approximate inference in Bayesian networks with continuous variables. Reliabil. Eng. System Safety 169, 269–280. doi: 10.1016/j.ress.2017.08.017
Li, C., and Ueno, M. (2017). A depth-first search algorithm for optimal triangulation of Bayesian network. Int. J. Approx. Reason. 80, 294–312. doi: 10.1016/j.ijar.2016.09.012
Li, W., Peng, M., Liu, Y., Jiang, N., Wang, H., and Duan, Z. (2018). Fault detection, identification and reconstruction of sensors in nuclear power plant with optimized PCA method. Ann. Nucl. Energy 113, 107–117. doi: 10.1016/j.anucene.2017.11.009
Li, W., Peng, M. J., Yang, M., Xia, G. L., Wang, H., Jiang, N., et al. (2017). Design of comprehensive diagnosis system in nuclear power plant. Ann Nuclear Energy 109, 92–102. doi: 10.1016/j.anucene.2017.05.024
Liu, Y. K., Wu, G. H., Xie, C. L., Duan, Z. Y., Peng, M. J., and Li, M. K. (2016). A fault diagnosis method based on signed directed graph and matrix for nuclear power plants. Nucl. Eng. Design 297, 166–174. doi: 10.1016/j.nucengdes.2015.11.016
Liu, Y. K., Xie, C. L., Peng, M. J., and Ling, S. H. (2014). Improvement of fault diagnosis efficiency in nuclear power plants using hybrid intelligence approach. Prog. Nucl. Energy 76, 122–136. doi: 10.1016/j.pnucene.2014.05.001
Liu, Y. K., Xie, F., Xie, C. L., Peng, M. J., Wu, C. H., and Xia, H. (2015). Prediction of time series of NPP operating parameters using dynamic model based on BP neural network. Ann. Nucl. Energy 85, 566–575. doi: 10.1016/j.anucene.2015.06.009
Ma, J., and Jiang, J. (2011). Applications of fault detection and diagnosis methods in nuclear power plants: a review. Prog. Nucl. Energy 53, 255–266. doi: 10.1016/j.pnucene.2010.12.001
Marseguerra, M., Zio, E., Baraldi, P., and Oldrini, A. (2003). Fuzzy logic for signal prediction in nuclear systems. Prog. Nucl. Energy 43, 373–380. doi: 10.1016/S0149-1970(03)00048-9
Mo, K., Lee, S. J., and Seong, P. H. (2007). A dynamic neural network aggregation model for transient diagnosis in nuclear power plants. Prog. Nucl. Energy 49, 262–272. doi: 10.1016/j.pnucene.2007.01.002
Pantelides, C. C., and Renfro, J. G. (2013). The online use of first-principles models in process operations: Review, current status and future needs. Comp. Chem. Eng. 51, 136–148. doi: 10.1016/j.compchemeng.2012.07.008
Peng, M. J., Wang, H., Chen, S. S., Xia, G. L., Liu, Y. K., Yang, X., et al. (2018). An intelligent hybrid methodology of on-line system-level fault diagnosis for nuclear power plant. Nucl. Eng. Technol. 50, 396–410. doi: 10.1016/j.net.2017.11.014
Po, L. C. (2004). PCTRAN/PWR Personal Computer Transient Analyzer for a Two-Loop PWR Manual. Micro-Simulation Technology.
Rohde, U. L., Jain, G. C., Poddar, A. K., and Ghosh, A. K. (2011). Inverse Trigonometric Functions and Their Derivatives. Introduction to Differential Calculus: Systematic Studies with Engineering Applications for Beginners. John Wiley & Sons, Inc. doi: 10.1002/9781118130155
Seker, S., Ayaz, E., and Türkcan, E. (2003). Elman's recurrent neural network applications to condition monitoring in nuclear power plant and rotating machinery. Eng. Appl. Artif. Intel. 16, 647–656. doi: 10.1016/j.engappai.2003.10.004
Smarandache, F., and Dezert, J. (2006). Advances and Applications of DSmT for Information Fusion. Rehoboth, DE: American Research Press.
Uren, K. R., van Schoor, G., du Rand, C. P., and Botha, A. (2016). An integrated approach to sensor FDI and signal reconstruction in HTGRs – part I: theoretical framework. Ann. Nucl. Energy 87, 750–760. doi: 10.1016/j.anucene.2015.06.010
Vila-Francés, J., Sanchís, J., Soria-Olivas, E., José Serrano, J., Martínez-Sober, M., Bonanad, C., et al. (2013). Expert system for predicting unstable angina based on Bayesian networks. Exp. Syst. Appl. 40, 5004–5010. doi: 10.1016/j.eswa.2013.03.029
Wang, H., Peng, M.-J., Wu, P., and Cheng, S. Y. (2016). Improved methods of online monitoring and prediction in condensate and feed water system of nuclear power plant. Ann. Nucl. Energy 90, 44–53. doi: 10.1016/j.anucene.2015.11.037
Zhao, Y. F. (2016). Research on the Key Technologies of Nuclear Emergency Decision Making in High Temperature Gas-Cooled Reactor. Beijing: Tsinghua University.
Zhao, Y. F., Tong, J. J., Zhang, L. G., and Zhang, Q. (2015). Pilot study of dynamic Bayesian networks approach for fault diagnostics and accident progression prediction in HTR-PM. Nucl. Eng. Design 291, 154–162. doi: 10.1016/j.nucengdes.2015.05.010
Zhou, Z., and Zhang, Q. (2017). Model Event/fault trees with dynamic uncertain causality graph for better probabilistic safety assessment. IEEE Trans. Reliabil. 99, 1–11. doi: 10.1109/TR.2017.2647845
Keywords: nuclear power plants, distributed fault diagnosis, BP neural network, decision tree, information fusion
Citation: Guohua W, Zhiyong D, Diping Y, Jiyao Y, Caixue L and Dongxu J (2021) Distributed Fault Diagnosis Framework for Nuclear Power Plants. Front. Energy Res. 9:665502. doi: 10.3389/fenrg.2021.665502
Received: 08 February 2021; Accepted: 16 April 2021;
Published: 01 July 2021.
Edited by:
Xianping Zhong, University of Pittsburgh, United StatesReviewed by:
Xingang Zhao, Oak Ridge National Laboratory (DOE), United StatesZhegang Ma, Idaho National Laboratory (DOE), United States
Jiankai Yu, Massachusetts Institute of Technology, United States
Copyright © 2021 Guohua, Zhiyong, Diping, Jiyao, Caixue and Dongxu. This is an open-access article distributed under the terms of the Creative Commons Attribution License (CC BY). The use, distribution or reproduction in other forums is permitted, provided the original author(s) and the copyright owner(s) are credited and that the original publication in this journal is cited, in accordance with accepted academic practice. No use, distribution or reproduction is permitted which does not comply with these terms.
*Correspondence: Ji Dongxu, amlkb25neHVAY3Voay5lZHUuY24=