 Hailong Feng
 Zhifu Wang*
- Department of Vehicle Engineering, School of Mechanical Engineering, Beijing Institute of Technology, Beijing, China
Accurate open-circuit voltage (OCV) is crucial for state of charge (SoC) estimation of lithium-ion batteries and, hence has become a key factor to ensure the safety and reliability of electric vehicles (EVs). In engineering, the incremental OCV (IO) testing has been widely used for OCV calibrating. Based on this, the OCV is commonly simplified by averaging the discharging and the charging OCVs, which essentially ignores the influence of the major hysteresis (MH). By a series of experiments on the LiNiMnCoO2 battery, this work first systematically investigated the influence of the MH on SoC estimation via diverse current profiles tested at various ambient temperatures. Besides, the recursive least square (RLS) and the particle filter (PF) algorithms were introduced to estimate the battery parameters and the SoC, respectively. The results report that, compared with the traditional simplified method, the discharging direction and the charging direction of the MH can enhance the estimation accuracy of the discharging process and the charging process of the battery at all the operating conditions above, respectively. By the MH-based estimation method, the maximum mean absolute estimation error can be reduced by about 70%.
Introduction
Currently, as the rapid development of EVs (Zhang et al., 2019), lithium-ion batteries have been widely used as energy sources owing to their innate advantage (Ahmed et al., 2020). Since the accurate predicted SoC is a crucial function of battery management systems (Xuan et al., 2020), it plays a key role in ensuring the safety and reliability of EVs (Feng et al., 2020).
In the past, numerous battery models have been developed to carry out the prediction. Most of them concentrate on the equivalent circuit models (ECMs) (Hu et al., 2012, 2018; Li X.-Y. et al., 2019; Lai et al., 2020). This type of estimation method involves the development of the algorithms for battery models’ parameters (Wang et al., 2015; Wei et al., 2016; Xia et al., 2018; Liu et al., 2019; Zhou et al., 2020) and SoC estimations (Zhang et al., 2012; Feng et al., 2015; Dong et al., 2018; Zhou et al., 2019; Wang and Chen, 2020) and the OCV modeling. For the former, various algorithms have been combined in the past, among which the RLS-PF technique has been proved to be more accurate than the RLS-EKF algorithm (Dong et al., 2018). Therefore, this work combines the RLS-PF method for the estimation.
The other significant challenge for SoC estimation is how to catch a proper OCV model since it has always been embedded in the output equation of the space-state equation to correct SoC estimation errors. Research about OCV modeling can be mainly divided into the online-identification based method and the offline-test based method. Xiong et al. (2017) and Chen et al. (2019) proposed a method that can establish the model online, in which the OCV-SoC correlation was obtained through the way of estimations. However, it occupies vast computing resources of onboard microcontroller, which may increase the risk of identification program failure.
The offline-test based method can be further clarified into two groups, namely the model development and the OCV test procedure selection. For the former method, various models have been employed (Feng et al., 2014; Zhang et al., 2016; Ines et al., 2017; Saha et al., 2020). All of these models have been reported to be accurate enough in their specific scenarios. However, these models’ adaptability to various ambient temperatures and different dynamic loading conditions haven’t been verified. For the method of the test procedure selection, as the methods that are widely used in engineering, the low current OCV test, and the IO test have been employed in the past (Wang et al., 2018). Research in Yang et al. (2019) reported that the former method can result in an enlarged estimation error compared with the incremental OCV (IO) testing. Hence, relevant work in this paper will be conducted around the IO testing.
Battery’s OCV during charging is always higher than that during discharging even after a long rest period and the effect is known as the hysteresis effect. The captured OCVs by the discharging direction or the charging direction of different OCV testings are defined as the MH. For the IO testing, the OCV is commonly simplified by averaging the charging and the discharging OCVs, which ignores the possible influence of the MH on SoC estimation. From the perspective of engineering practice, this work only investigates the influence of the MH of the LiNiMnCoO2 battery on SoC estimation. In fact, it seems that there have existed some relevant research that implies the possible influence of the MH on the estimation. For example, research in Pan et al. (2017) established the OCV model only by fitting the discharging OCVs of the MH and achieved a good estimation result based on the discharging dynamic loading condition. In Zhu et al. (2019), the authors also just fitted the OCV-SoC datasets acquired from the discharging direction of the MH to establish the model. In Ceraolo et al. (2020), the authors also catched the model by only using data from the discharging direction of the MH to predict the SoC of the dynamic loading condition. Similar research can also be found in Pattipati et al. (2014) and Huang et al. (2019).
However, there still remain several open issues in the field. Firstly, although some researchers used the discharging direction of the MH for SoC estimation of the discharging dynamic loading condition, fewer of them compared this MH-based OCV model with the traditional simplified one in regard to the estimation accuracy. Secondly, the possible influence of the discharging direction of the MH on SoC estimation for various dynamic loading conditions at different battery operating temperatures have not been systematically investigated. Thirdly, fewer research has considered the MH’s effect on the estimation from the charging direction of the battery.
Focusing on systematically investigating the influence of the MH of the LiNiMnCoO2 battery on estimation accuracy and giving suggestions to the engineering field, this work first systematically investigated the influence of the MH on the SoC estimation accuracy via diverse current profiles from both the charging and discharging directions of the battery at various battery operating temperatures. On the other hand, all the aforementioned profiles are tested from the high to the low temperatures. Besides, the RLS and PF are employed for the battery parameters and the SoC co-prediction. The results show higher estimation accuracy and robustness of the MH-based OCV model than that of the traditional simplified model. Compared with the latter method, the former method can reduce the ratio of SoC mean absolute estimation error by about 70%.
The rest of this paper is organized as follows. Section “Battery Experiment” presents the details of the battery testings and the established OCV models. Section “Battery Model” introduces the battery model. The parameters and SoC co-predict algorithm based on the RLS and the PF is introduced in section “RLS and PF Based Model Parameter and SoC Co-predict Algorithm.” Then, the influence of the MH on SoC estimation accuracy are systematically investigated in section “Evaluation of the Hysteresis Effects on SoC Estimation.” Finally, conclusions are drawn in section “Conclusion.”
Battery Experiment
To conduct relevant works around the theme in this paper, corresponding battery tests were designed in this section.
We considered a battery test platform as shown in Figure 1, including a YKYTEC battery test machine with 16 independent charging and discharging channels to charge and discharge the tested battery cell, a thermal chamber to regulate the battery testing temperatures, and a computer with the YKYTEC software to set the battery testing conditions and record the testing data (current, voltage and temperature).
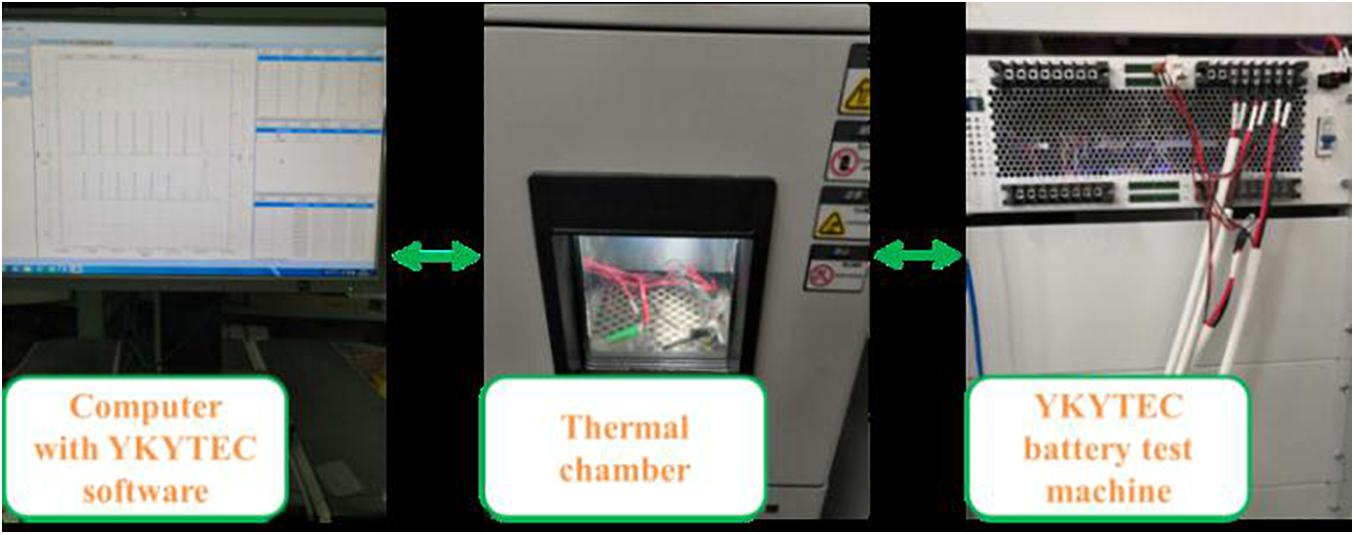
Figure 1. Battery test platform.
The commercial LiNiMnCoO2 battery cell was tested on the platform. The capacity, the nominal voltage, the charge cut-off voltage, and the discharge cut-off voltage are 3.0 Ah, 3.6, 4.25, and 2.5 V, respectively. The cell was tested by the characteristic test procedure at 40, 22, and 0°C. For the characteristic test, the available capacity test was loaded on the battery cell to calibrate the actual capacity, followed by the IO testing, followed by discharging hybrid pulse power characteristic (HPPC) testing, followed by the charging HPPC testing. Then, the dynamic stress test (DST) and the urban dynamometer driving schedule (UDDS) profiles were successively loaded on the tested cell to obtain the responding terminal voltages. Current profiles can be found in the later text.
In this section, the IO testing procedure is described. Firstly, the cell was charged to 100% SoC with a current of 0.5°C under the constant current and constant voltage (CCCV) mode (the charge cut-off current was 0.02°C), and the cell was rested for 2 h when the charging process was finished. Secondly, the cell was discharged in every 10% SoC interval until the SoC reached 10%. When each discharging interval was finished, the cell was rested for 2 h. Then, the discharging process at every 5% SoC was implemented until the terminal voltage drops to the discharge cut-off voltage, and the cell was also rested for 2 h after each discharging interval was completed. During the discharging process, the current was set to 0.5°C, and the corresponding SoC and terminal voltage (OCV) were recorded at the end of each rest period. Thirdly, the cell was charged by the same routine as the discharging process. The CCCV mode is applied to the last charging SoC interval to fully charge the cell. Since the polarization effects can exist up to several hours inside the battery, the rest period of 2 h was set to eliminate the effects after the current interruption.
Then, the OCV-SoC datasets of the discharging process of the testing were fitted by Eq. (1), followed by fitting the charging datasets by the equation. Then, an averaging process of the charging and discharging datasets and a fitting process according to that equation were successively conducted. The current profile of the IO testing for the battery tested at 22°C is shown in Figure 2A.
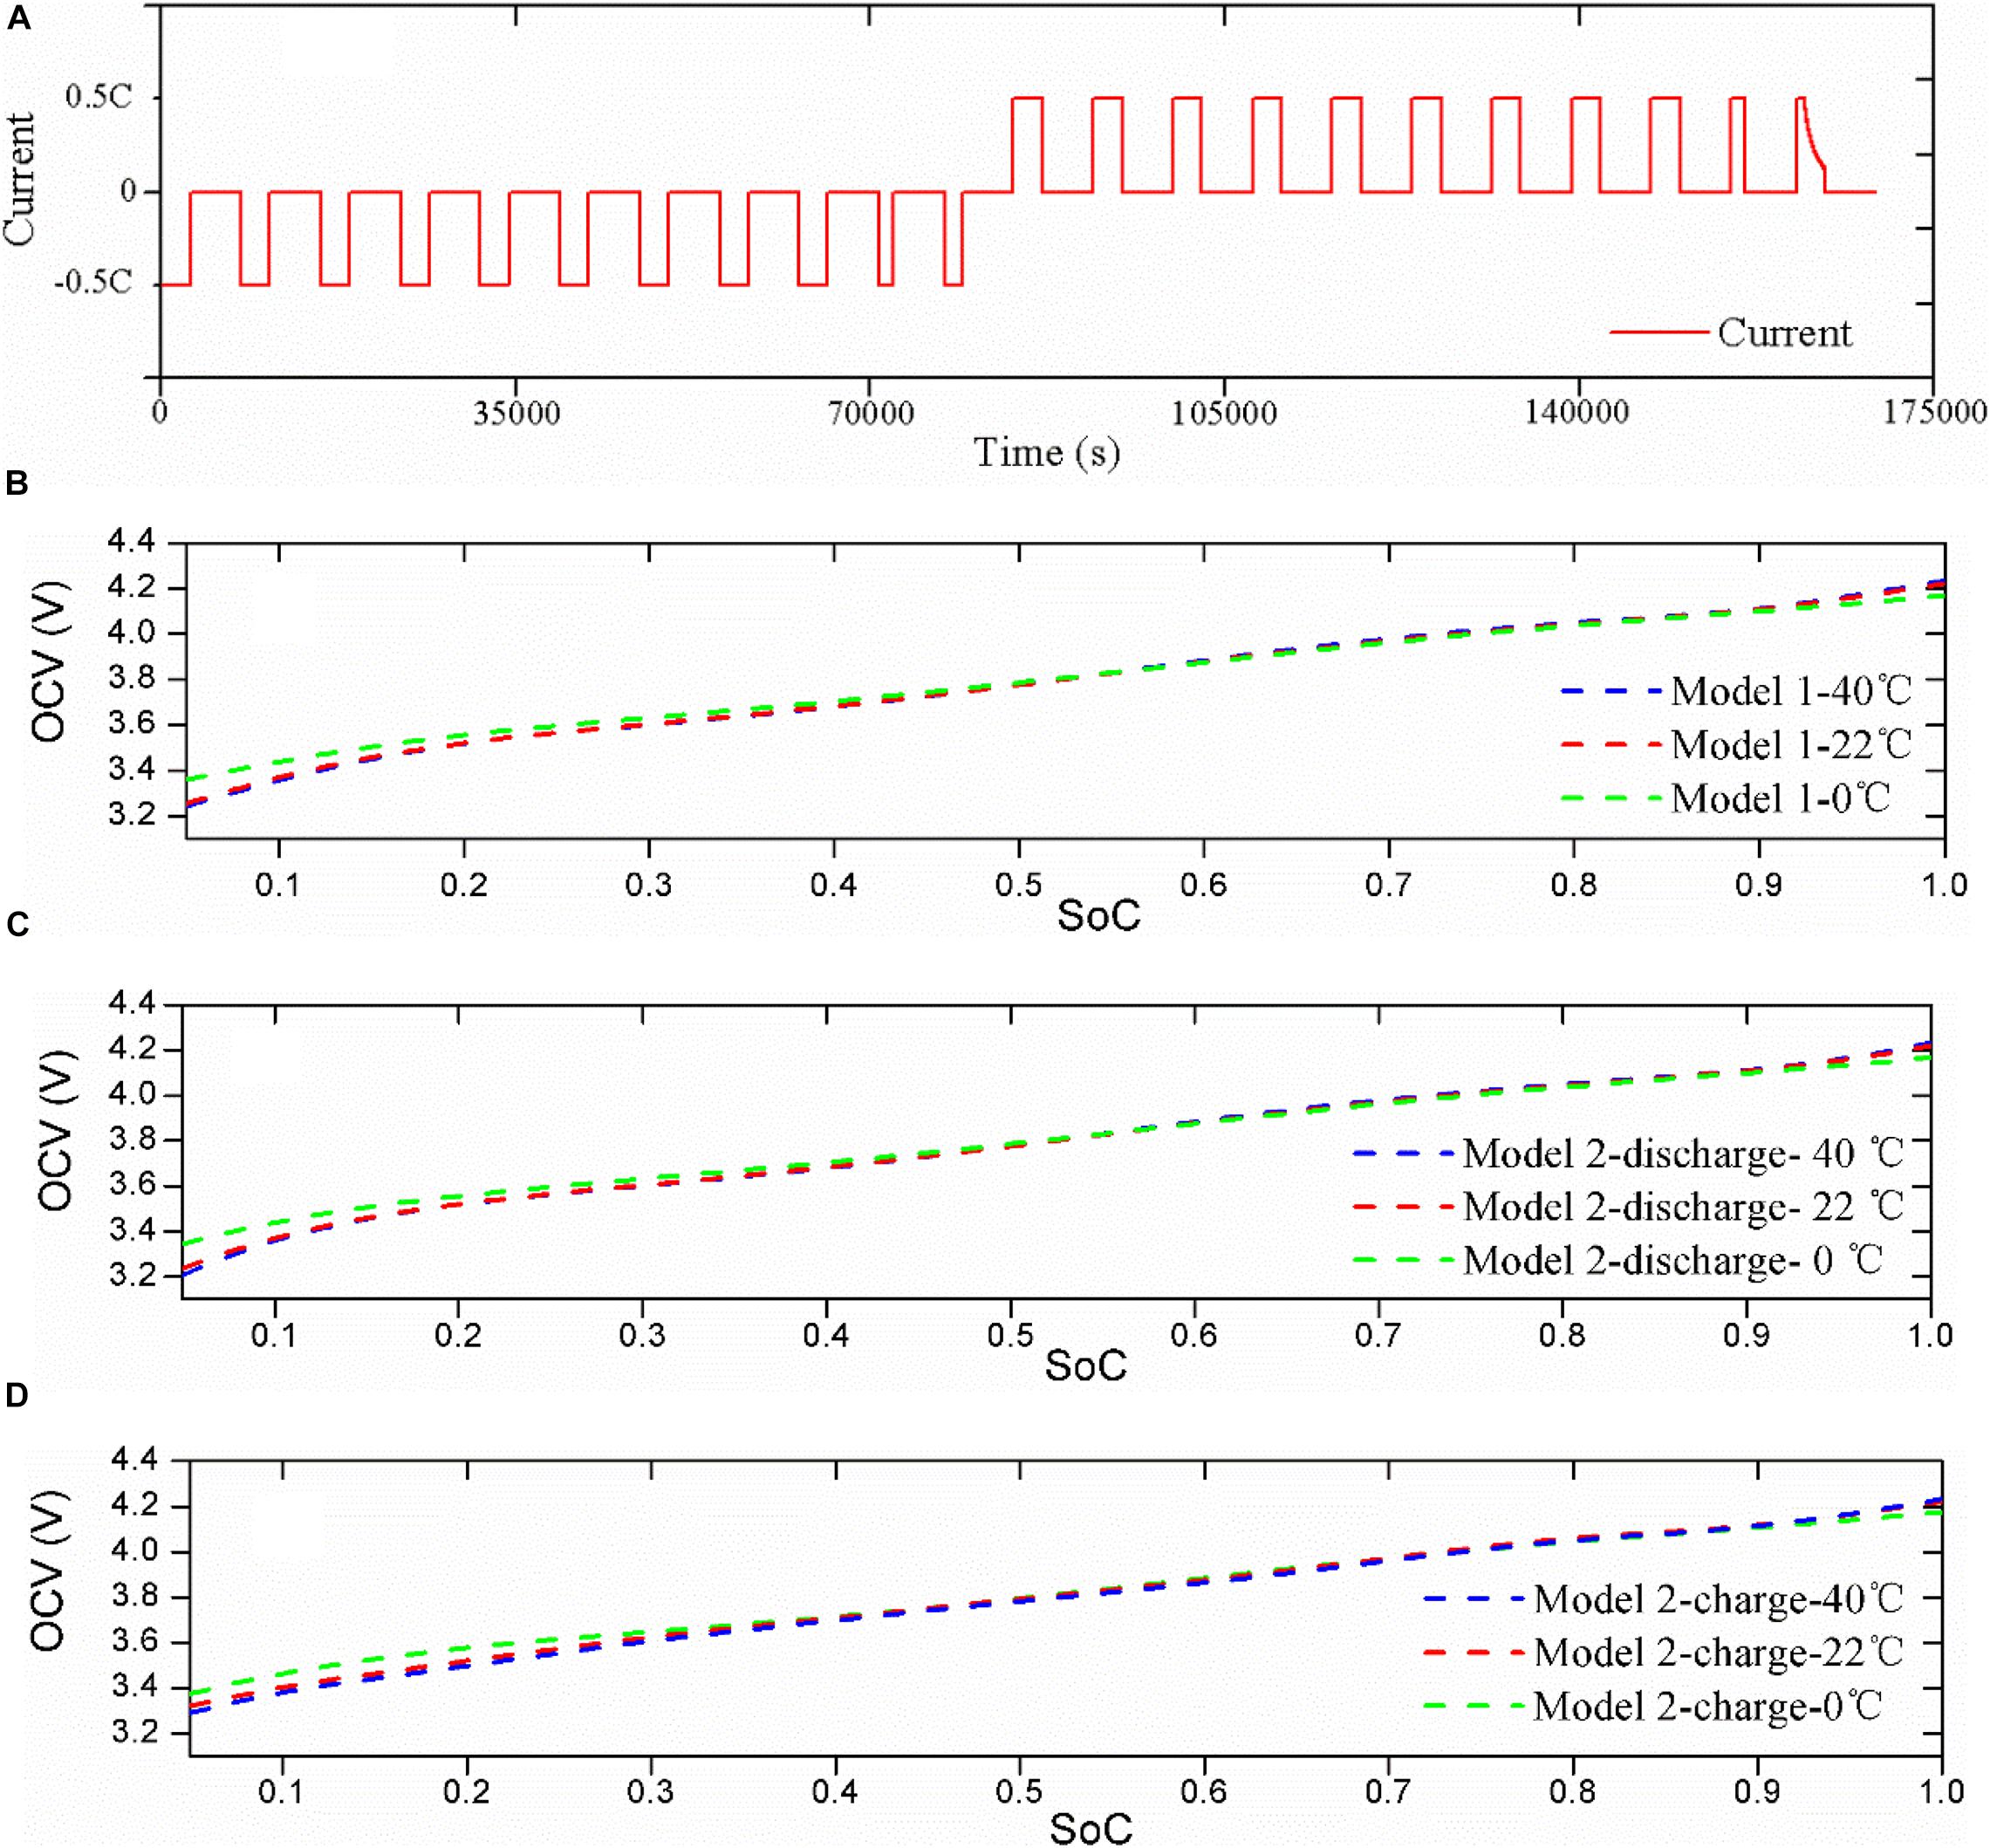
Figure 2. IO testing current profile and results. (A) Current profile; (B) Model 1; (C) Model 2 (discharge); (D) Model 2 (charge).
For the convenience of statements in the later text, we define the OCV model established by the averaged OCV of the charging OCV and the discharging OCV as model 1; the OCV model predetermined by the charging process or the discharging process as model 2.
where, αi (i = 0, 1,…, 6) are the parameters to fit the dataset obtained by the IO testing.
Figures 2B–D show the established two types of models. It can be observed that for the two models, there are similar tendencies for the battery cell tested at 40 and 22°C, but the model obtained at a low temperature of 0°C exhibits a large deviation in both the low SoC sub-interval and the high SoC sub-interval. Besides, it can be seen that the difference is small in the high SoC sub-interval, and there exists an enlarged difference in the low SoC sub-interval. The maximum OCV difference can highly reach about 51 mV, which can inevitably result in a big bias of SoC estimation.
Battery Model
The first-order RC battery model as shown in Figure 3 is employed to simulate the nonlinear characteristics of the battery cell here. It consists of a voltage source OCV, an ohmic resistance R0, a polarization resistance Rp and a polarization capacitance Cp. Ut is the terminal voltage, and Up represents the polarization voltage.
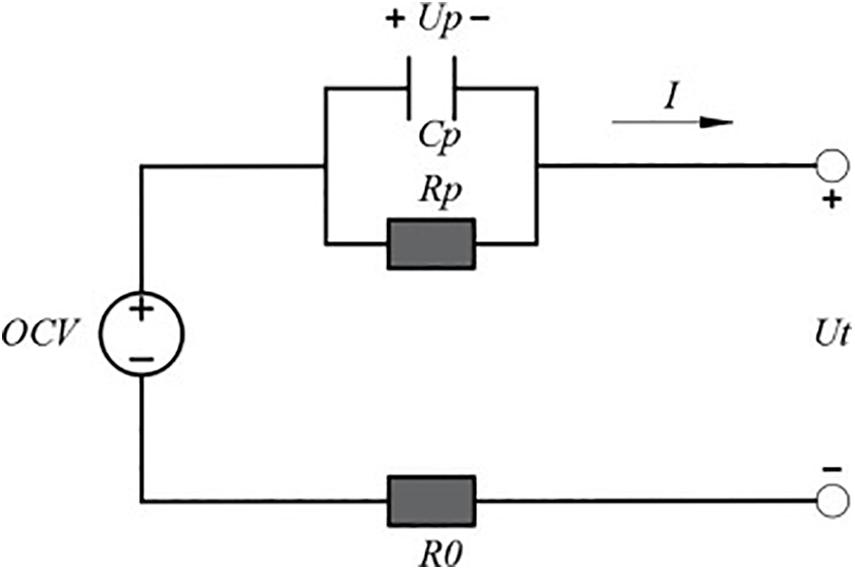
Figure 3. The first-order RC battery model.
The discretization form of the space-state equation of the battery model can be expressed as Eq. (2).
where Δt denotes the sampling time and equals 1 s in this study; k is the discrete-time index.
RLS and PF Based Model Parameter and SoC Co-Predict Algorithm
RLS Based Model Parameters Identification
The terminal voltage can be expressed as Eqs. (3) and (4).
We suppose that,
Hence, we can get Eq. (6).
The parameters of the first-order RC model can be expressed as Eq. (7).
Equations (3)–(6) can be updated according to the iterative computational procedure of the RLS as shown in Eq. (8):
where represents the prediction of the parameter vector θk; Kk and Pk are gain matrix and error covariance matrix, respectively, λ is forgetting factor; E′ represents the identity matrix.
PF Based Battery State Estimation
The PF algorithm has been widely applied to simulate non-linear systems without linearization. Hence, it is applied to estimate the battery state here.
SoC can be defined as Eq. (9).
where Ca denotes the current maximum available capacity of the battery; ηC represents the Ah efficiency which refers to the total discharge capacity divided by the total charge capacity.
The space-state equation of the nonlinear system can be described as Eq. (10).
where Zk is the state vector of the system; and are the process noise and the measurement noise with the covariance matrices Q′ and R′, respectively; A, B, D, and E are coefficients matrices.
Taking dynamic electrical characteristics in Eqs. (2) and (9) into consideration, we define Eq. (11),
Hence, parameters in Eq. (15) can be expressed as Eq. (17).
We substitute Zk,A,B,D,E into iterative computational formula based on the particle filter, then Upk and SoCk can be solved in real-time. The iterative computational procedure of PF is shown as follows.
For k = 0,
Step 1: initialization,
Generate m particles of initial state vector randomly through standardized normal distribution, i.e., , and define state and measurement noise covariance .
For k = 1, 2,…, ∞,
Step 2: state vector prior estimate,
Step 3: measurement update,
Step 4: solve the likelihood probability density of prior state,
Step 5: normalize the likelihood probability density,
Step 6: resampling based on the likelihood probability density,
Generate posterior particles based on multinomial resampling.
Step 7: output the state posterior estimate,
Evaluation of the Hysteresis Effects on SoC Estimation
In this section, the effects of the MH on the estimation performance are systematically evaluated via different current profiles at high temperature (40°C), room temperature (22°C), and low temperature (0°C) from both the discharging direction and the charging direction of the battery.
Evaluation by Discharging Current Profiles
Discharging current profiles used in this section can be found in Figures 4A–C show different kinds of dynamic loading conditions which are commonly used in EVs. Details of these profiles can be found in the engineering technical manual of EVs named “Freedom CAR Battery Test Manual for Power-Assist Hybrid Electric Vehicles” and “PNGV Battery Test Manual Partnership for a New Generation of Vehicles.” As can be seen from Figure 4D, the constant current discharging (CCD) profile is also set to evaluate the performances of the above OCV models in the steady discharging condition of the battery. The discharging C-rate is set to 1°C.
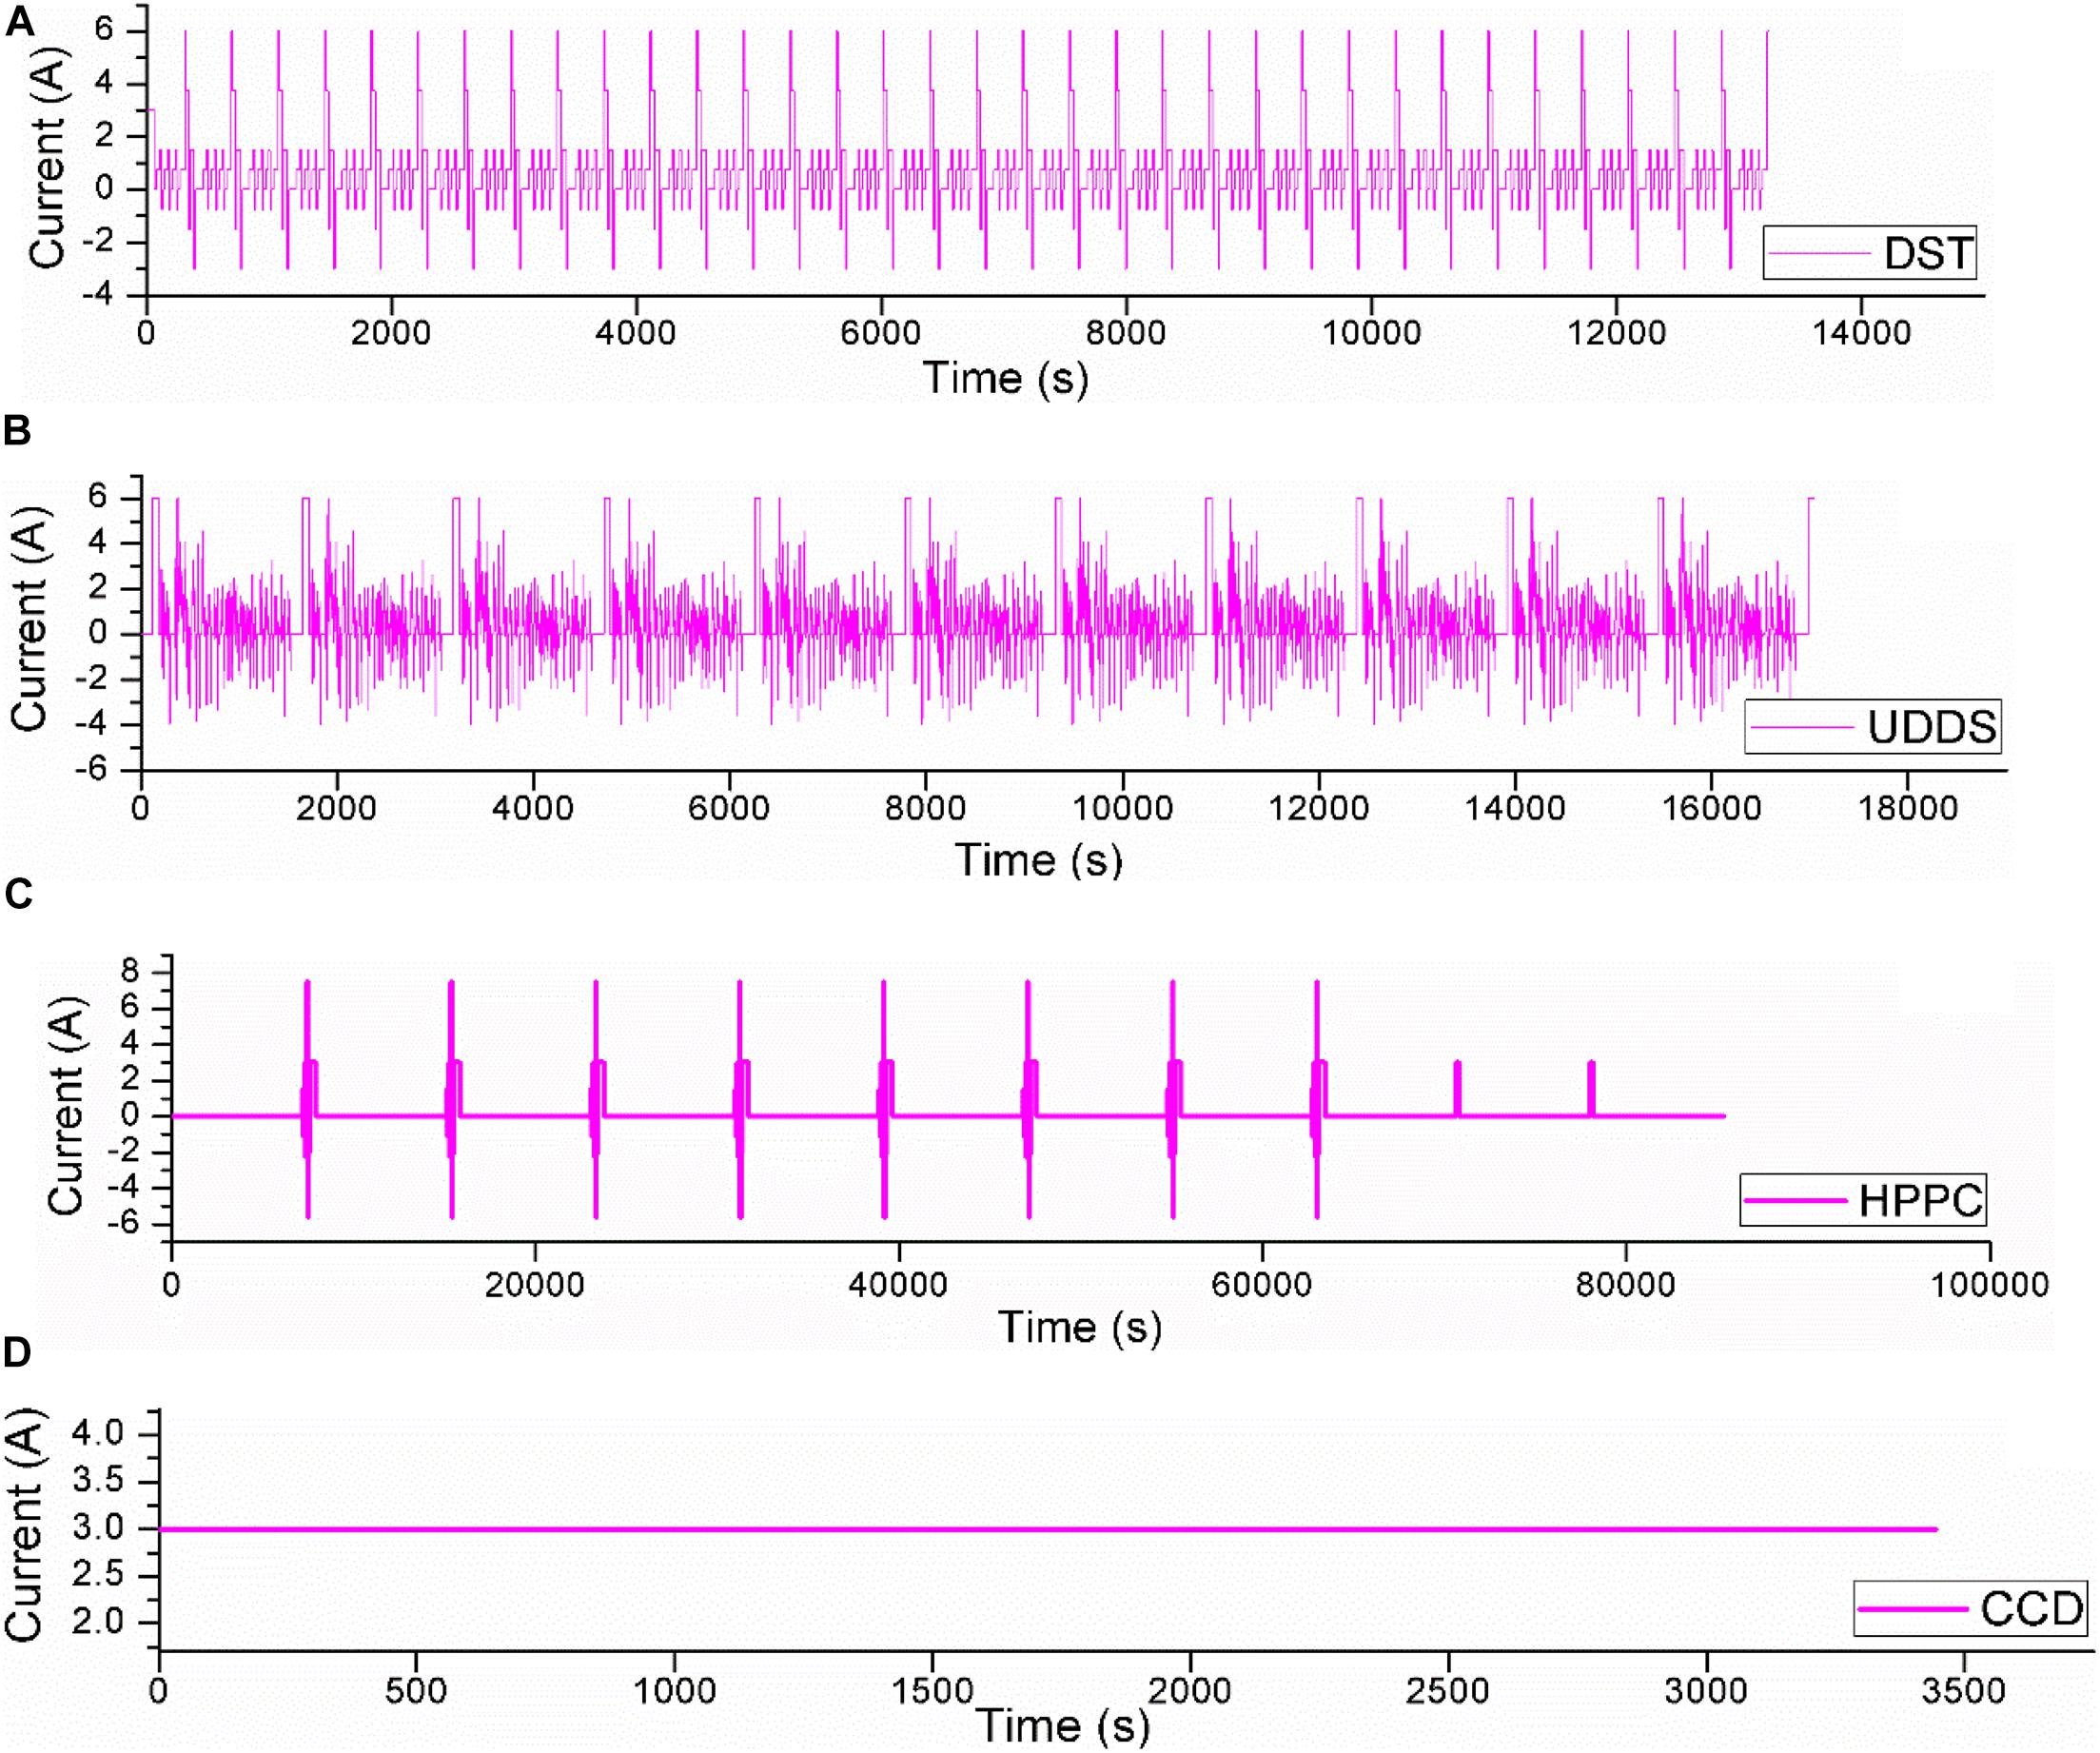
Figure 4. Discharging current profiles. (A) DST; (B) UDDS; (C) HPPC; (D) CCD.
It is of significance to acquire accurate battery parameters for precise SoC estimation. Take parameters identification results of the battery cell tested at room temperature (22°C) via the DST dynamic loading profile as an example, the identified results are shown in Figure 5.
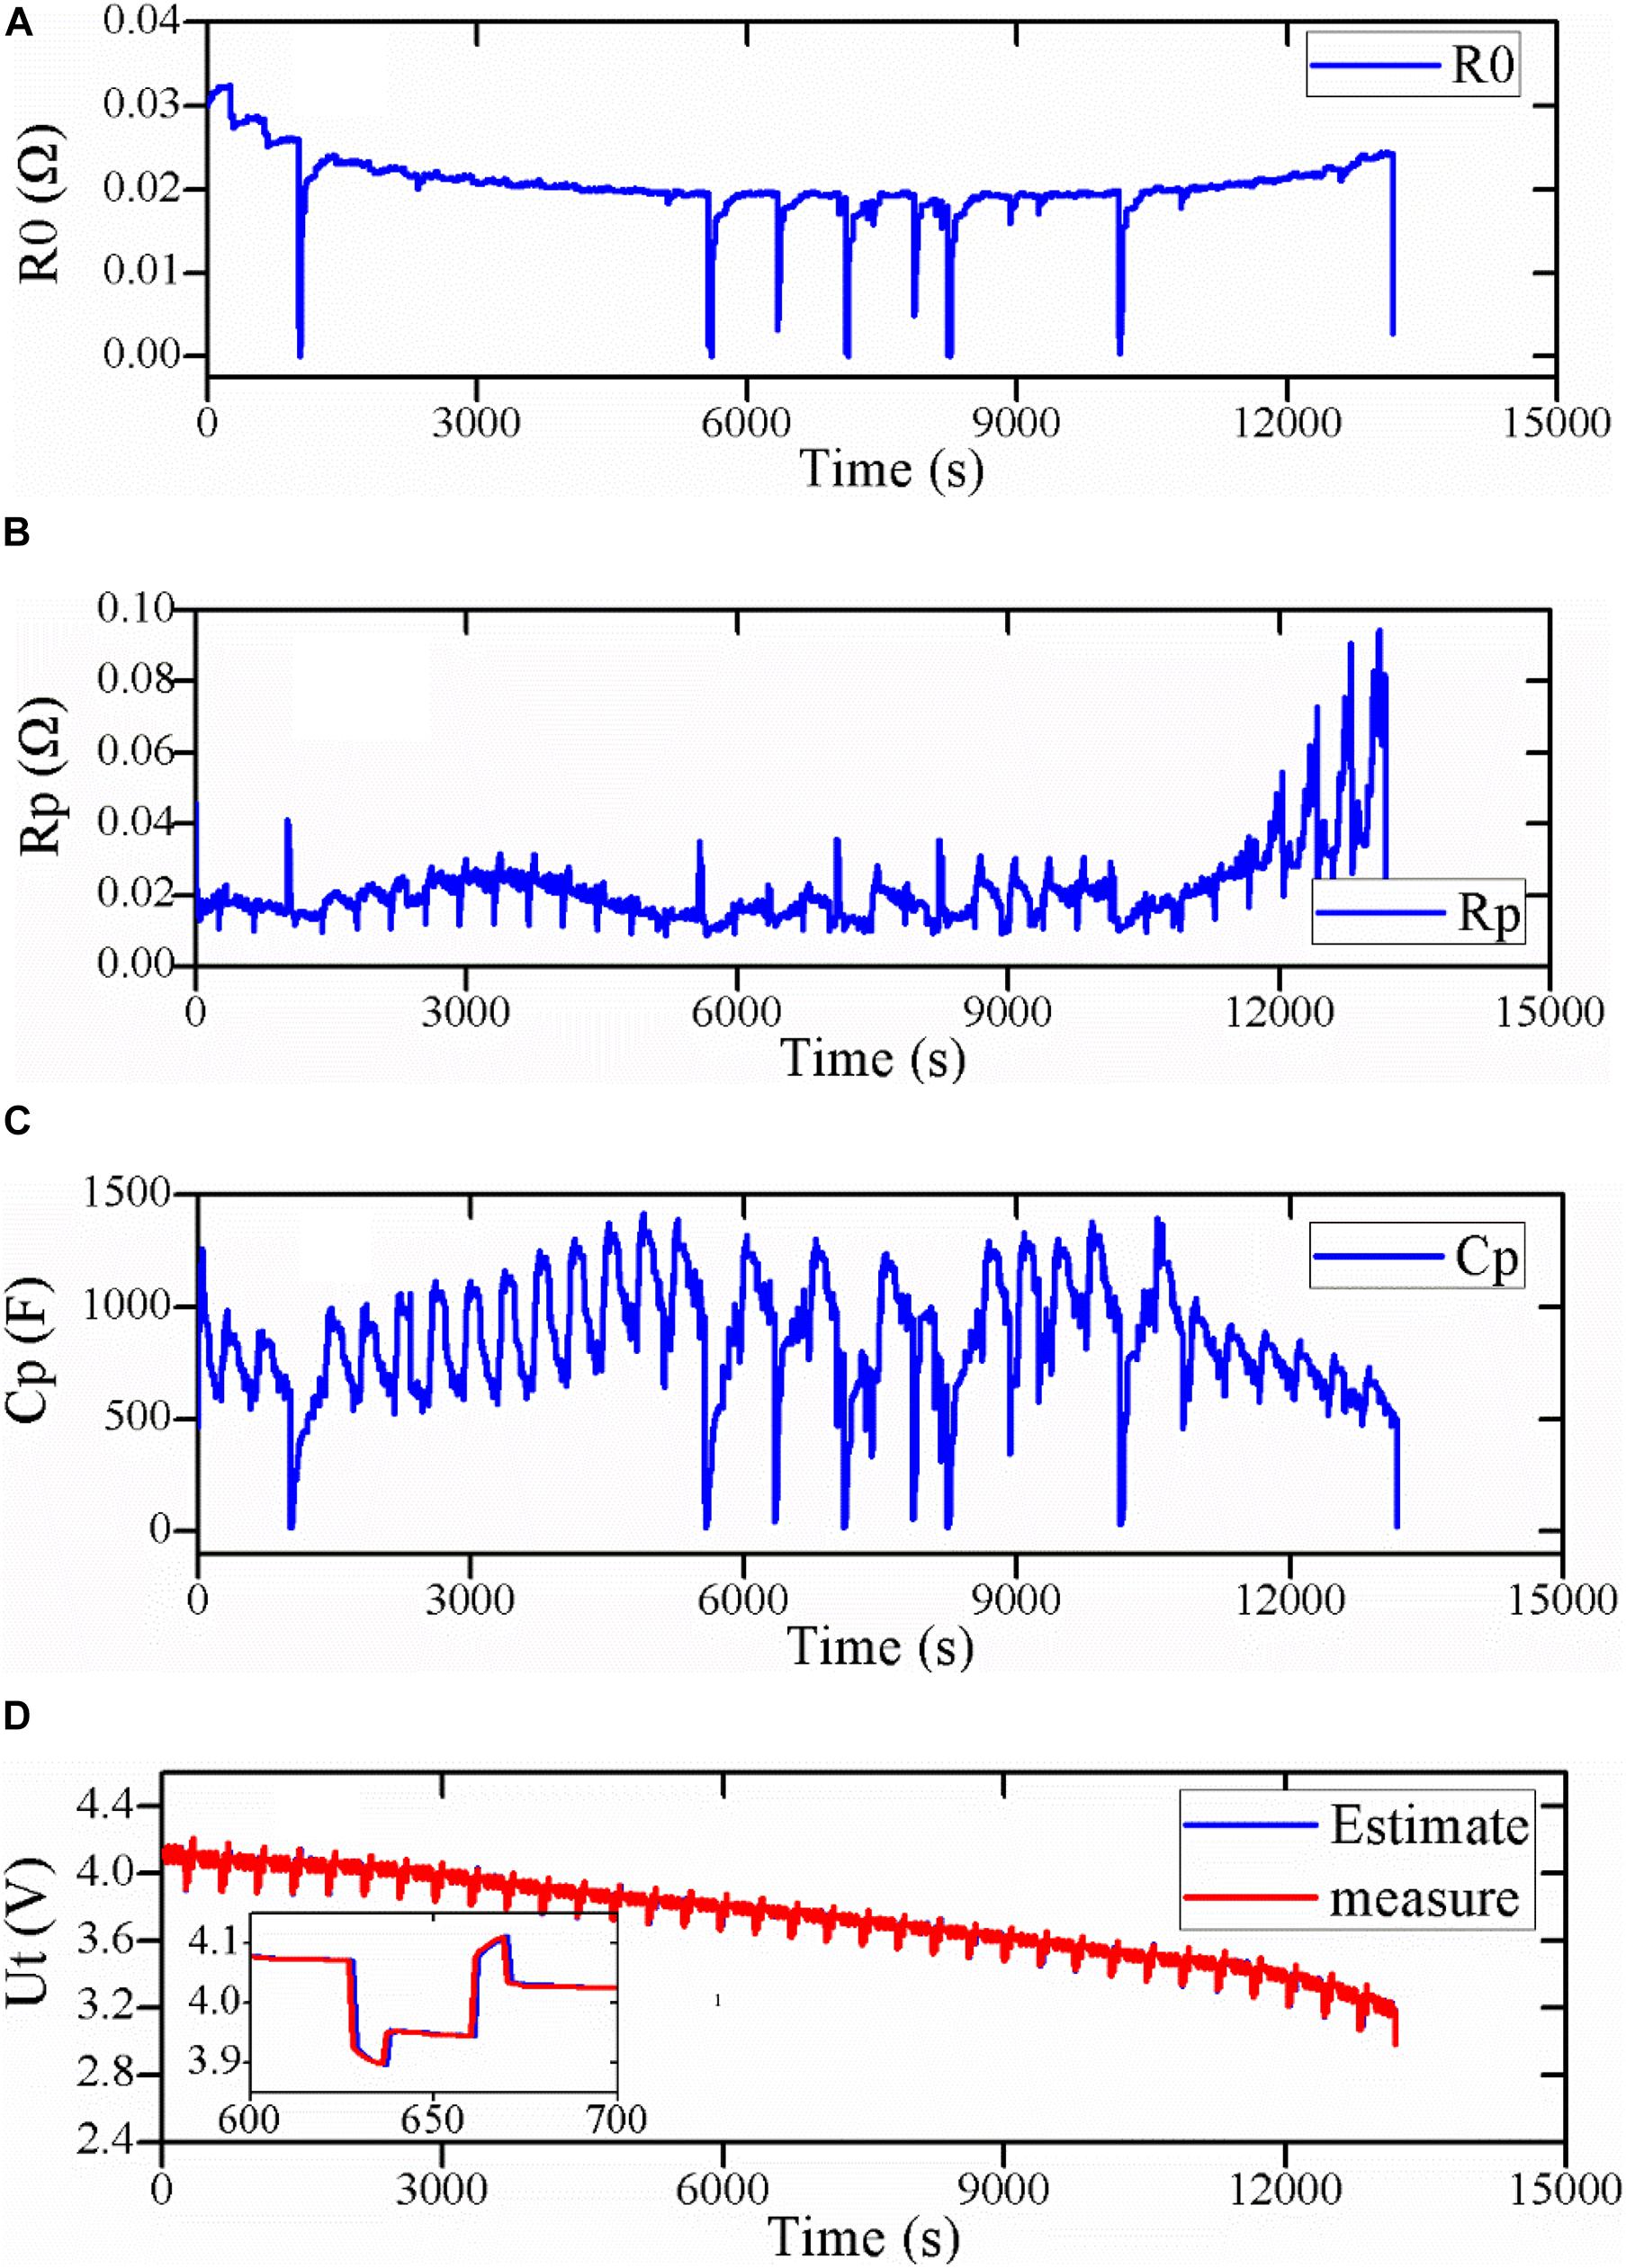
Figure 5. Parameter identification results. (A) R0; (B) Rp; (C) Cp; (D) comparison of the estimated Ut with the measured one.
Figures 5A–C show the identified R0, Rp, Cp, respectively. From the results, it can be observed that the four parameters are all time-varied and SoC-depended. These parameters jitter irregularly as the discharge time or SoC varies. Figure 5D represents the comparison result of the measured Ut with the estimated one. It can be seen that the former is very close to the latter. The maximum estimate error is about 15mV.
Evaluation Under the DST Dynamic Load Profile
In this section, the two types of OCV models are first evaluated by the DST dynamic load condition at three battery operating temperatures, and the results are shown in Figure 6.
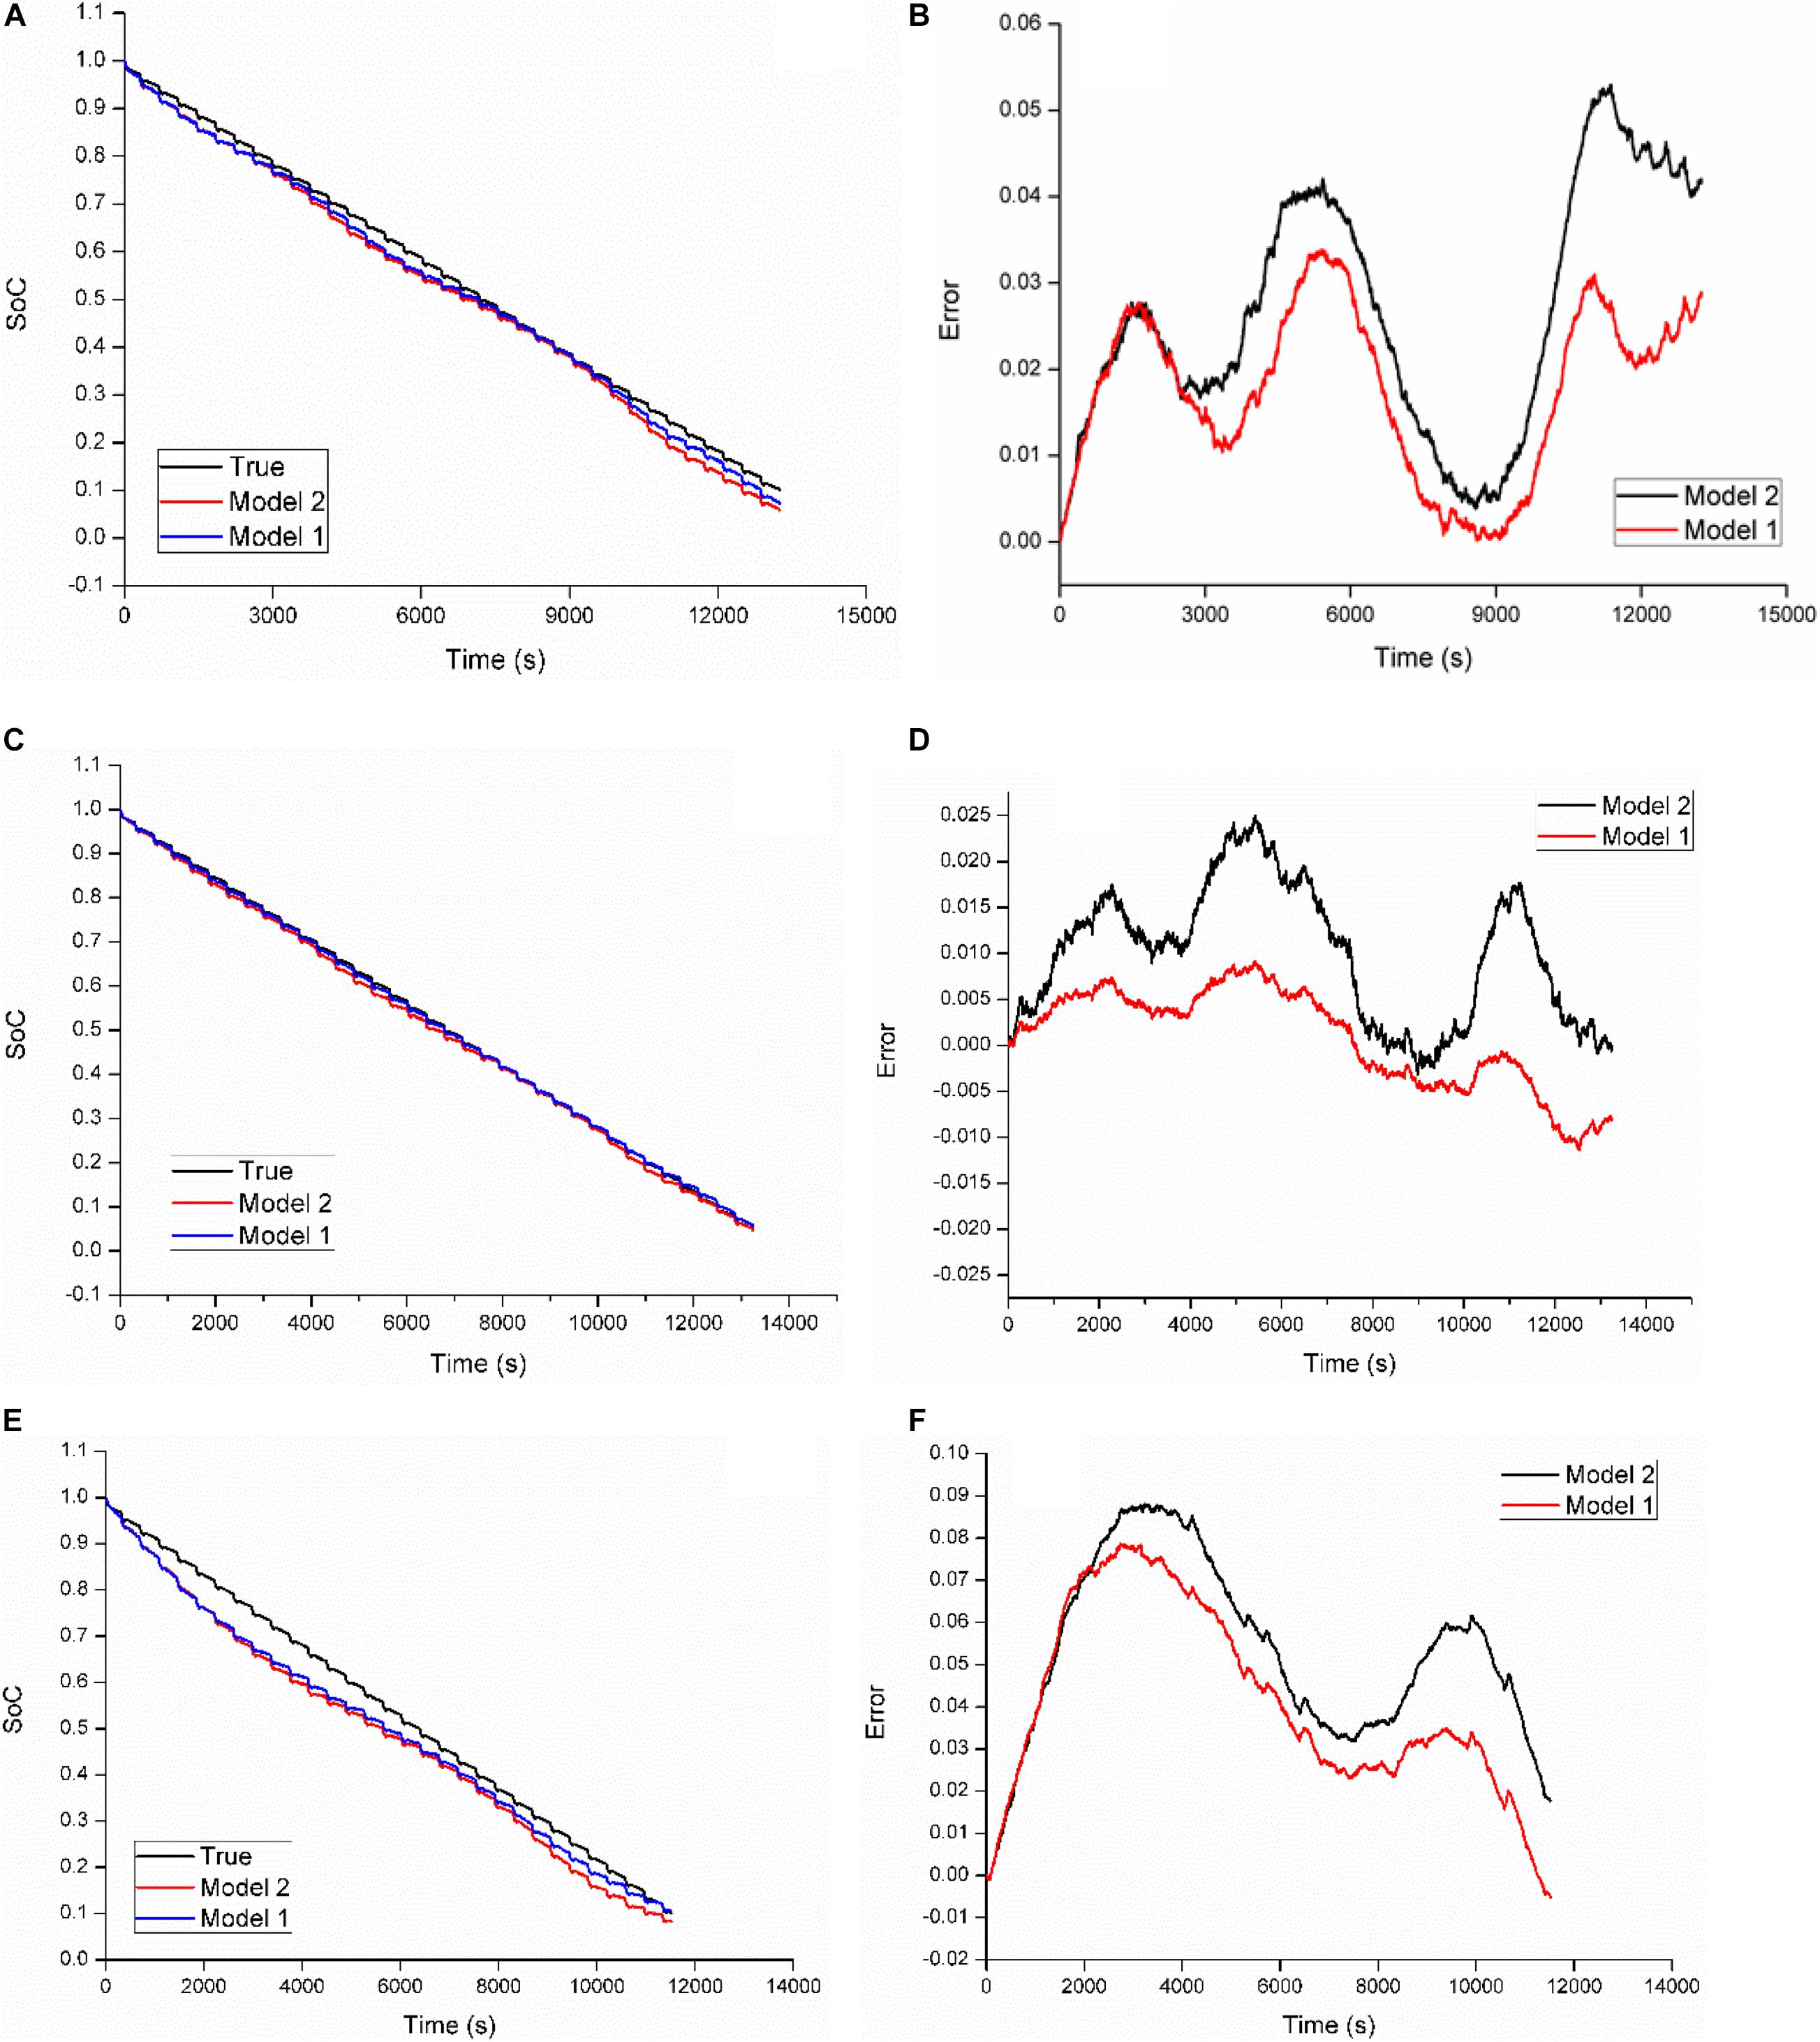
Figure 6. Estimation results based on model 1 and model 2 at three temperatures via the DST. (A) Estimated SoCs at 40°C; (B) estimation errors at 40°C; (C) estimated SoCs at 22°C; (D) estimation errors at 22°C; (E) estimated SoCs at 0°C; (F) estimation errors at 0°C.
Figures 6A,B describe the estimated SoCs and their corresponding errors at 40°C, respectively. It can be observed that model 1 performs better than model 2. The maximum absolute error (MAXE) of model 2 is 5.3%, while that of model 1 is just 3.39%. It is clear that the model with the discharging MH can provide higher prediction accuracy than the traditional method.
Figures 6C,D compare the two models from the aspect of estimated SoCs and estimation errors at 22°C, respectively. We can see that the estimated SoC by model 1 is closer to the true value than that by model 2 in most SoC sub-intervals. The MAXEs of estimation by model 2 and model 1 are 2.50 and 1.15%, respectively, which proves the effectiveness of model 1.
Similarly, Figures 6E,F show estimated SoCs and the corresponding estimation errors of the two models at 0°C. The MAXE of estimation based on model 2 represents 8.81%, while model 1 can further drop the index to 7.86%, which still illustrates the better prediction performance of the MH-based model than that of model 2.
In addition to the MAXE, the mean absolute error (MAE) and the root mean square error (RMSE) are also employed to evaluate the models’ performances as shown in Table 1. For the three battery operating temperatures, the MAXE, the MAE, and the RMSE can be reduced by about 26, 29, and 28% by model 1 on average compared with model 2, respectively. Besides, the ratio of SoC estimation reduction by the model 1 in terms of the MAXE and the MAE at three temperatures can highly reach about 54 and 51% at the battery operating temperature of 22°C, respectively. Hence, we can conclude that the MH-based model is superior to the simplified model under the DST dynamic loading condition at all three ambient temperatures.
Table 1. Estimate errors and analysis results for the DST dynamic loading condition.
Evaluation Under the UDDS Dynamic Load Profile
In this section, the UDDS dynamic loading profile is employed to conduct the evaluations. Figure 7 compares the estimation results of model 1 and model 2. Overall, for all the three testing temperatures, the estimated SoCs and the true values nearly overlap in the high SoC sub-interval, while the difference of estimations based on these two models enlarges in the remaining SoC range. Figure 7B shows the advantage of model 1 at 40°C, and it can control the MAXE within 3.62%, while that of model 2 highly reaches 6.07%. At 22°C, the MAXE of model 1 and model 2 are 3.96 and 5.79%, respectively, as shown in Figure 7D. Besides, we can see from Figure 7F that when the battery testing temperature drops to 0°C, the index of the above two models are 7.42 and 8.31%, respectively.
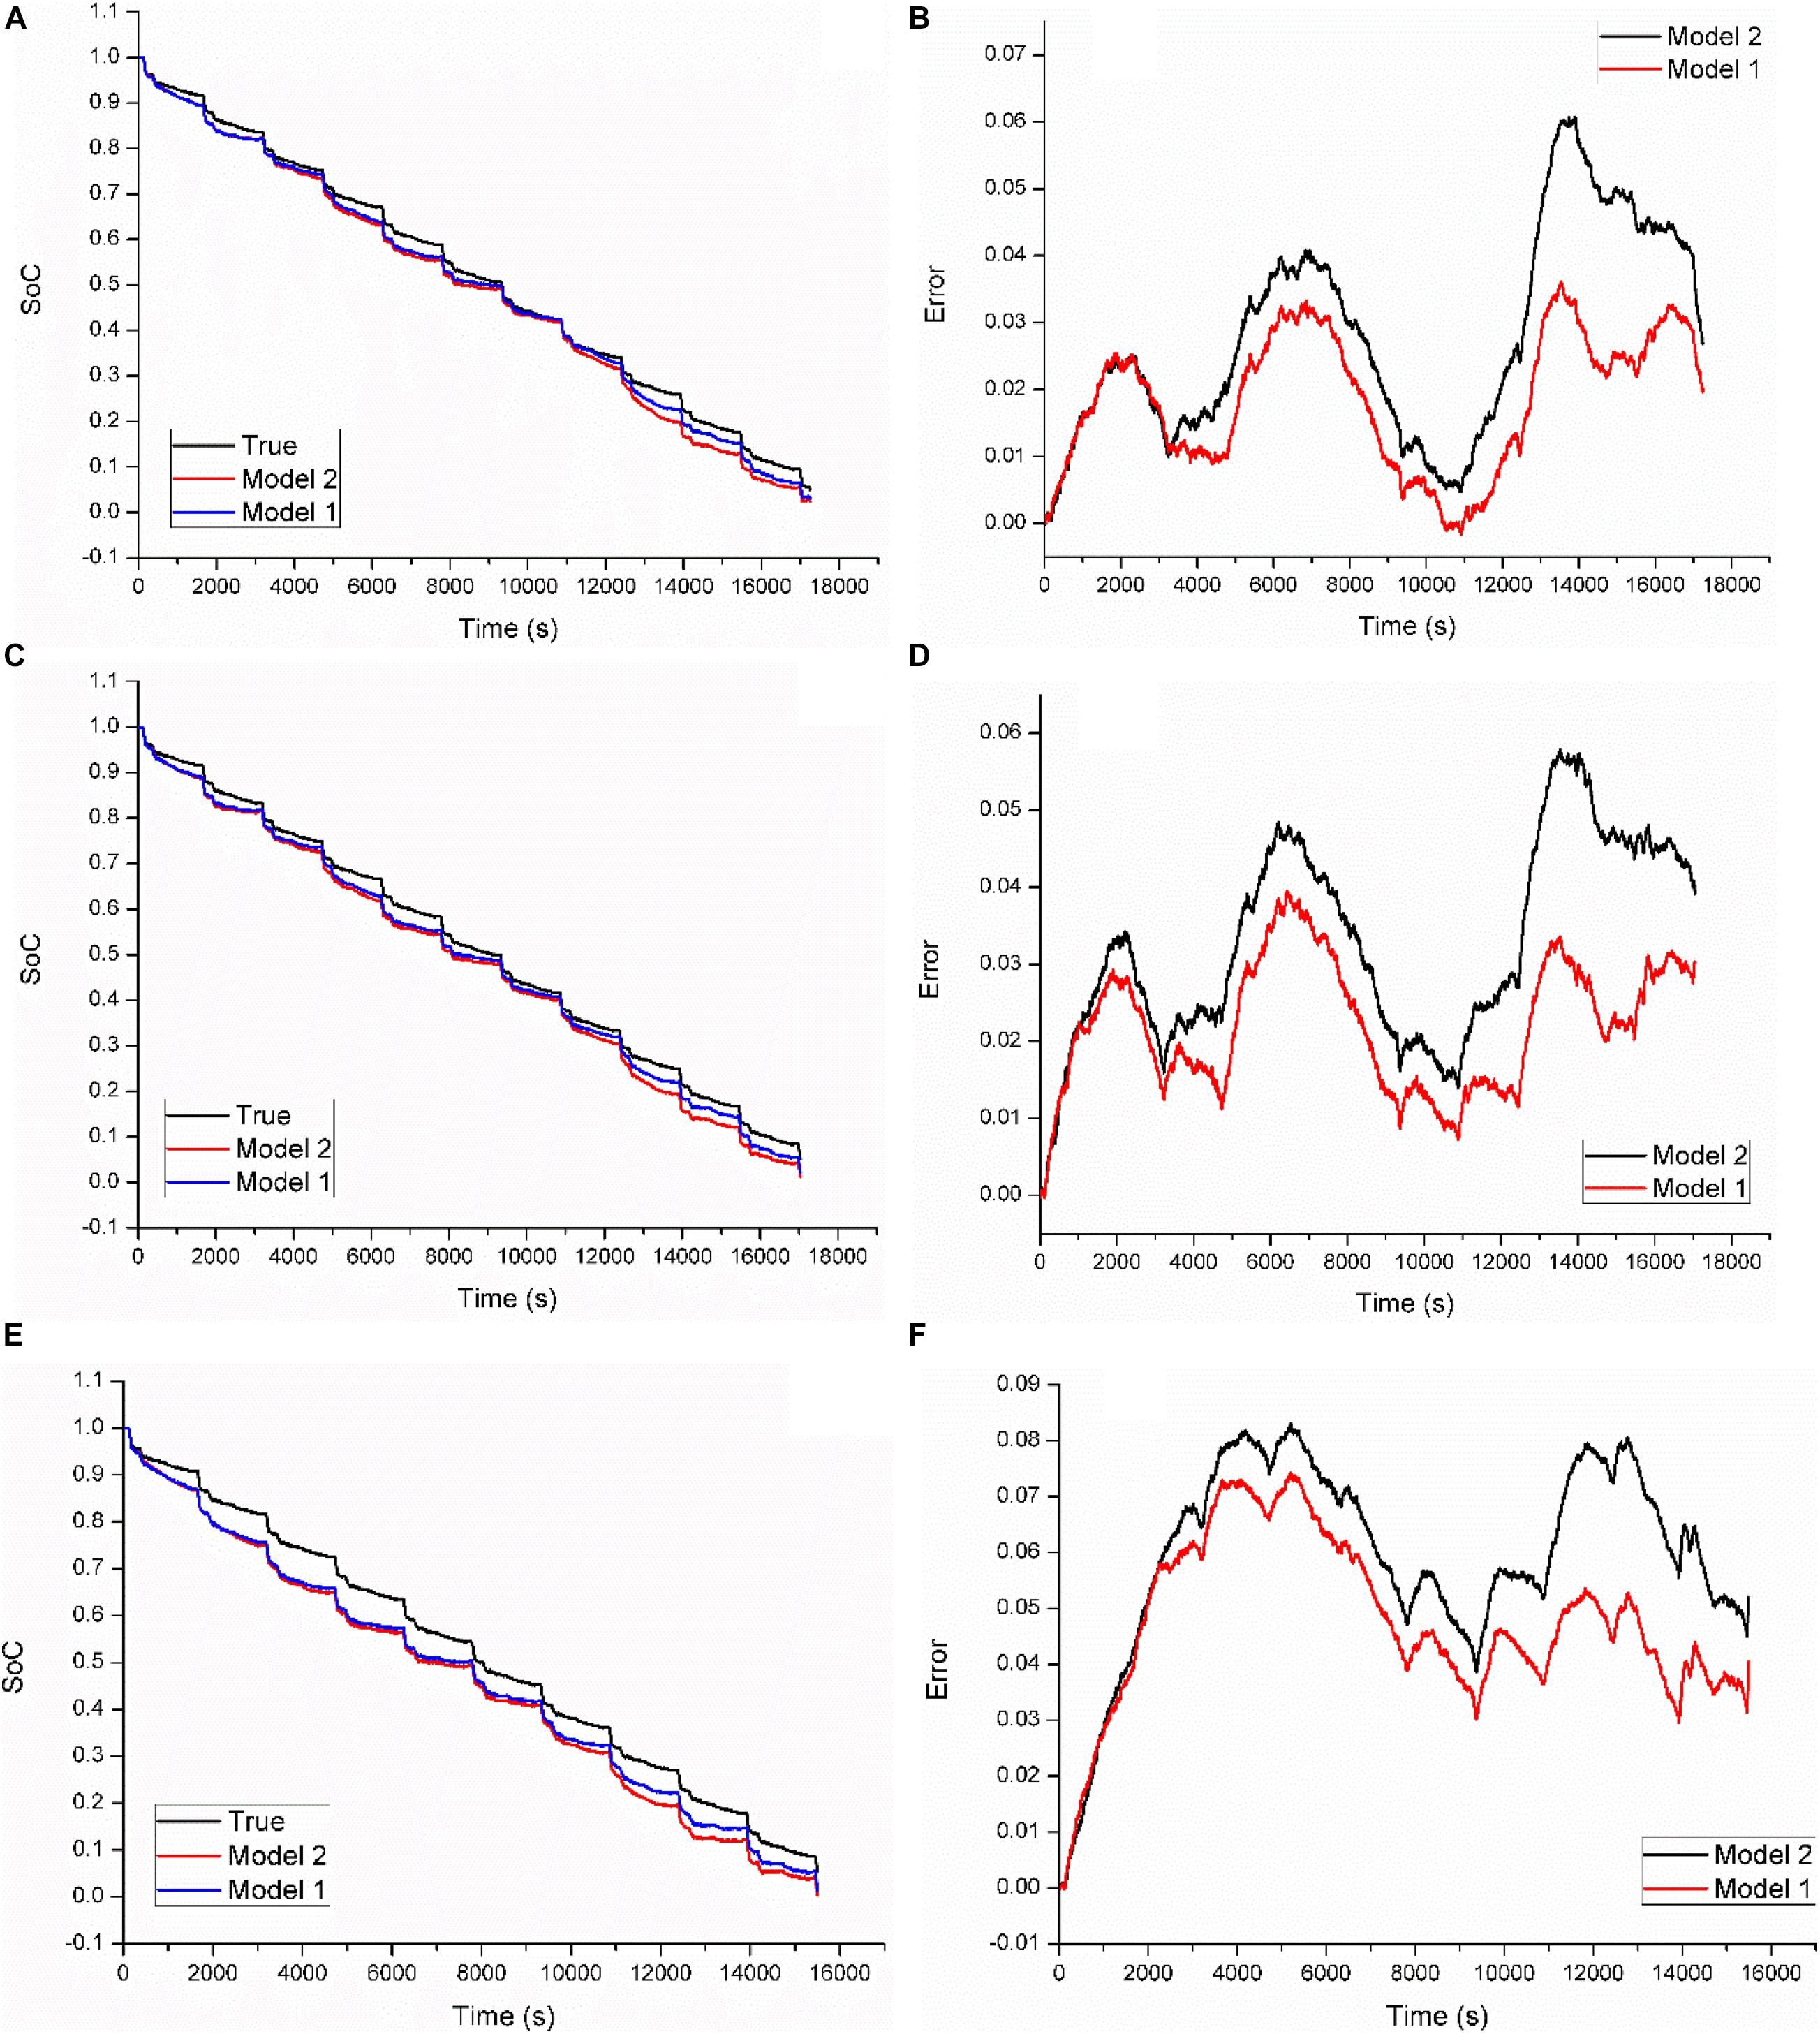
Figure 7. Estimation results based on model 1 and model 2 at three temperatures via the UDDS. (A) Estimated SoCs at 40°C; (B) estimation errors at 40°C; (C) estimated SoCs at 22°C; (D) estimation errors at 22°C; (E) estimated SoCs at 0°C; (F) estimation errors at 0°C.
Like cases in Table 1, another two types of statistical indices are shown in Table 2. Obviously, model 1 can outperform model 2 for all three indices. As a result, for the three battery testing temperatures, the MAXE, the MAE, and the RMSE can be reduced by about 26, 27, and 27% by model 1 on average, respectively. The ratio of the MAXE and the MAE reduction can highly reach 41 and 34% at the high temperature.
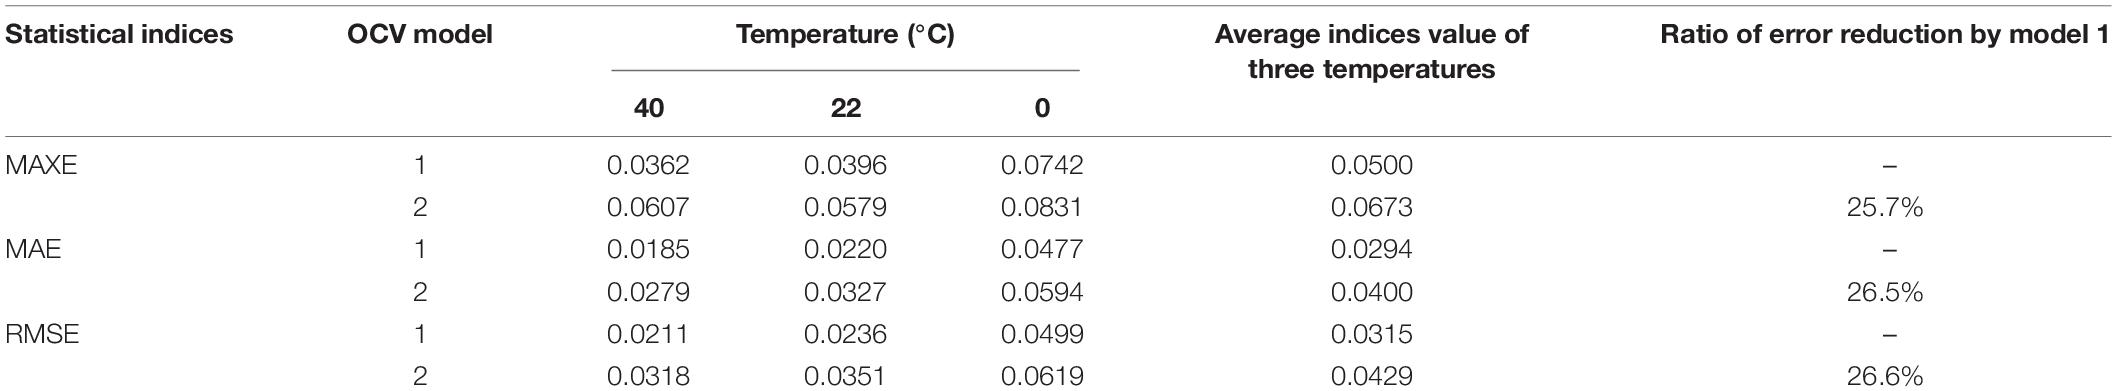
Table 2. Estimate errors and analysis results for the UDDS dynamic loading condition.
Therefore, the conclusion can be drawn that the MH-based model can exhibit better accuracy and robustness than the traditional one at various battery operating testing temperatures under the UDDS dynamic loading condition.
Evaluation Under the HPPC Dynamic Load Profile
To evaluate the two kinds of models by more dynamic loading conditions, the HPPC dynamic loading condition is also employed in this section.
Figure 8 plots the estimation results at three temperatures. Figures 8A,B describe the estimated SoCs and estimation errors at 40°C, respectively. It can be observed that model 1 can acquire more accurate SoC than model 2. The MAXE of the estimation by model 2 is 7.82%, while that by model 1 is only 3.76%.
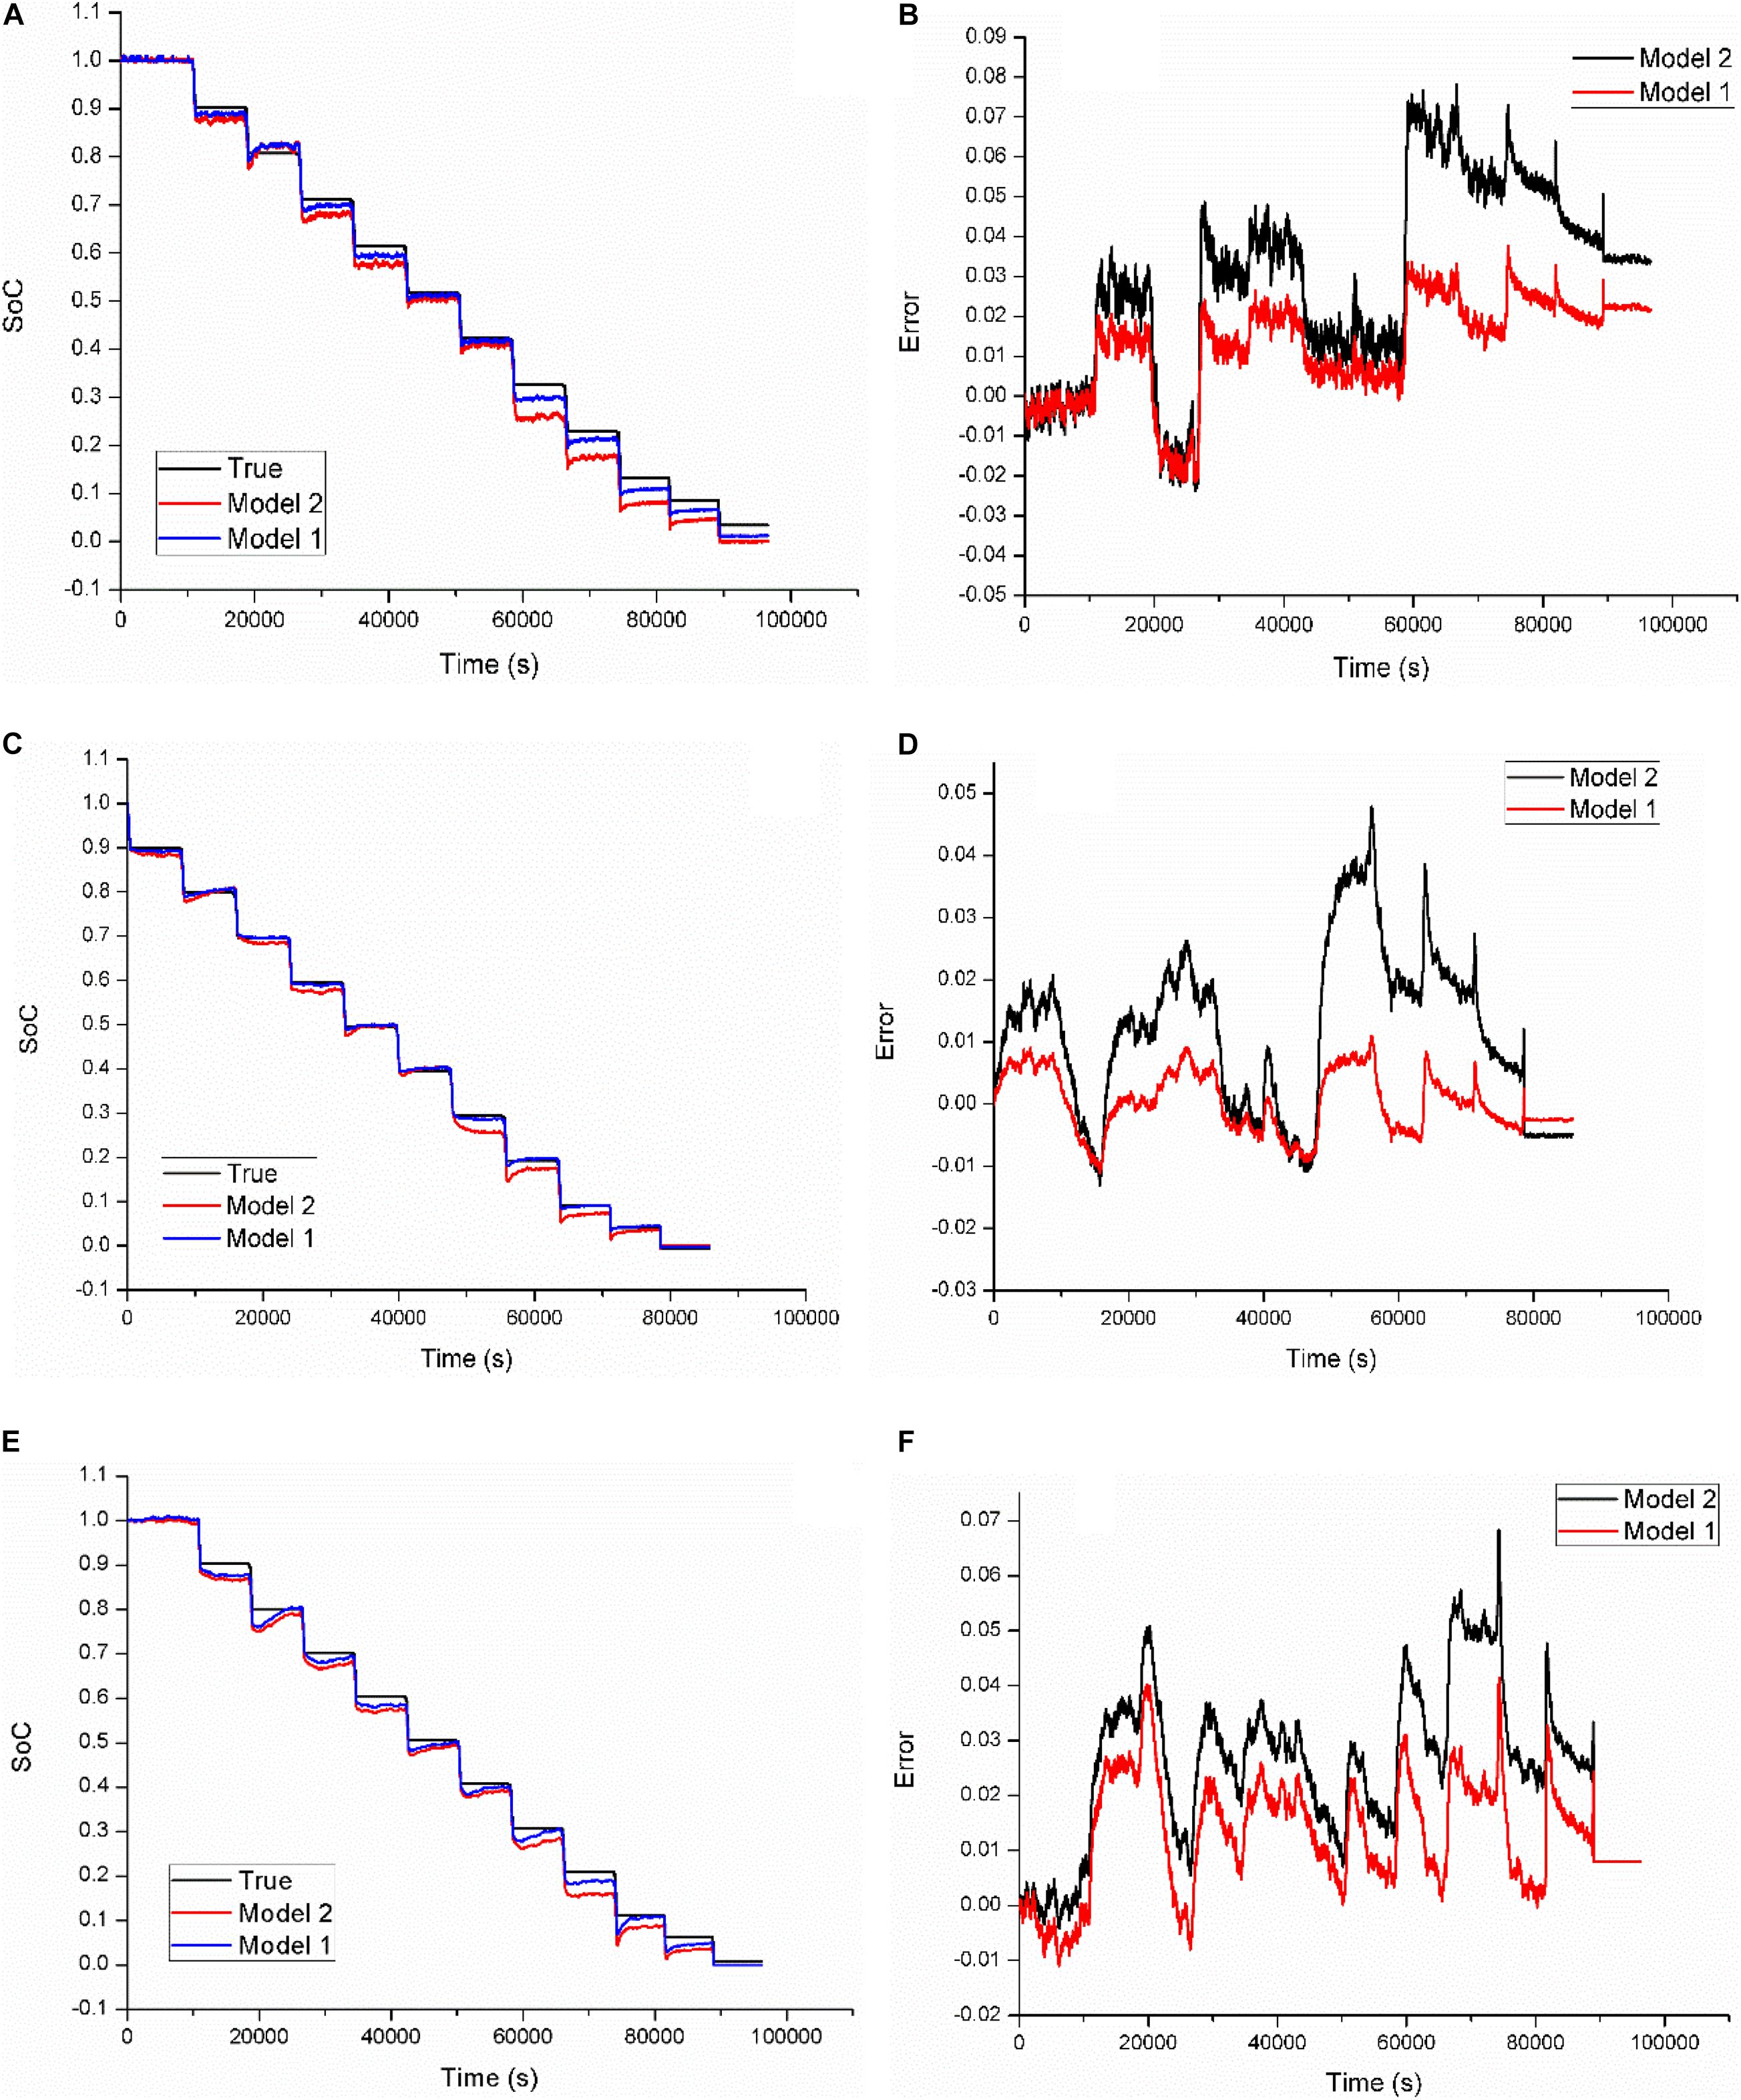
Figure 8. Estimation results based on model 1 and model 2 at three temperatures via the HPPC. (A) Estimated SoCs at 40°C; (B) estimation errors at 40°C; (C) estimated SoCs at 22°C; (D) estimation errors at 22°C; (E) estimated SoCs at 0°C; (F) estimation errors at 0°C.
At 22°C, the MAXE of estimation by model 1 and model 2 are 1.11 and 4.79%, respectively, as shown in Figure 8D. For the low testing temperature, the index of model 1 and model 2 represent 4.15 and 6.84%, respectively, as described in Figure 8F.
Table 3 shows the estimation errors and analysis results for the HPPC dynamic loading condition at three temperatures. We can conclude that, compared with model 2, model 1 can further reduce the MAXE, the MAE, and the RMSE by about 54, 53, and 53% on average, respectively. Moreover, the ratio of estimation reduction of the MAXE can highly reach about 77% at room temperature, and that of the MAE can reach about 70% at the low operating temperature.
Table 3. Estimate errors and analysis results for the HPPC dynamic loading condition.
Evaluation Under the Constant Current Discharge Profile
As stated in the above three sections, the estimation accuracy advantage of the MH-based model has exhibited via the DST, the UDDS, and the HPPC dynamic loading conditions at three ambient temperatures. In this section, the two types of models will be further evaluated by the steady discharging condition as shown in Figure 4D.
Figure 9 shows the estimation results of the two models via the CCD at 40°C. As shown in Figure 9B, the SoC estimate by model 1 is closer to the true value than that by model 2. The MAXE of model 1 and model 2 are 2.2 and 3.5%, respectively. At the room temperature, as plotted in Figure 9D, the index of the two models are 1.8 and 4.2%, respectively. For 0°C, they are 1.9 and 3.9%, respectively, as shown in Figure 9F.
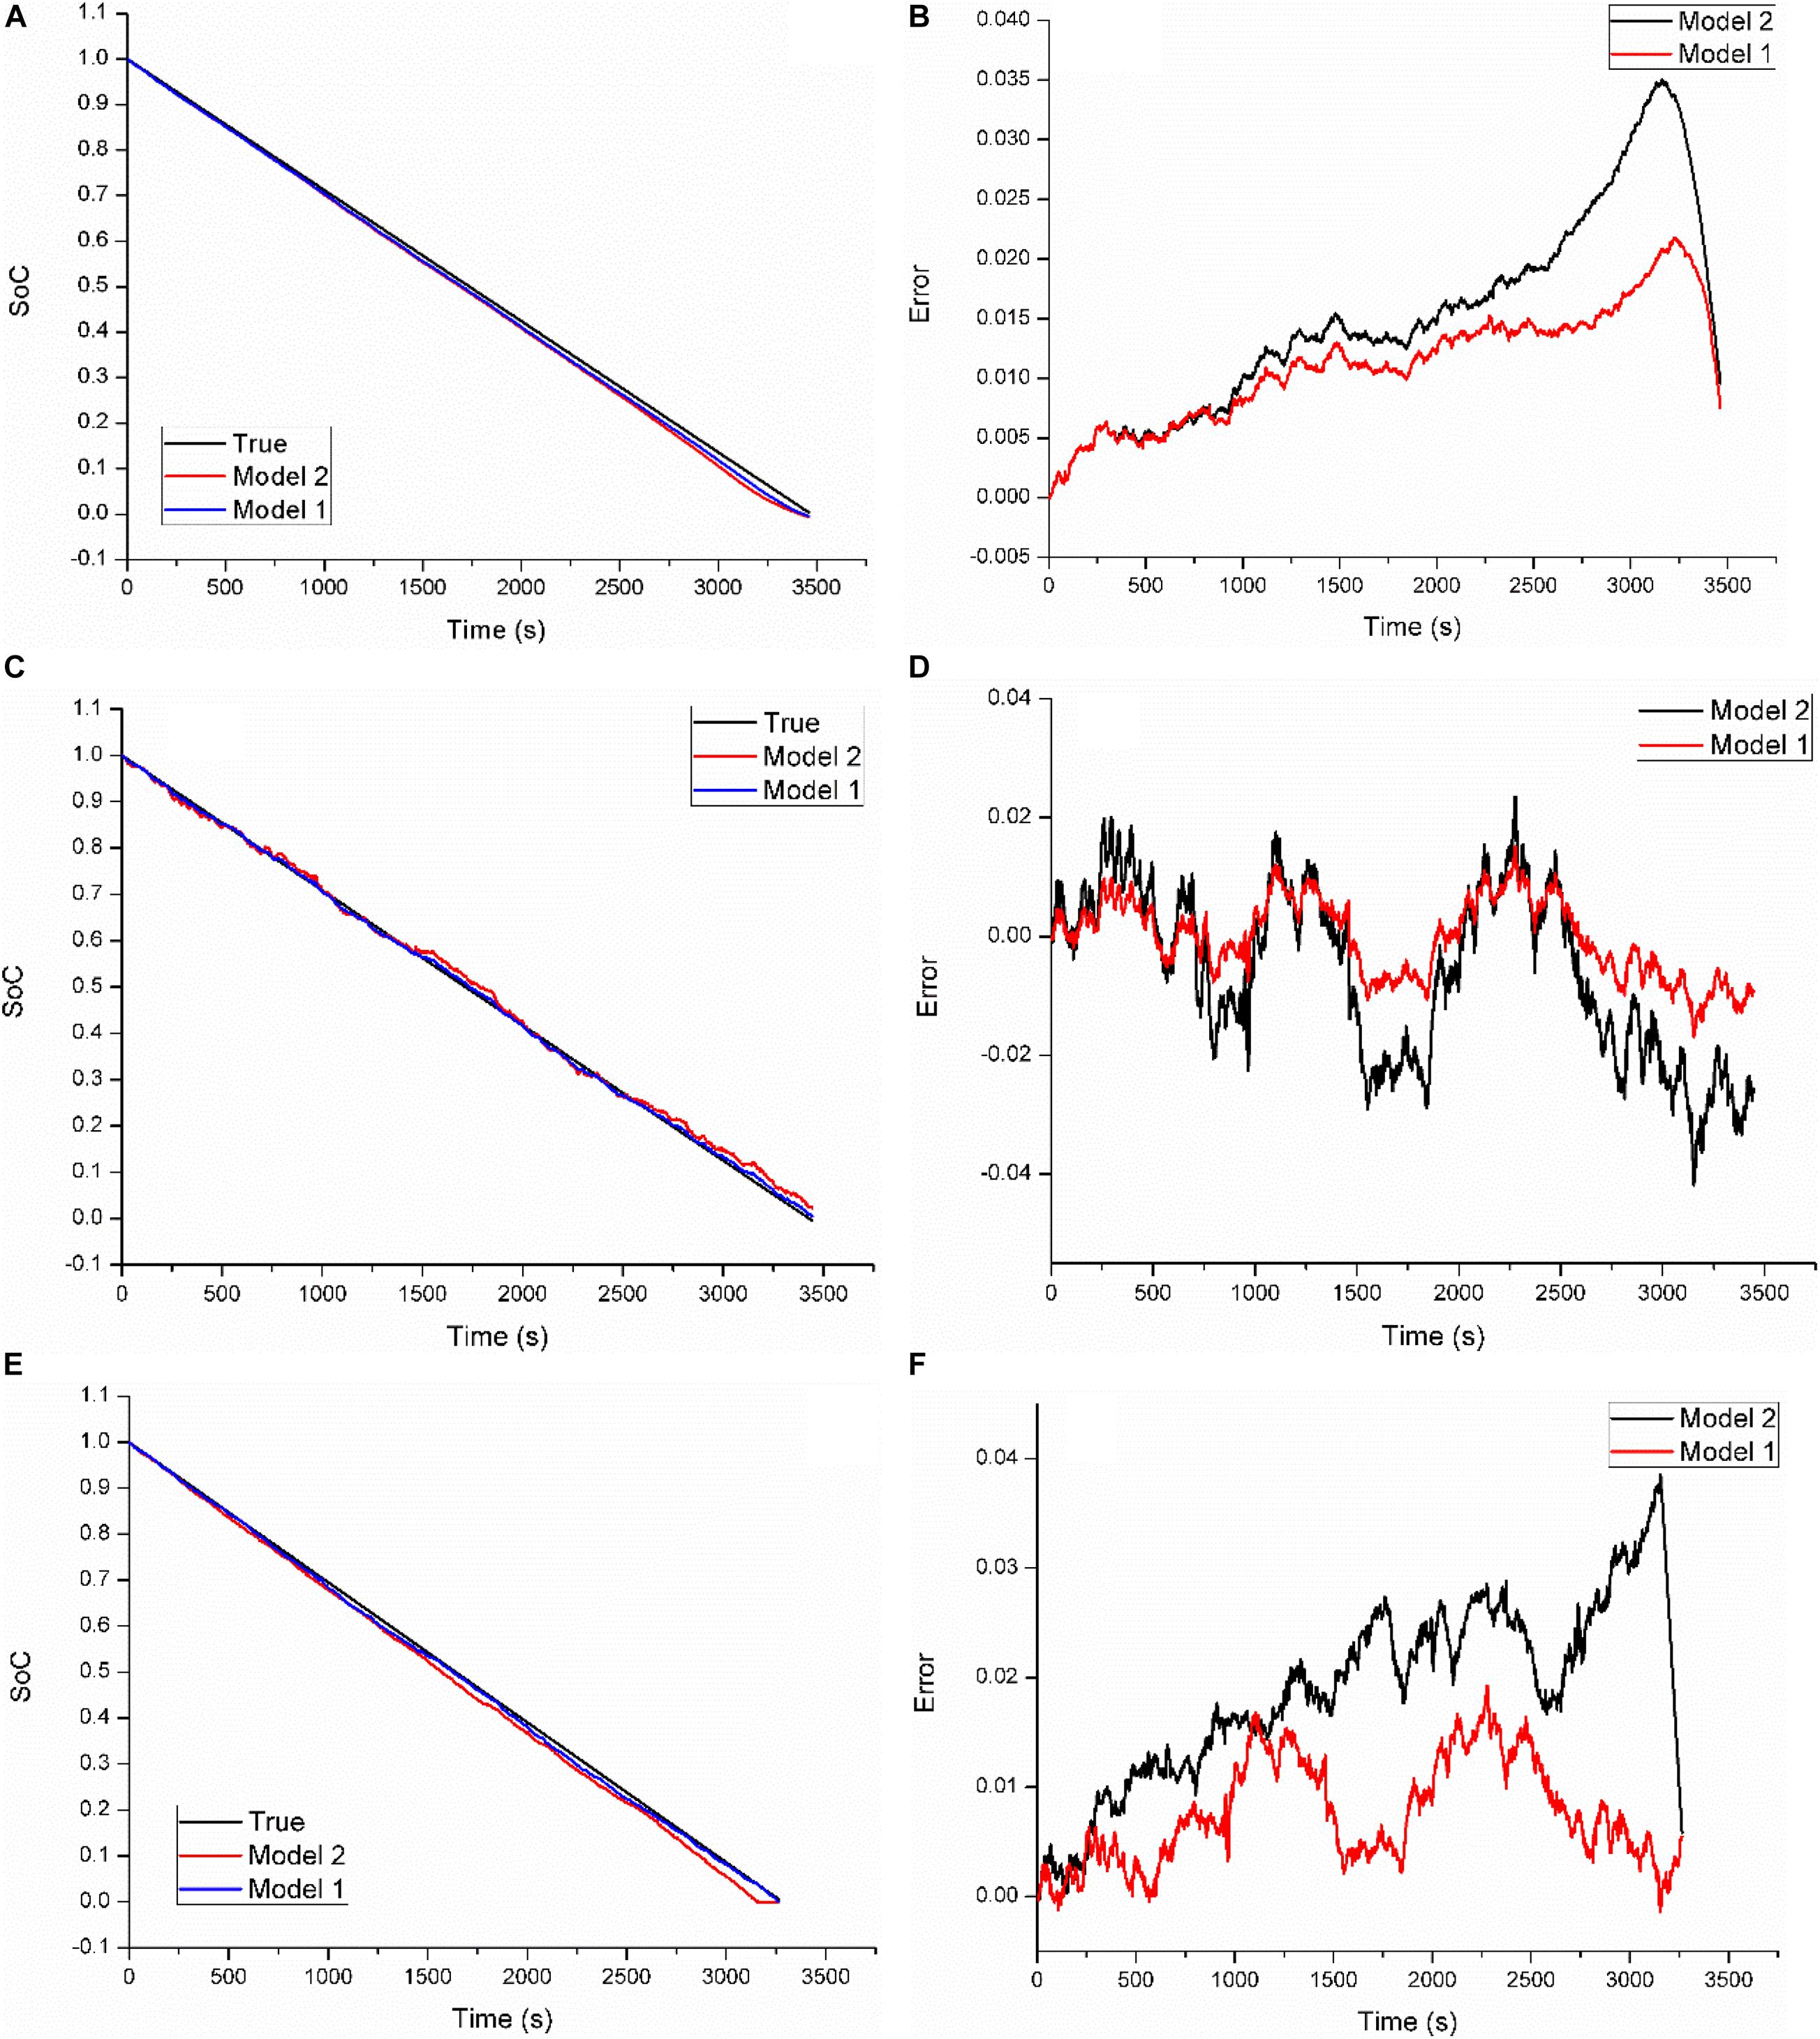
Figure 9. Estimation results based on model 1 and model 2 at three temperatures via the CCD. (A) Estimated SoCs at 40°C; (B) estimation errors at 40°C; (C) estimated SoCs at 22°C; (D) estimation errors at 22°C; (E) estimated SoCs at 0°C; (F) estimation errors at 0°C.
The estimation error and the statistic results are listed in Table 4. From the table, we can see that model 1 outperforms model 2 for all three indices. As a result, the MAXE, the MAE, and the RMSE can be reduced by about 50, 48, and 48% by model 1 on average, respectively. The ratio of estimation reduction of the MAXE can highly reach 59% at room temperature, and that of the MAE can reach about 60% at 0°C.
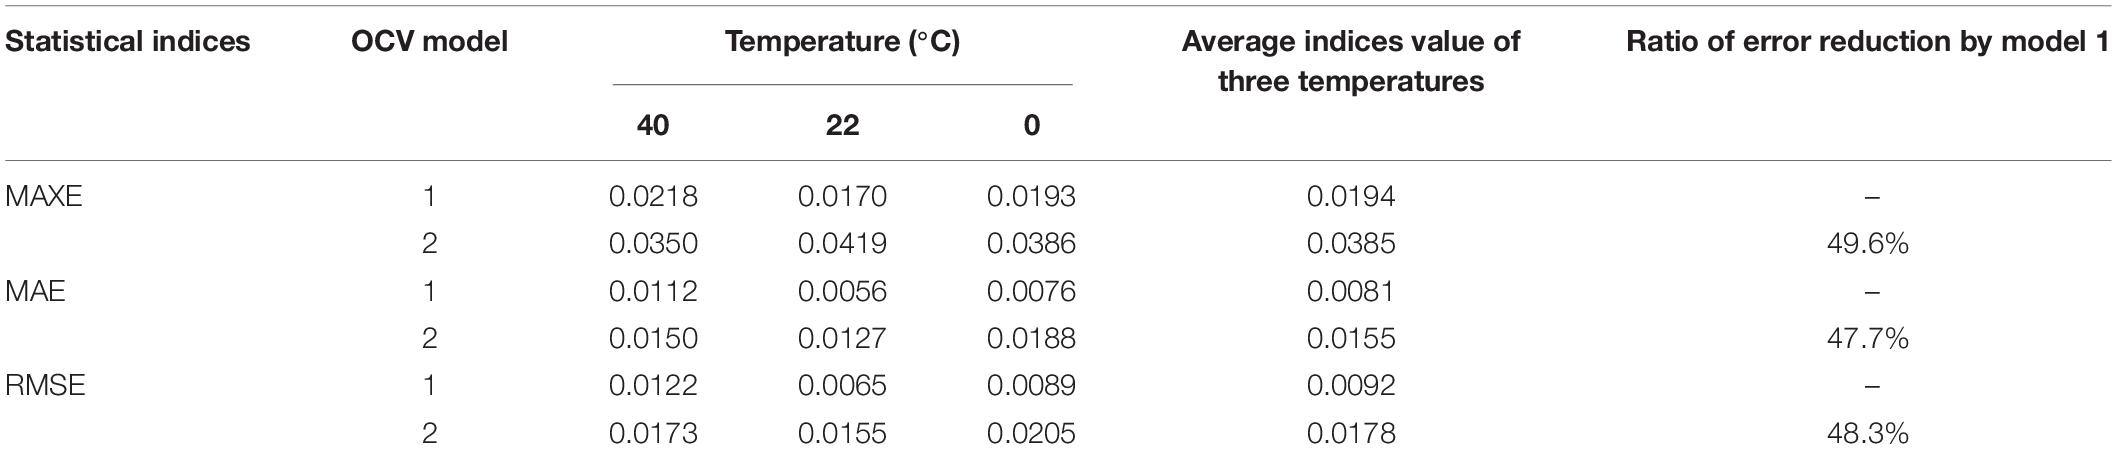
Table 4. Estimate errors and analysis results for the CCD loading condition.
Through a systematical comparison of the estimation accuracy of the two OCV testing methods, we can conclude that the MH-based model can exhibit better accuracy and robustness than the simplified model under various current load profiles at high temperature, room temperature, and low temperature.
Evaluation by Pulse Current Profiles Dominated by Charging
Most of the previous research concentrate on the discharging dynamic loading condition (Li W.-H. et al., 2019; Wang et al., 2019; Yu et al., 2019), fewer of them noted the charging process of the battery. There is no denying the fact that, studying the influence of the MH on SoC estimation for the charging process of the battery is also important.
In this section, the influence of the MH on the estimation will be further evaluated from the charging direction of the LiNiMnCoO2 battery. To conduct the investigation, two current profiles were set as shown in Figure 10. Among them, the constant current and constant voltage charging (CCCVC) profile is used to charge the batteries of EVs in practice as shown in Figure 10A. The charging current was set to 0.5°C.

Figure 10. Charging current profiles. (A) CCCVD; (B) RHPPC.
Besides, to simulate the dynamic charging condition, the reversed HPPC current profile from the discharging direction to the charging direction of the battery was set as shown in Figure 10B. This current profile will be called RHPPC in the later text.
Evaluation Under the Constant Current Charge Profile
Figure 11 shows the estimation results based on model 1 and model 2 at three temperatures via the CCCVC. Overall, the OCV model with hysteresis can exhibit consistent estimation accuracy advantages at all three temperatures. At 40°C, the MAXE of model 1 and model 2 are 5.17 and 7.81%, respectively, as shown in Figure 11B. From Figure 11D, we can see that the index for the two above models represents 3.09 and 4.49%, respectively. For battery operating temperature of 0°C, they are 5.88 and 9.72%, respectively, as can be seen from Figure 11E.
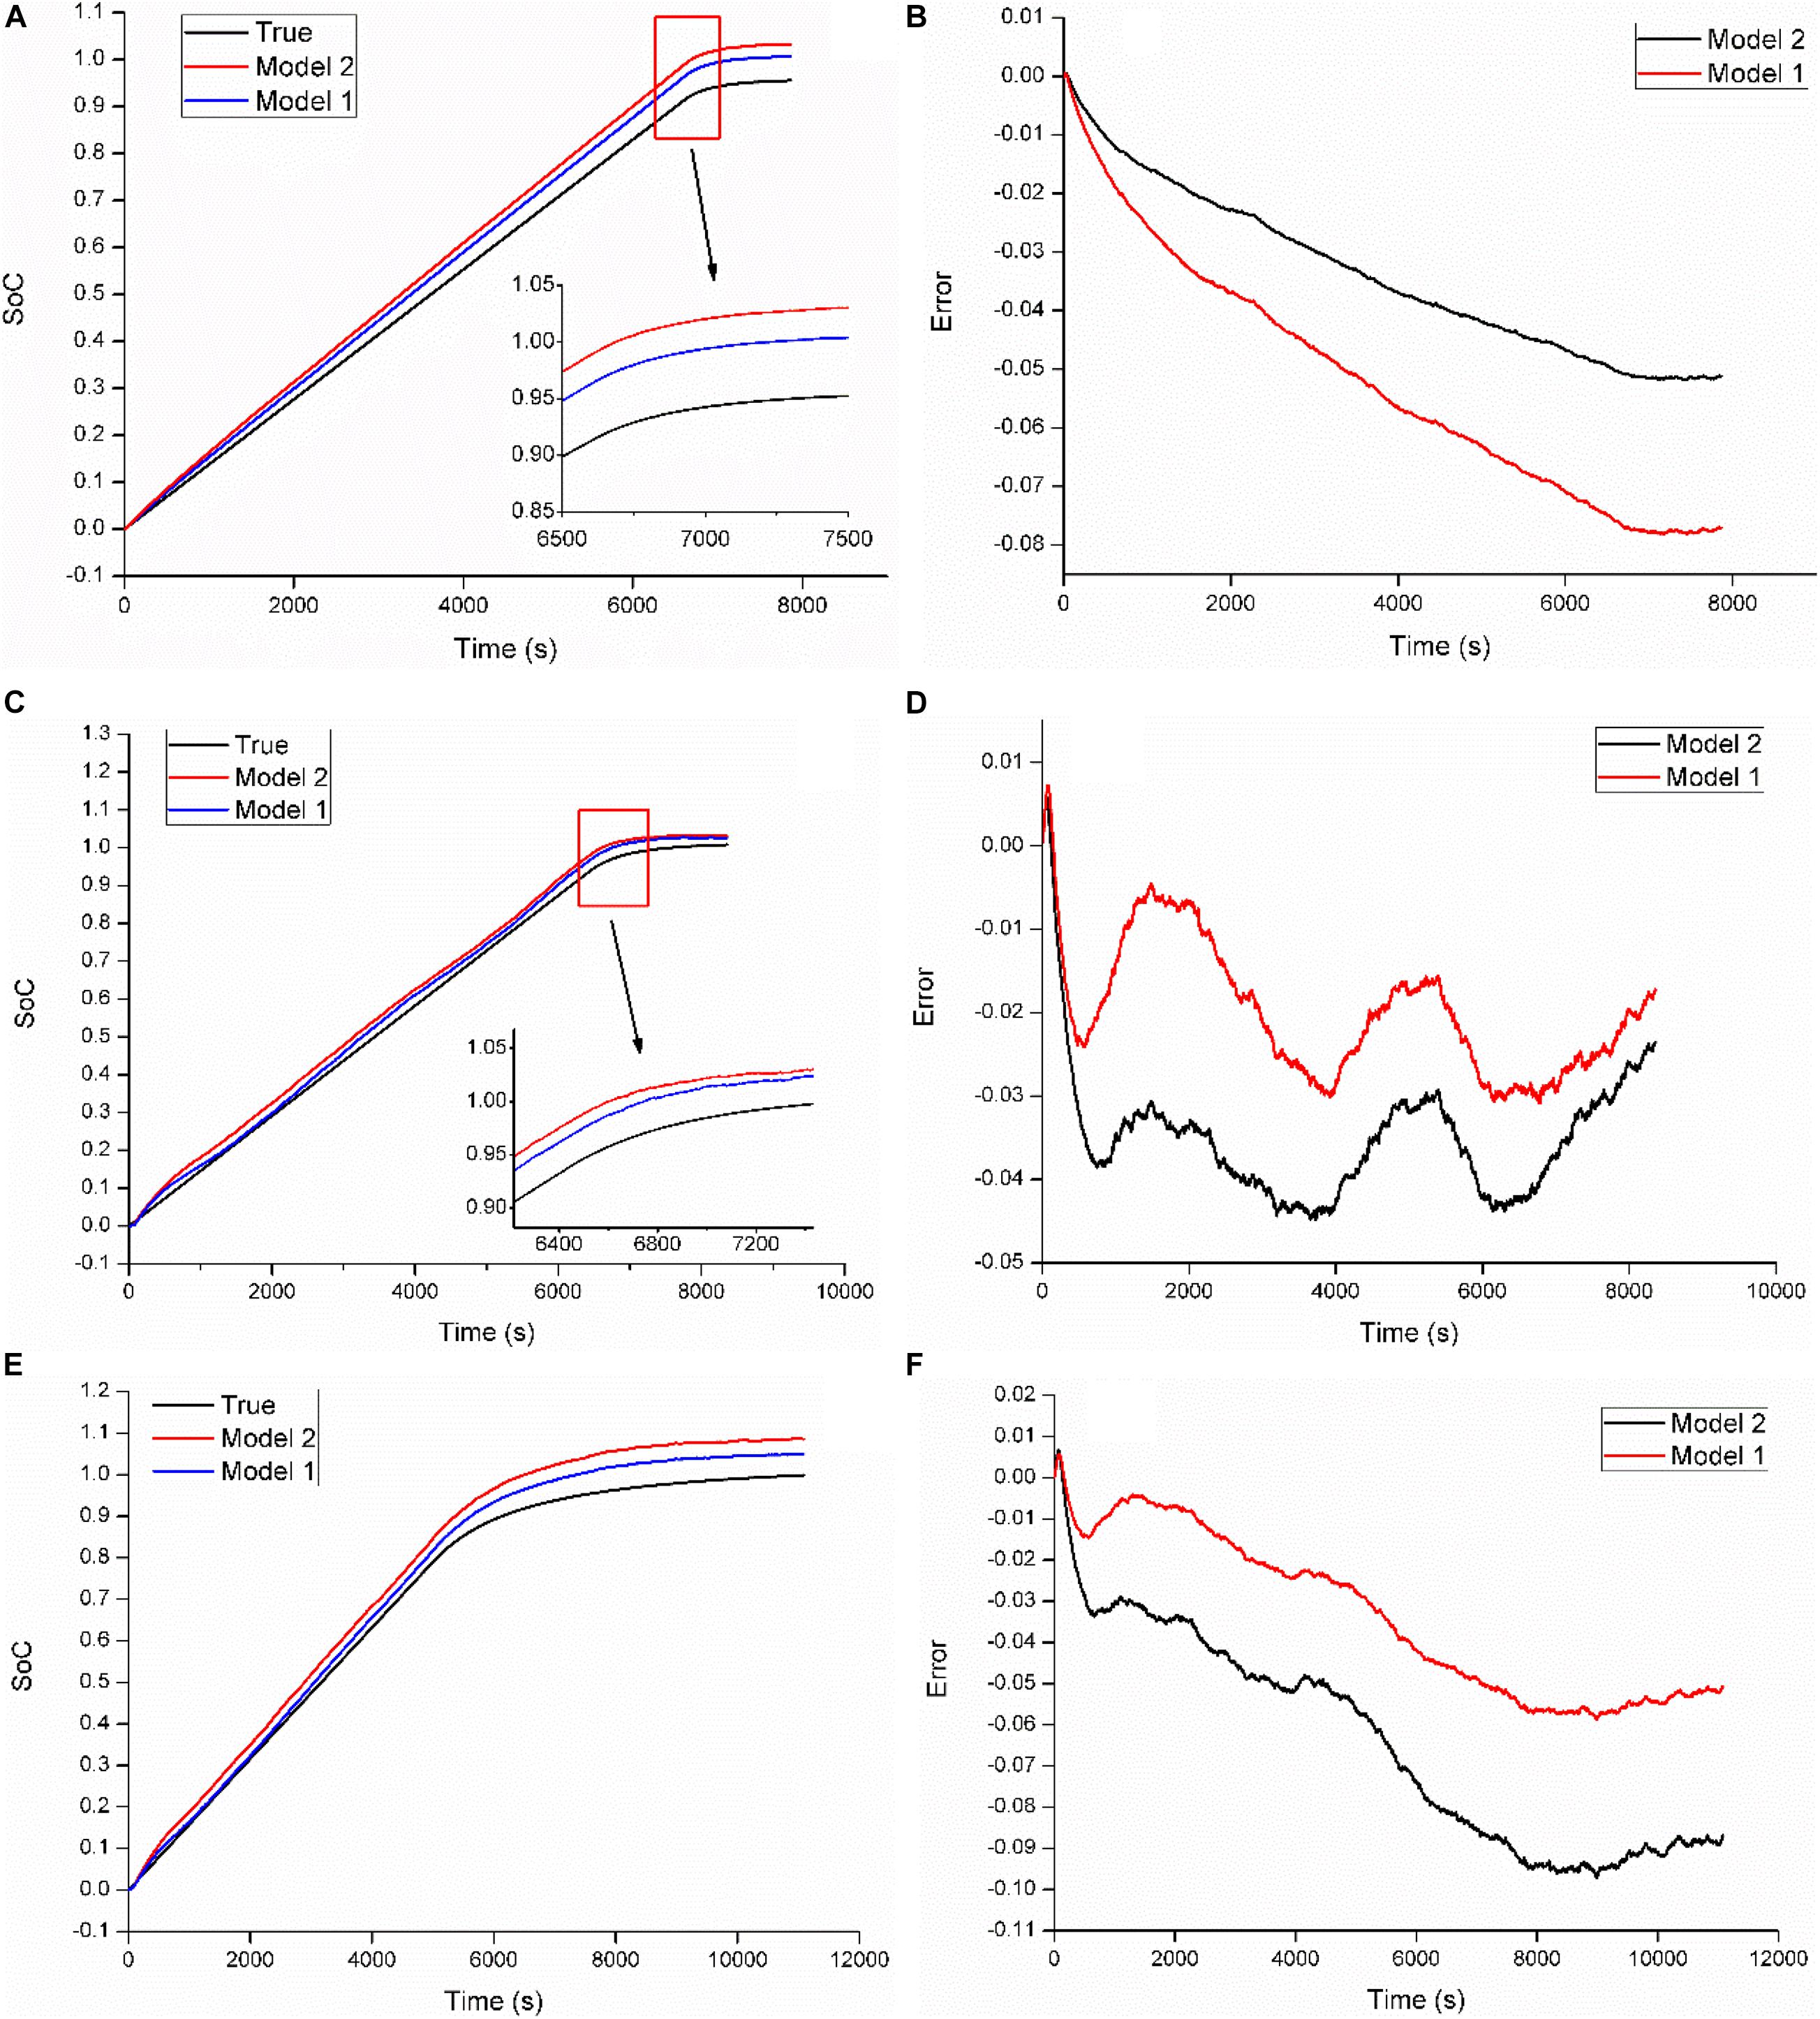
Figure 11. Estimation results based on model 1 and model 2 at three temperatures via the CCCVC. (A) Estimated SoCs at 40°C; (B) estimation errors at 40°C; (C) estimated SoCs at 22°C; (D) estimation errors at 22°C; (E) estimated SoCs at 0°C; (F) estimation errors at 0°C.
Besides, from Table 5, we can observe that both the MAE and the RMSE of the estimation are reduced by the MH-based model. For the three battery operating temperatures, the MAXE, the MAE, and the RMSE can be reduced by about 36, 42, and 40% by model 1 on average compared with model 2, respectively. Besides, the ratio of estimation error reduction by the model 1 in terms of the MAXE and the MAE at three temperatures can highly reach about 40 and 47% at the battery operating temperature of 0°C, respectively. Hence, we can conclude that the model with the hysteresis is superior to the simplified model under the CCCVC current profile at all three temperatures.

Table 5. Estimate errors and analysis results for the CCD loading condition.
Evaluation Under the Pulse Current Charge Profile
To evaluate the influence of the charging direction of the MH on the estimation under a harsh condition, the RHPPC charging pulses current profile in Figure 10B are employed in this section.
Figure 12 plots the estimation results of the two models at three temperatures. Figures 12A,B describe the estimated SoCs and estimation errors at 40°C, respectively. It can be observed that model 1 can acquire more accurate SoC than model 2. The MAXE of the estimation by model 2 is 7.62%, while that by model 1 is only 4.91%.

Figure 12. Estimation results based on model 1 and model 2 at three temperatures via the RHPPC. (A) Estimated SoCs at 40°C; (B) estimation errors at 40°C; (C) estimated SoCs at 22°C; (D) estimation errors at 22°C; (E) estimated SoCs at 0°C; (F) estimation errors at 0°C.
At 22°C, the MAXE of estimation by model 1 and model 2 are 1.71 and 4.27%, respectively, as shown in Figure 12D. For the low testing temperature, the index of model 1 and model 2 represent 9.52 and 14.81%, respectively, as described in Figure 12F.
Table 6 shows the estimation errors and analysis results for the RHPPC dynamic loading condition at three temperatures. We can conclude that, compared with model 2, model 1 can further reduce the MAXE, the MAE, and the RMSE by about 40, 56, and 51% on average, respectively. Moreover, the ratio of estimation reduction of the MAXE can highly reach about 60% at room temperature, and that of the MAE can reach about 62%.
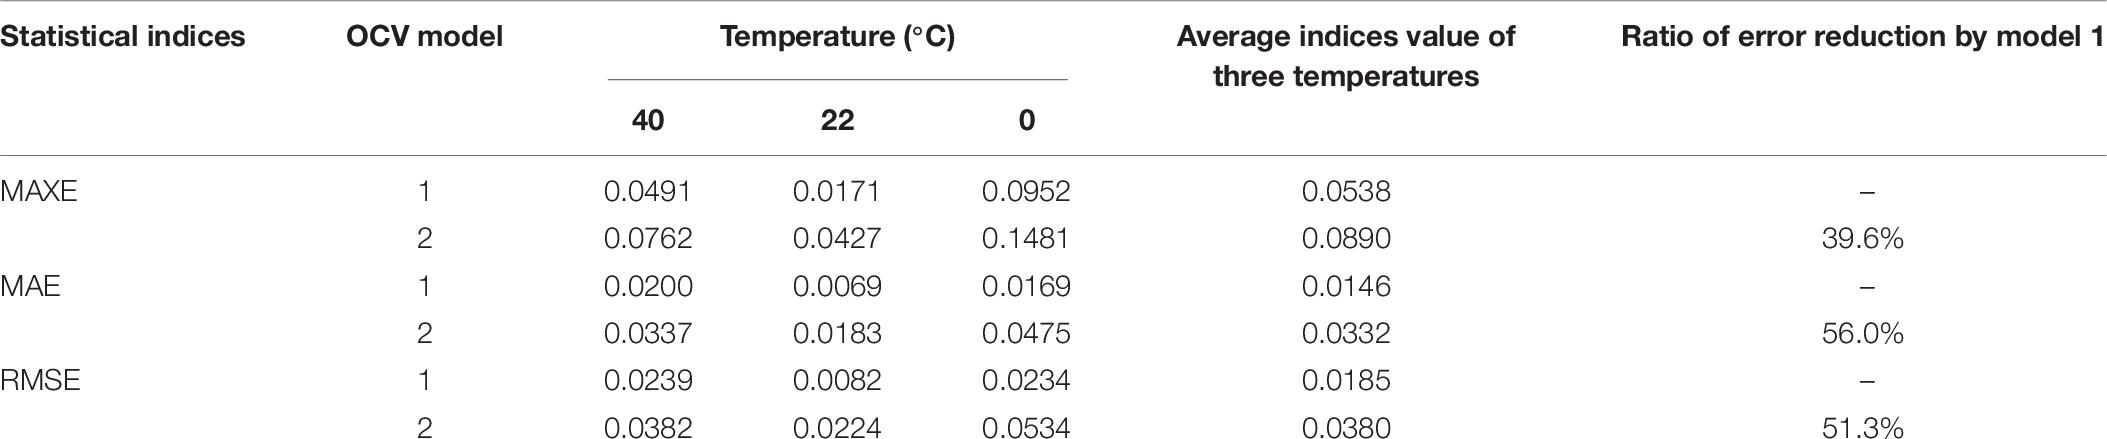
Table 6. Estimate errors and analysis results for the CCD loading condition.
Conclusion
OCV plays a key role in correcting the state of charge estimation bias and, thus can ensure the safety and reliability of EVs. At present, the OCV model is commonly catched by averaging the charging and the discharging OCVs, which ignores the influence of the major hysteresis (MH) on SoC estimation. Some research seems to have shown the possible influence of the discharging MH on SoC estimation at specific scenarios. Inspired by this phenomenon, this work systematically investigated the influence of the MH of the LiNiMnCoO2 battery on the estimation by diverse current profiles at various battery operating temperatures. The RLS and the PF techniques are combined for parameters and SoC estimations simultaneously.
The results reported the positive influence of the MH from both the charging and the discharging directions of the battery on enhancing the SoC estimation accuracy and robustness under various current profiles at different ambient temperatures. Compared with the traditional simplified method, the ratio of the mean absolute estimation error reduction by the MH-based OCV model can highly reach about 70%.
Data Availability Statement
The raw data supporting the conclusions of this article will be made available by the authors, without undue reservation.
Author Contributions
All authors contributed to the writing of the manuscript and approved the final version.
Funding
This work was supported by the National Natural Science Foundation of China (Grant No. 51775042).
Conflict of Interest
The authors declare that the research was conducted in the absence of any commercial or financial relationships that could be construed as a potential conflict of interest.
References
Ahmed, M.-S., Raihan, S.-A., and Balasingam, B. (2020). A scaling approach for improved state of charge representation in rechargeable batteries. Appl. Energy 267:114880. doi: 10.1016/j.apenergy.2020.114880
Ceraolo, M., Lutzemberger, G., Poli, D., and Scarpelli, C. (2020). Luenberger-based state-of-charge evaluation and experimental validation with lithium cells. J. Energy Storage 30:101534. doi: 10.1016/j.est.2020.101534
Chen, X.-K., Lei, H., Xiong, R., Shen, W.-X., and Yang, R.-X. (2019). A novel approach to reconstruct open circuit voltage for state of charge estimation of lithium ion batteries in electric vehicles. Appl. Energy 255:113758. doi: 10.1016/j.apenergy.2019.113758
Dong, G.-Z., Wei, J.-W., and Chen, Z.-H. (2018). Constrained Bayesian dual-filtering for state of charge estimation of lithium-ion batteries. Int. J. Electr. Power Energy Syst. 99, 516–524. doi: 10.1016/j.ijepes.2018.02.005
Feng, F., Liu, R.-G., and Zhu, C.-B. (2014). A combined state of charge estimation method for lithium-ion batteries used in a wide ambient temperature range. Energies 7, 3004–3032. doi: 10.3390/en7053004
Feng, F., Lu, R.-G., Guo, W., and Zhu, C.-B. (2015). Online estimation of model parameters and state of charge of LiFePO4 batteries using a novel open-circuit voltage at various ambient temperatures. Energies 8:2950. doi: 10.3390/en8042950
Feng, F., Teng, S.-L., Liu, K., Xie, J., Xie, Y., and Liu, B. (2020). Co-estimation of lithium-ion battery state of charge and state of temperature based on a hybrid electrochemical-thermal-neural-network model. J. Power Sources 455:227935. doi: 10.1016/j.jpowsour.2020.227935
Hu, M.-H., Li, Y.-X., Li, S.-X., Fu, C.-Y., Qin, D.-T., and Li, Z.-H. (2018). Lithium-ion battery modeling and parameter identification based on fractional theory. Energy 165, 153–163. doi: 10.1016/j.energy.2018.09.101
Hu, X.-S., Li, S.-B., and Peng, H. (2012). A comparative study of equivalent circuit models for Li-ion batteries. J. Power Sources 198, 359–367. doi: 10.1016/j.jpowsour.2011.10.013
Huang, D.-Y., Chen, Z.-Q., Zheng, C.-W., and Li, H.-B. (2019). A model-based state-of-charge estimation method for series-connected lithium-ion battery pack considering fast-varying cell temperature. Energy 185, 847–861. doi: 10.1016/j.energy.2019.07.063
Ines, B., Sabeur, J., Bilal, M., Noshin, O., and Najoua, A. (2017). Improved ocv model of a li-ion nmc battery for online soc estimation using the extended kalman filter. Energies 10:764. doi: 10.3390/en10060764
Lai, X., Wang, S.-Y., Ma, S.-D., Xie, J.-Y., and Zheng, Y.-J. (2020). Parameter sensitivity analysis and simplification of equivalent circuit model for the state of charge of lithium-ion batteries. Electrochim. Acta 330:135239. doi: 10.1016/j.electacta.2019.135239
Li, W.-H., Jiao, Z.-P., Du, L., and Zhu, Y.-Z. (2019). An indirect RUL prognosis for lithium-ion battery under vibration stress using Elman neural network. Int. J. Hydrogen Energy 44, 12270–12276. doi: 10.1016/j.ijhydene.2019.03.101
Li, X.-Y., Wang, Z.-P., and Zhang, L. (2019). Co-estimation of capacity and state-of-charge for lithium-ion batteries in electric vehicles. Energy 174, 33–44. doi: 10.1016/j.energy.2019.02.147
Liu, G.-A., Xu, C., Li, H.-M., Jiang, K., and Wang, K.-L. (2019). State of charge and online model parameters co-estimation for liquid metal batteries. Appl. Energy 250, 677–684. doi: 10.1016/j.apenergy.2019.05.032
Pan, H.-H., Lü, Z.-Q., Lin, W.-L., Li, J.-Z., and Lin, C. (2017). State of charge estimation of lithium-ion batteries using a grey extended Kalman filter and a novel open-circuit voltage model. Energy 138, 764–775. doi: 10.1016/j.energy.2017.07.099
Pattipati, B., Balasingam, B., Avvari, G.-V., Pattipati, K.-R., and Bar-Shalom, Y. (2014). Open circuit voltage characterization of lithium-ion batteries. J. Power Sources 269, 317–333. doi: 10.1016/j.jpowsour.2014.06.152
Saha, P., Dey, S., and Khanra, M. (2020). Modeling and state-of-charge estimation of supercapacitor considering leakage effect. IEEE Trans. Ind. Electron. 67, 350–357. doi: 10.1109/tie.2019.2897506
Wang, S.-L., Fernandez, C., Cao, W., Zou, C.-Y., Yu, C.-M., and Li, X.-X. (2019). An adaptive working state iterative calculation method of the power battery by using the improved Kalman filtering algorithm and considering the relaxation effect. J. Power Sources 428, 67–75. doi: 10.1016/j.jpowsour.2019.04.089
Wang, S.-L., Fernandez, C., Zou, C.-Y., Yu, C.-M., Li, X.-X., Pei, S.-J., et al. (2018). Open circuit voltage and state of charge relationship functional optimization for the working state monitoring of the aerial lithium-ion battery pack. J. Clean. Prod. 198, 1090–1104. doi: 10.1016/j.jclepro.2018.07.030
Wang, Y.-J., and Chen, Z.-H. (2020). A framework for state-of-charge and remaining discharge time prediction using unscented particle filter. Appl. Energy 260:114324. doi: 10.1016/j.apenergy.2019.114324
Wang, Y.-J., Zhang, C.-B., and Chen, Z.-H. (2015). A method for state-of-charge estimation of LiFePO4 batteries at dynamic currents and temperatures using particle filter. J. Power Sources 279, 306–311. doi: 10.1016/j.jpowsour.2015.01.005
Wei, Z.-B., Meng, S.-J., Xiong, B.-Y., Ji, D.-X., and Tseng, K.-J. (2016). Enhanced online model identification and state of charge estimation for lithium-ion battery with a FBCRLS based observer. Appl. Energy 181, 332–341. doi: 10.1016/j.apenergy.2016.08.103
Xia, B.-Z., Cui, D.-Y., Sun, Z., Lao, Z.-Z., Zhang, R.-F., Wang, W., et al. (2018). State of charge estimation of lithium-ion batteries using optimized Levenberg-Marquardt wavelet neural network. Energy 153, 694–705. doi: 10.1016/j.energy.2018.04.085
Xiong, R., Yu, Q.-Q., Wang, L.-Y., and Lin, C. (2017). A novel method to obtain the open circuit voltage for the state of charge of lithium ion batteries in electric vehicles by using H infinity filter. Appl. Energy 207, 346–353. doi: 10.1016/j.apenergy.2017.05.136
Xuan, D.-J., Shi, Z.-F., Chen, J.-Z., Zhang, C.-Y., and Wang, Y.-X. (2020). Real-time estimation of state-of-charge in lithium-ion batteries using improved central difference transform method. J. Clean. Prod. 252:119787. doi: 10.1016/j.jclepro.2019.119787
Yang, J.-F., Huang, W.-X., Xia, B., and Mi, C. (2019). The improved open-circuit voltage characterization test using active polarization voltage reduction method. Appl. Energy 237, 682–694. doi: 10.1016/j.apenergy.2019.01.060
Yu, C.-X., Xie, Y.-M., Sang, Z.-Y., Yang, S.-Y., and Huang, R. (2019). State-of-charge estimation for lithium-ion battery using improved DUKF based on state-parameter separation. Energies 12:4036. doi: 10.3390/en12214036
Zhang, C.-P., Jiang, J., Zhang, W., and Sharkh, S.-M. (2012). Estimation of state of charge of lithium-ion batteries used in HEV using robust extended kalman filtering. Energies 5, 1098–1115. doi: 10.3390/en5041098
Zhang, C.-P., Jiang, J.-C., Zhang, L.-J., Liu, S.-J., Wang, L.-Y., and Loh, P.-C. (2016). A generalized SOC-OCV model for lithium-ion batteries and the SOC estimation for LNMCO battery. Energies 9:900. doi: 10.3390/en9110900
Zhang, C.-P., Wang, Y.-B., Gao, Y., Wang, F., Mu, B.-Q., and Zhang, W.-G. (2019). Accelerated fading recognition for lithium-ion batteries with nickel-cobalt-manganese cathode using quantile regression method. Appl. Energy 256:113841. doi: 10.1016/j.apenergy.2019.113841
Zhou, Y.-T., Wang, Y.-N., Wang, K., Kang, L., Peng, F., Wang, L.-C., et al. (2020). Hybrid genetic algorithm method for efficient and robust evaluation of remaining useful life of supercapacitors. Appl. Energy 260:114169. doi: 10.1016/j.apenergy.2019.114169
Zhou, Z.-K., Duan, B., Kang, Y.-Z., Cui, N.-X., Shang, Y.-L., and Zhang, C.-H. (2019). A low-complexity state of charge estimation method for series-connected lithium-ion battery pack used in electric vehicles. J. Power Sources 441:226972. doi: 10.1016/j.jpowsour.2019.226972
Keywords: open-circuit voltage, state of charge, lithium-ion batteries, energy management, particle filter
Citation: Feng H, Wang Z and Zhang F (2021) A Comprehensive Evaluation of the Influence of Major Hysteresis on State of Charge Prediction of LiNiMnCoO2 Battery. Front. Energy Res. 9:666092. doi: 10.3389/fenrg.2021.666092
Received: 09 February 2021; Accepted: 29 March 2021;
Published: 05 May 2021.
Edited by:
Caiping Zhang, Beijing Jiaotong University, ChinaReviewed by:
Ting-Feng Yi, Northeastern University at Qinhuangdao, ChinaXifei Li, Xi’an University of Technology, China
Fei Feng, Chongqing University, China
Copyright © 2021 Feng, Wang and Zhang. This is an open-access article distributed under the terms of the Creative Commons Attribution License (CC BY). The use, distribution or reproduction in other forums is permitted, provided the original author(s) and the copyright owner(s) are credited and that the original publication in this journal is cited, in accordance with accepted academic practice. No use, distribution or reproduction is permitted which does not comply with these terms.
*Correspondence: Zhifu Wang, d2FuZ3poaWZ1QGJpdC5lZHUuY24=