 Timothy A. Barckholtz1
 Heather Elsen1Patricia H. Kalamaras1Gabor Kiss1Jon Rosen1Dario Bove2
 Emilio Audasso2*
 Barbara Bosio2
- 1ExxonMobil Research and Engineering, Annandale, NJ, United States
- 2Department of Civil, Chemical and Environmental Engineering, University of Genova, Genova, Italy
Molten Carbonate Fuel Cells (MCFCs) are used today commercially for power production. More recently they have also been considered for carbon capture from industrial and power generation CO2 sources. In this newer application context, our recent studies have shown that at low CO2/H2O cathode gas ratios, water supplements CO2 in the electrochemical process to generate power but not capture CO2. We now report the direct Raman observation of the underlying carbonate-hydroxide equilibrium in an alkali carbonate eutectic near MCFC operating conditions. Our improved electrochemical model built on the experimental equilibrium data adjusts the internal resistance terms and has improved the representation of the MCFC performance. This fundamentally improved model now also includes the temperature dependence of cell performance. It has been validated on experimental data collected in single cell tests. The average error in the simulated voltage is less than 4% even when extreme operating conditions of low CO2 concentration and high current density data are included. With the improvements, this electrochemical model is suitable for simulating industrial cells and stacks employed in a wide variety of carbon capture applications.
Introduction
Molten Carbonate Fuel Cells (MCFCs) are electrochemical devices developed for electricity generation. For this reason, much of the past MCFC research was focused on new materials for increased cell performance (Accardo et al., 2017; Frattini et al., 2017; Accardo et al., 2017; Frattini et al., 2017; Baizeng et al., 1998; Kim et al., 2006; Özkan et al., 2015), resistance to pollutants and corrosion (Hernandez et al., 2014; Nguyen et al., 2013; Kim et al., 2018), the effects of operating conditions (Di Giulio et al., 2013; Rexed et al., 2014; Devianto et al., 2016), and the development of electrochemical models to aid theoretical studies and the design of cells, stacks and plants (Audasso et al., 2016; Liu and Weng, 2010; Ma et al., 2009; Meléndez-Ceballos et al., 2015; Szczęśniak et al., 2020; Lee et al., 2010). More recently, a new application of MCFCs for the conversion of industrial waste to produce electricity as thermo-electrochemical has also been developed (Kandhasamy et al., 2020; Kandhasamy et al., 2017).
However, in the last decades the use of MCFCs in CO2 recovery for sequestration has gained more and more academic and commercial interest (Duan et al., 2015; Carapellucci et al., 2019; Mahmoudi et al., 2019; Audasso et al., 2018; Campanari et al., 2014; Wee, 2014; Barelli et al., 2016; Rexed et al., 2015; Duan et al., 2015). Compared to conventional amine-based technologies, in addition to the capture of CO2 from flue gases, MCFCs also allow the simultaneous production of additional electricity, H2 (if cells are fed with CH4) and heat (Rosen et al., 2020). This provides a substantial efficiency advantage, as has been well documented by many simulations (Consonni et al., 2021; Campanari, 2002). MCFC operations depend on two parallel reactions: (1) carbonate ion formation from CO2 and O2 at the cathode and (2) the reduction of the resulting carbonate ion by H2 at the anode that releases water and CO2. This reaction chain (Eq. 1 - 3) transfers CO2 from the cathode to the anode side, enabling the capture of CO2 from power generation and industrial flue gases. Driven by the strong thermodynamic driving force of the net reaction, this process can readily capture up to 90% of CO2 from power generation emissions by enriching the 4-10 vol. % CO2 in the cathode feed to around 70 vol. % CO2 (on dry basis) in the anode gas (Rosen et al., 2020). Simultaneously, MCFCs also allow the production of electricity and H2 by exploiting possible internal reforming reactions. For these reasons, MCFCs are promising for CO2 Capture and Storage (CCS) (Rosen et al., 2020).
The deployment of MCFCs for CCS requires the assessment of their performance with dilute CO2 cathode feeds that are rather different from the ones usually encountered when MCFCs are used for electricity generation. In this line of inquiry, an experimental campaign (Rosen et al., 2020) was conducted with low CO2/H2O ratios feed ratios (≤ 1) to simulate natural gas combined cycle plant flue gas exhaust and high CO2 utilization factors (up to 95%). The results suggested that at these demanding conditions an analogous secondary anion reaction path (Eq. 4 -6) involving hydroxide ions can meaningfully contribute to the electrochemical process due to the depletion of CO2 in the cathode, making MCFCs working as hydroxide molten carbonate fuel cells (Han et al., 2021; Han et al., 2021). Experimental data also showed that the branching ratio between the two anion paths is determined by the reacting cathode gas composition (Rosen et al., 2020) and that, to favor the carbonate path, it is necessary to enhance CO2 diffusion (Rosen et al., 2020; Audasso et al., 2020b). We have defined this simultaneous migration of carbonate and hydroxide ions as a “dual-anion” mechanism (Audasso et al., 2020a).
This newly observed phenomenon has two different effects on cell operations: (i) it improves cell electrochemical performance because of the resulting higher concentration of activated oxidant species, but (ii) it decreases CO2 capture efficiency because part of the current, and with it part of the fuel, will be used to drive water across the cell instead of CO2. To first order, this will increase the amount of fuel and potentially the number of fuel cells required for the capture of a given amount of CO2.
Considering these new findings and based on previous studies (Audasso et al., 2016; Arato et al., 2016), we developed the first semi-empirical dual-anion model to evaluate MCFC performance under these working conditions (Audasso et al., 2020a; Audasso et al., 2020b) using the circuit represented in Figure 1.
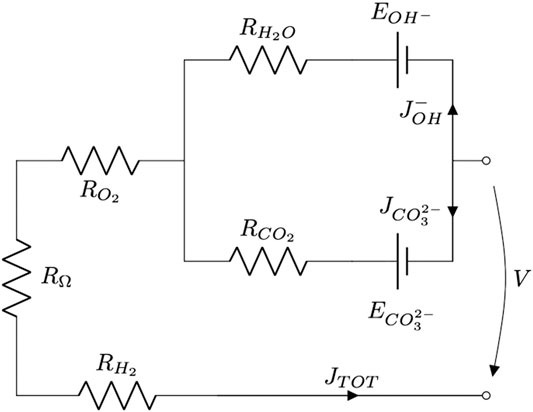
FIGURE 1. Schematic representation of the MCFC working with the dual-anion mechanism (carbonate-hydroxide).
The above circuit can be divided into three parts: a common branch and two parallel branches. The two parallel branches have different driving forces for each ionic path (
To characterize the branching ratio between the two paths, we defined the transference number of the m-th anion (
In the present work, on the basis of our Raman evidence, we developed an improved model that is able to accurately model the transference number over a wider range of conditions than our previous models. The starting point of the new model is the carbonate / hydroxide equilibrium determined by Raman spectroscopy. We will show that while the previous model was effective at simulating the then-available experimental data, it performed poorly at the extremes of carbon capture conditions. Furthermore, the previous model did not account for the effect of temperature. These issues will be addressed here with the addition of the equilibrium reaction, improving the agreement between experimental and calculated cell performance data, especially at the extreme operating conditions.
Experimental evidence of carbonate / hydroxide equilibrium
Melt composition
In previous studies (Audasso et al., 2020a; Audasso et al., 2020b; Rosen et al., 2020) we had not directly observed the presence of
The spectra were collected using a Horiba Jobin-Yvon LabRAM Aramis confocal micro-Raman spectrometer with a 532 nm diode pumped solid state laser and an 1800 grooves mm-1 grating. The confocal microscope was coupled to a 460-mm focal length spectrograph configured in a 180° backscattered arrangement. We used a free-space Olympus BXFM microscope, a Peltier-cooled 1024 × 256, back-illuminated deep-depletion CCD, with a Mitutoyo M Plan APO, SL20x (NA 0.42) objective having a working distance of 20 mm. A 15-second integration time with 3 scans was averaged per spectrum in a collection range of 100-4000 cm-1. The data were analyzed using the Grams AI software package. Band fitting was performed using the Gaussian-Lorentz function on the carbonate and hydroxyl peaks in the 900-1200 and 3400-3800 cm-1 region, respectively.
We used a Linkam CCR1000 high temperature catalyst cell reactor (see schematization in Figure 2). The eutectic was loaded into a sapphire crucible and was placed on a ceramic cloth inside of the sample holder. The sample holder was then loaded into the cell. The cell lid was fitted with a quartz window. The composition of the eutectic electrolyte was 52/48 mol % of Li2CO3/Na2CO3. All spectra were taken at 923 K, and to reach this temperature the cell was heated with a heating rate of 10 K min-1. We used the ratio of peak areas to compensate for changes in absolute signal intensities that could occur due to changes in focusing distance over the course of an experiment.
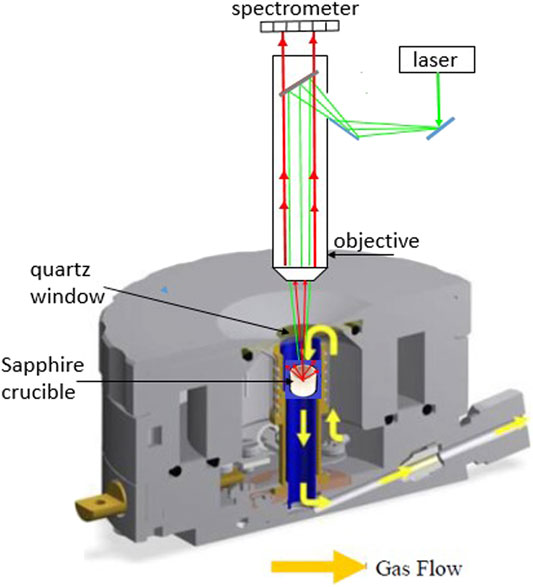
FIGURE 2. Schematic of the in-situ Raman experimentation setup using the Linkam cell.
In Figure 3 a representative Raman spectrum obtained in our experiments is presented. The major peak at 1064 cm-1 corresponds to the symmetric stretching vibration of the
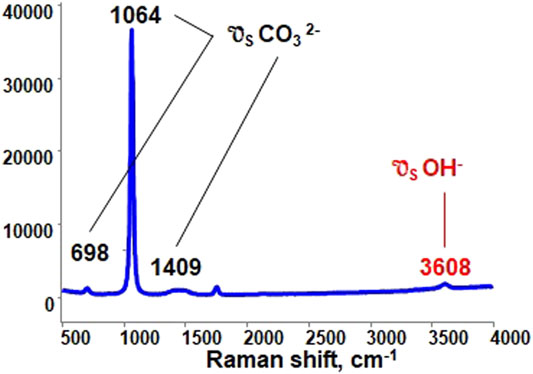
FIGURE 3. Raman spectra of lithium/sodium carbonate eutectic under 10% v/v water vapor, balanced with N2 at 923 K.
The analysis of the peak areas is the first step to generating experimental estimates of the hydroxide/carbonate equilibrium constant:
The equilibrium constant,
Since the water concentration was kept constant in our experiments, the slope of a plot of
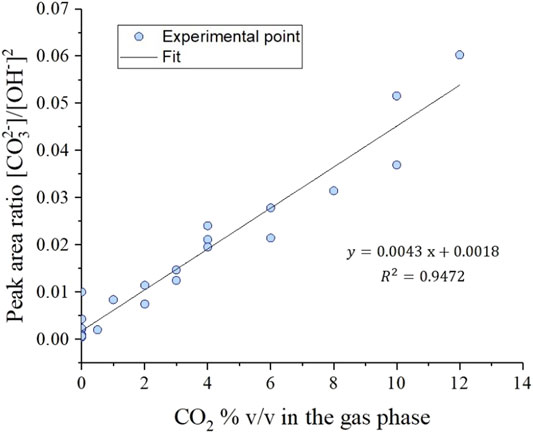
FIGURE 4. Raman
This experimental observation directly proves that the MCFC electrolyte composition is not 100% carbonate under carbon capture conditions. Instead, the electrolyte melt also contains hydroxide ions in accordance with the carbonate/hydroxide equilibrium. To satisfy this equilibrium, hydroxide forms in MCFCs by reducing water introduced in the cathode feed. That hydroxide in turn participates in carrying current in the MCFC and oxidizing H2 to two H2O molecules at the anode resulting in a net water transport across the cell. All else being equal, the split between the competing carbonate and hydroxide electrochemical paths is governed by the [
Internal resistance alteration
The presence of
For the development of the dual-anion model, different experimental campaigns were conducted to gain a proper understanding of the mechanisms and dependences involved in the dual-anion mechanism (Rosen et al., 2020). In these campaigns, data were collected in different operating conditions of anode and cathode total flow rates and compositions, operating temperature, fuel (H2) and oxidant (CO2 and H2O) utilization factors. Our data analysis indicates that the measured
As hydroxides have a higher conductivity compared to the corresponding carbonate (Janz and Tomkins, 1983; Mondal et al., 2020) (e.g., Li2CO3 vs. LiOH), the ohmic resistance is expected to decrease with increasing hydroxide concentration in the electrolyte melt. Thus, as the carbonate/hydroxide equilibrium shifts,
In Figure 5 the various
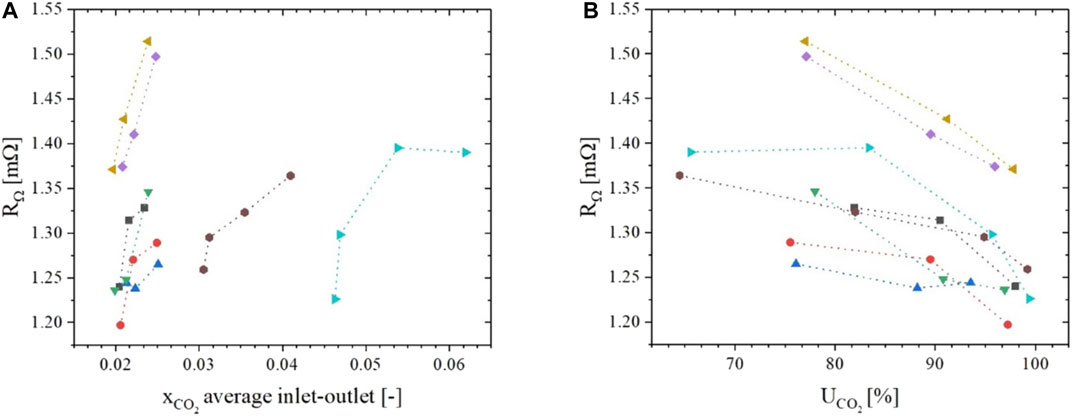
FIGURE 5.
Although changing cathode CO2/H2O ratios can cause detectable changes in ohmic resistance, the variation in our tests was less than 10%. Hence, our earlier sensitivity analysis (Bove et al., 2020) concluded that it has a negligible impact on the measured voltage (∼1 mV) at typical current densities of 100 mA cm-2. For this reason, although detectable and interesting from a theoretical point of view, we decided to neglect this aspect in our model. It is possible, though, that at more extreme operating conditions this approach may need to be revised.
Apparent CO2 utilization
One of the most effective ways we found to understand the extent of the dual-anion mechanism is to analyze the CO2 utilization factor (
During the analysis of the experimental data (Rosen et al., 2020), we observed that, at otherwise similar conditions, the discrepancy between the apparent and measured CO2 utilizations increases as the CO2/H2O ratio decreases. This is summarized in graphs A and B of Figure 6. This observation suggested, and the above-presented Raman spectroscopy confirmed, that this increasing gap is indeed due to the formation and migration of
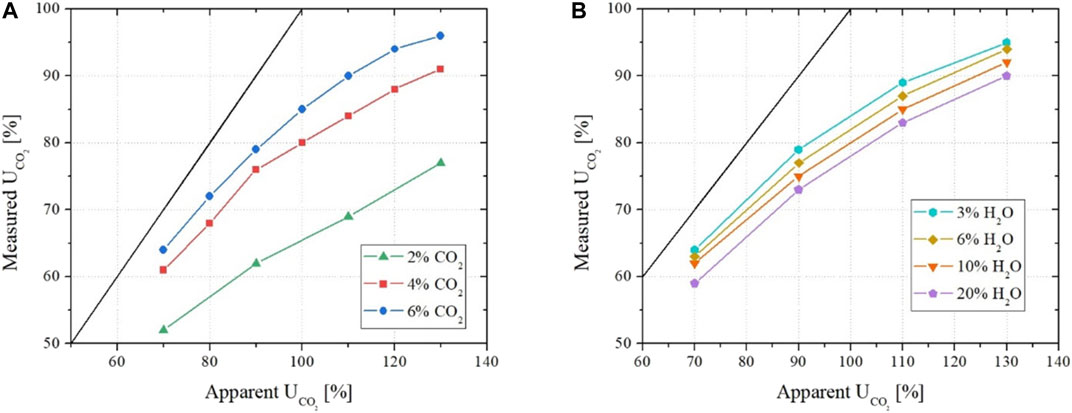
FIGURE 6. Apparent versus measured utilization factor of CO2 as a function of different inlet concentrations of CO2(A) and H2O (B).
The data shown in graphs A and B of Figure 6 were collected at a constant operating temperature of 923 K. To improve the understanding of the phenomenon and thus properly expand the model range of operability, we repeated similar analyses at different operating temperatures. The graph in Figure 7 presents the results for five temperature sets of four experimental conditions. The conditions for those four data sets are presented in Table 1, while information on the single cell apparatus used in the experiments can be found in (Rosen et al., 2020).
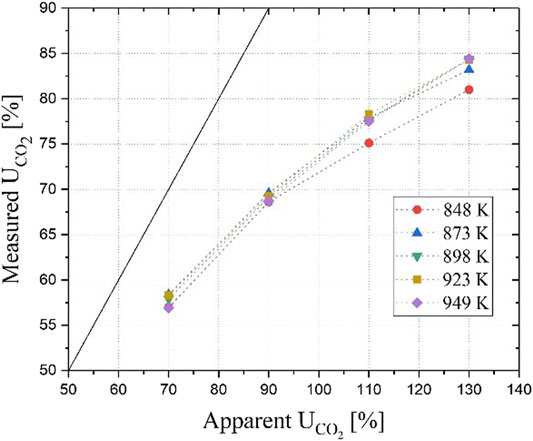
FIGURE 7. Apparent versus measured utilization factor of CO2 as a function of different operating temperatures. Test conditions for the individual data points are listed in Table 1.
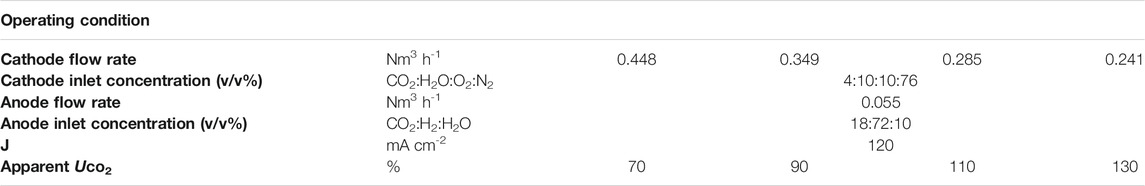
TABLE 1. Data used in the analysis of the temperature effects on the dual-anion mechanism.
The graph shows that at different operating temperatures the measured utilization factors nearly overlap indicating that temperature has a negligible effect on the ratio of ionic conduction between the carbonate and the hydroxide paths. This is consistent with our previous results (Audasso et al., 2020b) showing that the contribution of one path over the other is mainly dependent on the cathode-side diffusion process and only slightly affected by the temperature in the studied range. Because of the dominance of transport effects, the operating temperature does not have significant influence on the carbonate/hydroxide equilibrium constant in the temperature operability range of MCFCs. These results also justify the simplification of the activation resistance in our earlier-published model because it is either constant (fitting its value with the diffusion polarization) or negligible (assuming a small value due to the high operating temperatures) (Audasso et al., 2020a).
Performance modeling
Temperature dependent dual-anion model
For the first-presented MCFC dual-anion model (Audasso et al., 2020a; Audasso et al., 2020b), we did not include the effects of the operating temperature on the polarization resistances because we initially focused on identifying the electrochemical phenomena involved and their controlling factors. Consequently, the initial experimental data were primarily collected at a constant operating temperature of 923 K and thus the temperature effect on the relative contributions of the competing reaction paths could not be addressed. This limited the model to a single temperature. We now extended the model applicability by allowing for the variation of the operating temperature. This is essential if the model is to be applied in industrial applications that could run at different temperatures at which the contribution of the competing reaction channels may vary. Also, these applications use larger cells (area of about 1 m2 (Hishinuma & Kunikata, 1997)) with significant temperature gradients.
Following a previously presented derivation from the Butler-Volmer’s equation (Audasso et al., 2020a), the polarization resistances of the reactants can be rewritten to address the temperature dependence as follows:
Note that unlike in our previous work (Audasso et al., 2020a; Audasso et al., 2020b), here we have assumed a non-linear dependence for the H2. This was done to better handle higher fuel utilizations where a significant portion of the H2 may be consumed inducing increased diffusion resistance on the anode side.
The ohmic resistance is usually described in the literature with an exponential function of the operating temperature such as the one expressed in Eq. 17 (Bosio et al., 2014; Morita et al., 1998):
To fit the parameters of the ohmic resistance, experimental data were collected using two different cells at different operating temperatures. The results are shown in Figure 8.
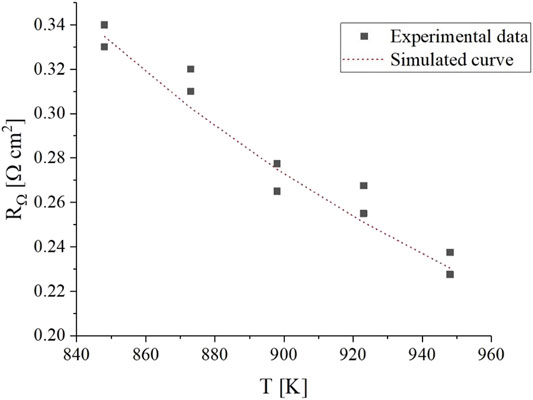
FIGURE 8. Experimental
The effect of temperature on ohmic resistance is considerably higher than what is caused by electrolyte composition changes induced by changes in gas compositions. Between the highest and lowest analyzed temperatures, the value of resistance spans from 0.23 to 0.34 Ω cm2 which corresponds to a ∼11 mV difference at typical current densities of 100 mA cm-2. This is ten times higher than the effect of gas composition, and we deem it non-negligible.
The final set of kinetic parameters used in the model is presented in Table 2.
TABLE 2. Kinetic parameters used for the non-isothermal dual-anion model without the equilibrium correction. These parameters are to be used with the resistance formulas of Equations 13 through 17.
Using this temperature-dependent model, the experimental data at different operating temperatures were simulated. In Table 3, some of the main results of the simulations are presented and can be compared to the data in Figure 7. In the first three columns, the measured voltage, the simulated voltage, and the % error (in absolute value) are presented. For most entries the model replicates the experimental results with less than 2% error. Only a few data points collected with apparent CO2 utilizations higher than 110% have significant errors with a maximum of 13% at 848 K. This outcome agrees with the simulation results presented in the our previous works (Audasso et al., 2020a; Audasso et al., 2020b) that also had the highest errors in correspondence with the data collected with high utilization factors. We attributed this to the lower experimental accuracy and reproducibility of these points. Since these data were acquired at CO2-starved conditions, they are characterized by having a pronounced influence of the hydroxide path. In the last three columns, the experimentally measured and the simulated utilization factors are presented with the corresponding percentage errors. As shown in Table 3, the simulated utilization factors agree with the measured data both in terms of values and trend. Again, the worst results are the ones for high (>100%) CO2 apparent utilization in combination with a low temperature (848 K); however, MCFCs are typically not used at these low temperatures.
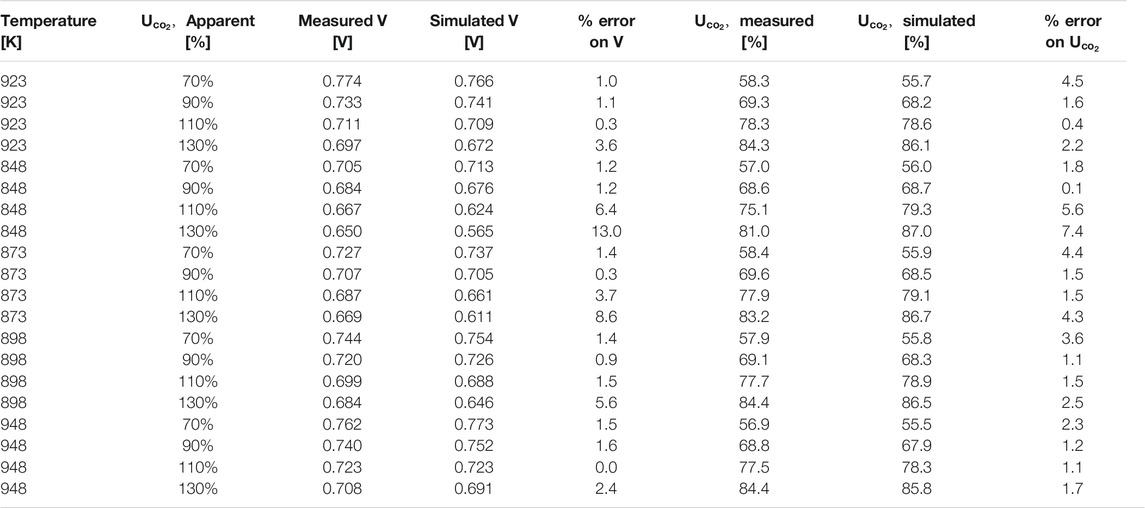
TABLE 3. Results of the temperature dependent model fitting for the data at different operating temperatures and apparent CO2 utilization.
Using this newly developed temperature-dependent model with the parameters presented in Table 2, all experimental conditions (including the isothermal runs presented in (Rosen et al., 2020; Audasso et al., 2020b)) were simulated. This formulation was also implemented in the SIMFC code, an in-house 2D model based on local mass, energy, and momentum balances. The two graphs of Figure 9 show the results of the simulated vs. measured voltages for the complete experimental data set using the new, temperature-dependent model. In the graph on the top, the different colors represent different
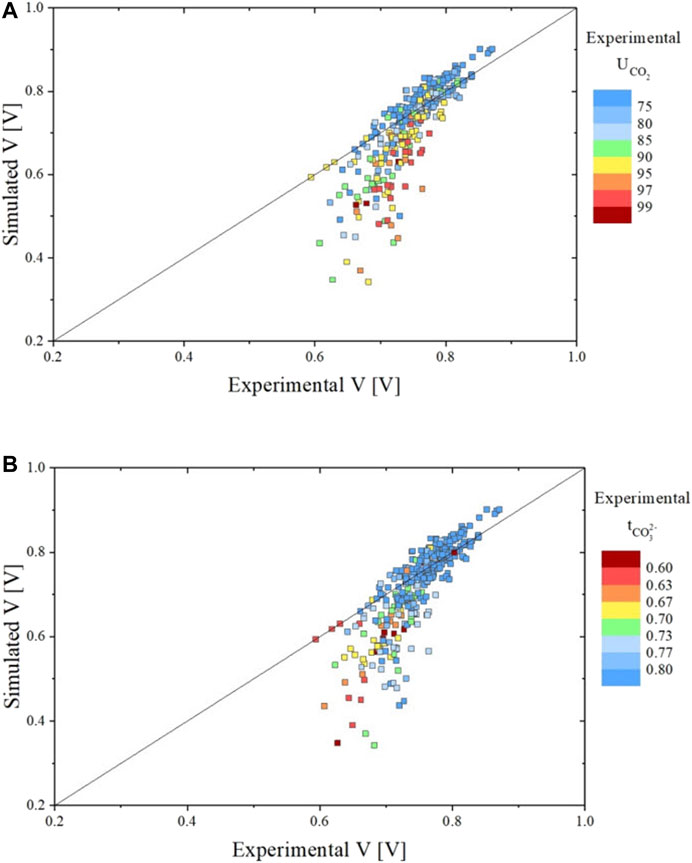
FIGURE 9. Parity plots showing the comparison between experimental and simulated data for all data sets in terms of voltage evaluated using the temperature dependent dual-anion model with H2 resistance non-linear form. Graph A shows the voltage result colored in function of the
As observed with our previous model (Audasso et al., 2020b), the simulation results significantly deviate from the experimental values at very high CO2 utilizations associated with low transference numbers. Model predictions thus worsen when the contribution of the hydroxide path becomes high. We performed additional refinements to mitigate this deviation (see below).
Dual-anion model further corrected by carbonate / hydroxide equilibrium
As discussed above and shown in Figure 9, model accuracy worsens when simulating cell potentials at high (>90%) CO2 utilizations that correlate with low (<0.7) carbonate transference values. We postulate that this may be because the cathode gas concentrations we use in the resistance equations do not properly represent the local gas composition that determines the carbonate-hydroxide equilibrium (Eq. 8).
To account for the differences between the bulk and local gas concentrations, the polarization resistance equations for CO2 and H2O can be expressed in the following form:
where “i” indicates the i-th component and “m” the followed anionic path.
In this form, the ratio in the logarithmic part is an expression of the ratio between the bulk and the local gas concentrations, the latter corresponding to the gas composition in the cathode pores at the gas-liquid interphase. Thus, as explained in (Audasso et al., 2020a),
We begin by assuming that the polarization resistances of both CO2 and H2O can be modeled as the product between the pure electrochemical resistance and a function of the concentration of the related anion in the melt that increases or decreases the apparent resistance value according to the melt composition. We assume this function as the one presented in Eq. 19.
As a first attempt, we propose to express these modifying functions as linear functions of the ratio between the two anion concentrations, taking into account of their stoichiometry in the equilibrium reaction. These ratios can be then correlated to the bulk cathode gas concentration as follows:
where Cm represents the concentration of the m-th reactant species, Keq is the carbonate-hydroxide equilibrium constant, and Am represents a constant that can be used to relate the expression to the polarization resistances. To simplify these functions and make them more manageable, we made several additional simplifying assumptions. For example, since the MCFC operating temperature range is limited,
With these additional assumptions we obtain the two formulas (Eqs. 22 and 23) that require the fitting to experimental data of only one parameter each.
Where A′m is a modified Am that takes into account the substitution from the use of concentration to molar fractions. Substituting Eqs. 22 and 23 in Eq. 19, we can obtain the polarization resistances of CO2 and H2O. Since both A′m and
For the above-described model equations the fitted kinetic parameters are presented in Table 4. Using these new parameters, the experimental data were refitted to test if an improvement could be achieved after its implementation in the SIMFC code. The comparisons of the measured and simulated voltages are presented in Figure 10. Clearly, the new model improved model predictions, particularly at high CO2 utilizations, and the average voltage error is now reduced to ∼4% as compared to the ∼7% with the model without the equilibrium correction.
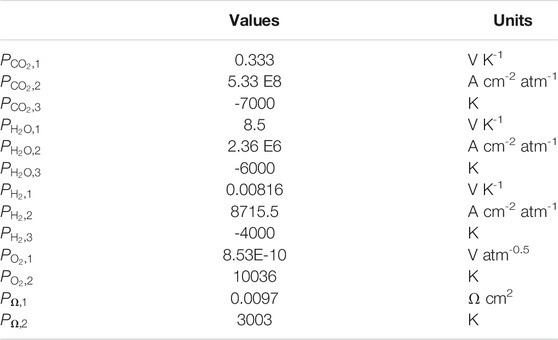
TABLE 4. Kinetic parameters used for the dual-anion model corrected by carbonate / hydroxide equilibrium. These parameters are to be used with the resistance formulas of Equations 15, 16, 17, 24, and 25.
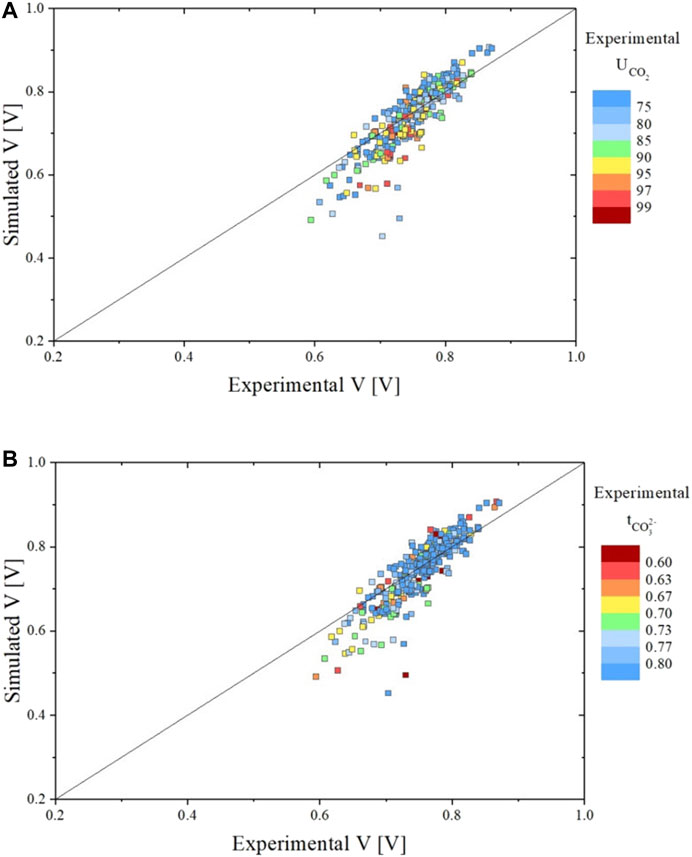
FIGURE 10. Parity plots showing the comparison between experimental and simulated data for all data sets in terms of voltage evaluated using the dual-anion model corrected by carbonate / hydroxide equilibrium. Graph A shows the voltage result colored in function of the
Finally, in Figure 11, the simulation of the utilization factor of CO2 (A) and the carbonate ions transference number (B) are presented for all the experimental data. For these simulations, the average percentage errors were respectively of about 4.5% for the utilization factor and of about 4.6% for the transference number. Both values were comparable to the one obtained in our previous works.
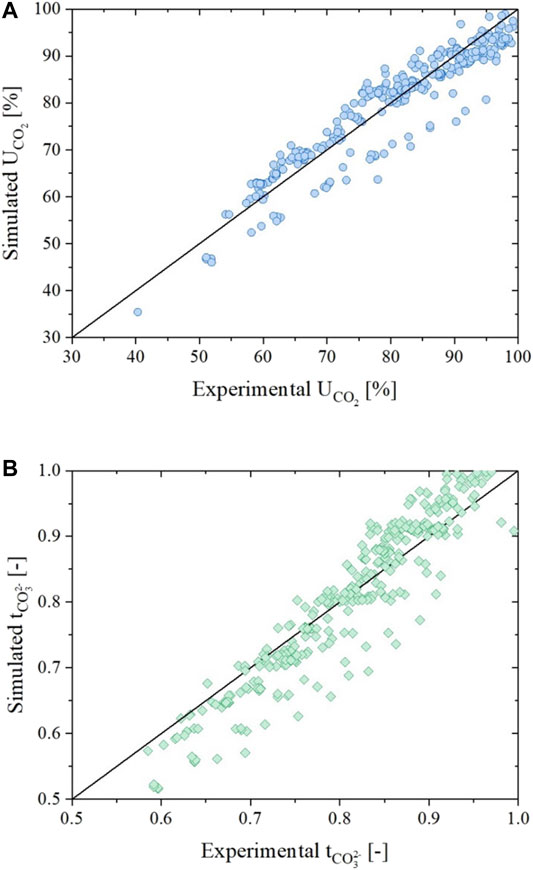
FIGURE 11. Parity plots showing the comparison between experimental and simulated data for all data sets in terms of utilization of CO2(A) and carbonate ions transference number (B) evaluated using the dual-anion model corrected by carbonate / hydroxide equilibrium.
Conclusions
In a series of previous papers (Audasso et al., 2020a; Audasso et al., 2020b; Rosen et al., 2020), we described a newly discovered dual-anion mechanism that better fits the physical processes observed in MCFC operations, particularly in carbon capture applications where the cathode CO2/H2O ratios are low. This extended the model applicability into this low CO2/H2O cathode gas ratio. This new mechanism postulated the significant presence of water-derived hydroxide ions in the electrolyte and their participation in carrying charges across the fuel cell.
In the present contribution, through Raman spectroscopy, we were able to directly observe the presence of
The temperature dependence of the polarization resistance was also rendered explicit in the current model and its applicability demonstrated with positive results. Analysis of the data showed that temperature does not have significant effect on the split between the two competing ionic pathways. As with the previous formulation, it showed to have an issue in dealing with conditions at which the hydroxide path becomes high. This model deficiency was hypothesized to derive from an implicit dependence of the polarization resistance on the carbonate/hydroxide equilibrium that could have led to overestimating the hydroxide path resistance. Thus, to improve predictions, the model was reformulated to include an explicit dependence of CO2 and H2O resistances on the carbonate-hydroxide equilibrium.
The final temperature-dependent, dual-anion model, and including the carbonate/hydroxide equilibrium was tested on the combined set of our experimental data. It showed satisfactory results with a reduction of the average voltage simulation error from 7.3% with the previous formulation to 4% with the current model, including the high CO2 utilization conditions. In our experience this new model can be applied to satisfactorily simulate MCFCs integrated in complex systems for energy production and carbon capture applications.
As a final conclusion to the series of papers on the dual-anion model (Audasso et al., 2020a; Audasso et al., 2020b), we show in Table 5 the progression of our model development and the impact each modification had on fitting the experimental data. In the table, the progress through the five modeling stages is presented. The table includes the number of experimental data used for fitting the parameters for each model, the average simulation error for voltage and carbonate ion transference number, the percentage of outliers (data with a simulated error of >10% from experiment), the strengths and limits of each model, and the publication references.
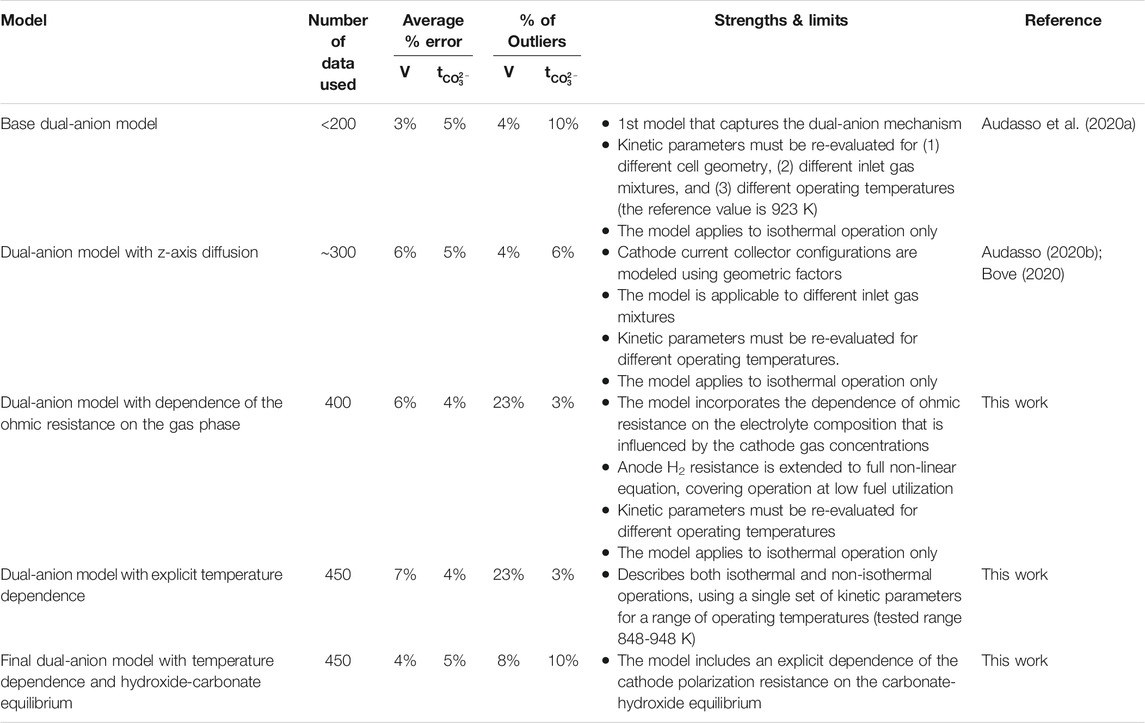
TABLE 5. The progression of our dual-anion MCFC models.
It should be noted that as the complexity of the model increased, it did so because the range of conditions being covered by the model increased. The final model satisfactorily represents the cell operation over a very wide range of conditions, covering high and low fuel utilizations, high and low inlet CO2 concentrations, high and low CO2 apparent utilization, and current densities up to at least 150 mA cm-2. Less obviously apparent in the data set coverage is that the model also includes terms to account for changes in the cell geometry, so that the electrochemical terms do not need to be refitted when the gas diffusion is changed in the cathode.
Data Availability Statement
The raw data supporting the conclusions of this article will be made available by the authors, without undue reservation.
Author Contributions
Experimental: TB, HE, PK, GK, and JR. Data analysis: EA, GK, and BB. Software: EA, BB, and DB. Writing: EA, BB, TB, JR, and GK.
Conflict of Interest
DB, EA, and BB have no conflicts to report. TB, HE, PK, GK, and JR are employees of ExxonMobil Research and Engineering which is pursuing the commercial development of this technology.
References
Accardo, G., Frattini, D., Moreno, A., Yoon, S. P., Han, J. H., and Nam, S. W. (2017). Influence of Nano Zirconia on NiAl Anodes for Molten Carbonate Fuel Cell: Characterization, Cell Tests and post-analysis. J. Power Sourc. 338, 74–81. doi:10.1016/J.JPOWSOUR.2016.11.029
Accardo, G., Frattini, D., Yoon, S. P., Ham, H. C., and Nam, S. W. (2017). Performance and Properties of Anodes Reinforced with Metal Oxide Nanoparticles for Molten Carbonate Fuel Cells. J. Power Sourc. 370, 52–60. doi:10.1016/J.JPOWSOUR.2017.10.015
Arato, E., Audasso, E., Barelli, L., Bosio, B., and Discepoli, G. (2016). Kinetic Modelling of Molten Carbonate Fuel Cells: Effects of Cathode Water and Electrode Materials. J. Power Sourc. 336, 18–27. doi:10.1016/j.jpowsour.2016.08.123
Audasso, E., Bosio, B., Bove, D., Arato, E., Barckholtz, T., Kiss, G., et al. (2020a). New, Dual-Anion Mechanism for Molten Carbonate Fuel Cells Working as Carbon Capture Devices. J. Electrochem. Soc. 167. doi:10.1149/1945-7111/ab8979
Audasso, E., Bosio, B., Bove, D., Arato, E., Barckholtz, T., Kiss, G., et al. (2020b). The Effects of Gas Diffusion in Molten Carbonate Fuel Cells Working as Carbon Capture Devices. J. Electrochem. Soc. 167, 114515. doi:10.1149/1945-7111/aba8b6
Audasso, E., Bosio, B., and Nam, S. (2016). Extension of an Effective MCFC Kinetic Model to a Wider Range of Operating Conditions. Int. J. Hydrogen Energ. 41, 5571–5581. doi:10.1016/j.ijhydene.2015.10.152
Audasso, E., Campbell, P., Della Pietra, M., Ferrari, M. C., Bosio, B., and Arato, E. (2018). Molten Carbonate Fuel Cells in Integrated Systems for the Exploitation of Poor Fuels and the Segregation of CO2. Bulg. Chem. Commun. 50, 99–107. https://www.scopus.com/inward/record.uri?eid=2-s2.0-85060040347&partnerID=40&md5=e6e1c26b442c8fb37c590209ac35e786
Audasso, E., Nam, S., Arato, E., and Bosio, B. (2017). Preliminary Model and Validation of Molten Carbonate Fuel Cell Kinetics under sulphur Poisoning. J. Power Sourc. 352, 216–225. doi:10.1016/j.jpowsour.2017.03.091
Baizeng, F., Xinyu, L., Xindong, W., and Shuzhen, D. (1998). Surface Modification of a MCFC Anode by Electrodeposition of Niobium. J. Electroanal. Chem. 441, 1–3. doi:10.1016/S0022-0728(97)00203-9
Barelli, L., Bidini, G., Campanari, S., Discepoli, G., and Spinelli, M. (2016). Performance Assessment of Natural Gas and Biogas Fueled Molten Carbonate Fuel Cells in Carbon Capture Configuration. J. Power Sourc. 320, 332–342. doi:10.1016/j.jpowsour.2016.04.071
Beale, S. B. (2004). Calculation Procedure for Mass Transfer in Fuel Cells. J. Power Sourc. 128, 185–192. doi:10.1016/j.jpowsour.2003.09.053
Bosio, B., Arato, E., and Costa, P. (2003). Concentration Polarisation in Heterogeneous Electrochemical Reactions: a Consistent Kinetic Evaluation and its Application to Molten Carbonate Fuel Cells. J. Power Sourc. 115, 189–193. doi:10.1016/S0378-7753(02)00729-2
Bosio, B., Di Giulio, N., Nam, S. W., and Moreno, A. (2014). An Effective Semi-empiric Model for MCFC Kinetics: Theoretical Development and Experimental Parameters Identification. Int. J. Hydrogen Energ. 39, 12273–12284. doi:10.1016/J.IJHYDENE.2014.04.119
Bove, D., Audasso, E., Barckholtz, T., Kiss, G., Rosen, J., and Bosio, B. (2020). Process Analysis of Molten Carbonate Fuel Cells in Carbon Capture Applications. Int. J. Hydrogen Energ. 46. doi:10.1016/j.ijhydene.2020.08.020
Campanari, S. (2002). Carbon Dioxide Separation from High Temperature Fuel Cell Power Plants. J. Power SourcesII. 112, 273–289. doi:10.1016/S0378-7753(02)00395-6
Campanari, S., Chiesa, P., Manzolini, G., and Bedogni, S. (2014). Economic Analysis of CO2 Capture from Natural Gas Combined Cycles Using Molten Carbonate Fuel Cells. Appl. Energ. 130, 562–573. doi:10.1016/J.APENERGY.2014.04.011
Carapellucci, R., Di Battista, D., and Cipollone, R. (2019). The Retrofitting of a Coal-Fired Subcritical Steam Power Plant for Carbon Dioxide Capture: A Comparison between MCFC-Based Active Systems and Conventional MEA. Energy Convers. Manag. 194, 124–139. doi:10.1016/J.ENCONMAN.2019.04.077
Consonni, S., Mastropasqua, L., Spinelli, M., Barckholtz, T. A., and Campanari, S. (2021). Low-carbon Hydrogen via Integration of Steam Methane Reforming with Molten Carbonate Fuel Cells at Low Fuel Utilization. Adv. Appl. Energ. 2, 100010. doi:10.1016/j.adapen.2021.100010
Devianto, H., Sasongko, D., Sempurna, F. I., Nurdin, I., and Widiatmoko, P. (2016). Effect of Gas Composition Produced by Gasification, on the Performance and Durability of Molten Carbonate Fuel Cell (MCFC). J. Nat. Gas Sci. Eng. 35, 896–905. doi:10.1016/J.JNGSE.2016.08.075
Di Giulio, N., Audasso, E., Bosio, B., Han, J., Nam, S. W., McPhail, S., et al. (2013). “The SO2 Poisoning Influence on the Kinetics of MCFC,” in EFC 2013 - Proc. 5th Eur. Fuel Cell Piero Lunghi Conf. http://www.scopus.com/inward/record.url?eid=2-s2.0-84926303770&partnerID=MN8TOARS
Duan, L., Sun, S., Yue, L., Qu, W., and Yang, Y. (2015). Study on a New IGCC (Integrated Gasification Combined Cycle) System with CO2 Capture by Integrating MCFC (Molten Carbonate Fuel Cell). Energy 87, 490–503. doi:10.1016/J.ENERGY.2015.05.011
Duan, L., Yue, L., Qu, W., and Yang, Y. (2015). Study on CO2 Capture from Molten Carbonate Fuel Cell Hybrid System Integrated with Oxygen Ion Transfer Membrane. Energy 93, 20–30. doi:10.1016/j.energy.2015.07.137
Frangini, S., and Masi, A. (2016). Molten Carbonates for Advanced and Sustainable Energy Applications: Part I. Revisiting Molten Carbonate Properties from a Sustainable Viewpoint. Int. J. Hydrogen Energ. 41, 18739–18746. doi:10.1016/J.IJHYDENE.2015.12.073
Frattini, D., Accardo, G., Moreno, A., Yoon, S. P., Han, J. H., and Nam, S. W. (2017). A Novel Nickel-Aluminum alloy with Titanium for Improved Anode Performance and Properties in Molten Carbonate Fuel Cells. J. Power Sourc. 352, 90–98. doi:10.1016/J.JPOWSOUR.2017.03.112
Frattini, D., Accardo, G., Moreno, A., Yoon, S. P., Han, J. H., and Nam, S. W. (2017). Strengthening Mechanism and Electrochemical Characterization of ZrO2 Nanoparticles in Nickel–Aluminum alloy for Molten Carbonate Fuel Cells. J. Ind. Eng. Chem. 56, 285–291. doi:10.1016/J.JIEC.2017.07.021
Han, Y., Zhang, H., and Hu, Z. (2021). A New Combined System Consisting of a Molten Hydroxide Direct Carbon Fuel Cell and an Alkali Metal thermal Electric Converter: Energy and Exergy Analyses. Appl. Therm. Eng. 185, 116417. doi:10.1016/j.applthermaleng.2020.116417
Han, Y., Zhang, H., Hu, Z., and Hou, S. (2021). An Efficient Hybrid System Using a Graphene-Based Cathode Vacuum Thermionic Energy Converter to Harvest the Waste Heat from a Molten Hydroxide Direct Carbon Fuel Cell. Energy 223, 120095. doi:10.1016/j.energy.2021.120095
Hemmes, K., and Cassir, M. (2011). A Theoretical Study of the Carbon/Carbonate/Hydroxide (Electro-) Chemical System in a Direct Carbon Fuel Cell. J. Fuel Cel Sci. Technol. 8 (051005), 1–5. doi:10.1115/1.4003750
Hernandez, J. M., Lim, D.-H., Nguyen, H. V. P., Yoon, S.-P., Han, J., Nam, S. W., et al. (2014). Decomposition of Hydrogen Sulfide (H2S) on Ni(100) and Ni3Al(100) Surfaces from First-Principles. Int. J. Hydrogen Energ. 39, 12251–12258. doi:10.1016/J.IJHYDENE.2014.03.064
Hishinuma, Y., and Kunikata, M. (1997). Molten Carbonate Fuel Cell Power Generation Systems. Energ. Convers. Manag. 38, 1237–1247. doi:10.1016/S0196-8904(96)00153-7
Janz, G. J., and Tomkins, R. P. T. (1983). Molten Salts: Volume 5, Part 2. Additional Single and Multi‐Component Salt Systems. Electrical Conductance, Density, Viscosity and Surface Tension Data. J. Phys. Chem. Ref. Data 12, 591. doi:10.1063/1.555693
Kandhasamy, S., Calandrino, L., Burheim, O. S., Solheim, A., Kjelstrup, S., and Haarberg, G. M. (2017). Influence of Electrode Gas Flow Rate and Solid Oxide Ratio in Electrolyte on the Seebeck Coefficient of Molten Carbonate Thermocell. J. Electrochem. Soc. 164, H5271–H5276. doi:10.1149/2.0391708jes
Kandhasamy, S., Haarberg, G. M., Kjelstrup, S., and Solheim, A. (2020). Gas Electrodes with Nickel Based Current Collectors for Molten Carbonate Electrolyte Thermo-Electrochemical Cells. J. Energ. Chem. 41, 34–42. doi:10.1016/j.jechem.2019.05.001
Kim, M. H., Hong, M. Z., Kim, Y.-S., Park, E., Lee, H., Ha, H.-W., et al. (2006). Cobalt and Cerium Coated Ni Powder as a New Candidate Cathode Material for MCFC. Electrochim. Acta 51, 6145–6151. doi:10.1016/j.electacta.2006.01.073
Kim, M., Youn, J., Lim, J., Eom, K., Cho, E., and Kwon, H. (2018). Corrosion-resistant Coating for Cathode Current Collector and Wet-Seal Area of Molten Carbonate Fuel Cells. Int. J. Hydrogen Energ. 43, 11363–11371. doi:10.1016/j.ijhydene.2018.02.196
Lee, S.-Y., Kim, D.-H., Lim, H.-C., and Chung, G.-Y. (2010). Mathematical Modeling of a Molten Carbonate Fuel Cell (MCFC) Stack. Int. J. Hydrogen Energ. 35, 13096–13103. doi:10.1016/j.ijhydene.2010.04.070
Liu, A., and Weng, Y. (2010). Modeling of Molten Carbonate Fuel Cell Based on the Volume–Resistance Characteristics and Experimental Analysis. J. Power Sourc. 195, 1872–1879. doi:10.1016/J.JPOWSOUR.2009.10.040
Ma, Z., Venkataraman, R., and Farooque, M., (2009). Fuel Cells – Molten Carbonate Fuel Cells. Modeling, Encycl. Electrochem. Power Sourc. 6. 519–532. doi:10.1016/B978-044452745-5.00272-0
Mahmoudi, S. M. S., Ghavimi, A. R., and Yari, M. (2019). Two Objective Optimization for a New Molten Carbonate Fuel Cell Based Power Producing System. Appl. Therm. Eng. 155, 313–330. doi:10.1016/J.APPLTHERMALENG.2019.03.153
Meléndez-Ceballos, A., Albin, V., Lair, V., Ringuedé, A., and Cassir, M. (2015). A Kinetic Approach on the Effect of Cs Addition on Oxygen Reduction for MCFC Application. Electrochim. Acta 184, 295–300. doi:10.1016/J.ELECTACTA.2015.10.057
Mizuhata, M., Ohta, T., and Deki, S. (2009). Polarized Raman Spectra of Molten Carbonates Influenced by the Surface Acidity of the Coexisting Inorganic Powder. Electrochemistry 77, 721–724. doi:10.5796/electrochemistry.77.721
Mondal, A., Young, J. M., Barckholtz, T. A., Kiss, G., Koziol, L., and Panagiotopoulos, A. Z. (2020). Transport and Interfacial Properties of Mixed Molten Carbonate/Hydroxide Electrolytes by Molecular Dynamics Simulations. J. Phys. Chem. C. 124, 23532–23540. doi:10.1021/acs.jpcc.0c07295
Morita, H., Komoda, M., Mugikura, Y., Izaki, Y., Watanabe, T., Masuda, Y., et al. (2002). Performance Analysis of Molten Carbonate Fuel Cell Using a Li/Na Electrolyte. J. Power Sourc. 112, 509–518. doi:10.1016/S0378-7753(02)00468-8
Morita, H., Mugikura, Y., Izaki, Y., Watanabe, T., and Abe, T. (1998). Model of Cathode Reaction Resistance in Molten Carbonate Fuel Cells. J. Electrochem. Soc. 145, 1511–1517. doi:10.1149/1.1838512
Nguyen, H. V. P., Song, S. A., Seo, D., Han, J., Yoon, S. P., Ham, H. C., et al. (2013). Hydrogen Sulfide-Resilient Anodes for Molten Carbonate Fuel Cells. J. Power Sourc. 230, 282–289. doi:10.1016/J.JPOWSOUR.2012.12.077
Özkan, G., Özkan, G., and İyidir, U. C. (2015). Synthesıs and Characterızatıon of Molten Carbonate Fuel Cell Anode Materıals, Energy Sources, Part A Recover. Util. Environ. Eff. 37, 2487–2495. doi:10.1080/15567036.2011.627415
Rexed, I., della Pietra, M., McPhail, S., Lindbergh, G., and Lagergren, C. (2015). Molten Carbonate Fuel Cells for CO2 Separation and Segregation by Retrofitting Existing Plants – an Analysis of Feasible Operating Windows and First Experimental Findings. Int. J. Greenh. Gas Control. 35, 120–130. doi:10.1016/j.ijggc.2015.01.012
Rexed, I., Lagergren, C., and Lindbergh, G. (2014). Effect of Sulfur Contaminants on MCFC Performance. Int. J. Hydrogen Energ. 39, 12242–12250. doi:10.1016/J.IJHYDENE.2014.03.068
Rosen, J., Geary, T., Hilmi, A., Blanco Gutierrez, R., Yuh, C. Y., Pereira, C. S., et al. (2020). Molten Carbonate Fuel Cell Performance for CO2 Capture from Natural Gas Combined Cycle Flue Gas. J. Electrochem. Soc. 167, 064505. doi:10.1149/1945-7111/ab7a9f
Szczęśniak, A., Milewski, J., Szabłowski, Ł., Bujalski, W., and Dybiński, O. (2020). Dynamic Model of a Molten Carbonate Fuel Cell 1 kW Stack. Energy 200, 117442. doi:10.1016/j.energy.2020.117442
Wee, J.-H. (2014). Carbon Dioxide Emission Reduction Using Molten Carbonate Fuel Cell Systems. Renew. Sustain. Energ. Rev. 32, 178–191. doi:10.1016/J.RSER.2014.01.034
Xing, L., Hao, J., Li, X., Zhang, Y., Hu, Z., and Gao, Y. (2017). Polarization Modeling and Performance Optimization of a Molten Sodium Hydroxide Direct Carbon Fuel Cell (MHDCFC). J. Power Sourc. 363, 428–441. doi:10.1016/J.JPOWSOUR.2017.07.113
Yoshiba, F., Abe, T., and Watanabe, T. (2000). Numerical Analysis of Molten Carbonate Fuel Cell Stack Performance: Diagnosis of Internal Conditions Using Cell Voltage Profiles. J. Power Sourc. 87, 21–27. doi:10.1016/S0378-7753(99)00352-3
Young, J. M., Mondal, A., Barckholtz, T. A., Kiss, G., Koziol, L., and Panagiotopoulos, A. Z. (2020). Predicting Chemical Reaction Equilibria in Molten Carbonate Fuel Cells via Molecular Simulations. AIChE J. N/a 67 (2), e16988. doi:10.1002/aic.16988
Zakiriyanova, I. D., Khokhlov, V. A., and Kochedykov, V. A. (1999). Raman Spectra and Microdynamics of the Hydroxide-Ion in Molten NaOH and NaClNaOH Mixtures. J. Mol. Liq. 83, 153–162. doi:10.1016/S0167-7322(99)00082-3
Zakir’yanova, I. D., V Nikolaeva, E., Bove, A. L., and Antonov, B. D. (2018). Electrical Conductivity and Raman Spectra of Disperse Systems α-Al2O3–Li2CO3–Na2CO3–K2CO3–NaCl Melt. Russ. Metall. 2018, 181–185. doi:10.1134/S0036029518020246
Glossary
Latin
A constant in the ohmic resistance equations [Ω cm2]
ACell cell area [m2]
Am constant in the equilibrium function to improve the model [-]
B constant in the ohmic resistance equations [K]
C constant in the ohmic resistance equations [Ω cm2]
Cm concentration of the m-th reactant in the carbonate-hydroxide equilibrium in the melt [mol m-3]
D constant in the ohmic resistance equations [-]
E constant in the ohmic resistance equations [-]
Em equilibrium potential of the path driven by the m-th ion [V]
F Faraday’s constant [96485 s A mol-1]
Im current of the path driven by the m-th ion [A]
ITOT total cell current [A]
Jm current density of the path driven by the m-th ion [A cm-2]
JTOT total cell current density [A cm-2]
Keq carbonate-hydroxide equilibrium constant [mol m-3]
n number of electrons involved in the electrochemical reactions [-]
p pressure [atm]
Pi kinetic parameters [variable]
R gas constant [8.314 J mol-1 K-1]
Ri specific area concentration resistance of the i-th reactant [Ω cm2]
RΩ cell ohmic specific area resistance [Ω cm2]
ri generation of the i-th component [mol m-3 s-1]
T operating temperature [K]
tm transference number of the m-th anion [-]
V cell measurable voltage [V]
yi molar fraction of the i-th reactant [-]
Greeks
Keywords: molten carbonate fuel cells, carbon capture, kinetic model, dual anion mechanism, carbonate/hydroxide equilibrium, Raman spectroscopy, temperature effects
Citation: Barckholtz TA, Elsen H, Kalamaras PH, Kiss G, Rosen J, Bove D, Audasso E and Bosio B (2021) Experimental and Modeling Investigation of CO3=/OH– Equilibrium Effects on Molten Carbonate Fuel Cell Performance in Carbon Capture Applications. Front. Energy Res. 9:669761. doi: 10.3389/fenrg.2021.669761
Received: 19 February 2021; Accepted: 06 May 2021;
Published: 14 June 2021.
Edited by:
Greeshma Gadikota, Cornell University, United StatesReviewed by:
Wei Liu, Molecule Works Inc., United StatesSathiyaraj Kandhasamy, Dutch Institute for Fundamental Energy Research, Netherlands
Copyright © 2021 Barckholtz, Elsen, Kalamaras, Kiss, Rosen, Bove, Audasso and Bosio. This is an open-access article distributed under the terms of the Creative Commons Attribution License (CC BY). The use, distribution or reproduction in other forums is permitted, provided the original author(s) and the copyright owner(s) are credited and that the original publication in this journal is cited, in accordance with accepted academic practice. No use, distribution or reproduction is permitted which does not comply with these terms.
*Correspondence: Emilio Audasso, ZW1pbGlvLmF1ZGFzc29AZ21haWwuY29t