 Jinrui Cui1,2
 Yating Li3Chuan He1,2Zhi Zhang3Haichao Wang1,2
 Jiajun Tang3Yongbo Li1,2Hualin Cai1Zhenzhi Lin3,4Li Yang3*
- 1State Grid Anhui Electric Power Co., Ltd., Hefei, China
- 2Anhui Power Exchange Center Company, Hefei, China
- 3Department of Electrical Engineering, College of Electrical Engineering, Zhejiang University, Hangzhou, China
- 4Department of Electrical Engineering, College of Electrical Engineering, Shandong University, Jinan, China
In China, under the planning-market double-track mechanism implemented on the generation side of electricity, unreasonable market-oriented power generation proportion may lead to unnecessary vicious competition and market price changes, and it is against the will of power exchange (PX). Given this background, in this study, a bi-level model for planning-market electricity allocation that considers the bidding game of generation companies is proposed for a smooth transition of power system reform. In the upper level of the model, the proportion of planned electricity is optimized by PX to minimize the average social electricity purchase price. In the lower level of the model, considering the impact of market power on the bidding strategy of generation companies, the bidding strategy of generation companies set as price makers is proposed using the residual demand curve analysis method, while the price takers adopt the lowest bidding strategy. Simulations based on data from a provincial electricity market in China illustrate that the proposed model can effectively reflect the impact of market-oriented electricity proportion on market power and market-clearing price, thus providing a quantitative basis for PX to determine the proportion of market-oriented electricity in total electricity consumption.
Introduction
In China, the planning-market double-track mechanism (PMDM) is implemented for electric power system reform. Orderly deregulation of the electricity market and implementation of priority generation/utilization mechanisms can ensure stable construction of a competitive electricity market in China. Under the PMDM, the total electricity provided by the generation side is divided into planned electricity and market electricity. Planned electricity is guaranteed by the base power-supply contract signed by the power grid company (GC) and generation companies, and is settled at a regulated price. Market-oriented electricity demand is met by wholesale market transactions and settled according to market price (National Development and Reform Commission National Energy Administration, 2017). Under a given market structure, the proportion of planned electricity is the key that affects market operation and interests of market entities.
Liberalization rates of power generation and utilization plan are different with the development of the electricity market in different provinces of China, and the proportion of market-oriented electricity is determined partly according to access conditions of market entities. By the end of 2020, coal-fired and gas-fired power plants and users with a voltage level of 10 kV or higher were allowed to participate in an electricity market transaction in Guangdong, China. In Anhui province of China, users with an annual power consumption of more than 500 MWh and units with a capacity of 100 MW or higher can apply to be a market entity. Users in Shandong province of China need to meet the requirements for voltage level (i.e., 10 kV and higher) and electricity consumption (4,000 MWh and higher) if they wish to participate in market transactions. On the power generation side, coal-fired and cogeneration units are the main entities in the Shandong electricity market.
Similarly, the electricity market has been liberalized in other countries by gradually relaxing the access conditions of users. In the United Kingdon, in 1990, users with a power level of 1 MW or higher were allowed to participate in electricity market transactions. Then, in 1994, users with a power level of 100 kW or higher were allowed to participate in market transactions, while in 1998 all users were allowed to apply to be a market entity. In Texas, USA, in the second year of wholesale electricity market operation, all users were allowed to participate in the market. At present, generation companies and most power users are allowed to participate in market transactions, with no planned power generation and consumption guaranteed by the government. For example, in the United States resident users in PJM, ERCOT and NYISO are given. In the United Kingdom, the United States, and Australia, renewable energy is introduced into the wholesale electricity market through a renewable portfolio standard or contract for difference. At Nord Pool, power exchange between countries is realized through cross-border transactions (Fereidoon, 2017).
Most existing research studies have focused on the distribution and adjustment of planned electricity and market electricity in a time sequence from the perspective of a power system operator based on the fact that annual planned electricity has been determined (Li et al., 2020). An optimal allocation model of contract electricity and bidding electricity in each period of the trading day is established to minimize total power purchase cost, and it considers constraints in unit operation and network congestion by Jiang et al. (2004). An intra-day rolling generation scheduling model of a wind power system considering the uncertainty of wind power is established by Sun et al. (2020) to cooperatively optimize the target electricity and generation plan of generation units. With full consideration of the impact of power uncertainty of renewable energy, a time-sequence simulation method for monthly energy trading schedule is proposed by Zhang Q. et al. (2020). A two-stage optimization model for annual rolling generation scheduling with consideration of the influence of electric power direct trading on open and impartial dispatching is proposed by Xie et al. (2018). However, there are few research studies on the degree of liberalization of the regulated electricity market, and there is no appropriate method to determine the proportion of planned electricity to total electricity consumption. In addition, market bidding strategies of generation companies are the key to reflect the effectiveness of market rule design and parameter setting. Existing research on the bidding strategy of generation companies has based on cost analysis, market price forecast, or bidding estimation of rival generation companies (Huang and Li, 2015; De et al., 2018; Guo et al., 2021). A multi-objective joint bidding model for wind-thermal-photovoltaic hybrid generation system is established with the goal of maximizing the total profit of power and reserve markets and minimizing emissions of thermal power units, and it considers the cost of different types of units by Khaloie et al. (2020). A bidding strategy for generation companies in a sequential dual market is proposed to maximize the utility that makes a tradeoff between revenues and risks in the electricity and balancing markets by Jiang et al. (2019), and it considers the uncertainties of electricity consumption and bidding strategies of rival companies. Under the conditions of risk constraints, a two-stage bidding game model for wind power suppliers in the day-ahead and balancing markets is established by Schneider and Roozbehani (2016) and Baringo and Conejo (2016), in which the market behaviors and performance of wind power suppliers are studied from the perspective of price sensitivity. In fact, the proportion of planned electricity will affect the supply and demand of the electricity market, and then affect the market power of generation companies. However, the impact of market power on biddings of generation companies is rarely considered in the studies mentioned above.
Given this background, in this study, a bi-level planning-market electricity allocation model for the PMDM of China is established. In the upper level of the model, the proportion of planned electricity is optimized by PX to minimize the social average purchase price (SAPP). In the lower level of the model, bidding strategies for generation companies with different market power are proposed, and the bidding game process of generation companies is simulated to solve the market equilibrium. Finally, the effectiveness and rationality of the proposed model are verified by a provincial electricity market in China.
Planning-Market Electricity Allocation Problem Considering Market Power of Generation Companies
In order to support the orderly development of the social economy, the power generation side in China has been regulated by the government for a long time. Only a few direct-purchasing forward bilateral contracts are allowed between power producers and large users before the electricity market restructuring started in 2015, which accounting for a low proportion of consumption power (Zhang Z. et al., 2020). In 2017, the phased planning-market double-track mechanism was proposed by the government to guide the gradual liberalization of the power market of China. Thermal power units have been allowed to participate in the market in most of the provincial power markets, while renewable energy (mainly wind power and photovoltaics) and hydropower have been arranged by an independent system operator (ISO) to generate electricity preferentially (National Development and Reform Commission National Energy Administration, 2017). The priority power generation mechanism is implemented in China in order to ensure the consumption of renewable energy and hydropower.
A two-level market system for the national unified power market and the provincial power market is established in China to realize the optimal allocation of resources nationwide. The transaction sequence of the national unified power market, organized by Beijing Trading Center, is prior to the provincial power market. In order to implement the national strategy of power transmission from west to east and the clean energy consumption policy, cross-provincial, and cross-regional transactions are divided into the power within the government framework agreement and the market-oriented transaction (State Electricity Regulatory Commission, 2012). The implementation of the electricity quantity by cross-provincial and cross-regional trading should be guaranteed when the provincial electricity market is carried out inside the province (Lei and Song, 2016).
The allocation of planned electricity and market electricity is undertaken by PX. Before the start of the annual transaction, the annual planned electricity of thermal power producers is arranged by local PX after deduction of imported energy and priority generation energy according to the predicted annual electricity consumption. Then, total planned electricity is allocated to each unit in proportion according to its capacity (Min and Li, 2016). At present, the spot market pilot has been launched in eight provinces and cities in China. By the end of 2020, three spot market trials had been carried out in Zhejiang province. The full power bidding mode is adopted by the spot market in Zhejiang, and it draws lessons from PJM. The annual planned electricity of each unit is decomposed into each period of the bidding day by PX in advance as the minimum output. Then the residual load demand of each period is released to provide a reference for the quotation of thermal power units (Lei and Song, 2016). The trading process of the electricity market under PMDM is shown in Figure 1.
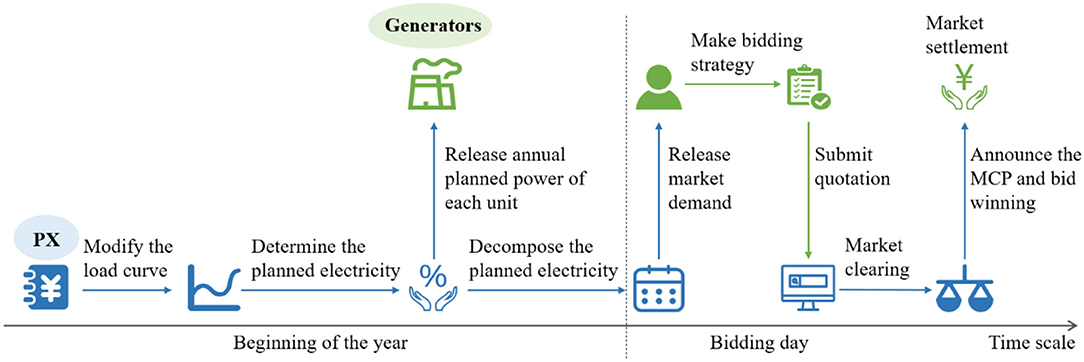
Figure 1. Electricity market transaction process.
In general, the proportion of planned electricity to total electricity consumption will affect the supply and demand of the market, and then affect the market power. As a quick case study, it is assumed that the annual total electricity consumption is 100 billion kWh and that the maximum generation quantity is 150 billion kWh. QLrepresents the total market demand, and QG represents the total market supply. A is the market supply–demand ratio, which can be calculated as A = QG/QL. As shown in Table 1, with the increase in the planned electricity proportion, the market supply–demand ratio increases, and the market power decreases.
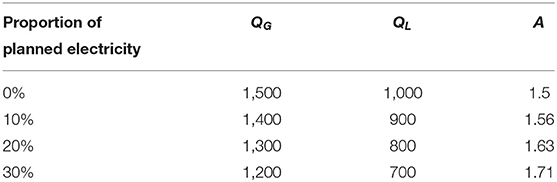
Table 1. Market supply–demand ratio under different proportions of planned electricity.
Since the first round of power system reform was carried out in 2002, the separation of power plants and power grids has been initially realized, and five power generation groups have been established in China. Due to historical reasons, there is a high concentration rate in the power generation side of China (Lei and Song, 2016). The proportion of installed capacity of thermal power producers in Zhejiang and Anhui provinces of China is shown in Figure 2. Among these producers, the installed capacity of the Zheneng group accounts for 51.1% of the total capacity of Zhejiang, and there are three generation companies whose capacity accounts for more than 15% of the total capacity in Anhui. The Herfindahl-Hirschman index (HHI) is an index reflecting market concentration. The HHI in the Zhejiang power generation market is 3,144 and that in the Anhui power generation market is 1,525; both of which are more than 1,000, indicating that the market power is high and that it is difficult to develop effective competition. In a highly concentrated market, large-capacity generation companies may use market power to raise market prices, resulting in market price distortion and social welfare losses (Bagchi et al., 2019; Hajiabadi and Samadi, 2019). It is necessary for PX to consider the market structure of the generation side when allocating planned electricity and market electricity, so as to ensure appropriate market adequacy, restrain market power, and realize full market competition (Hakam et al., 2020).
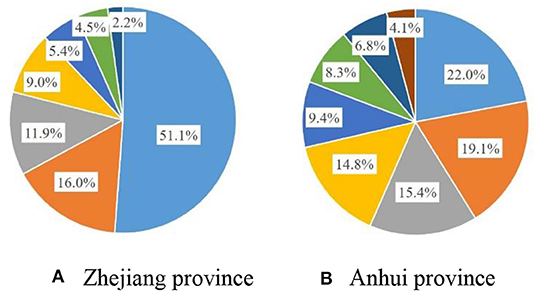
Figure 2. Structure of installed generator. (A) Zhejiang province; (B) Anhui province.
Planning-Market Electricity Allocation Model of PX
The equivalent load demand, i.e., the total amount of planned electricity and market electricity, is obtained by deduction of imported energy and priority generation energy based on annual total electricity consumption. The priority generation energy mainly includes renewable energy and hydropower energy. Wind power and photovoltaics fluctuate randomly (Liu et al., 2020; Xing et al., 2021). The output of hydropower plants and pumped storage plants are adjustable and are pre-dispatched by ISO considering the demand of peak load cutting and valley load filling. Among them, hydropower plants are flexible in start-up and shut-down and low in start-up costs and are usually arranged by ISO during peak load period to ease the tension in power generation. Pumped storage plants are in the power generation state in peak load period and load state in low load period, which can reduce load peak valley difference (Fekete et al., 2019; Song et al., 2020).
The equivalent load duration curve after deduction of the imported energy and priority generation energy is shown in Figure 3. Due to limitation in reservoir capacity and unit rated power, power and energy constraints of hydropower and pumped storage plants can be expressed as (Hu et al., 2021).
where PH(s, t) and PP(s, t) represent the output of hydropower plant and pumped storage plant, respectively, in period t under scenario s. and represent the maximum output of hydropower plant and pumped storage plant, respectively. and represent the maximum storage energy for hydropower plants and pumped storage plants, respectively. Tp and Tv are the peak and valley time sets, respectively.

Figure 3. Equivalent load duration curve.
At present, the power market in China is similar to the pool mode, and there is no awareness in market bidding on the demand side. In this study, the load curve is considered to be inelastic, i.e., the load curve does not change with a change in market price. The load curve is modified according to imported energy and priority generation energy, and the equivalent load curve Leq(s, t) is obtained, which is expressed as
where L(s, t) denotes the load in period t under scenario s. PR(s, t) and PI(s, t) are the output of renewable energy and imported electricity in period t under scenario s, respectively.
Equivalent load demand is divided into planned electricity and market electricity by PX. The decision variable of PX is the proportion of planned electricity γ, and the objective function is to minimize SAPP . Therefore, the optimal decision model of PX can be expressed as
where Qeq is the equivalent load demand after deduction of imported energy and priority generation energy. λP denotes the settlement price of planned electricity. λM(s, t) represents the market clearing price (MCP) in period t under scenario s. indicates the winning bid of unit i in period t under scenario s. Ns is the number of days of scenario s in a year. ΩM, s, t denotes the set of all winning units in period t under scenario s. γmax is the upper limit of planned electricity proportion.
Annual planned electricity is distributed to each unit in proportion according to unit capacity. Let represent the total annual planned electricity of unit i and be expressed as
where is the rated capacity of unit i. hi represents the annual utilization hours of unit i. Ω denotes the set of all thermal power units.
The total annual planned electricity is decomposed into each period of the bidding day by PX in advance through the deterministic power decomposition algorithm based on the typical daily load curve. Then, the planned power of each unit in different periods is obtained in proportion (Chen et al., 2009) and can be expressed as:
where βd,t is the proportion of electricity consumption in period t of day d to annual electricity consumption and can be calculated from the typical daily load curve.
In the centralized market, PX receives the quotation of each generation company and determines the winning bid of each generation company through the specified market-clearing algorithm. The goal of market clearing is to minimize the total generation cost and determine a unified market-clearing price for all generation companies (Yang et al., 2019; Zhang and Yan, 2019). Without considering network constraints, the optimal model of market-clearing can be expressed as (Faraji et al., 2020).
where ρi(s, t) is the bidding price of unit i in period t under scenario s. ΩM denotes the set of units participating in the bidding. When multiple units are marginal and offer the same price, the amount of electricity is allocated according to the bidding capacity of the units (Guo et al., 2019).
Bidding Game Model of Generation Companies Considering Market Power
Price Makers and Price Takers
Among the generation companies in the electricity market, some large ones have the ability to raise the MCP because of their strong market power, and they are defined as price makers. The others are regarded as price takers (Ilak et al., 2014). Price makers often make bidding strategies with the goal of maximizing revenue, while price takers often choose cost-based bidding strategies to ensure generation (Nieta et al., 2014; Shafie-khah et al., 2015).
Must run ratio (MRR) is a kind of prior evaluation index to measure the market power, which considers the impact of market supply and demand, and can evaluate the market power of a single generation company (Lei and Song, 2016). Therefore, in this study, MRR is used to define whether a generation company is a price maker or a price taker. Assuming that there are J generation companies in the market and all the competitors of generation company j are recorded as , Mj(s, t) is let to represent the MRR of generation company jin period t under scenario s and can be expressed as
The greater Mj is, the more likely generation company j is to exercise market power (Lei and Song, 2016). In this study, the generation company that satisfies Mj > 0 is selected as the price maker.
Bidding Strategies of Price Takers Based on the Lowest Bidding Price
In the centralized market, generation companies are required to declare a minimum output, a price and a capacity for each unit. The minimum output is the output of the unit to meet the planned power and is provided at zero price to ensure that power is dispatched but settled at the planned power price λP. The bidding price ρi(s, t) of the unit should be less than the upper limit of the market price .
The lowest bidding price varies with the power generation cost of each unit. Unit cost includes fuel cost, which is measured by the marginal cost CM,i of the unit and fixed cost CF, i, which consists of investment cost CI, i and operation and maintenance cost CO,i. In order to include the fixed cost in the bidding price, it is necessary to convert the multi-year and annual fixed costs into hourly fixed cost, whose conversion formula is
where iy is the annual interest rate, and ih is the hourly interest rate. Yi is the lifetime of unit i, and Yh = 8760 h.
In conclusion, the lowest bidding price of unit i is:
Bidding Strategies of Price Makers Based on the Residual Demand Curve
Residual demand curve (RDC) refers to the demand curve faced by a specific generation company in the competitive electricity market, and it can be calculated by subtracting the bidding curves of all competitors of the company from the total demand curve. The bidding strategies of generation companies acting as price markers are based on RDC (Bompard et al., 2008).
In this study, the single period bidding problem of generation companies is analyzed, and there is no correlation among the biddings of different periods. The profit of generation company j in period t is equal to the income of planned electricity and market electricity minus generation cost. The goal of strategic bidding is to maximize profit Fj(s, t), and the bidding optimization problem can be described as
where Ci(s, t) is the fuel cost of unit i in period t under scenario s. and represent the minimum and maximum technological outputs of the unit, respectively.
In the electricity market, large-capacity generation companies can exercise their market power through capacity gaming or price gaming (Wang et al., 2016; Tong et al., 2019). In this study, the price game model is used to solve the optimal bidding strategy for price makers by exploring their RDC (Bompard et al., 2008). As shown in Figure 4, the blue curve is the RDC of the generation company j, and the red curve is the quotation curve of all units of the generation company j according to the lowest bidding price. The points with discontinuous slope (points A and B) are proved to be potential best biddings of price makers (Bompard et al., 2008). Generation company j starts from the highest bidding benchmark (point A) and then goes down to the intersection (point C) of the lowest bidding price curve and the RDC to find the point to maximize its profit. For example, when a generation company chooses point B as the bidding benchmark, its units whose cost is lower than B will be quoted at the price of B, and units whose cost is higher than B will be quoted at the lowest bidding price.
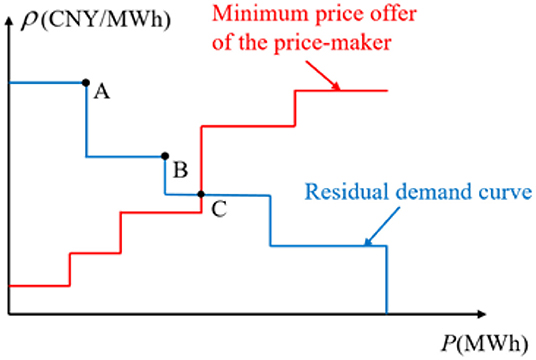
Figure 4. RDC and the lowest bidding price curve.
The solution steps of generation companies bidding game model considering market power can be summarized as follows; and for ease of understanding, a flow chart for solving the proposed model is shown in Figure 5.
1) The set of price makers Ψ(s, t) in a specific period is determined by calculating the market power of each generation company.
2) We initialize the bidding strategy of each generation company to the lowest bidding price of each unit. The biddings of price takers remain unchanged.
3) For each price maker j ∈ Ψ(s, t), it is assumed that the price quoted by its competitor is the result of the last iteration, and the RDC of price maker j is calculated.
4) The optimal bidding strategy of price maker j is determined based on its RDC considering the cost of each unit.
5) We judge whether the market is in equilibrium. If no price maker wants to change the bidding strategies or the number of iterations exceeds the maximum limit, it ends. If not, return to step 3.
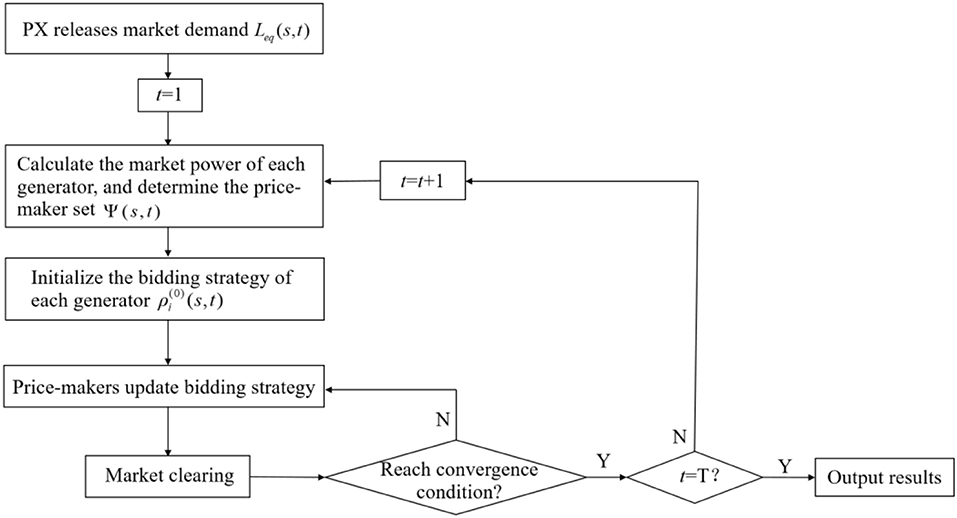
Figure 5. Flow chart for solving generation companies bidding game model.
Case Studies
In this study, the actual power market data of a province in China are used to demonstrate the proposed model. The settlement price of planned electricity λP is 360 CNY/MWh, and the market price cap is 450 CNY/MWh. The unit capacity and cost information of each generation group are shown in Table 2. The maximum unit technical output is 1, and the maximum unit technical output is 0.3. According to the typical load curve of the province and the output of imported energy, renewable energy and hydropower, the typical daily equivalent load curve is obtained and shown in Figure 6, with the probability of typical scenarios. By solving the proposed model, it is found that the optimal proportion of planned electricity is 0.4, the minimum SAPP is 334 CNY/MWh, and the average MCP () is 310 CNY/MWh.
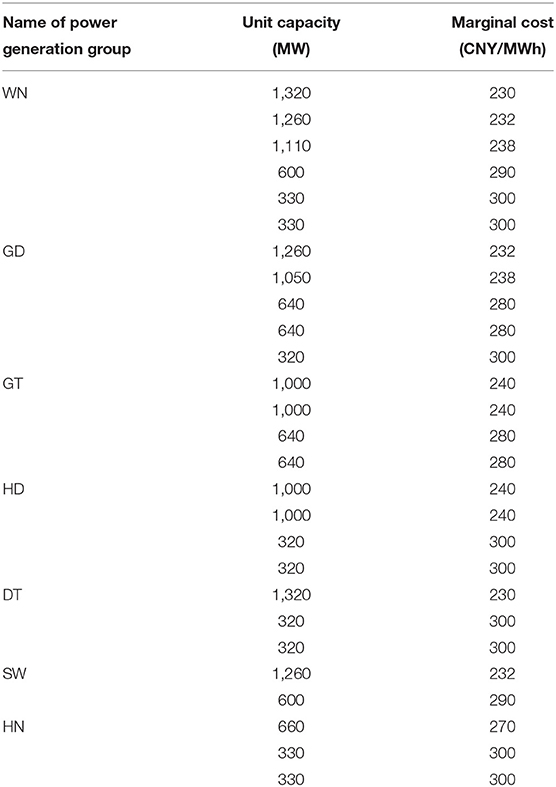
Table 2. Unit capacity and cost of power generation groups.
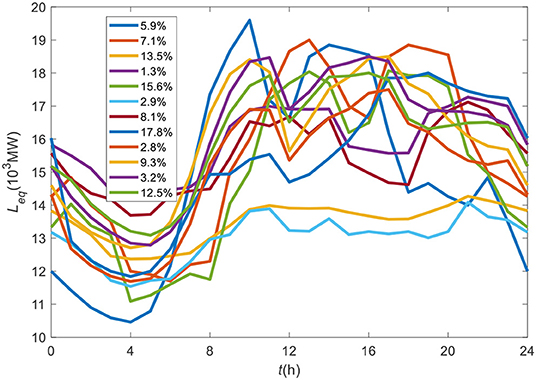
Figure 6. Typical daily equivalent load curve and scenario probability.
Impacts of the Proportion of Planned Electricity on MCP and Market Power
As shown in Figure 7, decreases when γ increases. This implies that when the proportion of planned electricity increases, the generation adequacy in the market increases and the market power of generation companies becomes lesser, and that the companies tend to quote according to cost, so the MCP decreases. First, decreases and then increases when γ increases. When the proportion of planned electricity increases, the purchasing cost of planned electricity increases, while that of market electricity decreases due to the decrease in market electricity quantity and MCP. Under the combined effect of the two, first, the SAPP decreases and then increases, and there is a minimum value.
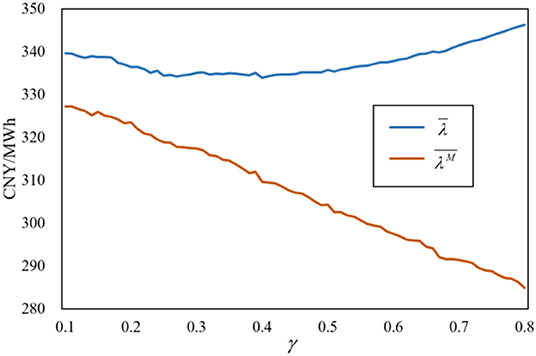
Figure 7. SAPP and MCP under different proportions of planned electricity.
The number of price makers in each period under different proportions of planned electricity is shown in Figure 8. When γ = 0.3, the period without price makers accounted for 27.4%, and the period with 7 price makers accounted for 32.1%, in which there is great market power in the market. When γ = 0.6, the proportion of time periods without price makers increased from 27.4 to 55.4%, and the number of price makers also decreased in other periods. This implies that the higher the proportion of planned electricity, the lesser the number of price makers in the market and the lesser the market power.
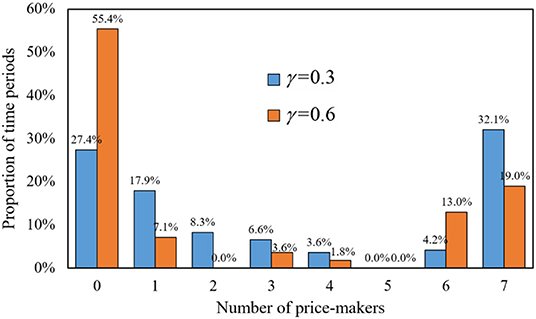
Figure 8. The number of price makers under different proportions of planned electricity.
Impacts of the Load Level on MCP and Market Power
Under the conditions of constant power generation, different load levels mean different market demands and generation adequacy. Therefore, the load level will also affect the market power of generation companies. The MCP and market power of a typical day with a different proportion of planned electricity is shown in Figure 9, where is the average value of the MRR of seven generation companies. It can be seen from Figure 9 that when γ = 0.3, is positive from 8:00 to 17:00, while when γ = 0.6, there are only 6 periods of 9:00–10:00 and 13:00–16:00, in which market power exists and the value of is lesser. When γ = 0.3 for 9:00–10:00 and 14:00–15:00, and γ = 0.6 for 10:00, is above 0.3; and the MCP reaches the market price cap. In the period of , all generation companies in the market are price takers and quote according to the lowest bidding price, so the MCP is lower.
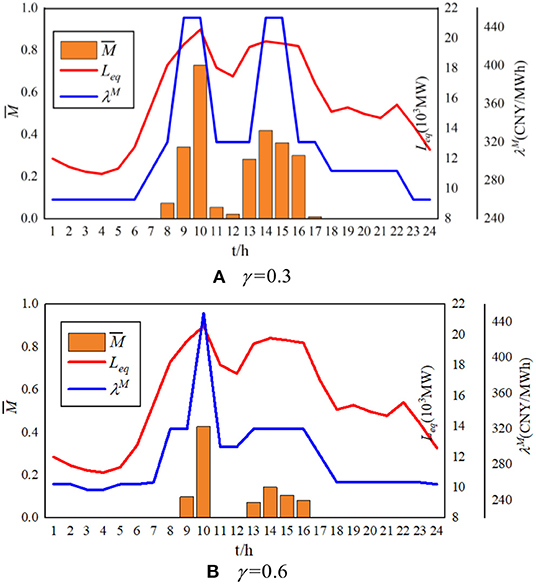
Figure 9. MCP and market power on a typical day. (A) γ = 0.3; (B) γ = 0.6.
It can also be seen from Figure 9 that and λM vary in different periods, and they are both high in peak load period no matter what γ is. In peak load periods, more units with high costs and high quotations win the bid because of the high load. At the same time, market generation adequacy is low and the market power of generation companies is high, which lead to high MCP due to the bidding strategies of price takers. In contrast, the market generation adequacy is high in low load periods, so the MCP is low.
We let be the average MRR of seven generation companies in all periods under the optimal proportion of planned electricity. and are the average MCP and SAPP, respectively, in all periods under the optimal proportion of planned electricity. It can be seen in Table 3 that a higher proportion of planned electricity is required to cope with the increased load growth rate, so as to ensure minimum SAPP. When the load growth rate increases, and become higher. This implies that under the conditions of the unchanged generation structure, the load growth causes the generation capacity to be tenser, which leads to higher MCP and further causes an increase in .
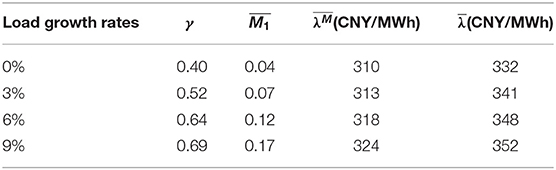
Table 3. Optimal proportion of planned electricity under different load growth rates.
Profit of Generation Companies Under Different Bidding Strategies
The profit of seven generation companies (namely, WN, GD, GT, HD, DT, SW, and HN) under different bidding strategies are shown in Table 4. Compared with cost-based bidding, when strategy-based bidding is adopted, the profit of all generation companies increases by more than 2%. Among them, the growth rate of WN is the highest, i.e., 7%, and the profit increases from 10.06 to 10.82 million CNY. At the same time, has increased from 306 to 310 CNY/MWh. Under the settlement mode of unified clearing price, although price takers have no ability to raise the price, their profit will also increase.
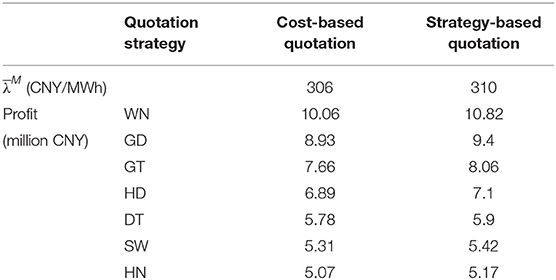
Table 4. Profit of generation companies and MCP.
At a certain period, WN and GD are price makers; and GT, HD, DT, SW, and HN are price takers. The bidding curve of WN under different bidding strategies is shown in Figure 10. When WN bids according to the lowest bidding price, the bidding curve is divided into six segments according to the different costs of each unit, and the planned electricity (1,823 MWh) is quoted at 0 CNY/MWh. When adopting strategy-based bidding, the bidding curve of WN is only divided into three segments, which are quoted at 0, 310, and 320 CNY/MWh, respectively. Among the six units of WN, the bidding price of four units is higher than the lowest bidding price, which indicates that WN has made use of market power to increase MCP to 310 CNY/MWh, thus obtaining more profits.
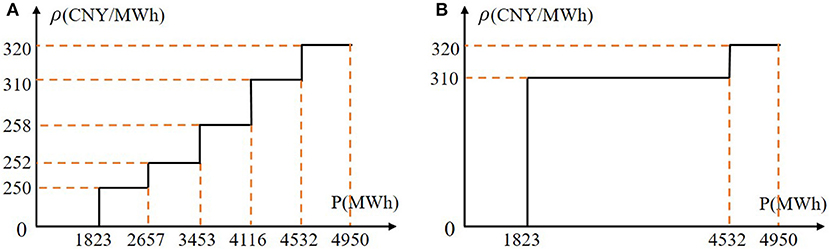
Figure 10. Bidding curve of WN under different bidding strategies. (A) Cost-based bidding; (B) strategy-based bidding.
Conclusion
In this study, a planning-market electricity allocation model is established, and it considers the objectives of minimizing electricity purchase price for PX and maximizing profits for generation companies. Bidding strategies for price makers and price takers are proposed considering the market power of generation companies. The game process of generation companies is simulated, and the MCP and the optimal bidding strategy of each generation company in the market equilibrium state are obtained. The proposed model is demonstrated in the case of a provincial electricity market in China, and the main findings are as follows:
1) The proportion of planned electricity affects the market power of generation companies, and it further affects MCP. The higher the proportion, the lesser the market power and the lower the MCP. In addition, PX should comprehensively consider market power and power purchasing cost when determining the proportion of planned electricity.
2) The level of load affects the market power of generation companies and the optimal proportion of planned electricity. Under the conditions of unchanged generation structure, with the growth in future load, PX should gradually increase the proportion of planned electricity.
3) The bidding strategy that price makers adopt to pursue profit maximization will lead to an increase in MCP. At this time, more profits can also be obtained when price takers bid based on cost.
In this study, the allocation of planned electricity and market electricity in China is analyzed under the PMDM. In the future, the convergence of the market in different stages considering the requirements of orderly releasing the plan of power generation and power utilization can be studied. In addition, with the deepening reform on the electricity sale side, the impact of electricity demand elasticity on the bidding strategy of generation companies can also be considered.
Data Availability Statement
The original contributions presented in the study are included in the article/supplementary material, further inquiries can be directed to the corresponding author/s.
Author Contributions
JC, LY, and ZL conceptualized the study. YaL, CH, and ZZ performed the analysis. YaL, HW, and JT performed investigations. YoL and HC acquired resources. JC, CH, HW, YoL, and HC acquired funding. JC wrote the original draft. YaL, ZZ, and ZL reviewed and edited the manuscript. All authors agreed to be accountable for the content of the work.
Funding
This study was supported by the National Key R&D Program of China (No. 2016YFB0901100) and the Science and Technology Program of State Grid Zhejiang Electric Power Co., Ltd. (No. B31200200006).
Conflict of Interest
JC, CH, HW, and YoL were employed by State Grid Anhui Electric Power Co., Ltd. and Anhui Power Exchange Center Company. HC was employed by State Grid Anhui Electric Power Co.
The remaining authors declare that the research was conducted in the absence of any commercial or financial relationships that could be construed as a potential conflict of interest.
References
Bagchi, A., Goel, L., and Wang, P. (2019). Adequacy assessment of generating systems incorporating storage integrated virtual power plants. IEEE Trans. Smart Grid 10, 3440–3451. doi: 10.1109/TSG.2018.2827107
Baringo, L., and Conejo, A. J. (2016). Offering strategy of wind-power producer: a multi-stage risk-constrained approach. IEEE Trans. Power Syst. 31, 1420–1429. doi: 10.1109/TPWRS.2015.2411332
Bompard, E., Carpaneto, E., Ciwei, G., Napoli, R., Benini, M., Gallanti, M., et al. (2008). A game theory simulator for assessing the performances of competitive electricity markets. Electric Power Syst. Res. 78, 217–227. doi: 10.1016/j.epsr.2007.02.007
Chen, J., Yang, L., Zhang, N., Dai, T., and Gan, D. (2009). Decomposition of contract for difference based on generation companies declaration. Autom. Electric Power Syst. 33, 30–34. doi: 10.7500/AEPS200807079
De, G., Tan, Z., Li, M., Huang, L., and Song, X. (2018). Two-Stage stochastic optimization for the strategic bidding of a generation company considering wind power uncertainty. Energies 11:3527. doi: 10.3390/en11123527
Faraji, J., Abazari, A., Babaei, M., Muyeen, S. M., and Benbouzid, M. (2020). Day-ahead optimization of prosumer considering battery depreciation and weather prediction for renewable energy sources. Appl. Sci. 10:2774. doi: 10.3390/app10082774
Fekete, K., Nikolovski, S., Klaić, Z., and Androjić, A. (2019). Optimal re-dispatching of cascaded hydropower plants using quadratic programming and chance-constrained programming. Energies 12:1604. doi: 10.3390/en12091604
Fereidoon, P. (2017). Evolution of Global Electricity Markets: New Paradigms, New Challenges, New Approaches. Beijing: China Machine Press.
Guo, H., Chen, Q., Xia, Q., and Kang, C. (2019). Market power mitigation clearing mechanism based on constrained bidding capacities. IEEE Trans. Power Syst. 34, 4817–4827. doi: 10.1109/TPWRS.2019.2913334
Guo, L., Ding, Y., Bao, M., and Zeng, D. (2021). A bi-level model for the bidding strategy of an inter-regional electricity trading aggregator considering reliability requirements and transmission losses. IEEE Access 9, 13476–13487. doi: 10.1109/ACCESS.2021.3051654
Hajiabadi, M. E., and Samadi, M. (2019). Locational marginal price share: a new structural market power index. J. Mod. Power Syst. Clean Energy 7, 1709–1720. doi: 10.1007/s40565-019-0532-7
Hakam, D. F., Wiyono, S. K., and Hariyanto, N. (2020). Competition in power generation: ex-ante analysis of indonesia's electricity market. Energies 13:6741. doi: 10.3390/en13246741
Hu, S., Xiang, Y., Li, J., and Liu, J. (2021). A two-stage dispatching method for a wind-hydropower-pumped storage integrated energy system. Front. Energy Res. 9:646975. doi: 10.3389/fenrg.2021.646975
Huang, H., and Li, F. (2015). Bidding strategy for wind generation considering conventional generation and transmission constraints. J. Mod. Power Syst. Clean Energy. 3, 51–62. doi: 10.1007/s40565-015-0100-8
Ilak, P., Krajcar, S., Rajšl, I., and Delimar, M. (2014). Pricing energy and ancillary services in a day-ahead market for a price taker hydro generating company using a risk-constrained approach. Energies 7, 2317–2342. doi: 10.3390/en7042317
Jiang, D., Liu, X., and Li, Q. (2004). Economically distributing strategies for daily generation scheduling in a power system under power market environment. Proc. CSEE 24, 90–94. doi: 10.13334/j.0258-8013.pcsee.2004.07.017
Jiang, Y., Hou, J., Lin, Z., Wen, F., Li, J., He, C., et al. (2019). Optimal bidding strategy for a power producer under monthly pre-listing balancing mechanism in actual sequential energy dual-market in China. IEEE Access 7, 70986–70998. doi: 10.1109/ACCESS.2019.2919347
Khaloie, H., Abdollahi, A., Shafie-Khah, M., Siano, P., Nojavan, S., Anvari-Moghaddam, A., et al. (2020). Co-optimized bidding strategy of an integrated wind-thermal-photovoltaic system in deregulated electricity market under uncertainties. J. Clean. Prod. 242:118434. doi: 10.1016/j.jclepro.2019.118434
Lei, G., and Song, X. (2016). “Provincial electricity market orderly operating evaluation model adapting to the new round of electricity reform requirements,” in Conference Papers. China International Conference on Electricity Distribution (Xian: IEEE).
Li, P., Fan, Y., Huang, Y., Sun, Y., Wang, W., and Liu, C. (2020). Monthly generation scheduling method of renewable energy power system based on power plant aggregation and decomposition models. Power Syst. Technol. 44, 3281–3293. doi: 10.13335/j.1000-3673.pst.2020.0509
Liu, W., Zhang, X., Wu, Y., and Feng, S. (2020). Economic analysis of renewable energy in the electricity marketization framework: a case study in Guangdong, China. Front. Energy Res. 8:98. doi: 10.3389/fenrg.2020.00098
Min, W., and Li, X. (2016). “An efficient pricing mechanism of the inter-area electricity market based on the special transforming period in China,” in Conference Papers. China International Conference on Electricity Distribution (Xian: IEEE).
National Development and Reform Commission National Energy Administration (2017). Notice on Orderly Releasing Plans of Power Generation and Power Utilization. Available online at: https://www.ndrc.gov.cn/fzggw/jgsj/yxj/sjdt/201704/t20170410_986939.html (accessed February 26, 2021).
Nieta, A. A. S., Contreras, J., Munoz, J. I., and O'Malley, M. (2014). Modeling the impact of a wind power producer as a price maker. IEEE Trans. Power Syst. 29, 2723–2732. doi: 10.1109/TPWRS.2014.2313960
Schneider, I., and Roozbehani, M. (2016). Energy market design for renewable resources: imbalance settlements and efficiency–robustness tradeoffs. IEEE Trans. Power Syst. 33, 3757–3767. doi: 10.1109/TPWRS.2017.2782638
Shafie-khah, M., Heydarian-Forushani, E., Golshan, M. E. H., Moghaddam, M. P., Sheikh-El-Eslami, M. K., and Catalao, J. P. S. (2015). Strategic offering for a price maker wind power producer in oligopoly markets considering demand response exchange. IEEE Trans. Ind. Inform. 11, 1542–1553. doi: 10.1109/TII.2015.2472339
Song, X., Lin, C., Zhang, R., Jiang, T., and Chen, H. (2020). Two-stage stochastic scheduling of integrated electricity and natural gas systems considering ramping costs with power-to-gas storage and wind power. Front. Energy Res. 8:596774. doi: 10.3389/fenrg.2020.596774
State Electricity Regulatory Commission (2012). Basic Rules for Inter Provincial and Inter Regional Electric Energy Trading (Trial). Policy. Available online at: http://www.law-lib.com/law/law_view.asp?id=404865 (accessed February 26, 2021).
Sun, L., Zhang, N., Li, N., Liu, X., and Li, W. (2020). An intra-day rolling scheduling considering energy equity based on gini coefficient. Power Syst. Technol. 44, 340–347. doi: 10.13335/j.1000-3673.pst.2019.1459
Tong, X., Hu, C., Zheng, C., Rui, T., Wang, B., and Shen, W. (2019). Energy market management for distribution network with a multi-microgrid system: a dynamic game approach. Appl. Sci. 9:5436. doi: 10.3390/app9245436
Wang, Y., Ai, X., Tan, Z., Yan, L., and Liu, S. (2016). Interactive dispatch modes and bidding strategy of multiple virtual power plants based on demand response and game theory. IEEE Trans. Smart Grid. 7, 510–519. doi: 10.1109/TSG.2015.2409121
Xie, B., Yang, X., Yu, Z., Luo, G., and Guo, R. (2018). Two-stage optimization model for annual rolling generation scheduling considering open and impartial dispatching. Electr. Power Autom. Equip. 38, 155–161. doi: 10.16081/j.issn.1006-6047.2018.12.023
Xing, Q., Cheng, M., Liu, S., Xiang, Q., Xie, H., and Chen, T. (2021). Multi-objective optimization and dispatch of distributed energy resources for renewable power utilization considering market mechanism. Front. Energy Res. 9:647199. doi: 10.3389/fenrg.2021.647199
Yang, J., Tan, Z., Pu, D., Pu, L., Tan, C., and Guo, H. (2019). Robust optimization model for energy purchase and sale of electric–gas interconnection system in multi-energy market. Appl. Sci. 9:5497. doi: 10.3390/app9245497
Zhang, C., and Yan, W. (2019). Spot market mechanism design for the electricity market in china considering the impact of a contract market. Energies 12:1064. doi: 10.3390/en12061064
Zhang, Q., Sun, L., Shen, J., Li, P., and Li, W. (2020). Four-stage modeling of monthty energy trading schedule considering fairness of power scheduling progress. Autom. Electr. Power Syst. 44, 101–110. doi: 10.7500/AEPS20191219006
Keywords: planning-market double-track mechanism, electricity allocation, market power, residual demand curve, bidding game
Citation: Cui J, Li Y, He C, Zhang Z, Wang H, Tang J, Li Y, Cai H, Lin Z and Yang L (2021) Optimal Electricity Allocation Model Under China's Planning-Market Double-Track Mechanism Considering Bidding Game of Generation Companies. Front. Energy Res. 9:673228. doi: 10.3389/fenrg.2021.673228
Received: 27 February 2021; Accepted: 12 April 2021;
Published: 07 May 2021.
Edited by:
Yingjun Wu, Hohai University, ChinaReviewed by:
Jiajia Yang, University of New South Wales, AustraliaQin Wang, Electric Power Research Institute (EPRI), United States
Copyright © 2021 Cui, Li, He, Zhang, Wang, Tang, Li, Cai, Lin and Yang. This is an open-access article distributed under the terms of the Creative Commons Attribution License (CC BY). The use, distribution or reproduction in other forums is permitted, provided the original author(s) and the copyright owner(s) are credited and that the original publication in this journal is cited, in accordance with accepted academic practice. No use, distribution or reproduction is permitted which does not comply with these terms.
*Correspondence: Li Yang, ZWV5YW5nbGlAemp1LmVkdS5jbg==