 Xinrui Liu
 Xinying Zhao
- Department of Electrical Engineering, College of Information Science and Engineering, Northeastern University, Shenyang, China
Under the background of the “double high” power system, the electricity heat hydrogen system (EHHS) plays a significant role in the process of energy decarbonization. In order to meet the different optimization objectives of the system under different new energy consumption states, a new energy consumption potential assessment and optimized operation method based on intuitionistic fuzzy rough set theory is proposed. By using the intuitionistic fuzzy rough set theory, the continuous attribute data is divided into different levels and the results of its membership and non-membership are gotten at different levels. The membership results of real-time consumption data are matched with the rule sets, and then the system consumption state judgment result is obtained. In this article, the system consumption situation is divided into five states, and compared with the traditional division method, so the system state can be described more comprehensively. At the same time, the fuzzy set is used to deal with the ambiguity of the boundary between each state. The intuition theory is used to solve the problem of the uncertainty of the consumption state, and then the accurate judgment can be realized. In response to different consumption states, an optimal scheduling model is established in which a hydrogen heat energy system (HHES) is involved to meet different requirements, and a hybrid particle swarm optimization algorithm is used to solve the model. Adopting the IEEE-30 bus system as the network structure of EHHS in the simulation, the analysis shows that the dynamic state division method based on intuitionistic fuzzy rough set theory can better be used to judge the system state according to real-time variable factors. The system optimization based on the consumption state division has the advantages of improving the operating economy and increasing the consumption of new energy.
Introduction
Due to the significant advantages of new energy, the development of wind power technology is the key direction of new energy technology in China. The output of wind power and other new energy is random and volatile, and large-scale consumption has always been a worldwide problem. The consumption of new energy is facing greater challenges due to the problems of resource scheduling mechanisms and government subsidies (Shu et al., 2017). In recent years, the new energy industry has been developing rapidly. In view of the random interference problem of new energy, a variety of strategies have been proposed to solve the existing problems in the consumption (Xi et al., 2019, 2020). However, due to the limitation of consumption capacity in some areas, large abandonment has occurred in new energy’s operation, which has affected the benefits, and whether new energy can be effectively utilized has become an urgent problem to be solved.
Many experts and scholars have carried out a lot of research work on the issue of new energy consumption. There have been studies to configure energy storage to solve the problem of new energy consumption, including electric energy storage, heat storage device, etc. In Diao et al. (2020), the complementary and coordinated relationship between energy and energy storage in the scenarios of consuming new energy and electric load peak shaving was analyzed. An integrated energy system optimization dispatch model was established to improve the capacity of new energy consumption. In Sun et al. (2019), a hierarchical dispatch framework was proposed, and wind power was consumed by dispatching electricity and heat in a cogeneration system with heat energy storage. In Chen X. et al. (2020), the coordination of power supply and heat sources was analyzed when the electric load is low during the heating period. On the premise of ensuring the maximum amount of wind power to accept and taking the lowest total operating cost as the scheduling optimization goal, a multi-source coordinated scheduling strategy was formulated. In Yang et al. (2020), the coordinated heating strategy between the electric boiler and the heat storage device was studied, and a low-carbon economic dispatching model for wind power consumption was established. In Zhou et al. (2020), the electric heat flexible load was used to further enhance the wind power consumption capacity of the system based on the flexible conversion of the source side. In Zhang Y. et al. (2020), a coordinated and optimal dispatching model of the integrated electric heat system was established, including the electric storage, the low-pressure cylinder removal, the heat storage, and the electric boiler. The rules of single operation and cooperative operation of the equipment in the above model are analyzed. The above research all studied the aspects of electric boilers with heat storage and electric storage equipment, but researchers seldom considered that electric storage equipment cannot meet the regulation requirements of the system. Therefore, the operating level of the system was still low. In Zhang et al. (2018), a two-layer optimal dispatching model of a power-natural gas integrated energy system was proposed, which considered the rational utilization of abandoned wind power by power-to-gas, and it was proved that power-to-gas could effectively improve the wind power consumption capacity through the analysis of the simulation. In Teng et al. (2019b), a coordinated optimization model of electricity heat hydrogen storage system was proposed which was more flexible and economic in grid regulation. Furthermore, it could be used to replace the battery energy storage system.
In addition to the research in the above literature, the previous optimizations were carried out with the goal of maximizing system consumption or minimizing operating cost, which did not consider the specific state of new energy fluctuations in different periods. In Yang et al. (2018), the conclusion showed that it was not appropriate to use the unified optimization method when dealing with the optimization of an integrated energy system. In Wu D. et al. (2019), the consumption method of wind power segmentation compensation was proposed, which divided the quality of wind power according to the balance cost and explored the value of peak shaving generators’ contribution to the grid-connected wind power. The targeted solution model in different segments was established to promote the consumption of wind power effectively. In Ge et al. (2019), the power system was divided into normal state, alert state, and emergency state according to the amount of wind curtailment and its change trend. A staged optimal dispatch model of source-load-storage in different states was established.
This article uses intuition theory (Zhang et al., 2019; Zhan and Sun, 2020) to deal with uncertain information. The unclear boundaries of continuous data were overcome by combining with the ability of fuzzy sets (Li et al., 2020; Wei et al., 2020; Zhang P. et al., 2020). A state division method based on the consumption state of new energy is proposed. The reduction algorithm (Kumar and Prasad, 2020) is used to deal with uncertain information and massive data. Meanwhile, considering the actual situation of each consumption state and the characteristics of each optimizing adjustment equipment, a hydrogen heat energy system (HHES) including electric-hydrogen conversion, hydrogen storage, heat storage, microturbine cogeneration, and electric boiler is used in the EHHS under different consumption states to optimize and adjust.
The main innovations of this article are as follows: (1) The dynamic division method of new energy consumption state is established by using intuitionistic fuzzy rough set theory; (2) Considering the shortcomings of traditional energy storage devices and the advantages of clean hydrogen energy (Sun, 2021),the electric-to-hydrogen equipment is used in the EHHS, which combined with microturbine cogeneration and electric boiler to form the HHES to adjust the system; (3) Based on the division of the system consumption state, specific optimization goals are set to meet the actual needs in different states.
Electricity Heat Hydrogen System
In this article, an EHHS is constructed, which is composed of thermal power units, wind power units, cogeneration units, and the HHES. Figure 1 shows the overall structure of the EHHS.

Figure 1. Electricity heat hydrogen system (EHHS) structure diagram.
The HHES is composed of five parts, which are electrolytic hydrogen unit (EHU), microturbine cogeneration unit (MCU), hydrogen storage unit (HSU), electric boiler unit (EBU) and thermal storage unit (TSU) (Teng et al., 2019a).
The energy conversion and storage relations in the HHES are as follows:
Where, Pdj,H is the hydrogen production power of the EHU. Pdg,T is the heating power of EBU. ηdj,ηdg are the energy conversion efficiency of electricity to gas and electricity to heat. PEd,in, PEg,in are the input electric power of the EHU and the input electric power of the EBU.
Where, SH(t), ST(t) are the hydrogen storage and the heat storage states. WH(t−1), WT(t−1) are the hydrogen storage and heat storage of the HSU and TSU in t-1 period. Psr,H(t), Psr,T(t) are the input energy for HSU and TSU. ηsr,H, ηsr,T are the energy input efficiency of the hydrogen and heat storage equipment. Psc,H(t), Psc,T(t) are the output energy of HSU and TSU. ηsc,H, ηsc,T are the output efficiency of HSU and TSU. WH,max, WT,max are the maximum storage capacity of HSU and TSU.
Where, Pwr,E, Pwr,T are the electrical and thermal power output of the MCU. ηwr,E, ηwr,T are the hydrogen power transfer and heat transfer efficiency of the MCU.
Power System Operation State Division Based on the Level of New Energy Consumption
Basis and Principles of System Operating State Division
Imitating the power system will have different operating states under different operating conditions. In previous studies, the power system was divided into three states which are normal state, alert state, and emergency state according to the amount of abandoned wind power (Ge et al., 2019), but in fact, it is inaccurate to delineate the consumption state by the amount of abandoned wind power, and the method dividing into three states cannot fully show the consumption state of the EHHS. Since the fuzzy boundary between each state needs to be considered when dividing, the problem of control failure caused by the inaccuracy of the original division requires the use of intuitionistic fuzzy rough set (Pawlak, 1982; Chen Y. et al., 2020) to solve. Combining the adjustment capabilities of each unit in the HHES and the amount of unconsumed wind power, the EHHS is divided into five states: very suitable (VS), moderately suitable (MS), generally suitable or unsuitable (GSU), moderately unsuitable (MU) and very unsuitable for consumption (VU). The division result is shown in Figure 2.
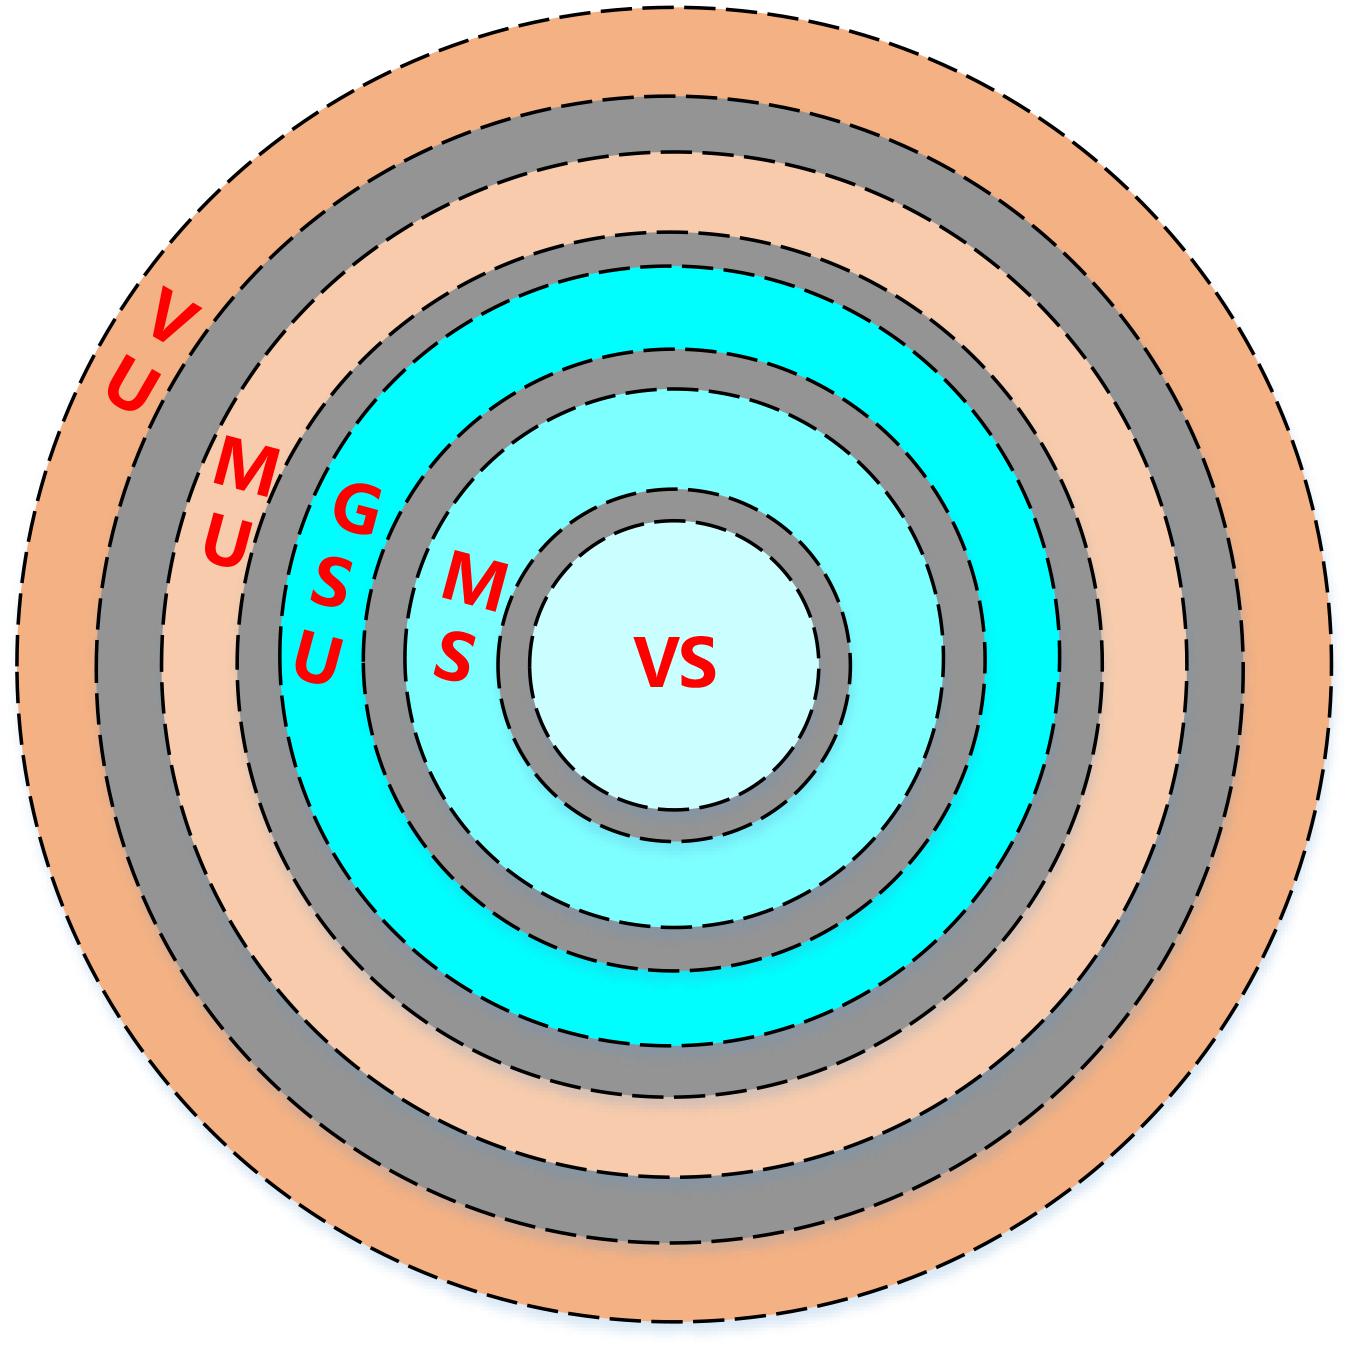
Figure 2. Schematic diagram of state division.
The Method of Consumption States Division Based on Intuitionistic Fuzzy Rough Set Theory
Attribute Data of State Division
Decision attributes that influence the division of state
Decision attribute is the key factor that determines the state of consumption. Based on the structure of the EHHS, the proportion of wind power consumption by HHES (η) and proportion of unit output (δ) are selected as the decision attributes.
Where, Pp is the predicted wind power output. Pr is the actual wind power consumed. Pf,max is the maximum historical wind power output.
The higher the η, the more wind power the HHES needs to consume, and the more the system tends to be unsuitable for consuming wind power. When η is close to 0, the system consumption state cannot be further delineated by η. The system state needs to be delineated by δ.
Where, Pd is the electrical load of the system.
Conditional attributes that relate to state division
This article selects a series of data such as weather and load as the conditional attributes. The result classified by data categories is shown in Table 1.
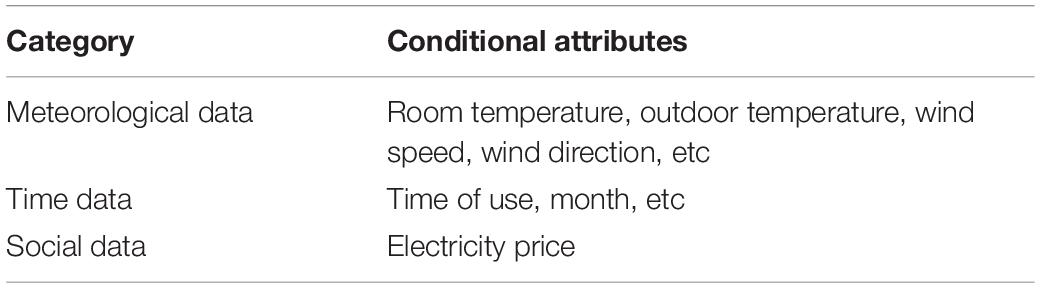
Table 1. Conditional attributes of state division.
Intuitive Fuzzification of Attribute Data
Intuitionistic fuzzification of conditional attributes
There are two types of attribute data: discrete data and continuous data. For discrete data, rough set can process it directly, while for continuous data, it must be transformed. Taking the wind speed attribute as an example, the results of classification of membership are shown in Figure 3. The attribute data is divided into five fuzzy sets including extremely low (EL), low (L), moderate (M), high (H) and extremely high (EH). The maximum and minimum of historical wind speed are set as , , and the remaining are determined according to the statistical law that μ = 1 accounted for 20% in each rough set.
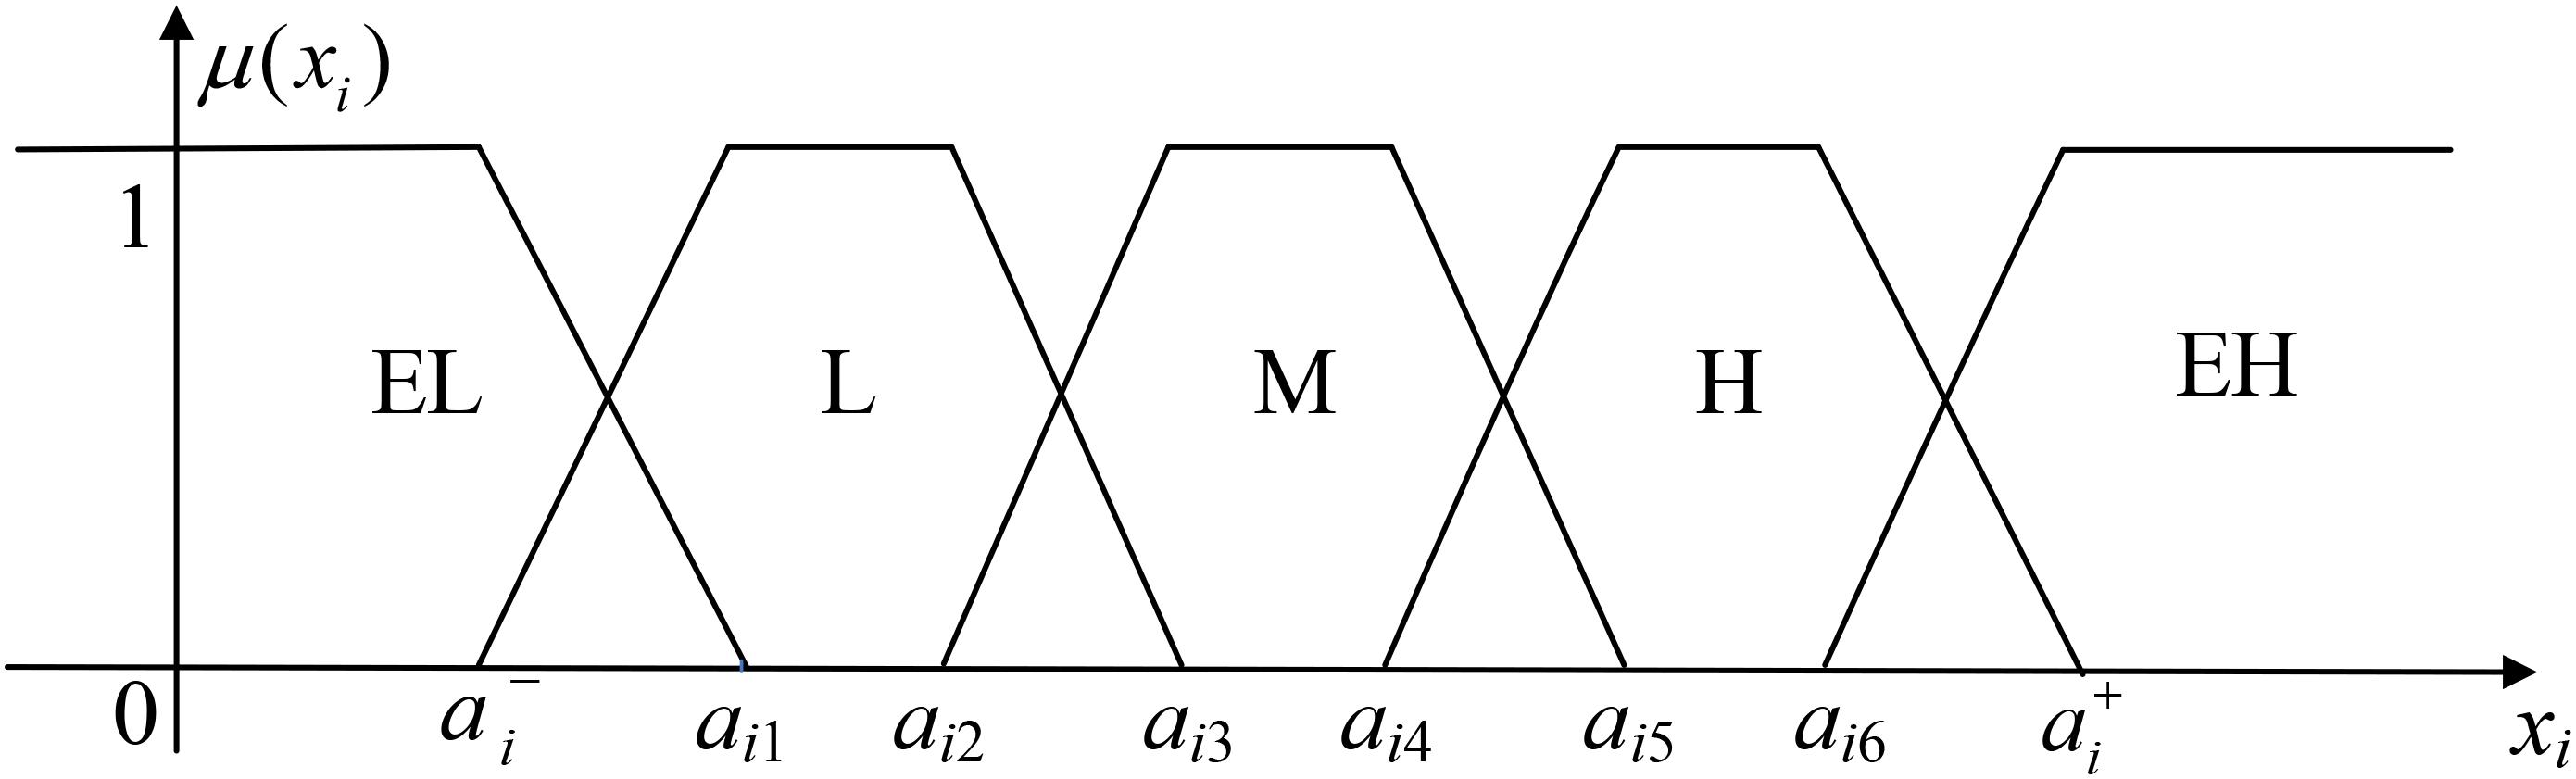
Figure 3. Trapezoidal membership function.
Taking moderate wind speed as an example, its trapezoidal membership function is:
For conditional attribute data, which has sufficient historical data records, the intuitive index is small.
The statistical rules of historical data can be given by experts.
Intuitionistic fuzzification of decision attributes
The membership function image of the decision attribute η is shown in Figure 4. , . The statistical law that μ = 1 accounted for 20% in each rough set, and the boundaries of fuzzy sets can be obtained according to the above law. Pdg,max is set to be approximately 2Pdj,max. Pdg,max is the maximum wind power that can be consumed by the EBU. Pdj,max is the maximum wind power that can be consumed by the EHU.
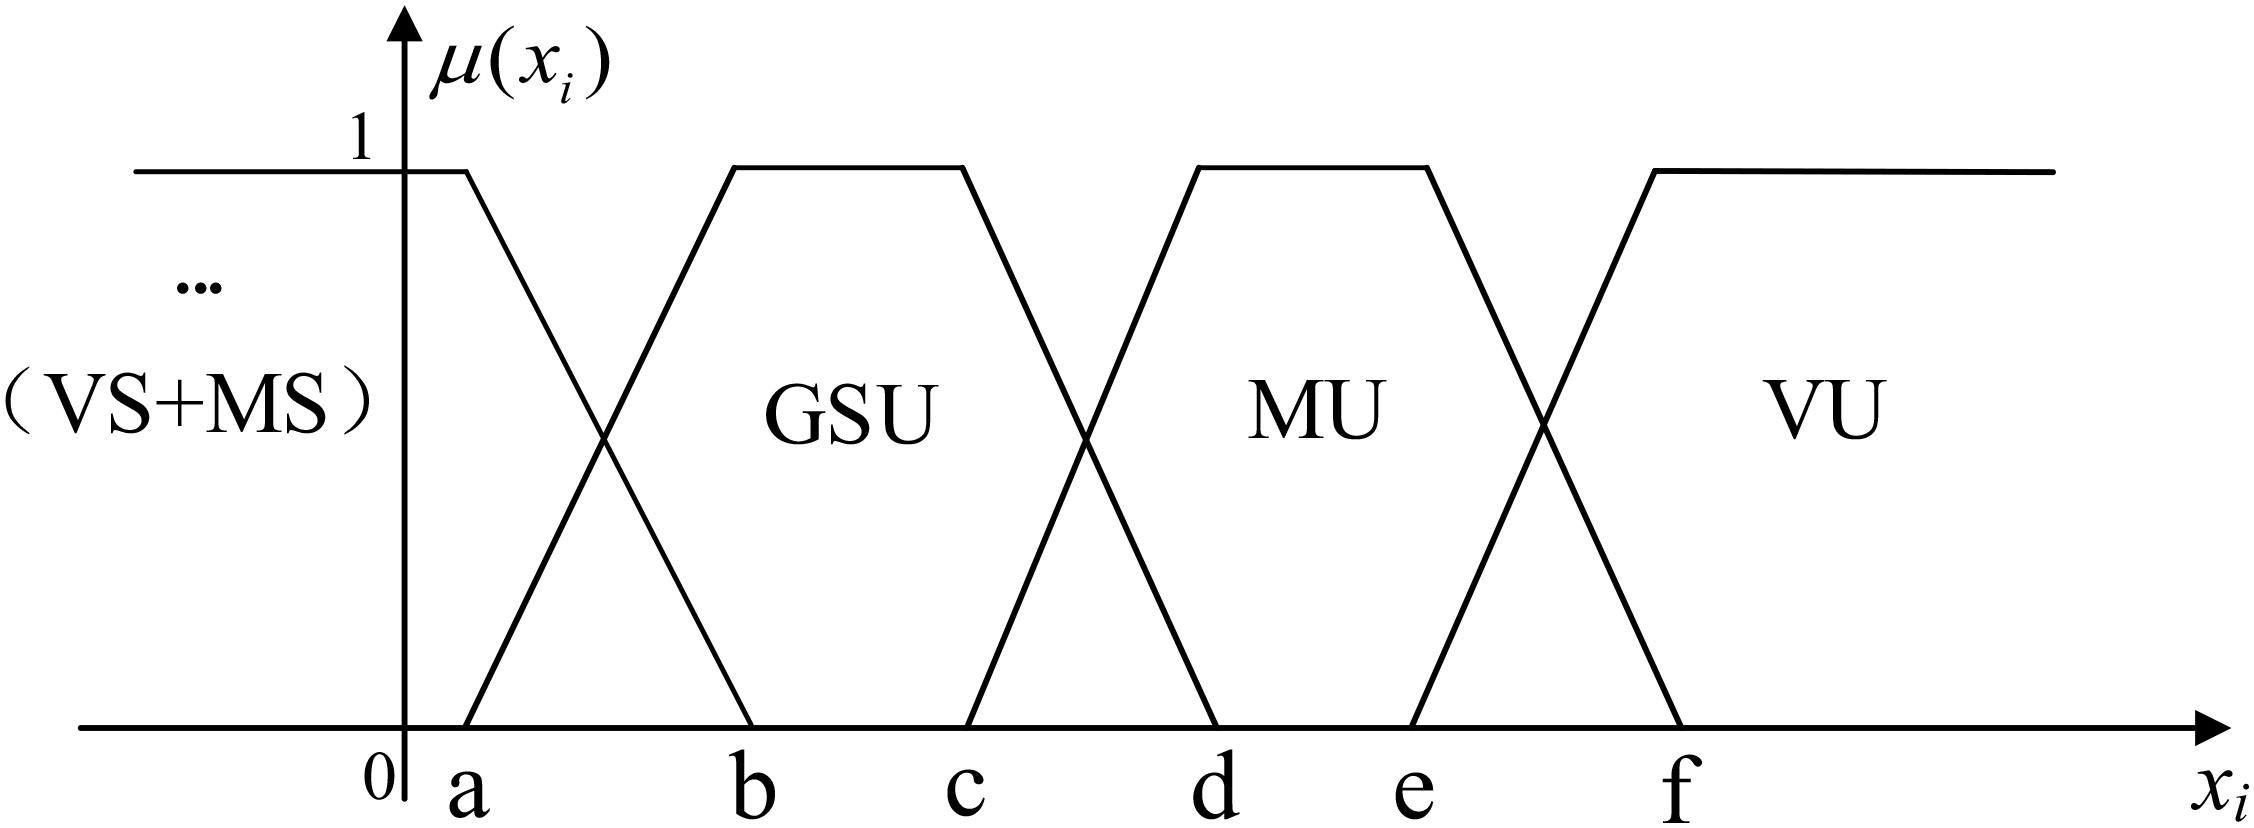
Figure 4. Trapezoid membership function of decision attribute η.
Through the decision attributes η, we can get the membership situation in GSU, MU, VU. When the system is in the consumption state of VS and MS, all wind power in the system can be consumed. So, it is impossible to determine its specific consumption state. The decision attribute δ was used to further determine the consumption state through Ph and Prd.
The decision attribute δ is used to determine the consumption state, as shown in Figure 5. ,. The demarcation is related to Pd, and the situation boundary is determined according to the statistical law that μ = 1 accounted for 20% in each rough set.
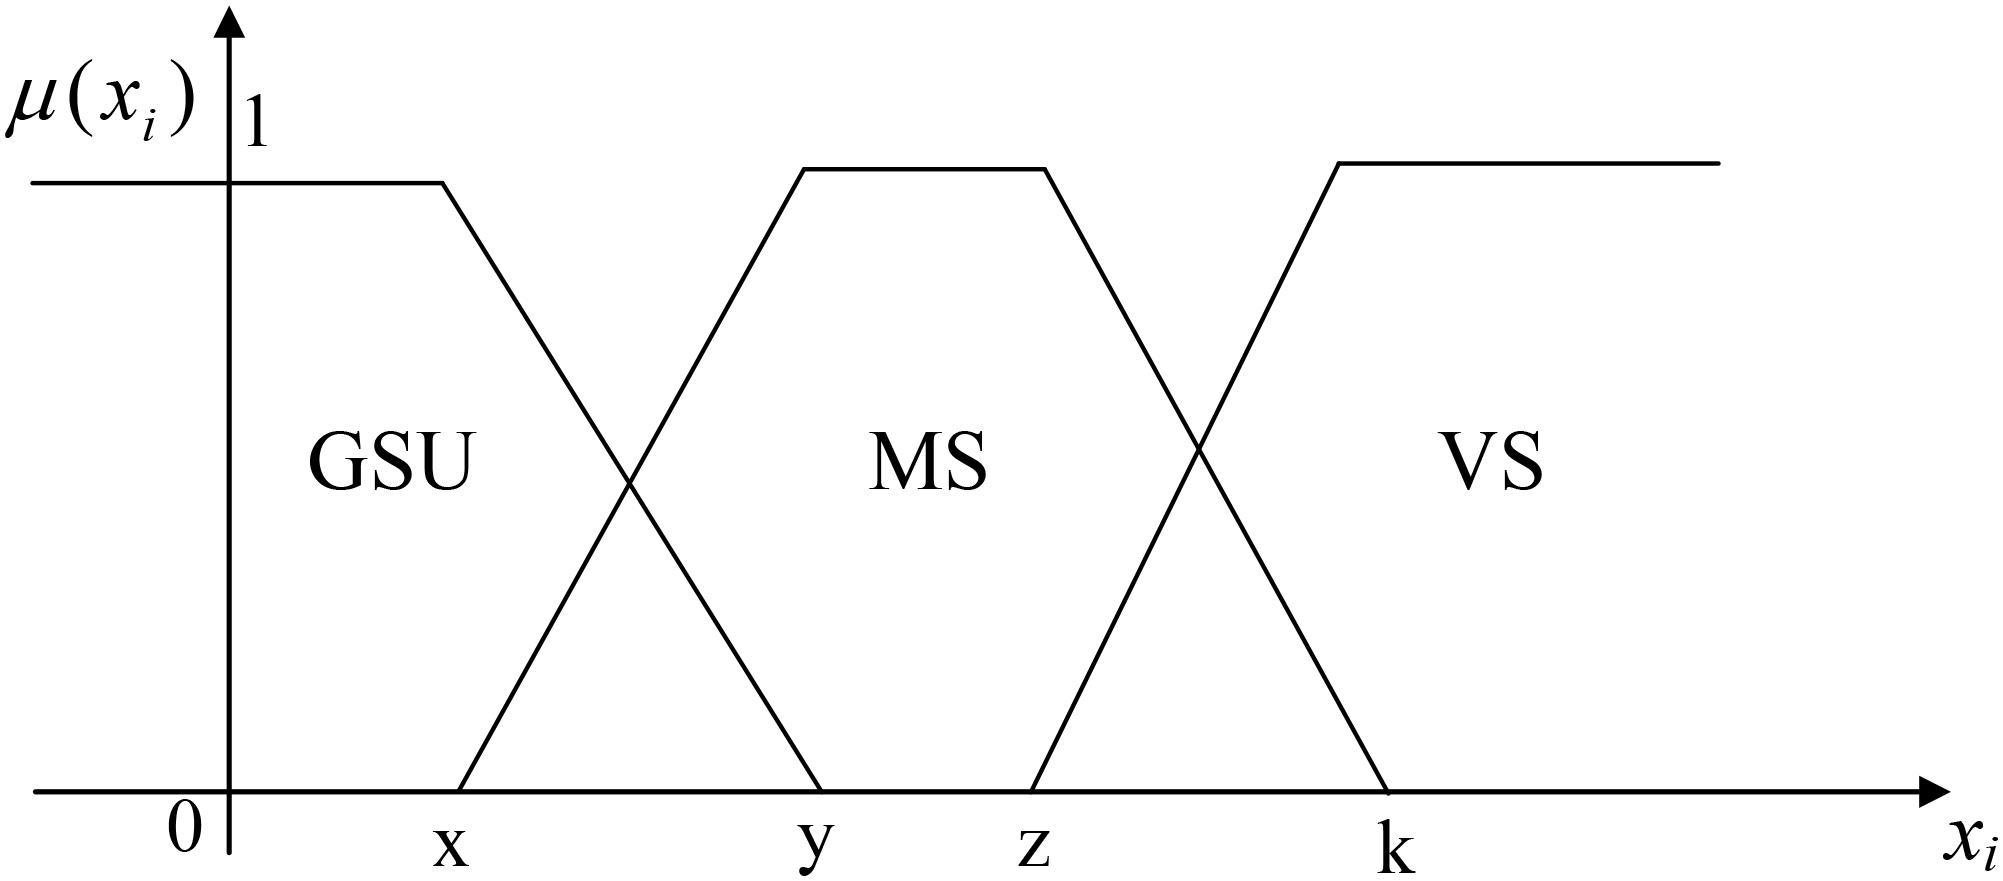
Figure 5. Trapezoidal membership function of decision attribute δ.
Because the boundaries of each fuzzy set of decision attributes are related to the maximum and minimum output of equipment, the intuitive index is small, which is generally less than 0.1.
Construction of State Division Rule Set
Attribute reduction of decision table
Condition attributes and decision attributes can be selected to form a decision table, then the decision table needs to reduce the attributes. The dependence is used to determine the relationship between each condition attribute and decision attribute. The decision table after reduction is obtained by removing conditional attributes which are less dependent and keeping conditional attributes which are more dependent on decision attributes (Ren and Xue, 2018; Wu Y. et al., 2019).
Value reduction of decision rules
After attributes reduction, there are still a lot of redundancy in the decision table, so it is necessary to remove the redundancy by reducing the value of the rule set.
The Determination of the Consumption State
After the rule set is constructed, the real-time data that have undergone intuition fuzzification are matched with the obtained historical evaluation rules to determine the real-time consumption state. In the matching process, if the matching degree is less than the setting threshold value, then the real-time data information matches the evaluation rule completely, and membership degree results of decision attributes can be obtained. Otherwise, it will return to rematch. The real-time assessment data are updated to the historical database. In the process of judging the membership of decision attributes, if η≥b, the state matching results can be directly obtained. The membership result of η is the elementary result of the situation determination. If not, the consumption state matching results need to be obtained through δ. As the HHES is involved in consumption, it is necessary to consider the consumption potential of the energy storage units. Combing the intuitive coefficient, the consumption state will be determined.
For example, when the system consumption state is GSU, it needs to be combined with real-time HSU data to determine whether its remaining capacity can meet the current consumption demand. If it is satisfied, the consumption state is obtained. If not, it needs to be determined whether it meets the next state.
Optimal Scheduling Operation Based on Consumption State Division Method
Optimal Dispatch Model of EHHS Based on Division Method
The system optimization objectives and constraint requirements for each consumption state are shown in Figure 6.
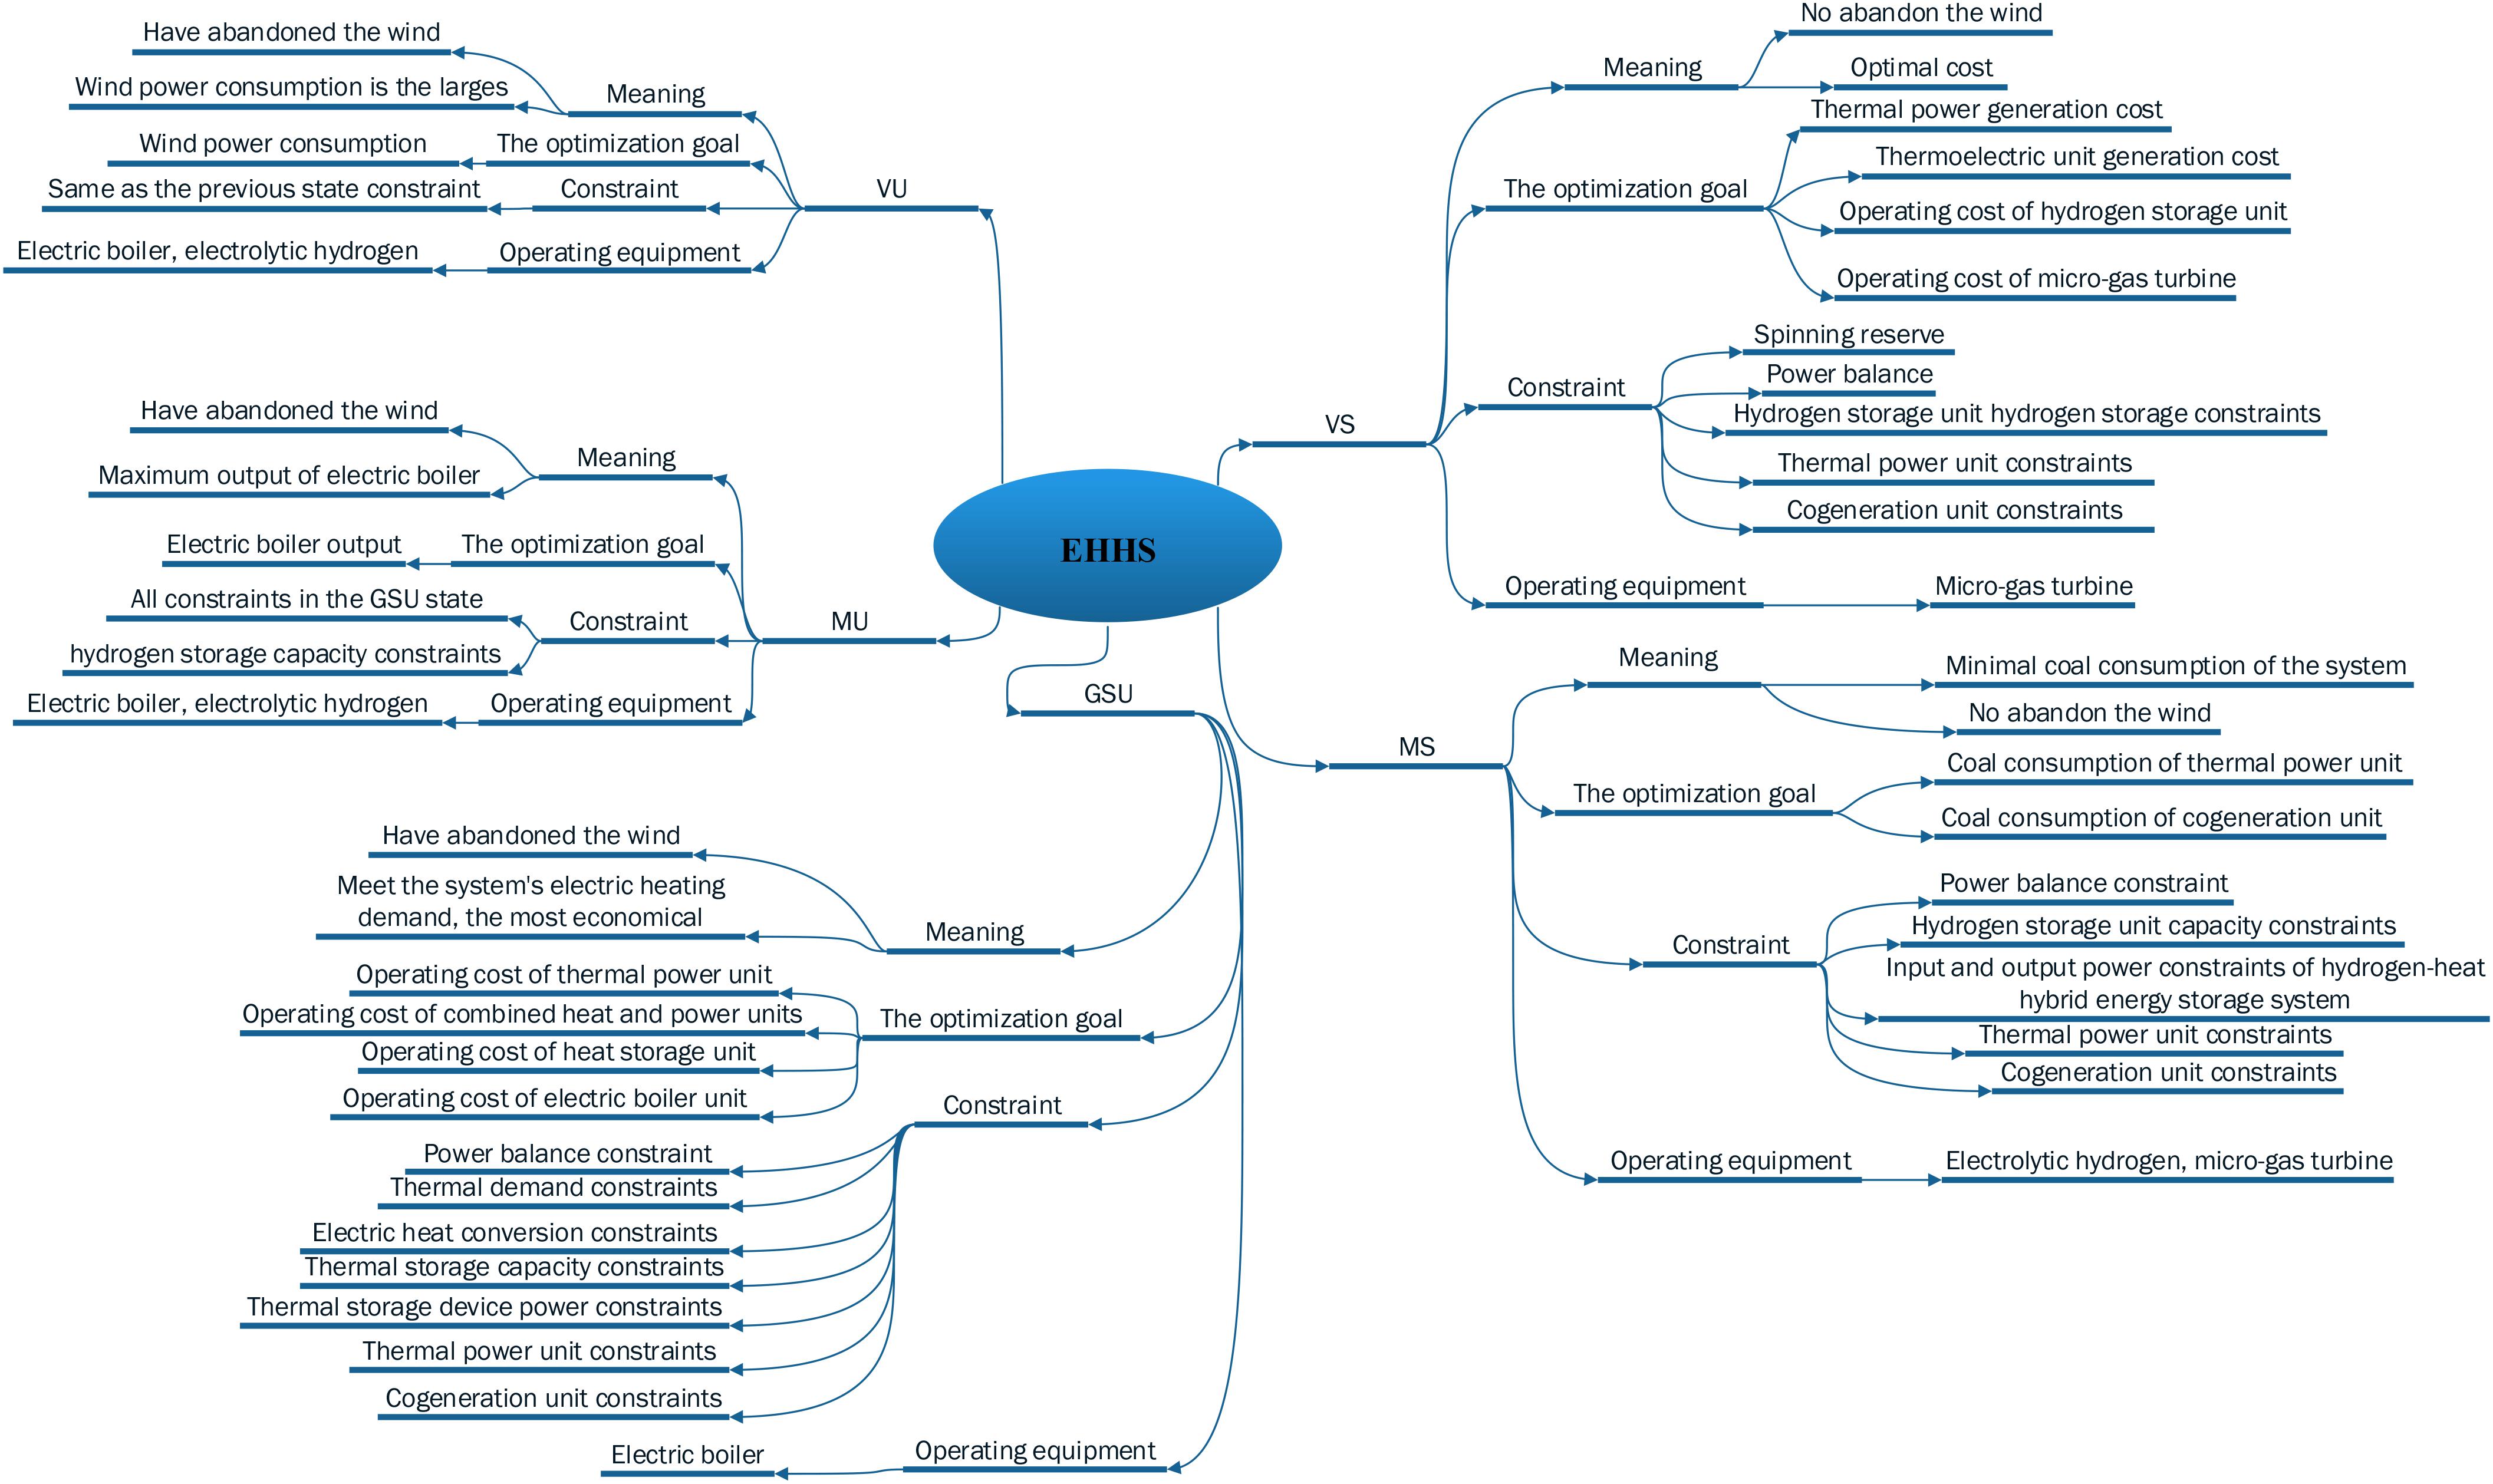
Figure 6. System optimization objectives and constraints under each consumption state.
Optimization Model of VS System
Optimization objective function
In this state, the system can absorb all the wind power. The HSU and MCU can be used together to reduce the unit output. Economic operations should be implemented to reduce operating costs.
The operation costs include the generating cost of cogeneration units, the generating cost of thermal power units, and the work scheduling cost of the HSU and MCU. The generation cost of cogeneration and thermal power units include the operation cost and start cost (Liu et al., 2015).
Where, Cc, Ch, Cq, Cwr are the generation cost of cogeneration units, thermal power units, the HSU, and the MCU, respectively.
Where, Tn represents the number of scheduling periods in VS. Ic is the number of all cogeneration units. ai, bi, ci, di, ei, fi are the coal consumption coefficients of the cogeneration unit. is the electric output of the cogeneration unit i. is the heat output of the cogeneration unit i. vi,t is the operating state of unit i at time t, vi,t = 1 represents the operation of the unit, vi,t = 0 represents the shutdown of the unit. Qi is the start cost of a conventional unit i.
Where, Ih is the number of all thermal power units. αi,βi,γi are the coal consumption coefficient of thermal power units. ui,t is the operating state of unit i in t period, ui,t = 1 represents the operation of the unit, ui,t = 0represents the shutdown of the unit. Si is the start cost of a conventional unit i.
Where, Cq,w is the unit maintenance cost of the HSU. Pq(t) is the power of hydrogen storage and discharging in time period t, Pq(t) > 0 represents energy charging, Pq(t) < 0 represents energy discharging.
Where, Ch is the hydrogen cost of the MCU. Cwq is the start cost of the MCU. CH_2 is the unit price of hydrogen. LH_2 is the low calorific value of hydrogen, which is generally 3.1 kW.h/m3. Tr is the number of running periods of the MCU. PE,out(t) is the discharge power of the HHES. ηwr,E is the hydrogen-electricity conversion efficiency of the MCU. Δt is the time interval of each period. Cqd is the start cost of the MCU.
Constraints
Ignoring the network loss, the power balance constraints satisfy the following formula:
Where, is the heat load value during t period. PE,out and PT,out are the output electricity and heating power of the HHES.
Thermal power units constraints:
The uncertainty of wind power output leads to the increase of system randomness. Positive and negative reserve capacity are used to eliminate the wind power prediction error:
Where, T3 is the rotation standby response time. L% is the demand for positive rotation reserve due to the load prediction error. fu%, fd% are demands of positive and negative rotation reserve for prediction error of wind power output. Pf,max is the maximum output of wind power.
Cogeneration units constraints:
Where, is the power output of cogeneration units. Nc is the heat-to-electricity ratio of the cogeneration unit. Pc,min and Pc,max are the minimum and maximum outputs of the i-th thermal power unit, Pc,min = 0.
Constraint of the HHES:
Where is the hydrogen storage capacity of the HSU in period t. Rcq,max is maximum storage capacities of the HSU.
Optimization Model of MS System
Optimization objective function
In this state, although the system can fully consume wind power, the output of conventional units is close to the minimum. In order to avoid the frequent climbing of units and curb the fluctuation of wind power, the EHU, HSU, and MCU work at this state. The system is optimized with the goal of minimizing the coal consumption of the EHHS.
Where, Tv represents the number of scheduling periods in MS. Cc,m is the coal consumption of cogeneration units. Ch,m is the coal consumption of thermal power units.
Constraints
Ignoring the network loss, the power balance constraints satisfy the following formula:
PE,out > 0, the EHU works. PE,out < 0, the MCU works.
The HSU capacity constraints:
Where, is the hydrogen storage capacity of the HSU in period t. and are minimum and maximum storage capacities of the HSU in period t.
Input and output power constraints of the HHES:
Where, Rcq,maxis the maximum hydrogen storage capacity of the HSU.
Constraints of thermal power units and cogeneration units are same as the constraints in VS.
Optimization Model of GSU System
Optimization objective function
In this state, the system cannot consume all the wind power. The EBU starts to work, which has to consume the wind power to satisfy the heat demand. The optimizing target is the highest economy that meets the electric and heat demand.
Where, Ccris the operating cost of the TSU. Cdgis the operation cost of the EBU.
Where, Tm represents the number of scheduling periods in GSU. Ccr,w is the maintenance cost of the TSU. Pr(t) is the heat storage and release power in time period t, Pr(t) > 0 represents energy charging, Pq(t) < 0 represents energy release. Cdh is the electric to heat cost of the EBU. Cq is the start cost of the EBU. Sdg is the EBU conversion unit cost. Gi,t is the EBU operating state, 1 represents operation, 0 represents shutdown. Cgq is the starting cost of the EBU once.
Constraints
Ignoring the network loss, the power balance constraints satisfy the following formula:
Where, is the power output of the HHES.
Heat demand constraint:
Electric to heat constraint:
Capacity constraint of TSU:
Where, is the heat storage capacity of the TSU in period t. Rcr,max is the maximum heat storage capacity of the TSU.
Power constraints of TSU:
Where, is the wind power consumed by the EBU.
Constraints of thermal power units and cogeneration units are same as constraints in VS.
Optimization Model of MU System
Optimization objective function
In this state, the wind power needs to be consumed by the EBU and the EHU. The optimizing target is maximizing the output of the EBU.
Where, Ta represents the number of scheduling periods in MU. Edg is the wind power in MU. is the wind power consumed by the EBU.
Constraints
It is same as the power balance constraints in GSU.
In addition to considering the equipment constraints in the previous consumption state, it is also necessary to restrict the capacity of the HSU.
Where, is the wind power consumed by the EHU.
Optimization Model of VU System
Optimization objective function
In this state, the wind power cannot be completely consumed by the EBU and the EHU. The optimization goal is maximizing the wind power consumption.
Where, Tb represents the number of scheduling periods in VU. Pfs is the wind power actually consumed in VU.
Constraints
Power balance constraints:
The equipment constraints and the HHES constraints are same as constraints in MU.
Power System Optimal Dispatching Process Based on State Division Method
The optimal scheduling process of new energy consumption based on intuitionistic fuzzy rough set theory is shown in Figure 7.
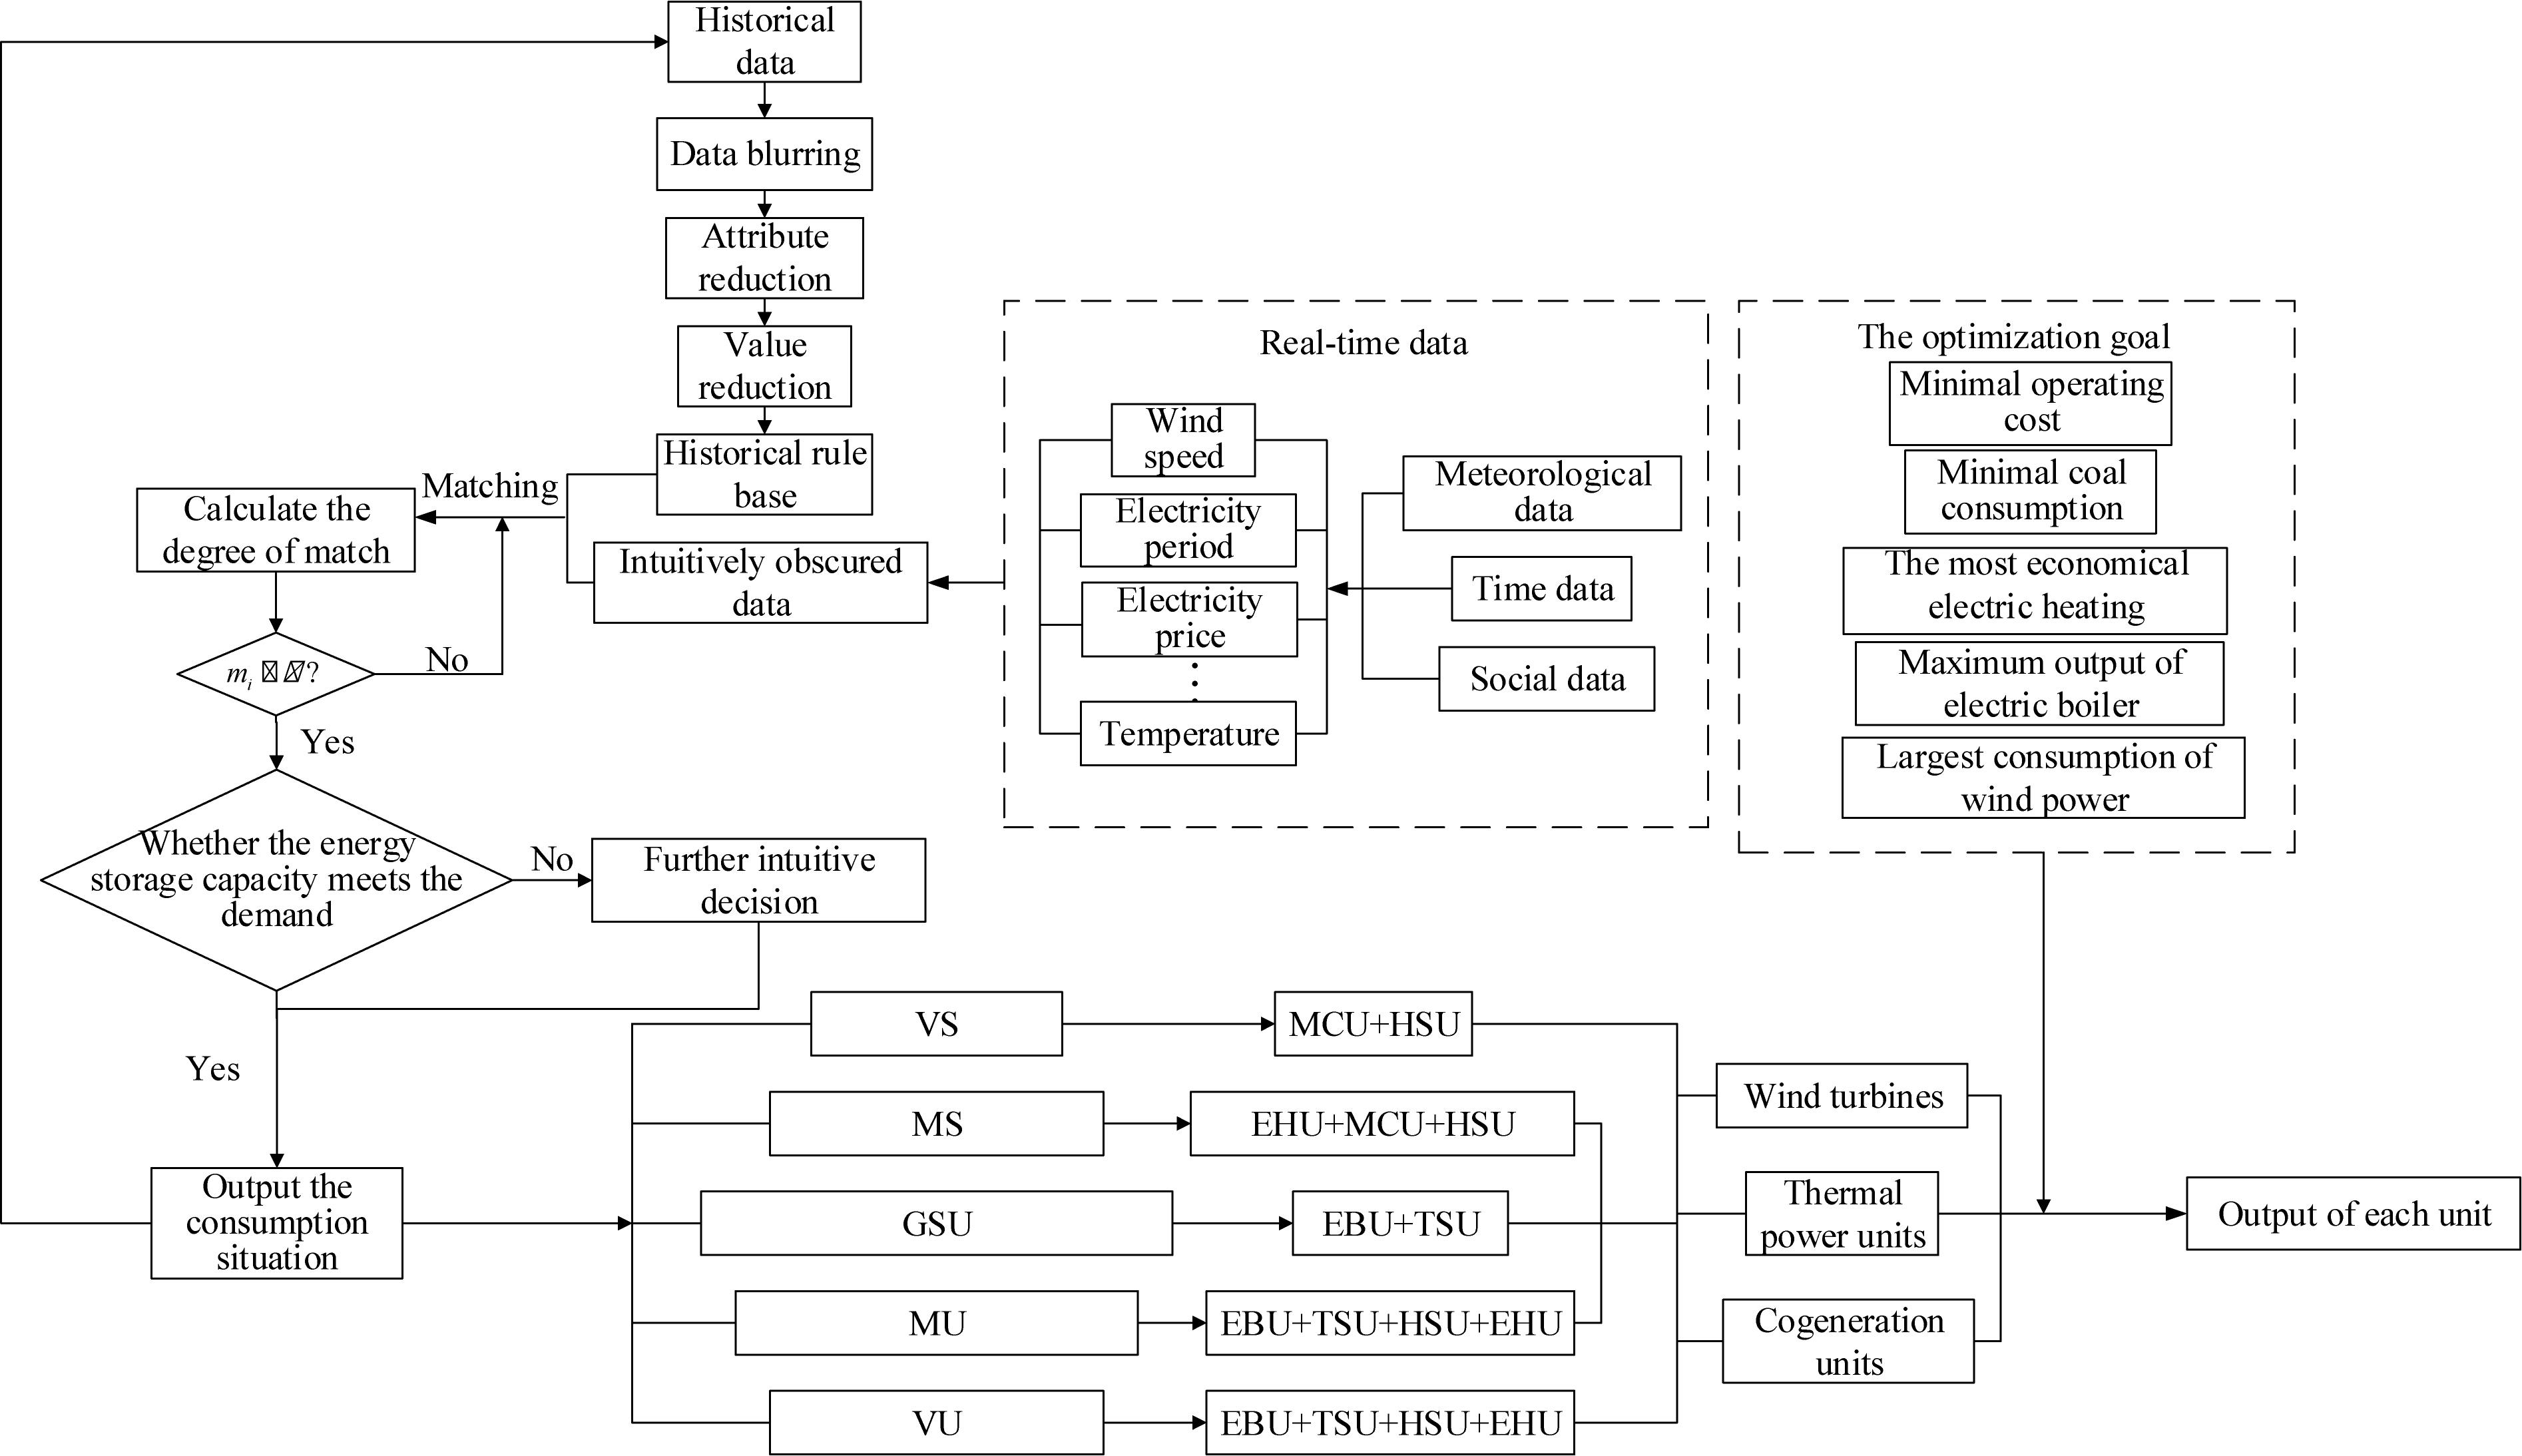
Figure 7. Optimize the scheduling process.
Case Analysis
Instance Description
To highlight the advantages in solving the problem of wind power consumption, the measured condition attributes data of a provincial power grid are taken as an example. The IEEE-30 bus system is used as the network structure of the EHHS. The system structure diagram is shown in Figure 8.
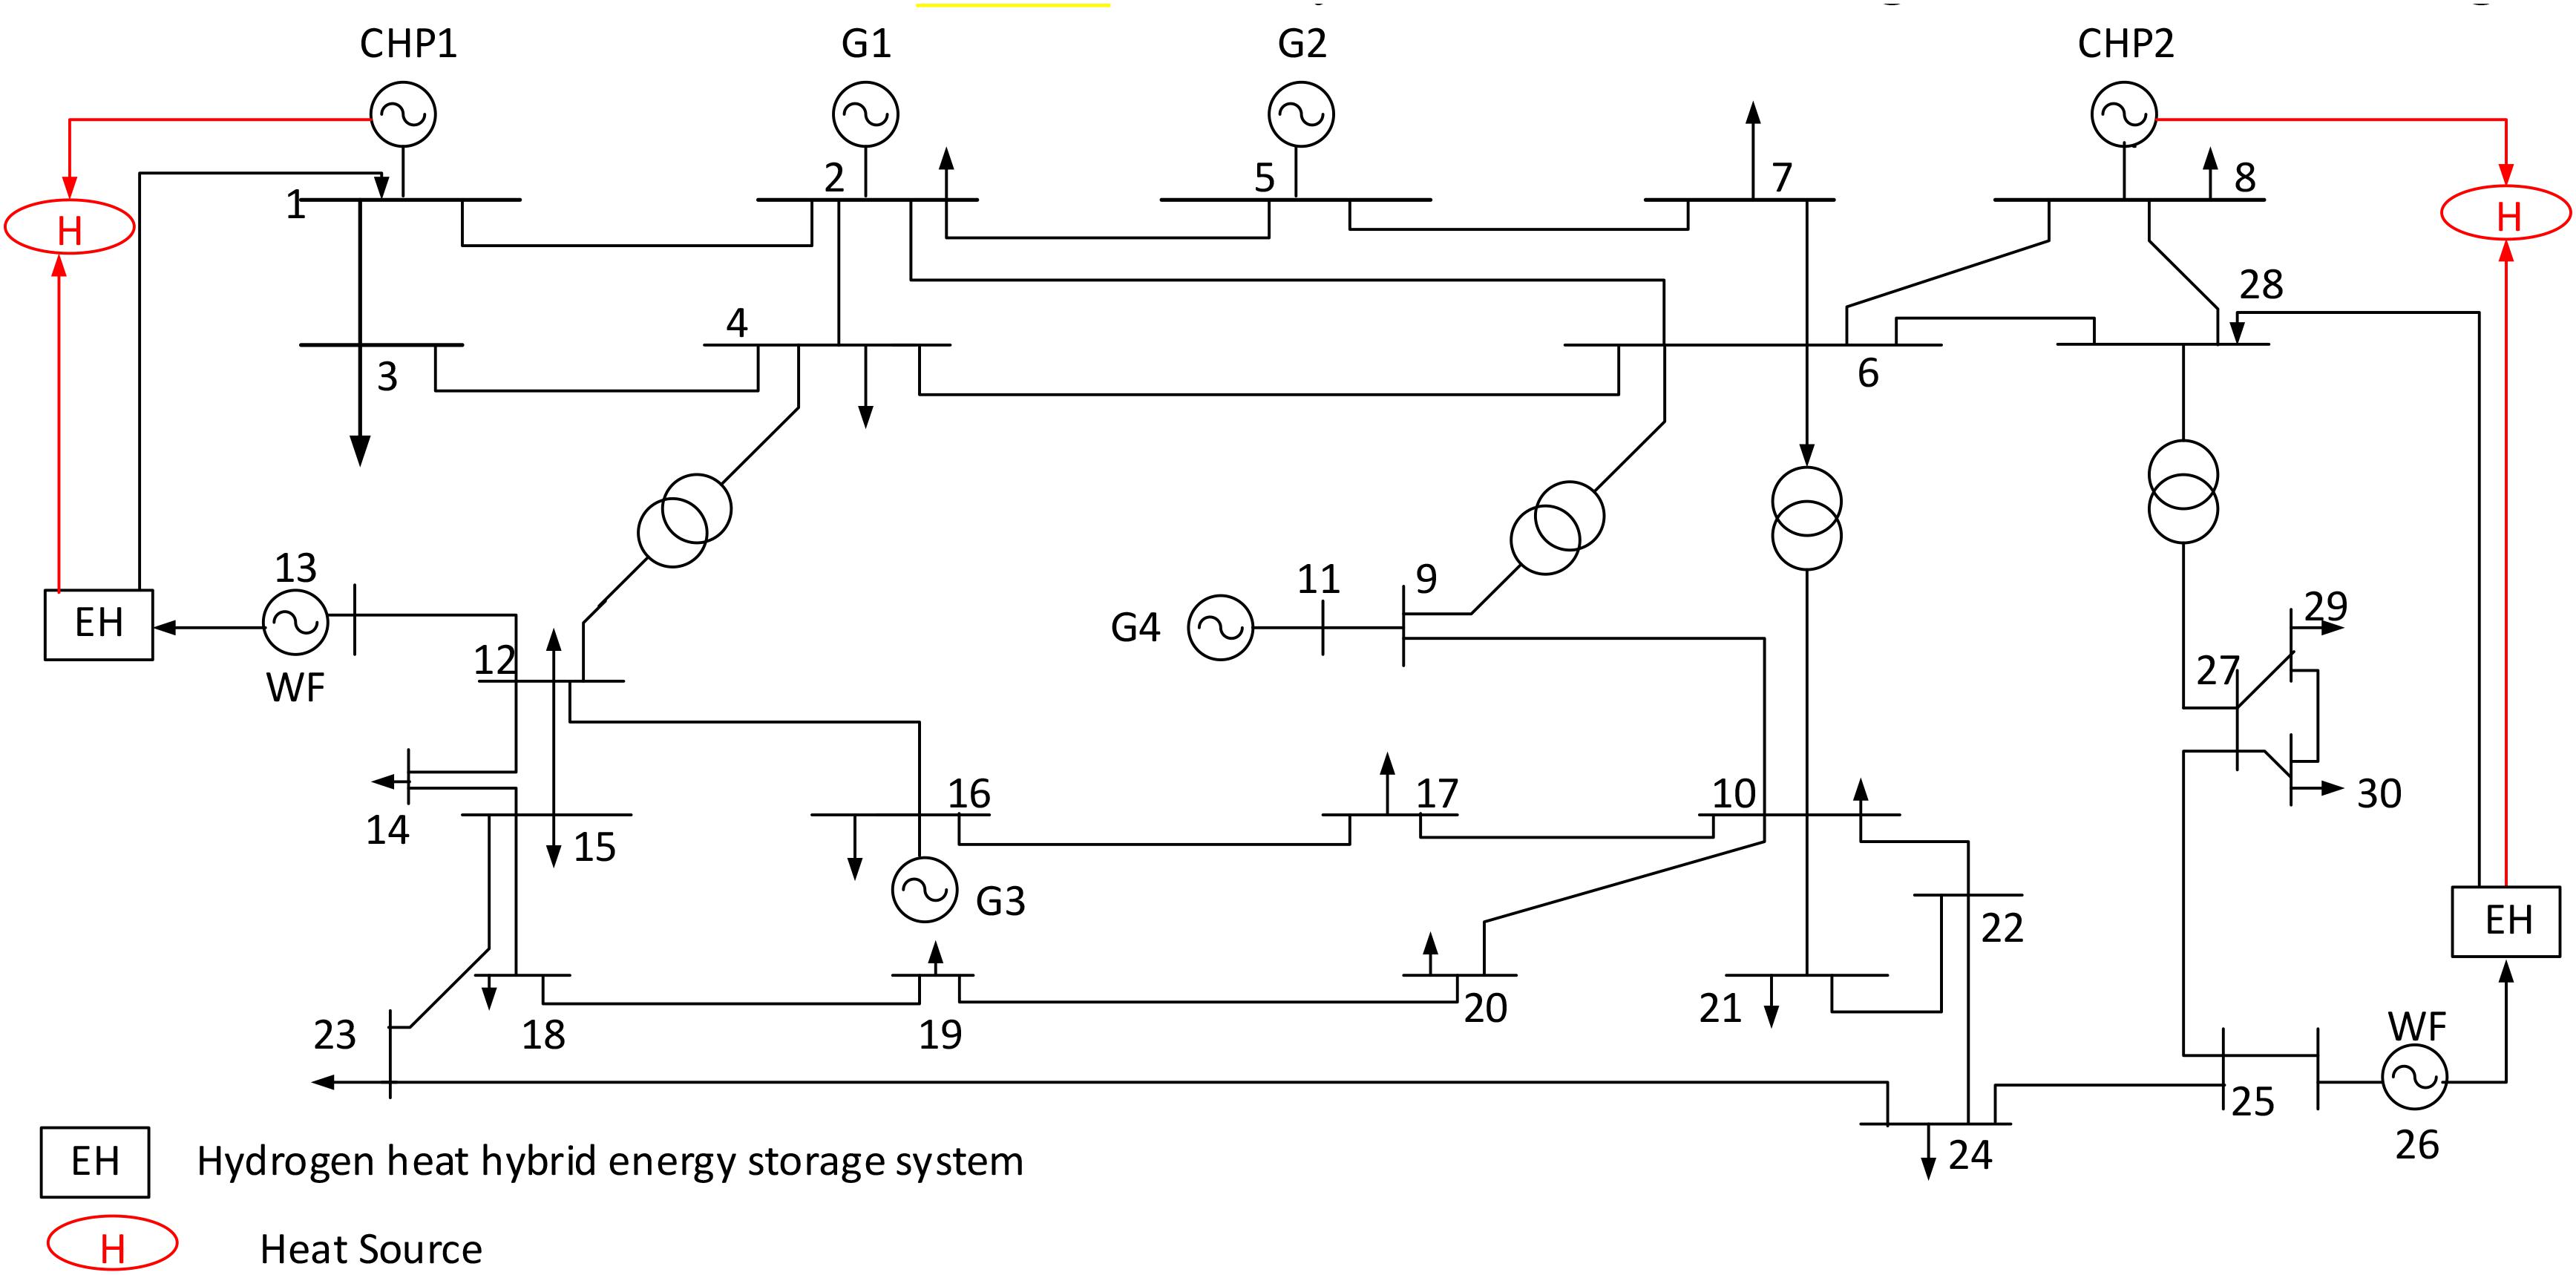
Figure 8. System structure topology diagram.
There are four thermal power units, two cogeneration units and two wind turbines being used for simulation. The total installed capacity of the wind farm is 5500 MW, and the installed capacity of each unit is shown in Table 2.
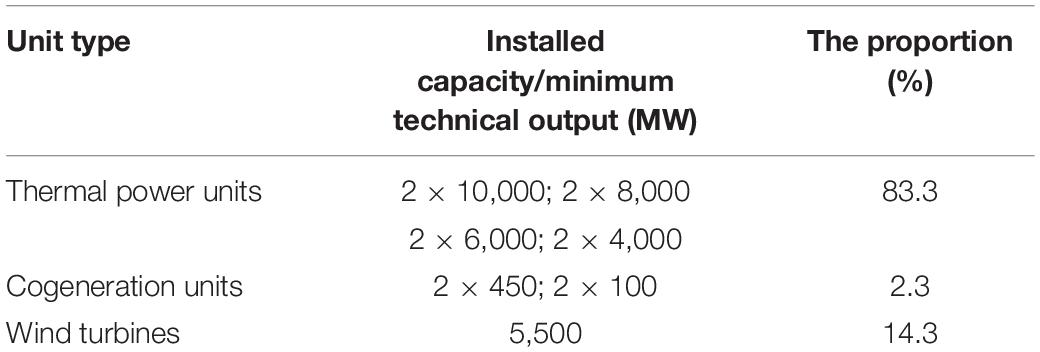
Table 2. Grid installed capacity.
The heat-to-electricity ratio of the cogeneration unit is 1. The electro-hydrogen conversion coefficient of the EHU is 0.92, and the maximum installed power of the EHU is 1000 MW. The hydrogen storage and release efficiency of the HSU is 0.97, and the maximum installed capacity of the HSU is 30,000 m3. The hydrogen-to-electric conversion efficiency of the MCU is 60%. The electric-to-heat conversion efficiency of the EBU is 0.96, and the maximum installed power of the EBU is 1,000 MW. The heat storage and release efficiency of the TSU is 0.9, and the maximum installed capacity of the TSU is 3,000 MWh. The selected scheduling period is 1 h, and one day’s data are used for analysis. Assume that a typical day has stored heat of 1,000 MWh and hydrogen storage of 30,000 m3.
A typical daily load curve and wind power output curve are shown in Figure 9. The heat load curve is shown in Figure 10.
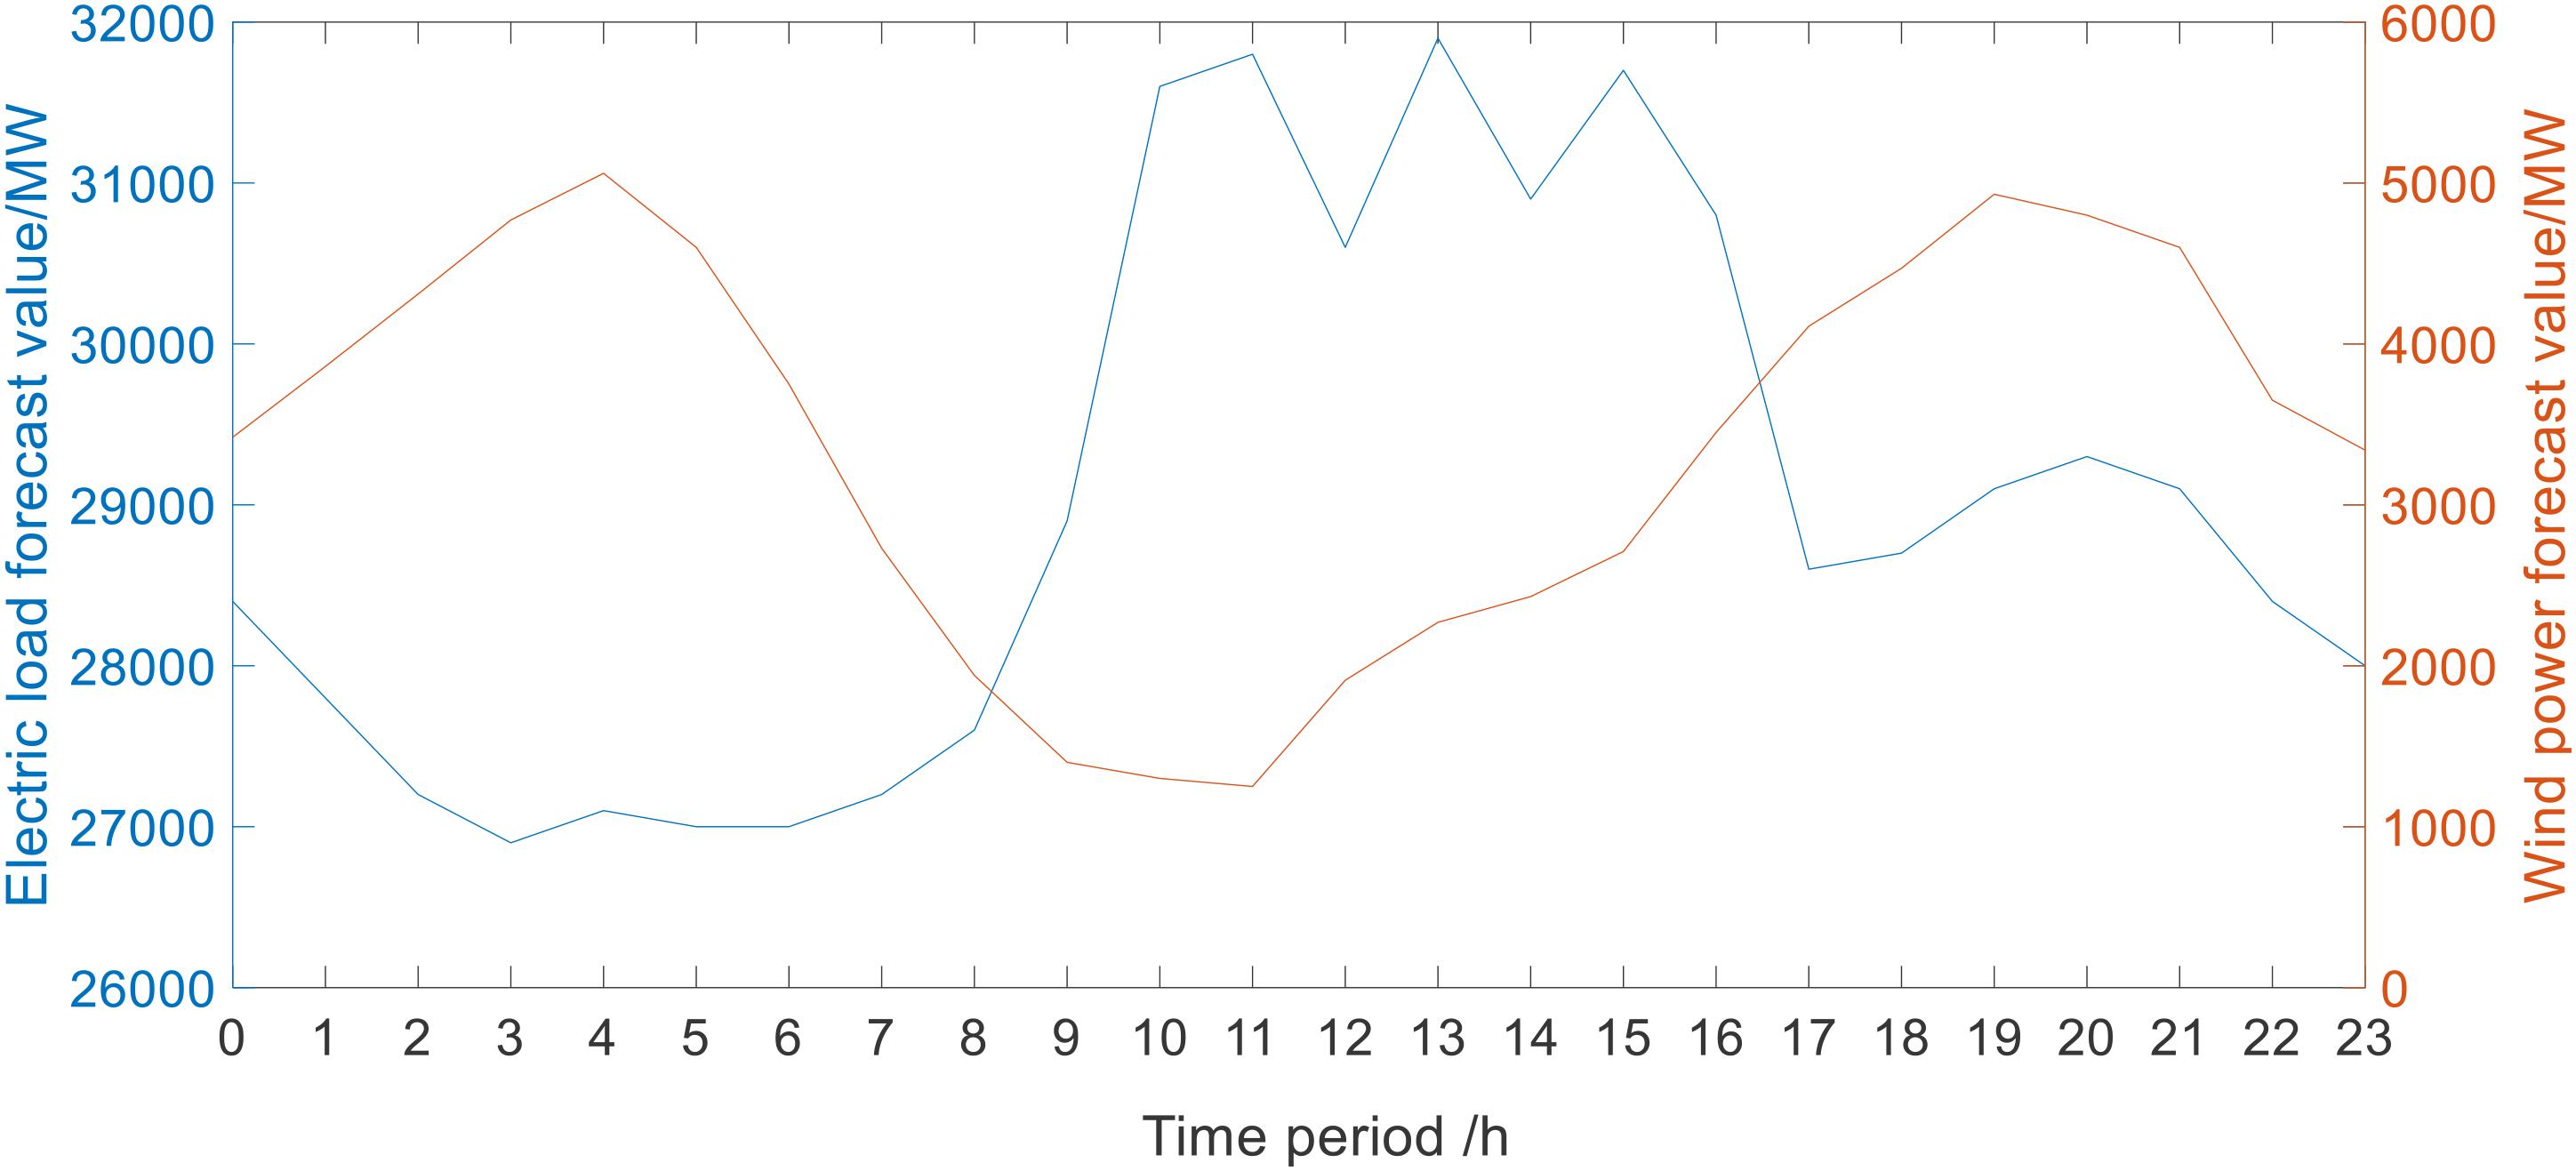
Figure 9. Electric load and wind power output forecast curve.
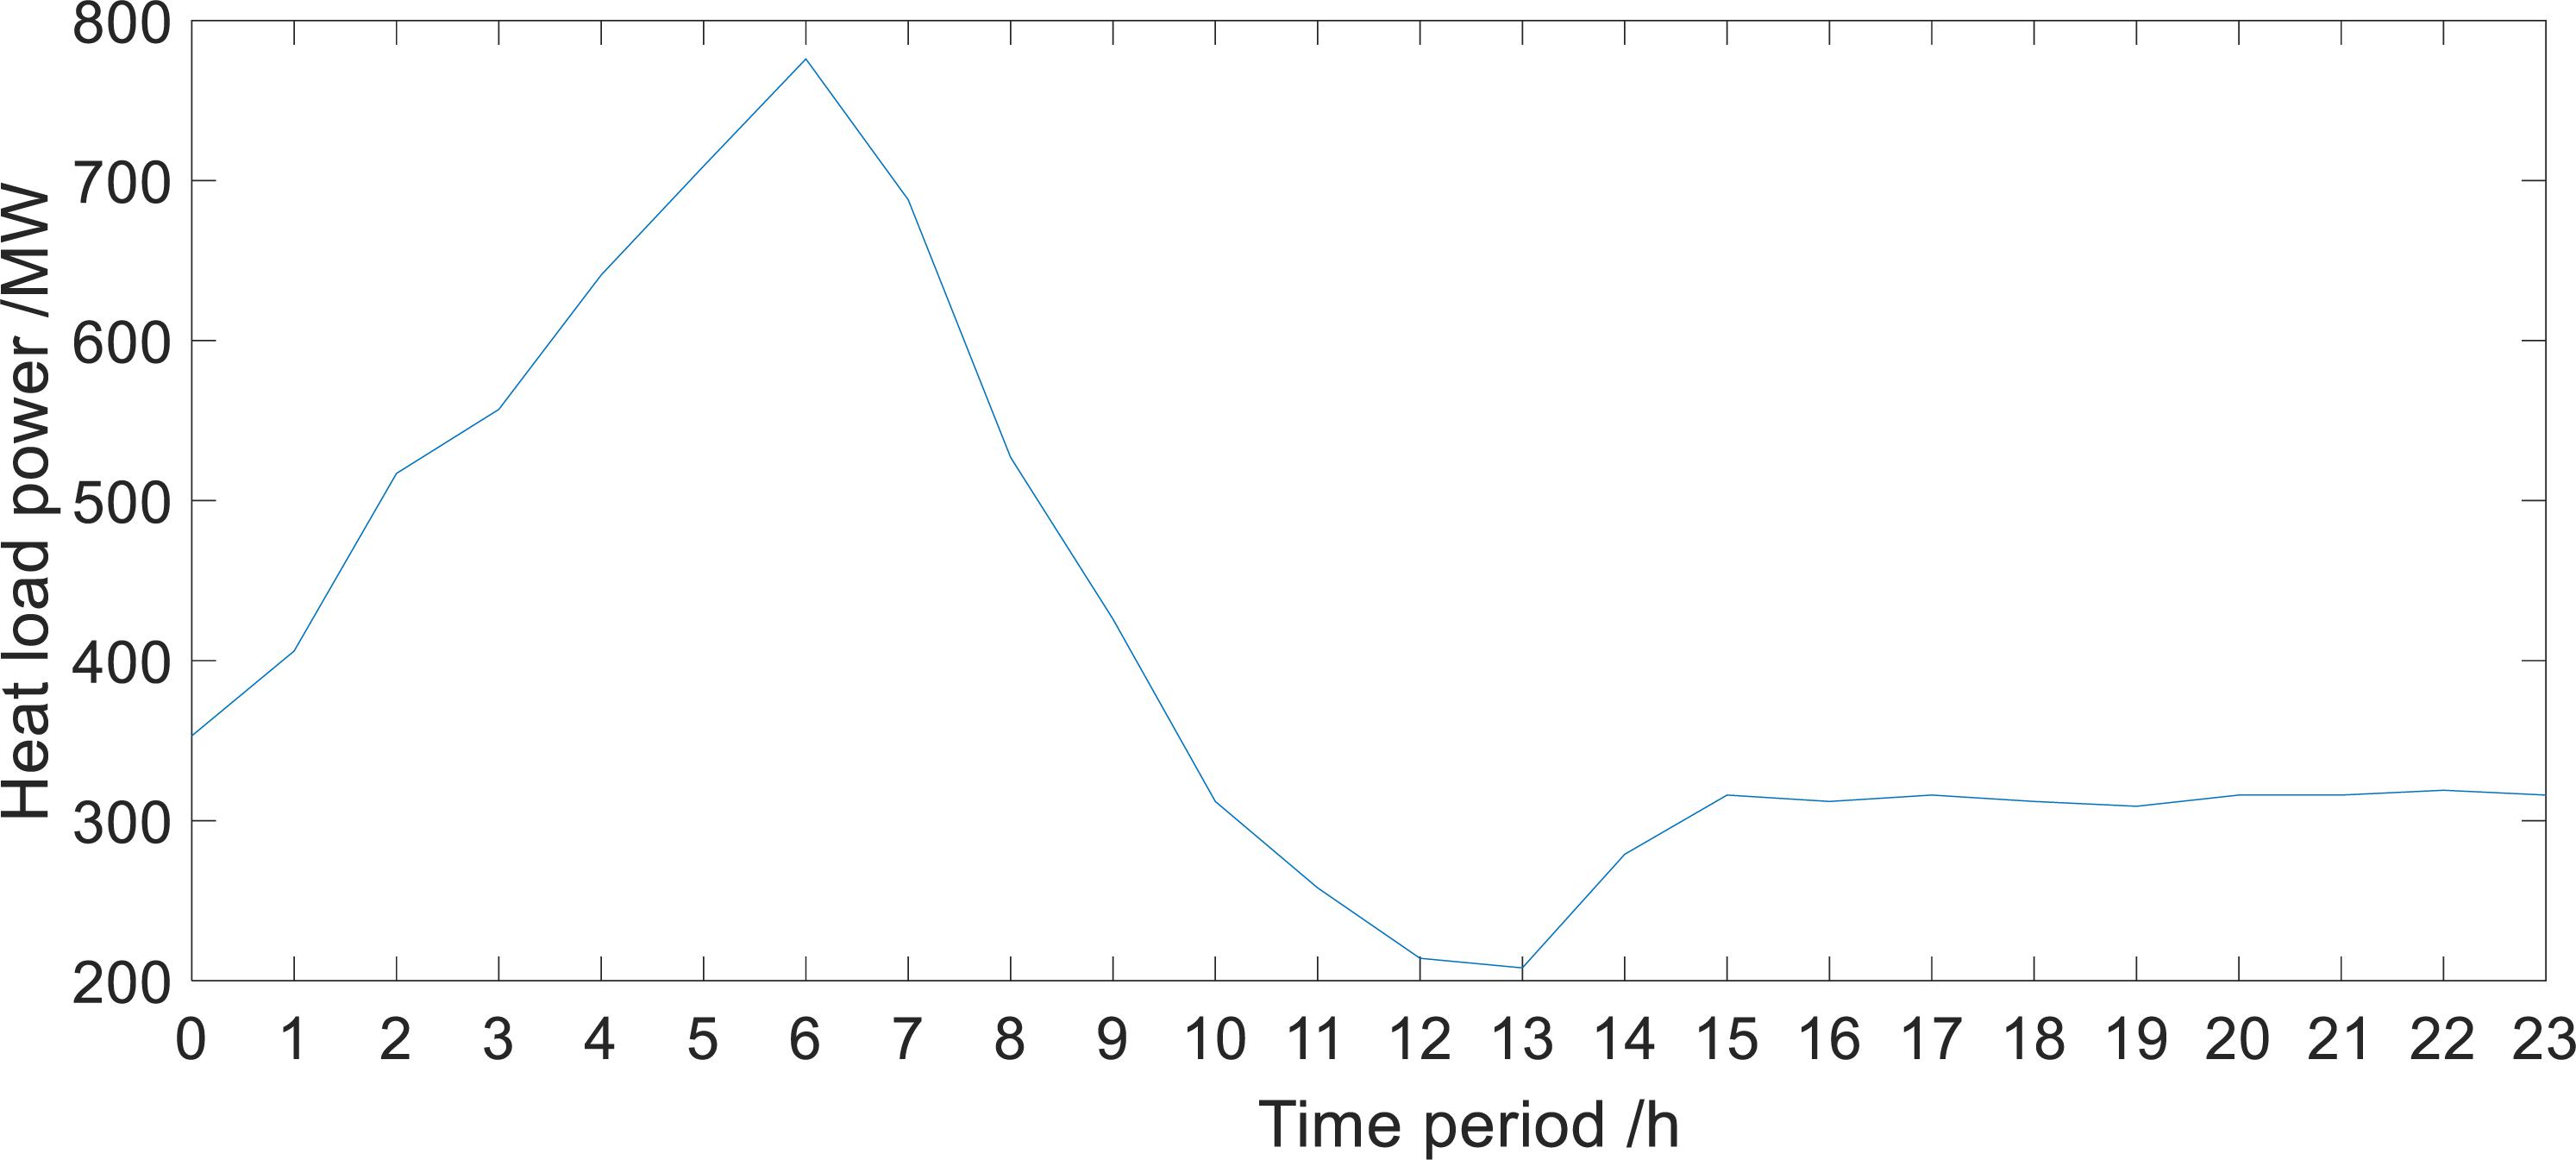
Figure 10. Heat load curve.
Ignoring the line losses, equipment losses, and the effect of thermal network constraints, the system is simulated and analyzed in the following two operating modes:
Mode 1: Based on the state division method studied in this article, the HHES is introduced to participate in the scheduling, and the hybrid particle swarm optimization algorithm (Jiang and Ma, 2020; Liu et al., 2020; Lu and Song, 2020) is used for optimization.
Mode 2: Based on the three-state division method of the power system, electric energy storages and electric boilers were introduced to participate in dispatching and optimizing the system.
Example Demonstration
Consumption states of mode 1 are divided as follows. The consumption states division method in mode 2 is based on (Ge et al., 2019).
Related Consumption Data
The consumption data in a certain period of winter is selected to construct the knowledge base. Table 3 is the part of the sample set, where P is the condition attribute, Q is the decision attribute. The value of the decision attributes in Table 3 is the data of unoptimized scenario.
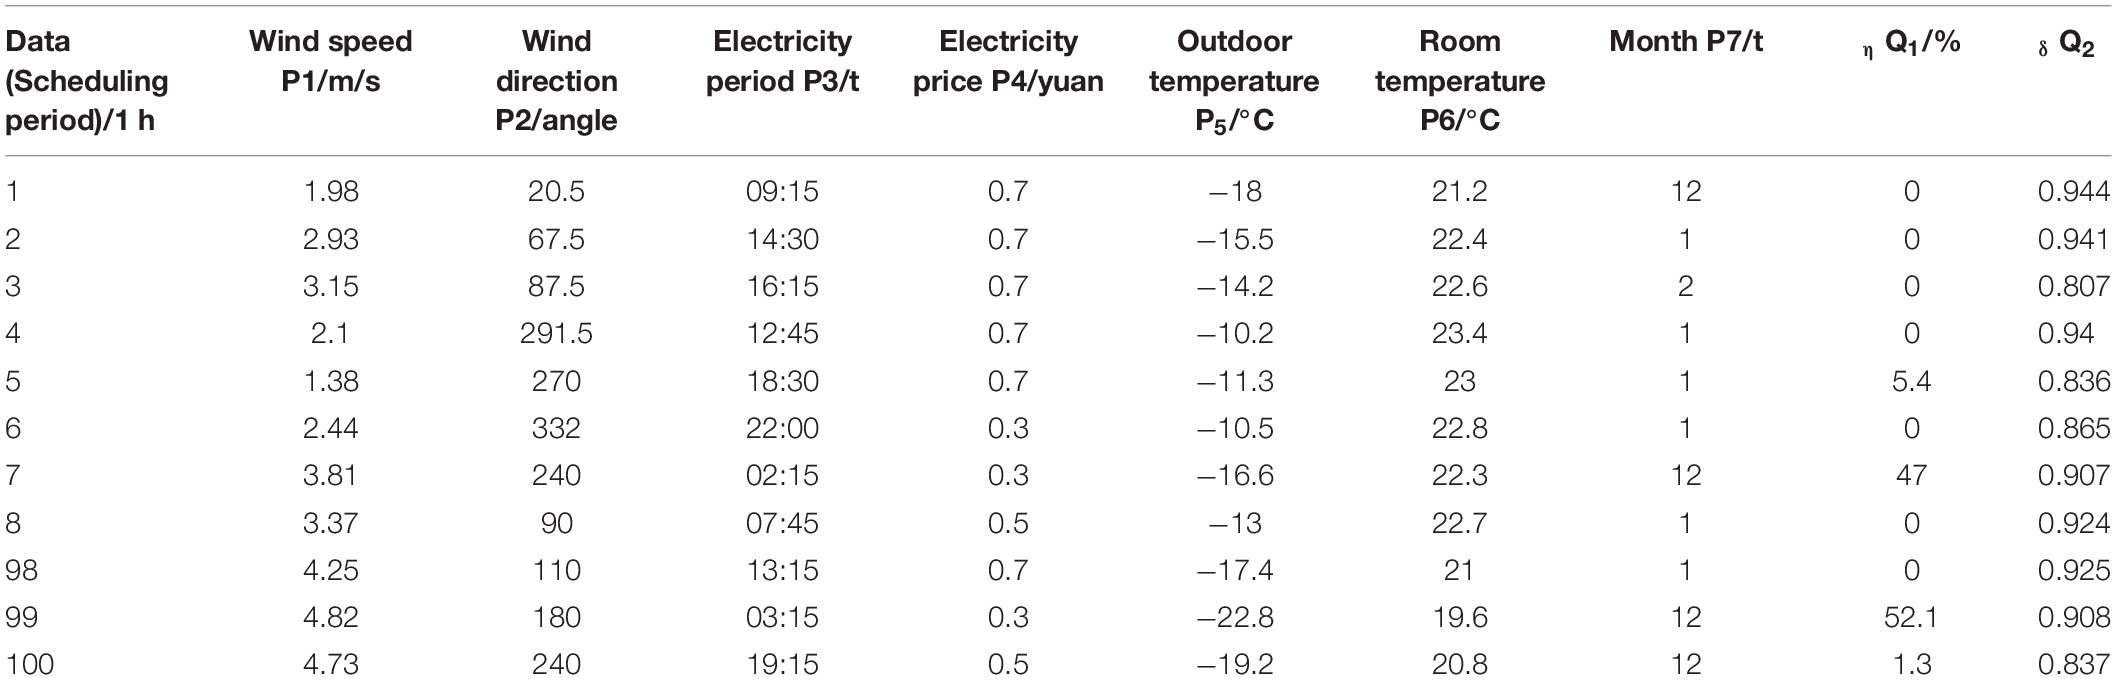
Table 3. Historical data of state division.
Intuitionistic Fuzzification of Sample Data
In the process of intuitionistic fuzzification of conditional attributes, five linguistic variables EL, L, M, H, and EH are set for the continuous attributes such as wind speed, outdoor temperature and room temperature. For wind direction attributes, 16 linguistic variables are used, such as North (N), North Northeast (NNE), Northeast (NE), East Northeast (ENE), East (E), East Southeast (ESE), Southeast (SE), South Southeast (SSE), South (S), South Southwest (SSW), Southwest (SW), West Southwest (WSW), West (W), West Northwest (WNW), Northwest (WN), and Northwest (NNW). For the electricity consumption period, they are divided into three periods, such as peak period (F), valley period (G), and flat period (P). For electricity price attributes, they are divided into three levels of high (H), medium (M), and low (L). For the monthly attribute, because this article only considers the consumption in the winter period, the data are divided into three levels: December (D), January (J), and February (F). Since the historical data of the above conditional attributes is sufficient, the intuition index of condition attributes and decision attributes can be 0.01 and 0.1.
If the result can be directly determined by η, then δ is not considered. Otherwise, the above two decision attributes will be considered to obtain the result. The results of intuitionistic fuzzy division are shown in Table 4.
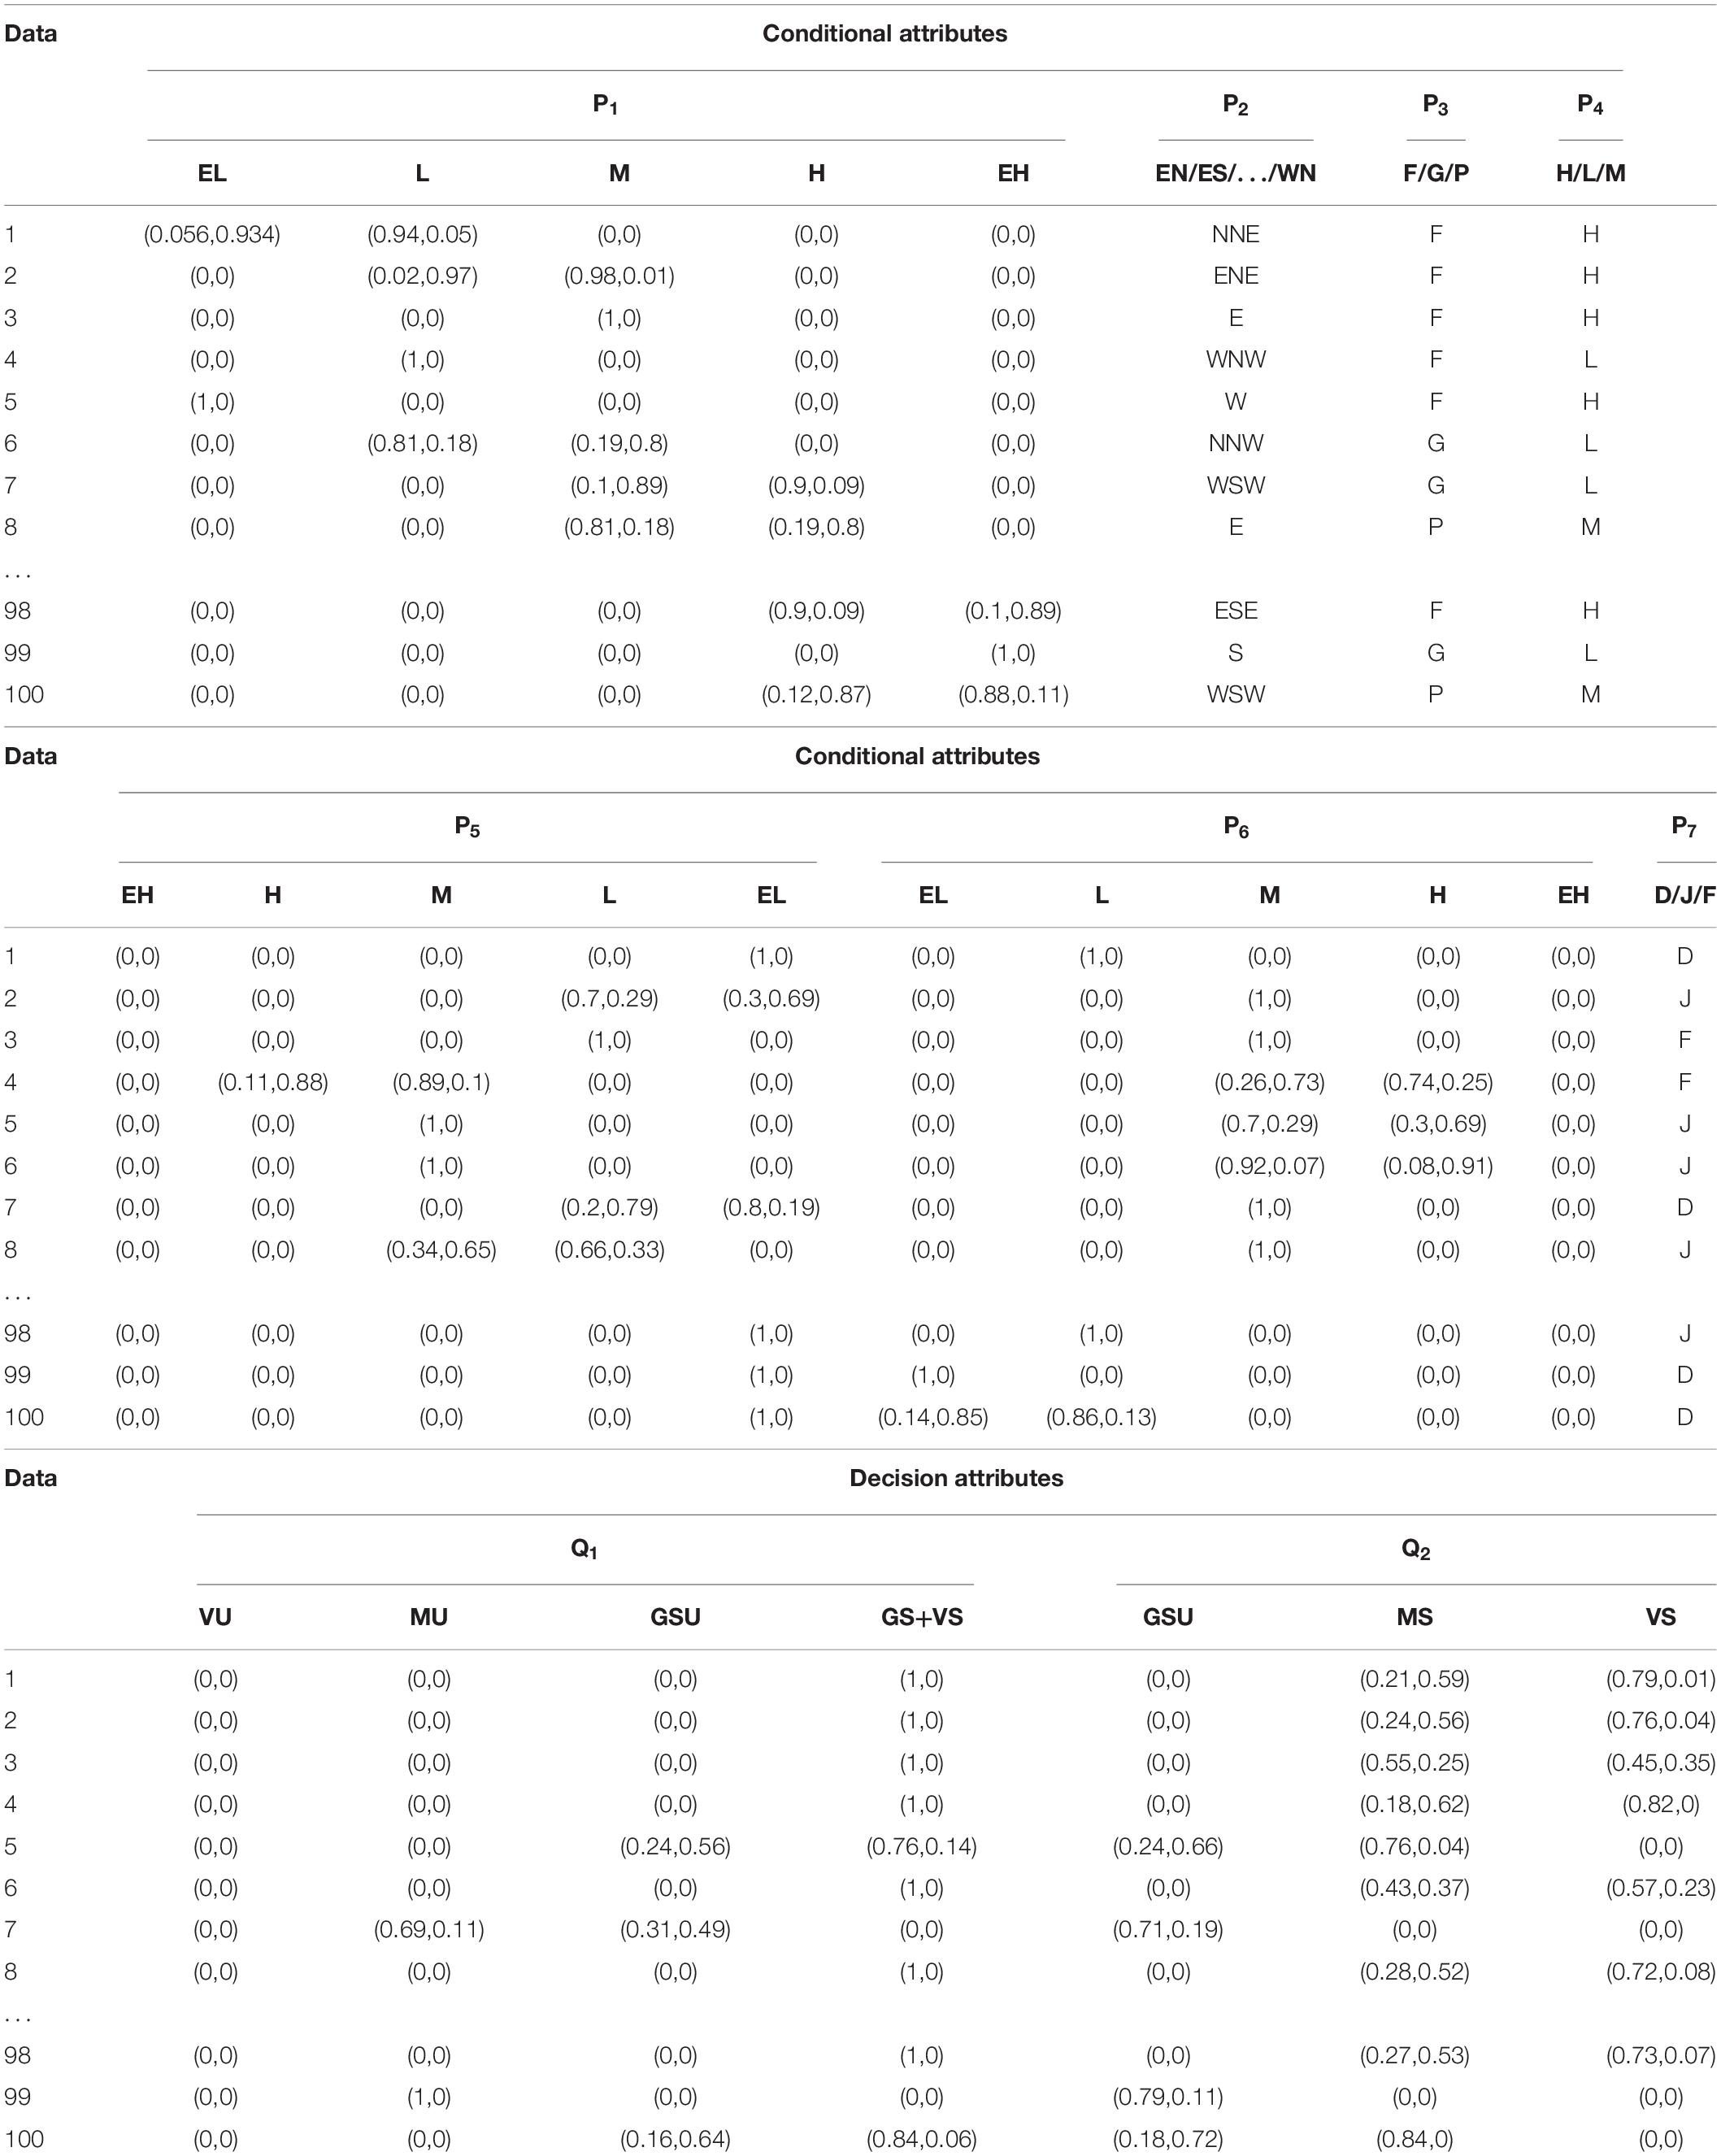
Table 4. The degree of membership and non-membership of conditions and decision attributes.
Construction and Law of Decision Rule Set
For the membership results of decision attributes in the decision rule, it is first determined whether Q1 can get the result, and a conclusion will be drawn. Otherwise, the state membership result will be determined through Q2. The decision table obtained after attributes reduction and values reduction is shown in Table 5.
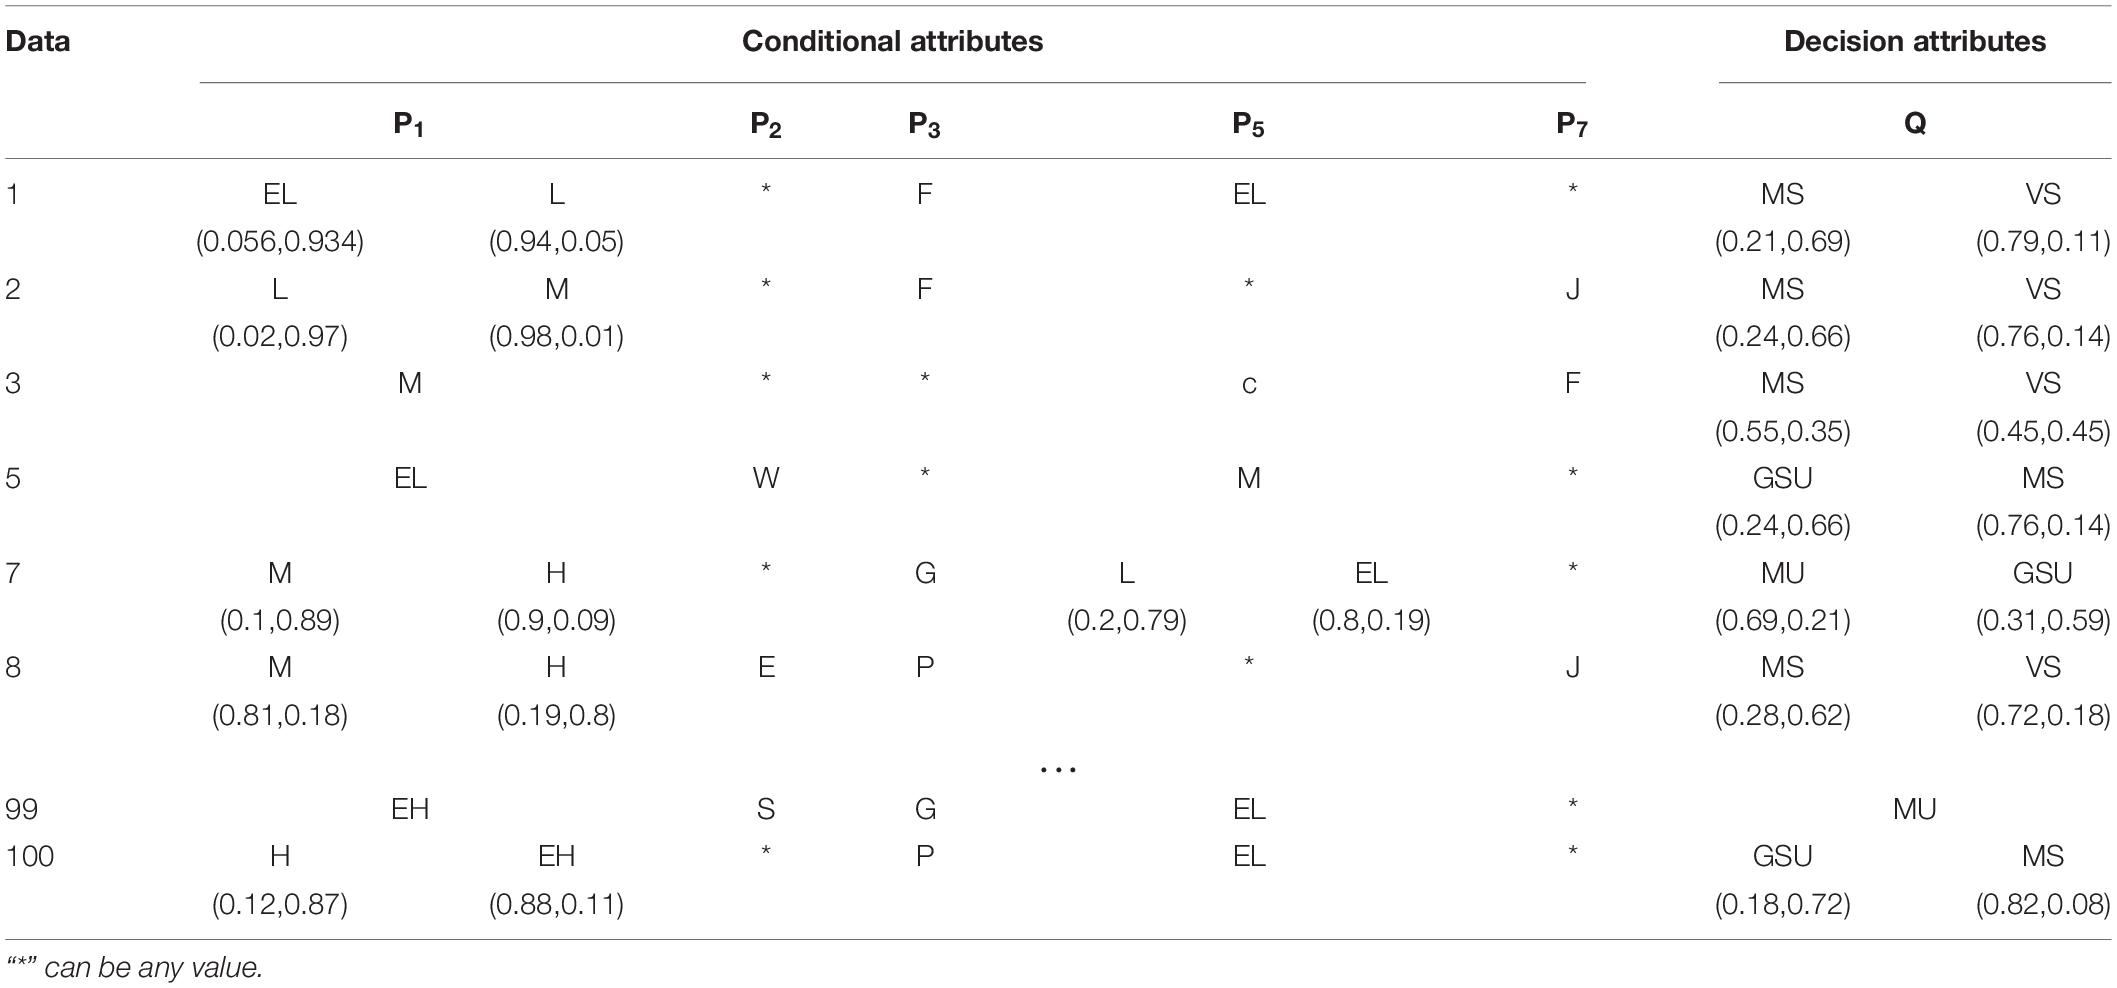
Table 5. Decision rule attributes table.
After obtaining the reduced decision rule table, the first and second rules are taken as an example: the first rule shows that when the system is in the peak period of electricity consumption with extremely low temperature and low wind speed, the system consumption state is VS. The second rule shows that during the peak electricity consumption period in January when the wind speed is moderate, the system consumption state is VS.
Matching the intuitionally fuzzy forecast data with the decision rule set, and considering the capacity of energy storage units to further determined the result, the state of the EHHS can be divided.
Result Analysis
In mode 1, the result of the system consumption state is shown in Figure 11.
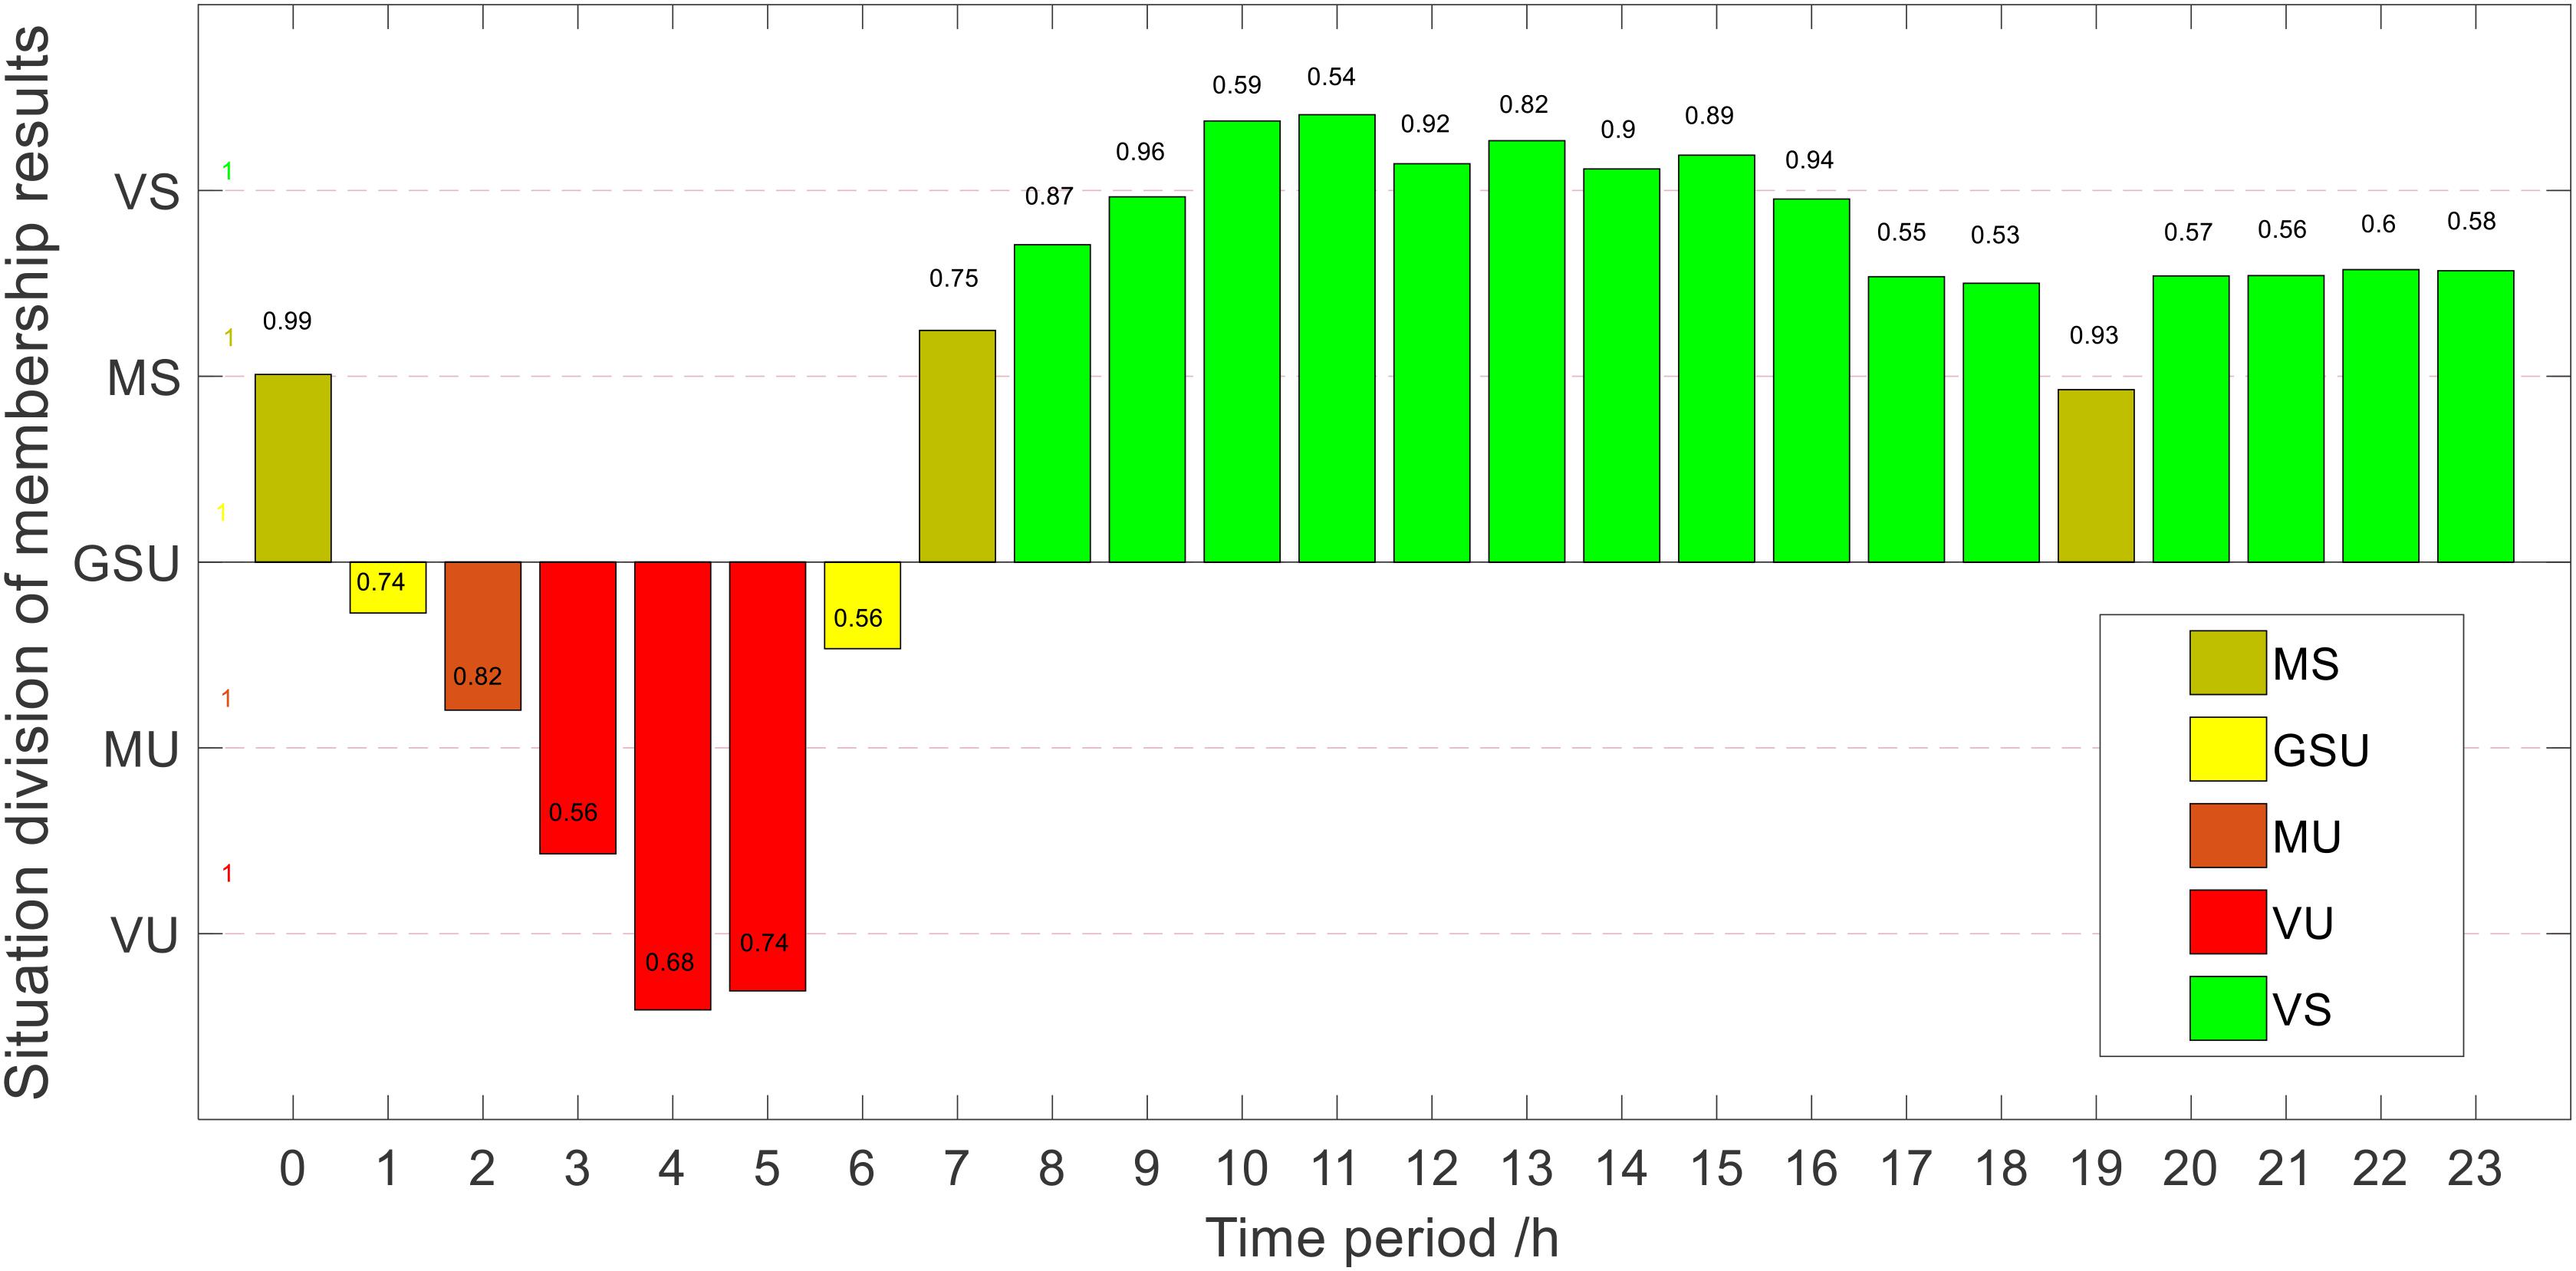
Figure 11. The division result of consumption states of the electricity heat hydrogen system (EHHS) in mode 1.
In mode 1, when the state is MS, compared with the previous division method, the division method can more accurately determine the system optimization method. Take 7 and 19 as an example, the membership degrees of these two periods belong to MS. When the scheduling period is 7, the membership degree of MS is 0.75 and is closer to VS., so the MCU is used to provide power. At 19 o’clock, the optimized method is using EHU to optimize the system.
In addition to the advantage of the above division, at 2 o’clock, mode 2 determines that the system is in an emergency state and the electric boiler is used to help consume wind power. While in mode 1, combined with intuitive judgment, the system consumption state is MU. From the perspective of the optimized results after division, the optimization of the system in mode 1 can meet the demand for complete consumption, while there is a certain amount of abandonment in mode 2. It can be seen that under the new division method, not only the consumption state of the system can be divided more comprehensively, but also it can be judged more accurately.
Dividing the system consumption state based on the intuitionistic fuzzy rough set theory can comprehensively divide the system consumption state, and the optimization method of the current system can be accurately selected.
In mode 1, the output of each unit in the system is shown in Figure 12.
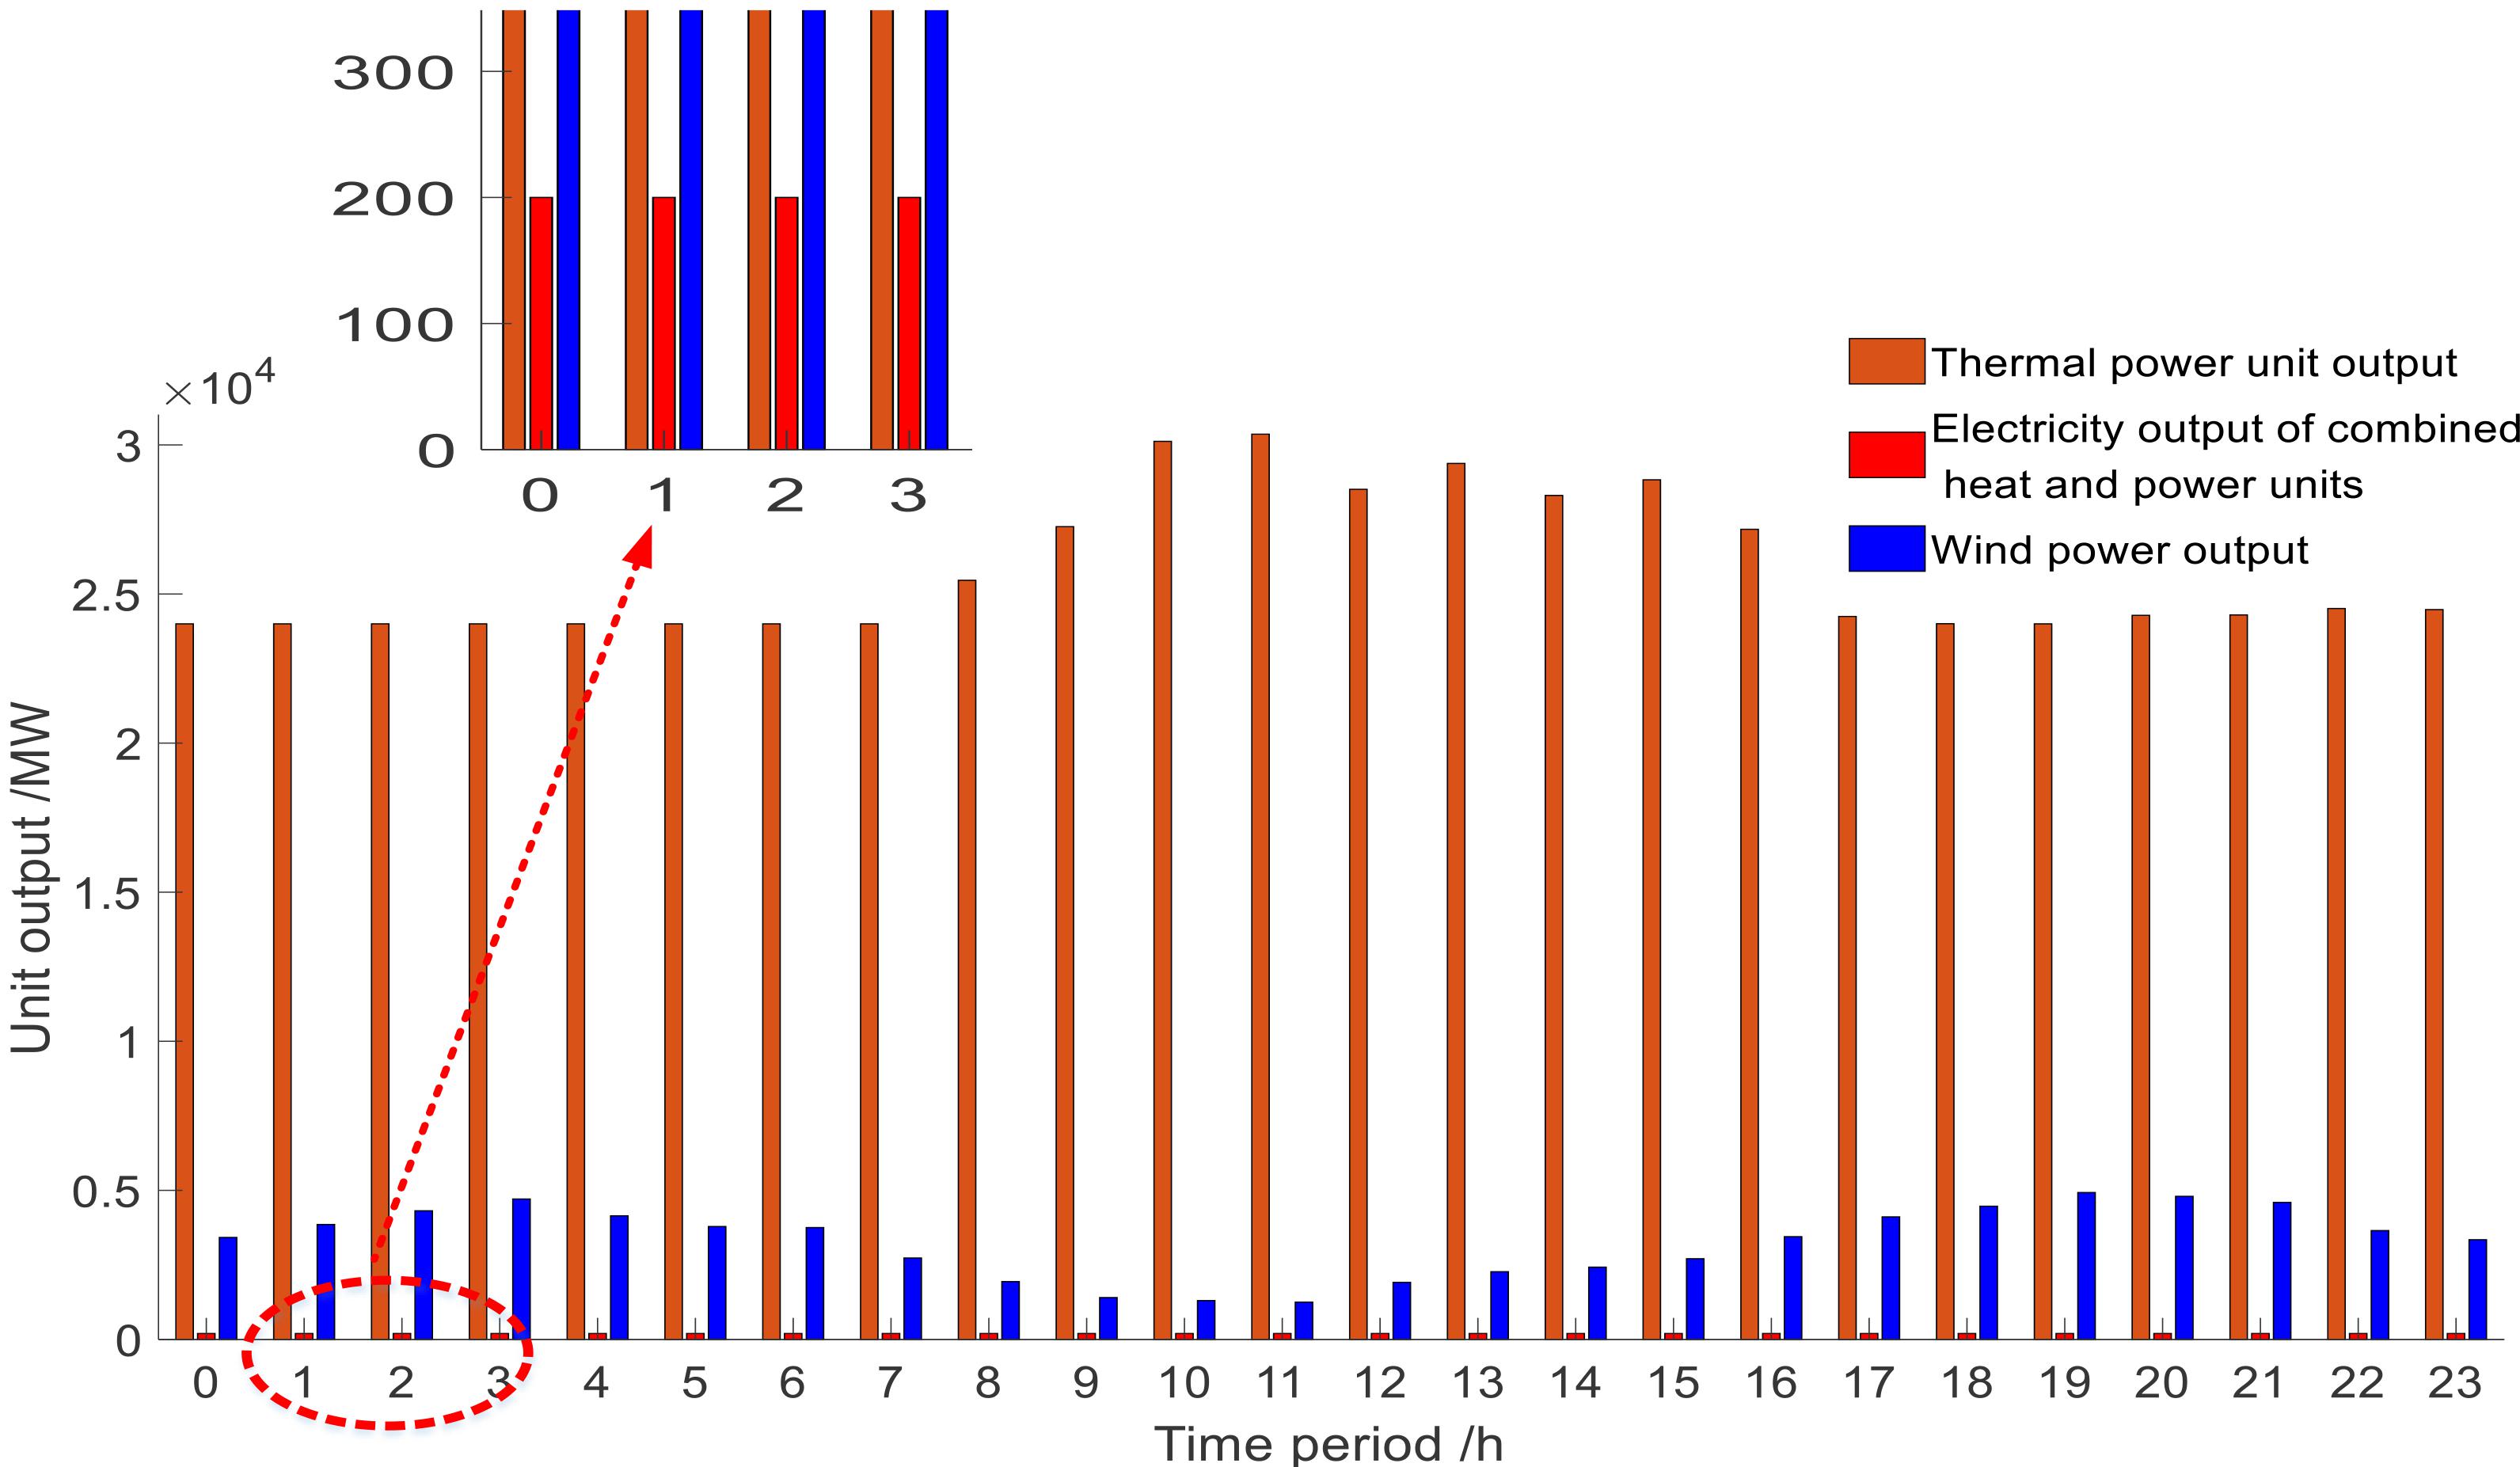
Figure 12. Units output in mode 1.
In Figure 12, when the system is in a state that is less suitable for consumption, in order to increase the wind power consumption, the output of the conventional units is usually reduced. When in a state that is more suitable for consumption, the system can consume all the wind power. Because the output of the thermal power units is not reduced to the minimum output, the system still has a certain consumption potential. In addition, due to the participation of the HHES, the TSU can supply the heat load, and the cogeneration unit output can be reduced, and the overall economy is improved.
In mode 1, the changes in capacity of the HSU and the TSU are shown in Figure 13. The consumption and output of the EHU, MCU, and the EBU are shown in Figures 14.
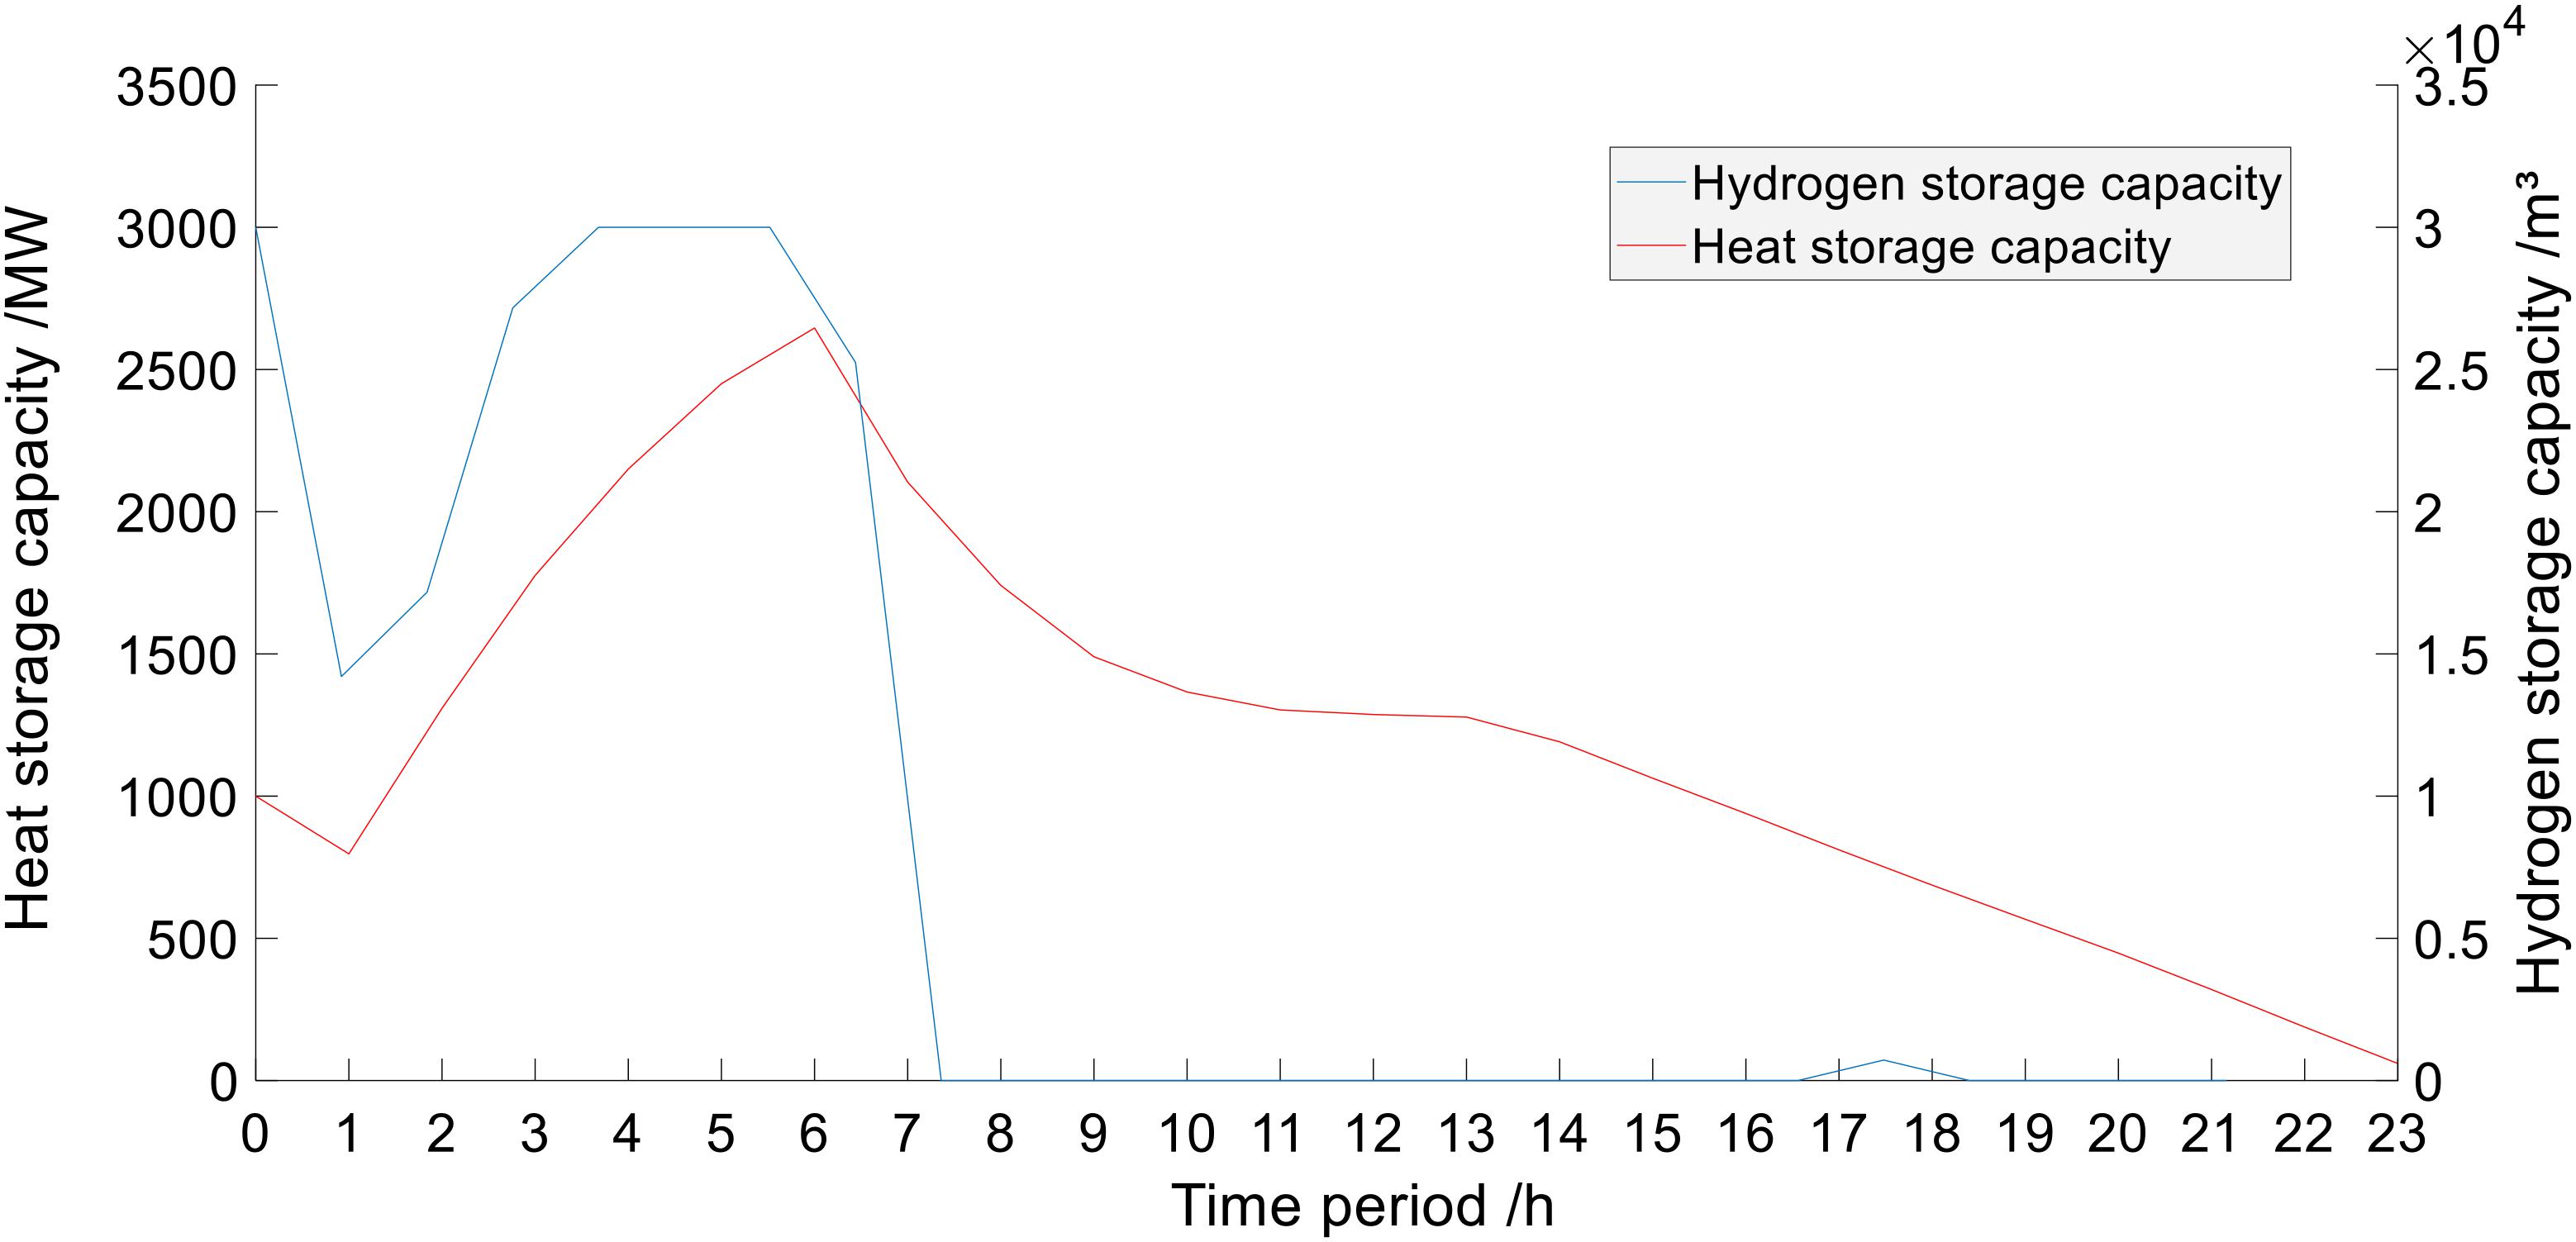
Figure 13. Changes in capacity of the hydrogen storage unit (HSU) and thermal storage unit (TSU).
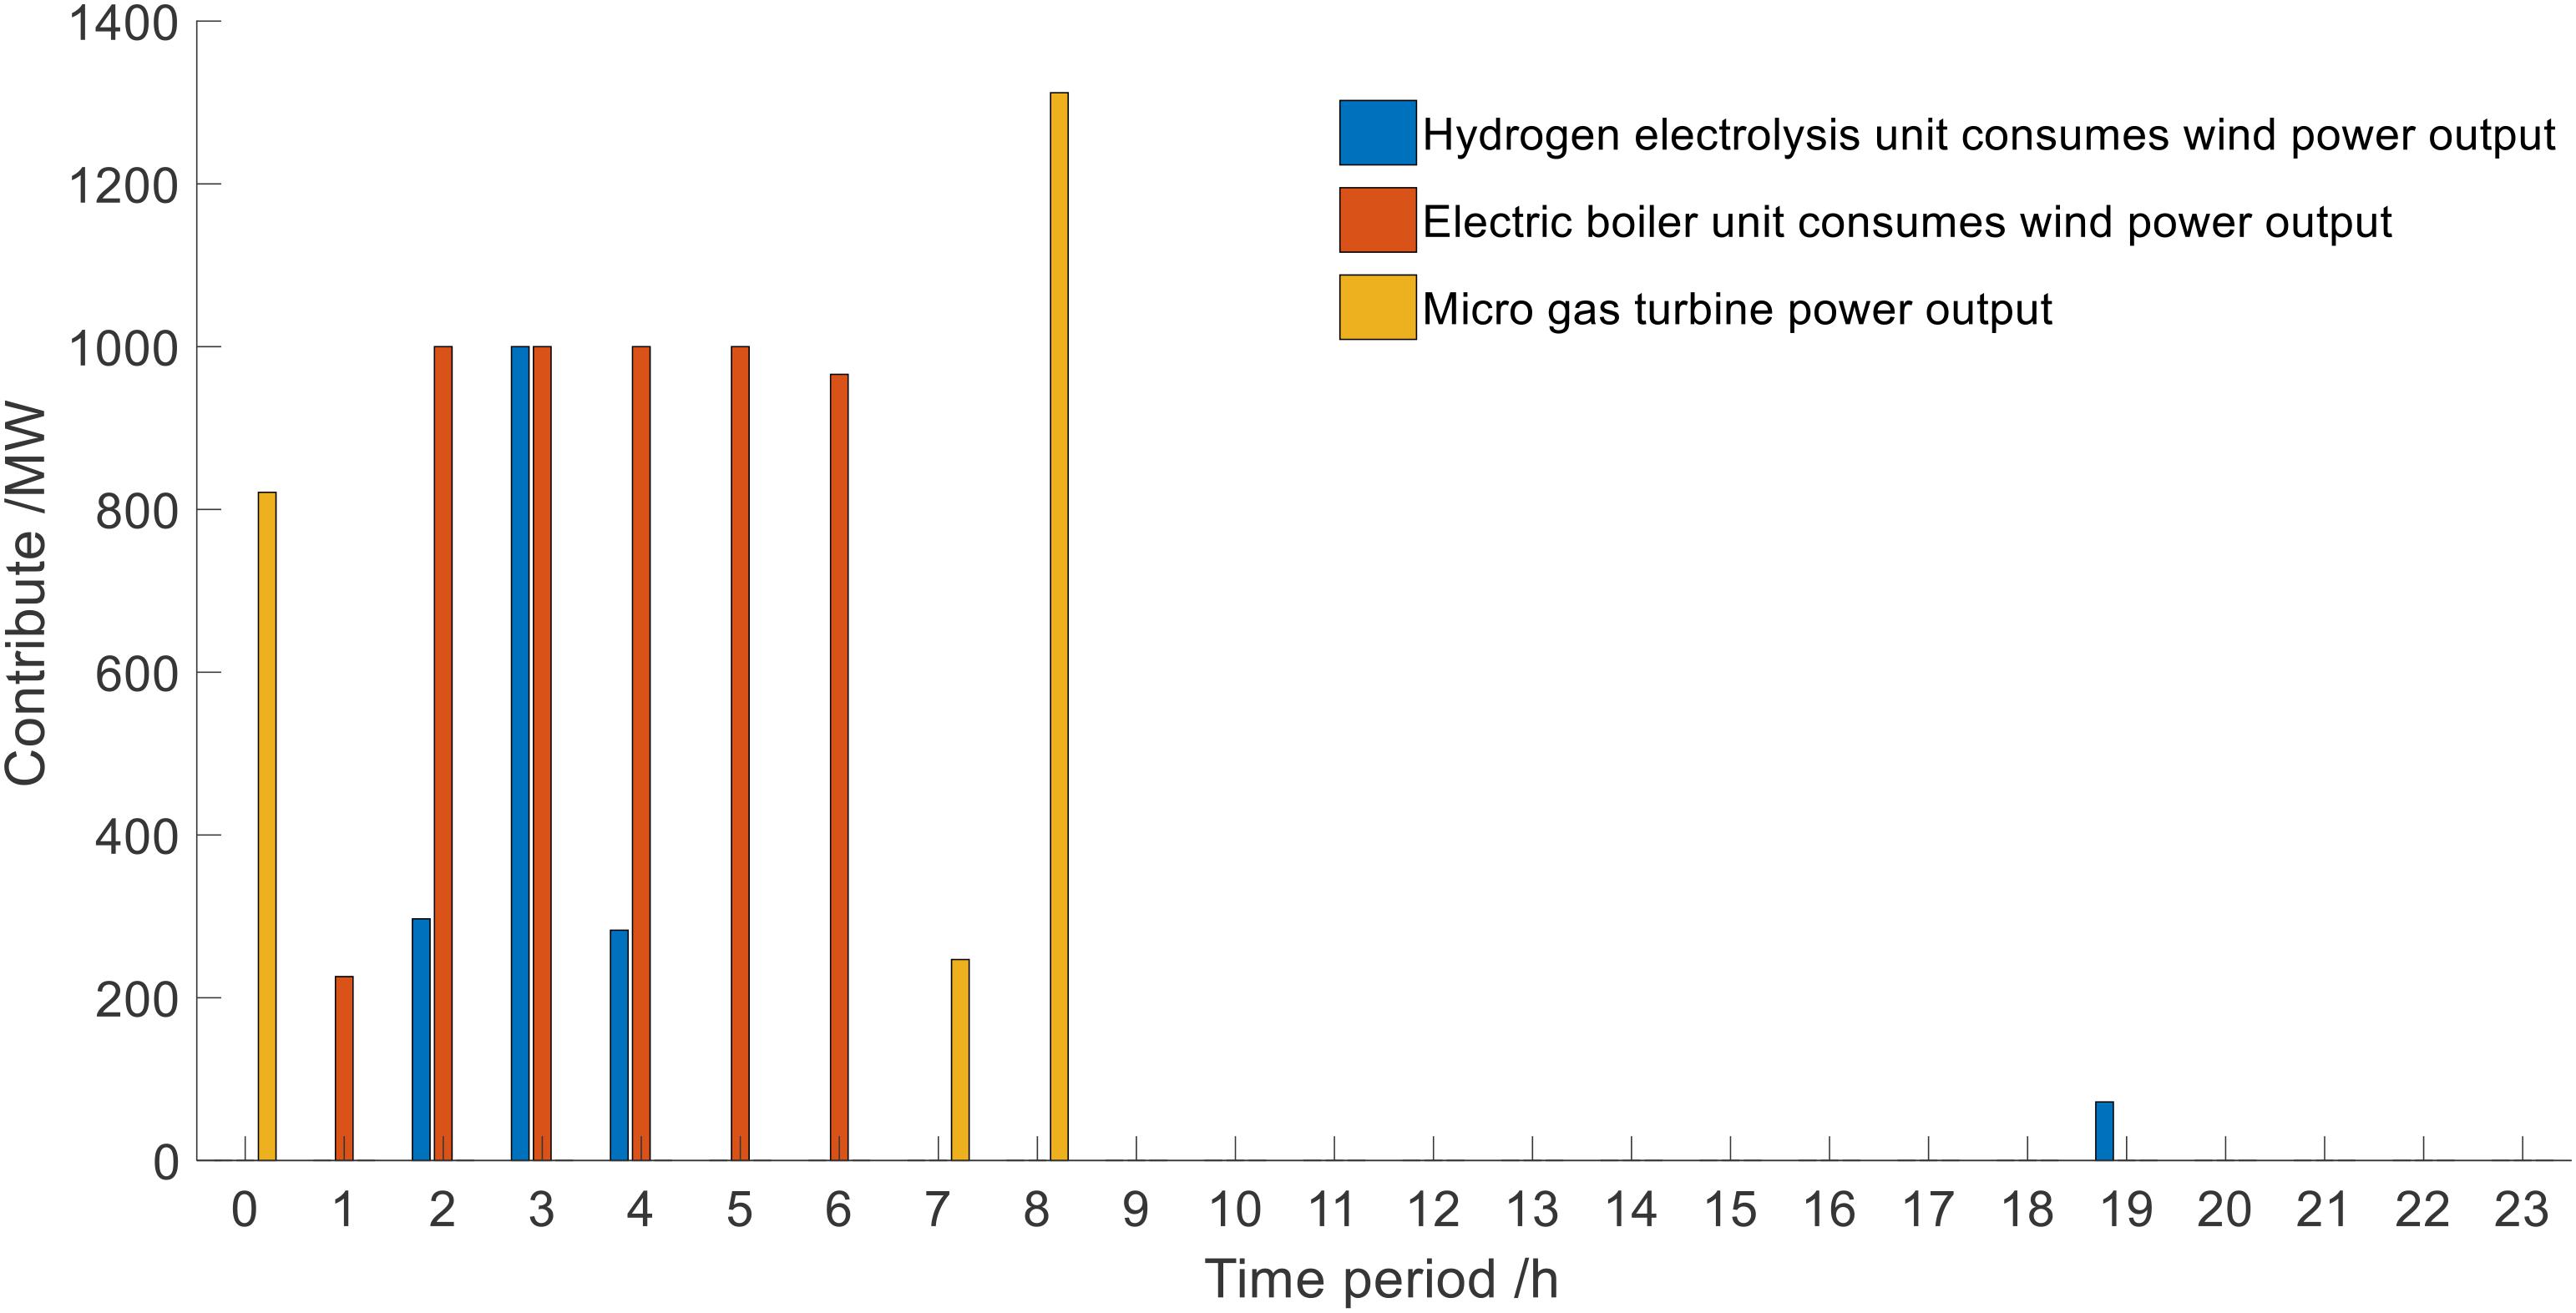
Figure 14. Consumption and output of the electrolytic hydrogen unit (EHU), microturbine cogeneration unit (MCU), and electric boiler unit (EBU).
It can be seen from Figures 13, 14 that when the state is VS, the MCU is working, but its operation is affected by the capacity of the HSU. The heat load of the system can also be supplied by the heat in the TSU. When the capacity of the HSU and the TSU do not meet the demand for consumption, the wind power will be abandoned.
Under different modes, the wind power consumption curve is shown in Figure 15.
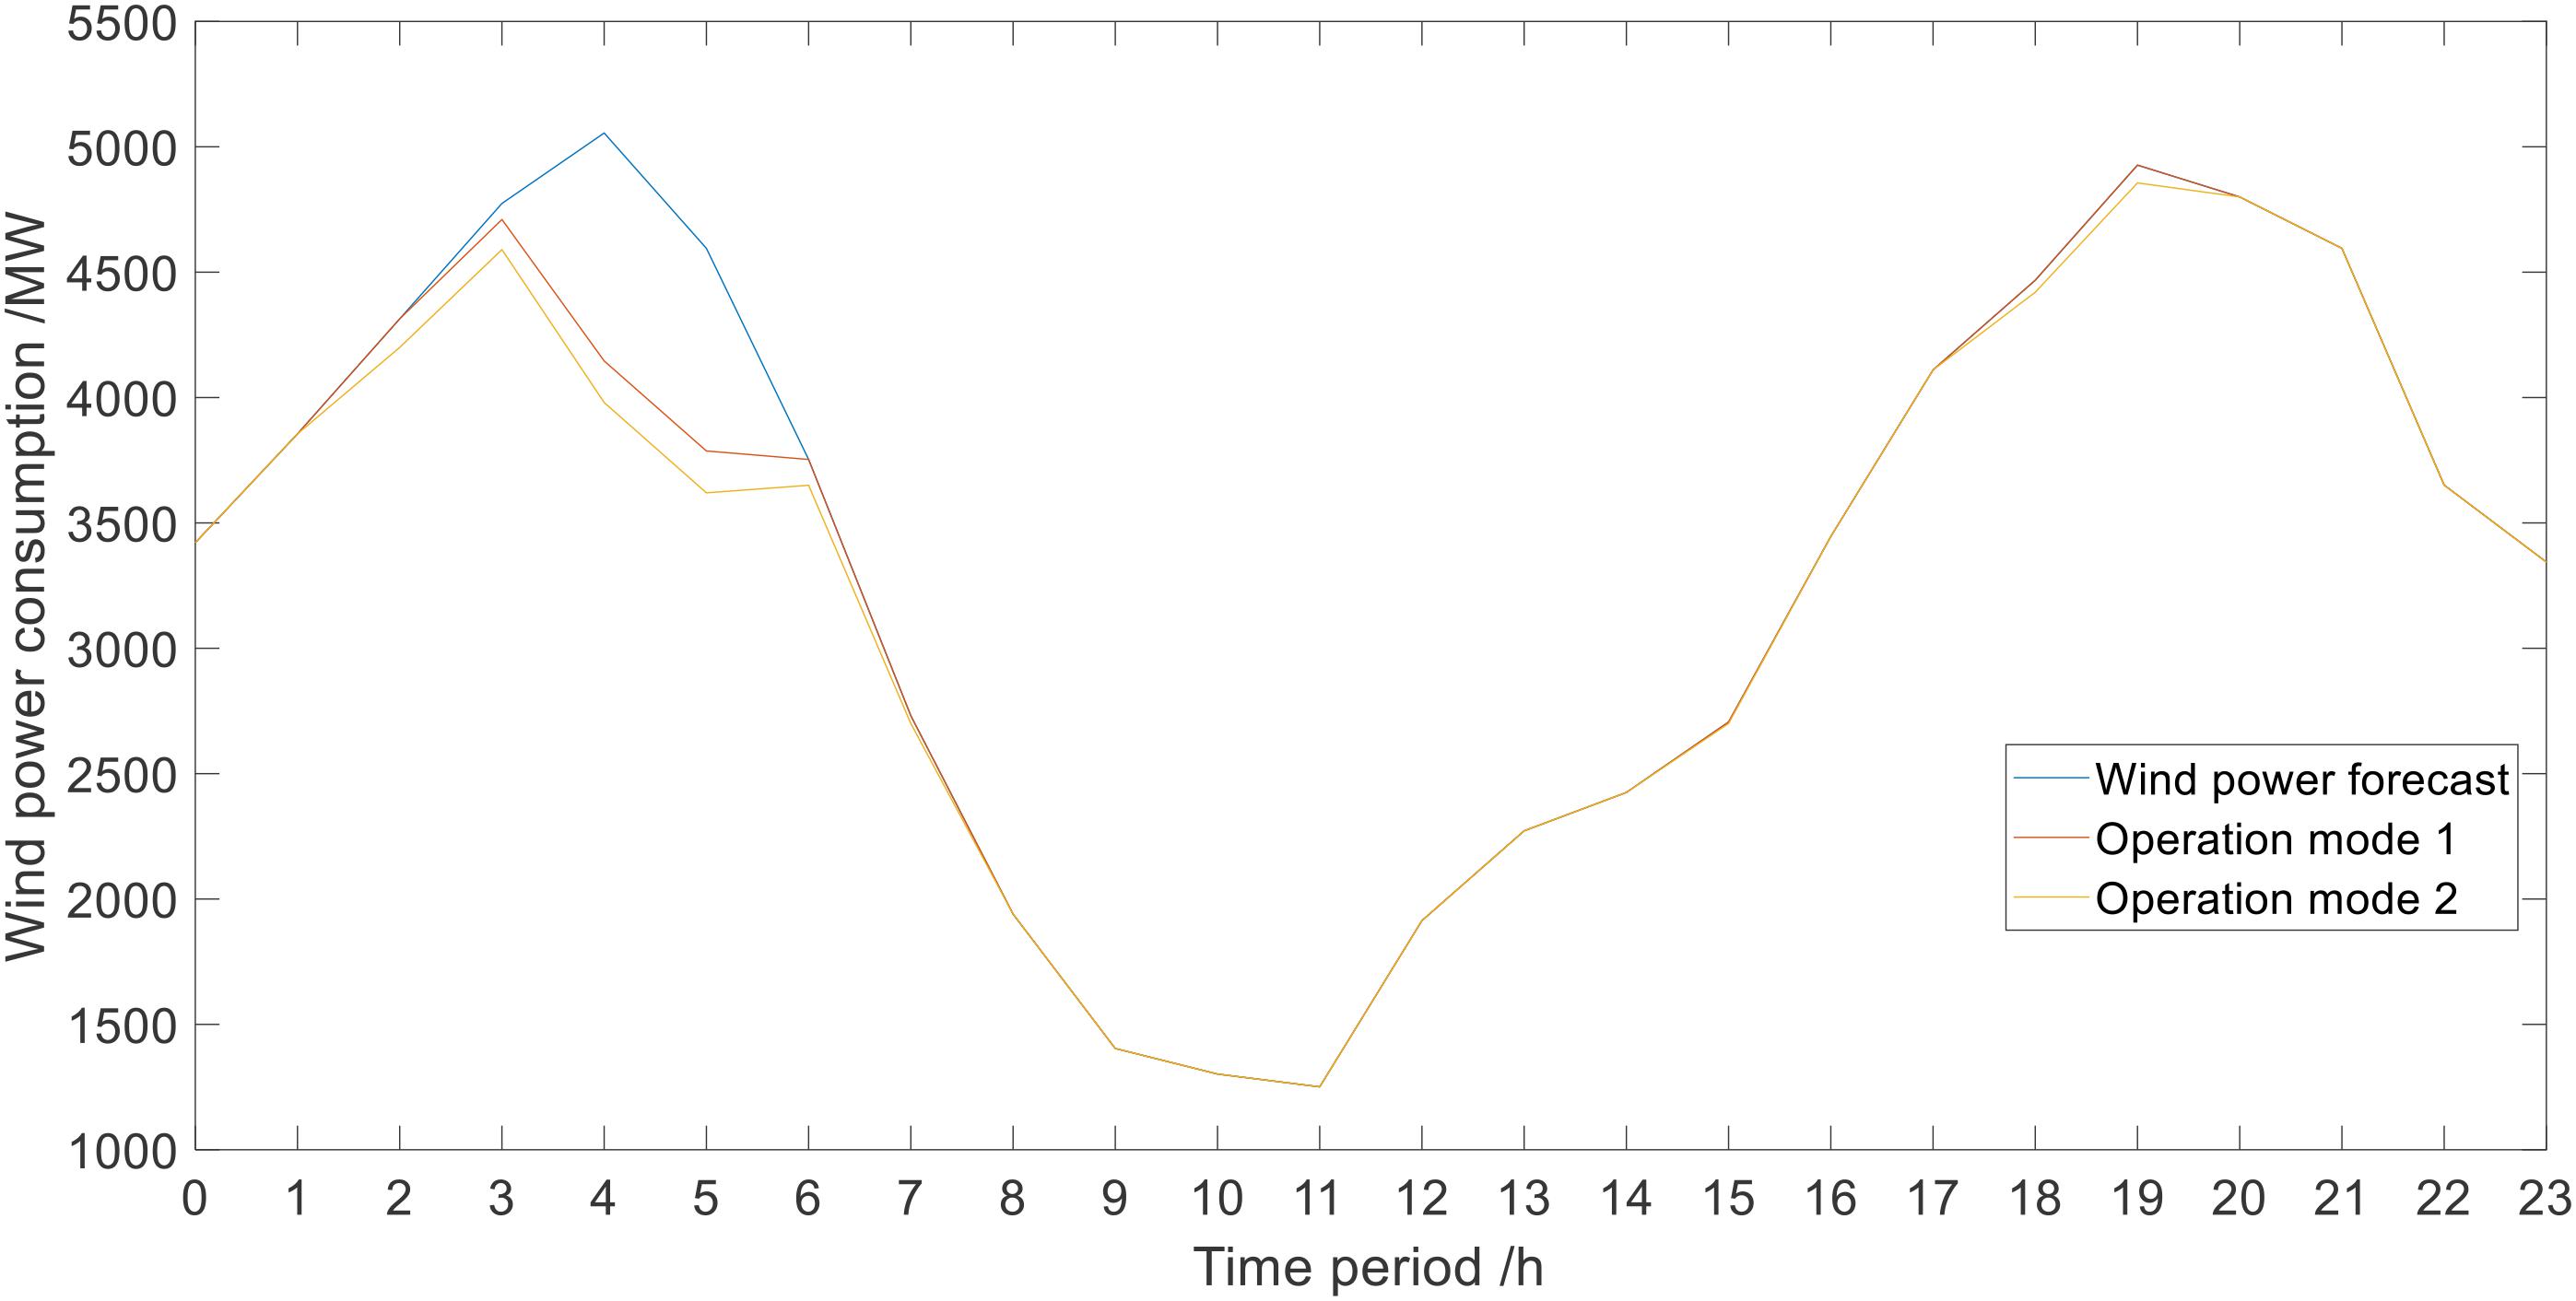
Figure 15. Wind power consumption results under different modes.
From the optimization results in the Figure 15, on the basis of the new energy consumption state division, the wind power consumption can be significantly increased. Because the consumption state is divided before the optimization, the system is more suitable for consumption. The state in VS, MS, and GSU can meet the demand for complete consumption. When in MU and VU, the consumption demand during these periods can also be improved. Under the new division method, the division is more accurate and the optimization goals in each state can be more accurately achieved.
Conclusion
Aiming at the problem of blunt and inaccurate state division in the past, a dynamic state division method based on intuitionistic fuzzy rough set theory is established. The HHES is introduced to coordinate and cooperate with each unit, and a staged optimization model based on the division of the consumption state is established. Through analysis and comparison, a series of advantages of this model are obtained.
(1) Because the application of the EHU, HSU, and TSU in the EHHS has good economic and environmental protection, it has broad prospects in the application and development in the future energy market.
(2) Using intuitionistic fuzzy rough set theory to determine the system state, which can determine the consumption state more flexibly and accurately, it has obvious advantages in dealing with uncertain boundaries between various states.
(3) On the basis of dynamic division, the optimization effect is more obvious, and it has advantages of improving system operation economy and increasing wind power consumption.
Data Availability Statement
The original contributions presented in the study are included in the article/supplementary material, further inquiries can be directed to the corresponding author/s.
Author Contributions
XL conceived the idea for the manuscript and wrote the manuscript with input from XZ and WZ. All authors have read and agreed to the published version of the manuscript.
Funding
This work was supported by the National Key R&D Program of China (2018YFA0702200) and Fundamental Research Funds for the Central Universities (N2004013).
Conflict of Interest
The authors declare that the research was conducted in the absence of any commercial or financial relationships that could be construed as a potential conflict of interest.
References
Chen, X., Rong, S., Guan, W., Hao, W., and Xu, M. (2020). Multi-source coordinated dispatching strategy for promoting wind power consumption. Heilongjiang Electr. Power 42, 480–486. doi: 10.13625/j.cnki.hljep.2020.06.003
Chen, Y., Xu, J., Shi, J., and Liu, Y. (2020). Three-branch decision model based on intuitionistic hesitation fuzzy set and its application. Comput. Sci. 47, 144–150.
Diao, H., Li, P., Wang, J., Wang, D., and Li, Z. (2020). Optimal scheduling of integrated energy system considering complementary coordination of electric and thermal energy storage. Trans. China Electrotechnical Soc. 35, 4532–4543. doi: 10.19595/j.cnki.1000-6753.tces.191340
Ge, W., Zhang, Y., Gao, C., Gao, K., Liu, X., and Ma, G. (2019). The phased optimization strategy of source-load storage system based on situation division of wind power consumption capacity. Autom. Electr. Power Syst. 43, 26–33.
Jiang, Y., and Ma, Y. (2020). Application of hybrid particle swarm and ant colony optimization algorithms to obtain the optimum homomorphic wavelet image fusion: introduction. Ann. Transl. Med. 8:1482. doi: 10.21037/ATM-20-5997
Kumar, A., and Prasad, P. S. V. S. S. (2020). Scalable fuzzy rough set reduct computation using fuzzy min-max neural network preprocessing. IEEE Trans. Fuzzy Syst. 28, 953–964. doi: 10.1109/TFUZZ.2020.2965899
Li, H., Yu, G., Tian, C., and Shang, G. (2020). An emergency decision making method based on fuzzy language TOPSIS. J. Univ. Chin. Acad. Sci. 37, 814–819.
Liu, W., Wen, J., Xie, C., Wang, W., and Liang, C. (2015). Power system source-load coordination multi-objective optimization method considering wind power consumption. Proc. Chin. Soc. Electri. Eng. 35, 1079–1088. doi: 10.13334/j.0258-8013.pcsee.2015.05.008
Liu, Z., Qin, Z., Zhu, P., and Li, H. (2020). An adaptive switchover hybrid particle swarm optimization algorithm with local search strategy for constrained optimization problems. Eng. Appl. Artif. Intell. 95:103771. doi: 10.1016/j.engappai.2020.103771
Lu, X., and Song, W. (2020). Research on application of hybrid particle swarm algorithm in distribution network optimization. Small Microcomput. Syst. 41, 1788–1792.
Ren, X., and Xue, F. (2018). A heuristic attribute reduction algorithm based on fuzzy neighborhood rough set. Comput. Eng. Appl. 54, 47–53.
Shu, Y., Zhigang, Z., Guo, J., and Zhang, Z. (2017). Analysis of key factors and solutions of new energy consumption. Proc. Chin. Soc. Electri. Eng. 37, 1–8. doi: 10.13334/j.0258-8013.pcsee.162555
Sun, H. (2021). Hydrogen energy is arousing great attention all over the world. Int. J. Hydrog. Energy 46, 2845–2846. doi: 10.1016/J.IJHYDENE.2020.08.212
Sun, H., Zhang, W., and Lei, Z. (2019). “Research on wind power consumption dispatching based on improved whale optimization algorithm,” in Proceedings of the International Conference on Intelligent Automation, (Berlin: Springer), 506–514.
Teng, Y., Sun, P., Luo, H., and Chen, Z. (2019a). Autonomous optimization operation model of multi-source microgrid considering electric and thermal hybrid energy storage. Proc. Chin. Soc. Electri. Eng. 39, 5316–5324. doi: 10.13334/j.0258-8013.pcsee.181922
Teng, Y., Wang, Z., Li, Y., Ma, Q., Hui, Q., and Li, S. (2019b). Multi-energy storage system model based on electricity heat and hydrogen coordinated optimization for power grid flexibility. CSEE J. Power Energy Syst. 5, 266–274. doi: 10.17775/CSEEJPES.2019.00190
Wei, D., Xu, D., and Zhang, Y. (2020). A fuzzy evidential reasoning-based approach for risk assessment of deep foundation pit. Tunn. Undergr. Space Technol. 97:103232. doi: 10.1016/j.tust.2019.103232
Wu, D., Cheng, H., Zhao, J., Geng, J., and Hou, W. (2019). Wind power segmentation and thermal power peaking compensation method based on balancing cost. Autom. Electr. Power Syst. 43, 116–123.
Wu, Y., Guo, W., Tang, J., and Ren, Y. (2019). Summary of research on attribute reduction of several types of extended rough set models. J. Yibin Univ. 19, 29–38. doi: 10.19504/j.cnki.issn1671-5365.20190531.001
Xi, L., Wu, J., Xu, Y., and Sun, H. (2020). Automatic generation control based on multiple neural networks with actor-critic strategy. IEEE Trans. Neural Netw. Learn. syst. 99, 1–11. doi: 10.1109/TNNLS.2020.3006080
Xi, L., Yu, L., Xu, Y., Wang, S., and Chen, X. (2019). A novel multi-agent ddqn-ad method-based distributed strategy for automatic generation control of integrated energy systems. IEEE Trans. Sustain. Energy 11, 2417–2426. doi: 10.1109/TSTE.2019.2958361
Yang, J., Zhang, N., Wang, Y., and Kang, C. (2018). Multi-energy systems for renewable energy consumption: review and prospects. Autom. Electr. Power Syst. 42, 11–24.
Yang, Q., Zhi, C., Yuan, D., and Yang, H. (2020). Low carbon economic dispatching of wind power consumption based on coordinated heating of power off boiler and heat storage device. Acta Energiae Solaris Sinica 41, 21–28.
Zhan, J., and Sun, B. (2020). Covering-based intuitionistic fuzzy rough sets and applications in multi-attribute decision-making. Artif. Intell. Rev. 53, 671–701. doi: 10.1007/s10462-018-9674-7
Zhang, L., Zhan, J., Xu, Z., and Alcantud, J. C. R. (2019). Covering-based general multigranulation intuitionistic fuzzy rough sets and corresponding applications to multi-attribute group decision-making. Inf. Sci. 494, 114–140. doi: 10.1016/j.ins.2019.04.054
Zhang, P., Chen, X., and Fan, C. (2020). Research on a safety assessment method for leakage in a heavy oil gathering pipeline. Energies 13:1340. doi: 10.3390/en13061340
Zhang, R., Jiang, T., Li, G., Chen, H., Li, X., and Ning, R. (2018). Double-layer optimal dispatching of electricity-gas integrated energy system considering wind power conversion from electricity to gas. Proc. Chin. Soc. Electri. Eng. 38, 5668–5678. doi: 10.13334/j.0258-8013.pcsee.172310
Zhang, Y., Lu, Q., Zhang, N., Wang, H., Liu, L., and Sun, H. (2020). Research on coordinated operation of electric-heat peak shaving resources for wind power consumption. Power Syst. Technol. 44, 1350–1362. doi: 10.13335/j.1000-3673.pst.2019.1796
Keywords: electricity heat hydrogen hybrid system, intuitionistic fuzzy rough set, determination results of consumption state, optimal scheduling, new energy consumption
Citation: Liu X, Zhao X and Zhong W (2021) Research on Optimal Operation of Electricity Heat Hydrogen System Based on Evaluation of New Energy Consumption Potential. Front. Energy Res. 9:674943. doi: 10.3389/fenrg.2021.674943
Received: 02 March 2021; Accepted: 19 March 2021;
Published: 23 April 2021.
Edited by:
Lei Xi, China Three Gorges University, ChinaCopyright © 2021 Liu, Zhao and Zhong. This is an open-access article distributed under the terms of the Creative Commons Attribution License (CC BY). The use, distribution or reproduction in other forums is permitted, provided the original author(s) and the copyright owner(s) are credited and that the original publication in this journal is cited, in accordance with accepted academic practice. No use, distribution or reproduction is permitted which does not comply with these terms.
*Correspondence: Xinrui Liu, bGl1eGlucnVpQGlzZS5uZXUuZWR1LmNu