 Jingxuan Liu
 Lin Teng
 Bin Liu
 Peng Han1
- 1School of Mechanical Engineering, Shijiazhuang Tiedao University, Shijiazhuang, Hebei, China
- 2College of Chemical Engineering, Fuzhou University, Fuzhou, Fujian, China
- 3Industrial Technology Research Institute, Chongqing University, Chongqing, China
The lack of hydrogen (H2) transportation infrastructure restricts the development of the H2 industry. Owing to the high investment of building specific facilities, using existing natural gas (NG) pipelines to transport a blend of H2 and NG (H2NG) is a viable means of transportation and approach for large-scale long-time storage. However, variation in the thermo-physical properties of an H2NG blend will impact the performance of pipeline appliances. To address the gaps in H2 transmission via an NG system in the context of energy consumption, in the present paper, a one-dimensional pipeline model is proposed to predict the blended flow in a real existing pipeline (Shan–Jing I, China). The data of NG components were derived from real gas fields. Furthermore, the influence of H2 fractions on pipeline energy coefficient and the layout of pressurization stations are comprehensively analyzed. In addition, the case of intermediate gas injection is investigated, and the effects of injection positions are studied. This study serves as a useful reference for the design of an H2NG pipeline system. The present study reveals that with the increasing in H2 fraction, the distance between pressure stations increases. Furthermore, when the arrangement of original pressure stations is maintained, overpressure occur. Intermediate gas injection results in the inlet pressure of subsequent pressurization stations reducing. Using existing pipeline network to transport H2NG, it is necessary to make appropriate adjustment.
Highlights
• A one-dimensional model for high-pressure hydrogen–natural gas (NG) mixture transportation.
• Studying the effects of hydrogen injection on the performance of an existing NG pipeline.
• Investigating the influence of intermediate gas injection.
Introduction
It is acknowledged that the large-scale use of fossil fuels directly causes global greenhouse gas (GHG) emissions and, as such, strategies are required to eliminate these emissions to meet carbon-neutral targets (Hengxuan et al., 2021; Mauricio et al., 2021). Although renewable energies such as solar, wind, and tidal energies may produce net-zero carbon emissions, their effectiveness is intermittent and consequently cannot be used as dispatchable energy sources. Accordingly, the widespread use of such energies will require the development of energy carries also without significant carbon production, such as batteries, compressed air, hydrogen (H2) etc (Cherigui et al., 2008; Mah et al., 2019; Nadaleti et al., 2020). Among these energy carries, H2 is typically viewed as the most promising energy carrier due to its superior features, such as high energy density and low energy loss during its storage process. In addition to being an energy carrier, H2 can also be applied as a clean, efficient, and versatile form of energy. Hence, using H2 as an energy carrier is likely to flourish in the near future (Reuß et al., 2019).
Apart from viewed as an energy carrier, H2 itself can also be applied as an energy source. H2 is superior in terms of linking the characteristics in a range of application scenarios, such as electricity–gas conversion; it is also useful as a natural gas (NG) energy supplement, a heat supply, and for use in green transportation. The development of H2 end-use products and the construction has become pivotal factors for improving the competitiveness and sustainable development of an H2 industry (Chintala and Subramanian, 2017). A sketch of the process from H2 production to its comprehensive application as an energy source is shown in Figure 1 (Nadaleti et al., 2020). Currently, among various H2 applications, H2 fuel cell (HFC) technology represents the highest energy efficiency. This technology emits only water and warm air, producing no harmful tailpipe emissions, and is conducive to managing an H2 society and improving the public acceptance of H2 energy (Zhou et al., 2020). To date, HFC is mainly employed for vehicle powering systems following rapid development in the past decade. Hence, driven by policy and commercial interests, it is expected that in the next few years, the number of terminal H2 users (e.g., hydrogenation stations) will increase sharply (Wang et al., 2021). However, the popularization of hydrogenation stations requires significant investment (Kendall, 2018), and the current insufficient infrastructure restricts the promotional progress of HFC vehicles.
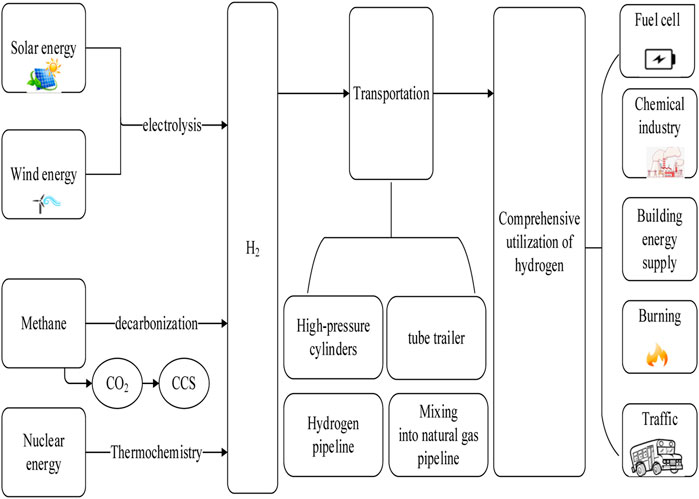
FIGURE 1. The process from H2 production to application.
There are still several major issues that limit the popularization of H2 technology, including H2 transportation. The uneven distribution of H2 between production sites and end-users leads to the inevitable need for long-distance transportation. At present, H2 itself is primarily stored in large vessels and high-pressure tanks and conveyed by trucks or other vehicles (Cerniauskas et al., 2020). However, these approaches are far from adequate for transporting large quantities of H2 over long distances in the future. Although the initial investment is higher, pipeline transmission rates as the most efficient and economical way for large quantities of fluid transportation over long distances, and can also be applied for high-pressure pipeline H2 transportation (Qingmei et al., 2019). However, the long construction period required for new H2 pipelines may restrict the proliferation of the H2 energy industry to some extent. Ogden et al. (2018) proposed a transitional method using existing NG pipeline networks to transport blends of H2 and NG (H2NG), rather than constructing specific pipelines for H2 delivery. Research related to H2NG systems has attracted increasing attention in recent years. Quarton et al. (Quarton and Samsatli, 2020) evaluated the opportunities and challenges of H2 injection into NG distribution systems and found that the system was able to support a share of the H2 injection. The researchers stated that H2NG could make use of the inherent flexibility provided by the NG network in the low-carbon future, which also presents a feasible strategy for maintaining and serving decarbonization of the NG grid. Timmerberg et al. (Timmerberg and Kaltschmitt, 2019) analyzed the economy of H2 production from wind and solar power in North Africa and employed an existing pipeline to transport H2NG. They found that using the pipeline to convey H2 presented an economically competitive option. The current distribution grid of NG pipelines is reasonably mature. It is, however, necessary to improve and enhance pipeline safety management systems, standards, regulations, and technical expertize for transporting H2 using existing NG pipelines (Chen et al., 2021).
The existence of H2 in blended form increases the critical pressure and decreases the critical temperature of the mixture (Ali et al., 2020). The specific energy per volume of H2 is significantly lower compared with the main component of NG (i.e., methane (CH4) at a given pressure. Accordingly, when transporting an equal amount of burning energy (typically using a calorific value), an H2NG pipeline will need to manage a higher pressure. Following H2 injection, the physical properties of a mix can vary greatly, which will influence the hydraulic and thermal characteristics of the pipeline. Elaoud et al. (2017) pointed out that injection of H2 into NG had a significant influence on the transient pressure of the gas mixture, accordingly affected the flow characteristics of existing NG pipeline significantly. Therefore, the variation in flow characteristics inside the pipeline caused by changes in thermophysical properties requires further study. However, the effects of an H2NG-blend’s properties on pipeline transportation and, therefore, on gas network operation and management, have to date not been studied in detail. There may be numerous unforeseen issues when using an existing pipeline to directly transport an H2NG blend. It is thus necessary to comprehensively study and evaluate the flow in the pipeline before such a system is practically applied (Lu, 2011).
Pressure drop is an important index for evaluating the flow characteristics of a gas pipeline. Pressure drop is a function of the density and the average velocity of the gas in the pipe. Therefore, when a gas mixture composition varies from that of NG, the volume flow rate (velocity) will vary. Additionally, with H2 injection, the energy consumption of pipeline transportation will increase; accordingly, safety may be reduced. Hence, the combined effect of more than one gas should be evaluated when considering the injection of H2 in different parts of a pipeline (Quarton and Samsatli, 2020). Several researchers have studied the effect of H2 injection on parameters related to existing pipelines. The results of (Chang, 2018) illustrated that with an increase in H2 fraction and gas consumption, the pressure drop increased compared with flow comprising NG only. Witkowski et al. (2017) created a one-dimensional model to analyze H2NG-blended gas flow in a high-pressure pipeline. The results revealed that with an increase in H2 volume fraction, the density and velocity of gas mixture decreased and the pressure loss also decreased.
Because pressure along the pipeline will decrease gradually, pressurization stations are required to compensate for the distance-related pressure drop in the transportation process; these stations are responsible for the separation, measurement, and pressure regulation of gas flow. Therefore, whether the existing pressurization equipment and pressurization station distribution can meet the transportation requirements of H2NG must be reviewed. Deymi-Dashtebayaz et al. (2019) stated that the H2 injection improved the upper and lower flammability limits and compressibility factor of gas mixture, along with the relative density decrease with hydrogen concentration increase. Accordingly, new requirements were put forward for the adaptability and safety of equipment such as pipelines, compressors, and valves, which require additional study. Sherif et al. (2005) stated that the distance between the pressurization stations required adjustment for H2 injection, the maximum distance may be double that of the original. Uilhoorn (2009) studied the non-isothermal transient flow in the Yamal–European NG pipeline with H2 injection in Poland. The study found that the presence of H2 reduced the pressure and temperature gradient of the pipeline, and the compressor power of H2NG decreased under the same energy demand compared with only NG. Haeseldonckx et al. (Haeseldonckx and D’haeseleer, 2006) studied the application of existing NG pipeline infrastructures to transport H2 and found that H2 injection would have adverse effects on the use and short-term supply safety of original NG centrifugal compressors, owing to the variation in thermodynamic properties of fluid in pipe.
Previous studies on assessing the impact of H2 injection on existing gas networks focused on the integrity and safety aspects. H2 injection may cause hydrogen embrittlement and lead to a loss of structural integrity in steel (Singh et al., 2018). An increase in H2 partial pressure will raise the possibility of hydrogen embrittlement (Kouchachvili and Entchev, 2018). Meliani et al. (2011) analyzed the effect of H2 on the failure curve of APL 5 L gas pipeline steel from the perspective of notch fracture mechanics. The study results indicated that there existed a critical H2 concentration beyond which the local fracture resistance of the steel decreased considerably. Hafsi et al. (2018) followed the phenomena involved in the dissolution, penetration, and diffusion of H2 molecules into the lattice structure of pipeline materials and showed that preventive measures had to be taken to prevent the risk of explosion caused by hydrogen embrittlement, as well as other effects that may lead to changes in the safety conditions of gas conduction. Li et al. (2020) showed that realization of the hydrogen embrittlement effect in metallic materials was largely assisted by the boundary disruption and local stress state concentrated through the plasticity process. Bouledroua et al. (Omar et al., 2020) pointed out that the hydrogen embrittlement of steel pipelines in contact with an H2 environment, together with the transient gas flow and significantly increased transient pressure values, also increased the probability of failure of a cracked pipeline. Hafsi et al. (2019) simulated the transient flow of H2NG in a loop network using the finite element software COMSOL Multiphysics. The transient overpressure was found to be proportional to the H2 fraction in the blend, and the overpressure promoted circumferential stress and the internal load on the pipe wall. Furthermore, the risk of hydrogen embrittlement observably increased with an increase in over-pressure; hence, safety factors have to be guaranteed to ensure the safety of the H2NG transmission process (Pluvinage, 2021). Liu et al. (2019a) considered that the effect of H2 fraction on the decompression wave speed in an H2NG mixture depended on whether the thermodynamic trajectory intersected with the corresponding phase envelope.
In the actual long-distance pipeline transportation process, complex terrains will inevitably be encountered; furthermore, terrain fluctuation will also have a significant impact on the transportation process. It is important to extract data related to pipeline diameter, length, and corresponding elevation for gas pipeline flow simulation. Geographic information system (GIS) technology can efficiently collect large-scale terrain information data from different areas within a short time, extract geographic elements and pipeline facilities, obtain accurate terrain information and elevation changes along a pipeline, and combine data with computer information technology to establish database management systems, thereby realizing the creation of a parameter database including gas stations and other tools; this will improve the information quality and accuracy of decision-making and monitoring efficiency (Tikhonova et al., 2019). At present, GIS technology plays an increasingly important role in pipeline integrity management, which can solve a series of problems in long-distance pipeline construction and operation, and facilitate the rapid update of pipeline management data (Shay et al., 2016).
When gas is transported through pipelines, energy conversion is inevitable, including heat transfers between the system and the environment, as well as energy dissipation within the system. Generally, the energy consumption of a long-distance pipeline system is represented by the pressure loss of the transported gas. A lower pressure drop means a higher gas transmission efficiency (Zhao et al., 2019). Mitigating energy consumption is of significance for reducing the operating costs of gas transmission systems and improving economic benefits. To analyze the energy consumption of a gas transmission system, the energy loss rate (the energy consumed per unit mass per unit length of the pipeline) is selected as the energy consumption evaluation index of a gas transmission pipeline system.
However, analysis on the transportation characteristics of an H2NG-blend pipeline network has to date been limited; furthermore, there is a lack of research on the distribution of pressurization stations. To address this lack, ASPEN HYSYS was used to establish a one-dimensional pipe flow model in the present study. The Peng–Robinson (PR) equation of state (EOS) is introduced in this model to provide an accurate prediction of the thermophysical properties of H2NG. Additionally, GIS is used to provide pipeline data and topographic information. According to the design specifications of a gas transmission pipeline, stations are arranged at appropriate positions to analyze the influence of transporting gas mixture with different H2 fractions and injecting gas at the middle of the pipeline network system. Furthermore, the pipeline transportation process and exergy analysis are presented in this paper. This study may provide theoretical guidance for the subsequent use of existing NG pipeline networks to transport H2, simultaneously, it also has a positive reference for the subsequent layout design of pressurization station.
Modeling Approach
Gas Component
Thermophysical property discrepancies between CH4 and H2 give rise to different features in pipeline transportation and also affect flow and heat transfer characteristics. Additionally, the selection of equipment parameters is also affected by gas composition. Hence, when using an existing NG pipeline to transport an H2NG blend, it is necessary to study the influence of an H2 fraction on the transportation process to ensure the feasibility, safety, and economy of such a system. Although several previous simulations have been conducted on H2NG flow in a pipeline, most of these simulations considered NG comprised entirely of CH4. However, in reality, NG includes a variety of gases such as CH4, ethane (C2H6), propane (C3H8), and others. Its composition varies according to available gas sources. The influence of an H2 fraction may be related to the actual gas composition of a specific pipeline network. Therefore, simulations should be based on the actual situation in terms of modeling the pipe flow and reviewing the impact on H2 injection. The thermodynamic properties of H2NG must be accurately predicted. The foundation of modeling requires an accurate description of the thermophysical properties of H2NG, rather than of a CH4–H2 mixture. The NG pipeline of Shan–Jing I (Jingbian, Shanxi to Shijingshan, Beijing, China) is considered in the present study. The Jingbian gas field is the main gas source of this pipeline. Approximately 85% of the NG in the Jingbian gas field derives from Upper Paleozoic coal measures. The gas composition at this field was obtained by chromatography as shown in Table 1 (as original NG types) (MI et al., 2012). Figure 2 compares the thermophysical properties between CH4 and NG. It can be seen that there is a great difference between the actual NG and CH4. Consequently, when simulating the flow characteristics in the pipeline, the actual composites must be considered to ensure the accuracy prediction of properties, which influence the pipe flow significantly. It can be inferred that the impurities in NG enhance the pressure drop due to increased density and viscosity. Because the volume fraction of CH4 in NG is as high as 96.77%, for the sake of simplicity, in this study, it was considered that other component fractions were kept constant, except H2 and CH4 as shown in Table 1.
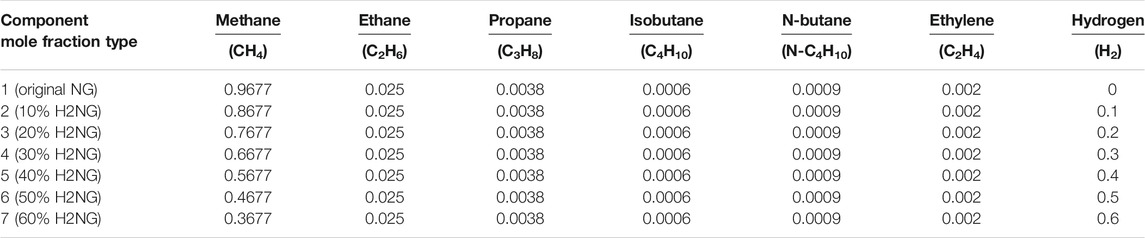
TABLE 1. Components of H2NG.
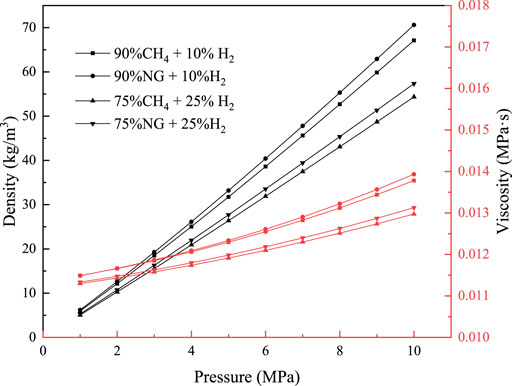
FIGURE 2. The comparison of density and viscosity between CH4 + H2 and NG + H2.
Thermophysical Property Model
A precise description of thermodynamic properties is the basis for establishing an accurate pipeline flow model. It is commonly acknowledged that prediction errors in ideal gas EOS are unacceptable at high pressure. This is because the ideal gas EOS ignores intermolecular force; additionally, the isobaric specific heat capacity and sound speed are assumed to be constant at a given temperature. Accordingly, real gas EOS is introduced herein. In this context, EOS is mainly divided into two categories: 1) cubic equations with simple structures, such as the PR equation (Peng and Robinson, 1976); 2) equations with complex structures, such as Groupe Europeen de Recherches Gazieres (GERG) (Varzandeh et al., 2017). Despite the simple nature of a cubic EOS, it is capable of deriving reasonable results. An EOS with a more complex structure may yield better estimations for selected properties but they tend to be extremely difficult to apply due to their complicated calculation procedures. In the present work, the PR EOS is employed based on its proven accuracy in modeling the behavior of H2NG, is relatively simple, and presents computational efficiency. The PR EOS is expressed as follows (Dall’Acqua et al., 2017; Liu et al., 2014):
where P is the absolute pressure, T is the absolute temperature, V is the molar specific volume, R is the universal gas constant, and Z is the compressibility factor of the gas expressed as below Eq. 3; a and b are empirical parameters accounting for the intermolecular attraction forces and the molecular volume, expressed as below Eq. 6, Eq. 9 respectively.
where Tc is the critical temperature, Pc is the critical pressure, and ω is the Pitzer acentric factor; x is the mole fraction of components, i and j identify the i and j-elements of the fluid mixture, kij represents the binary interaction parameter between components i and j, assuming a value of 0 for i = j.
Governing Equations
In terms of full, long pipelines, the velocity can be regarded as only along the pipe direction, and the radial velocity can be ignored. Thus, it is feasible to create a one-dimensional flow model. The finite element method is used to make difference for the pipe model, and the fluid micro element flow in the pipe is shown in Figure 3.
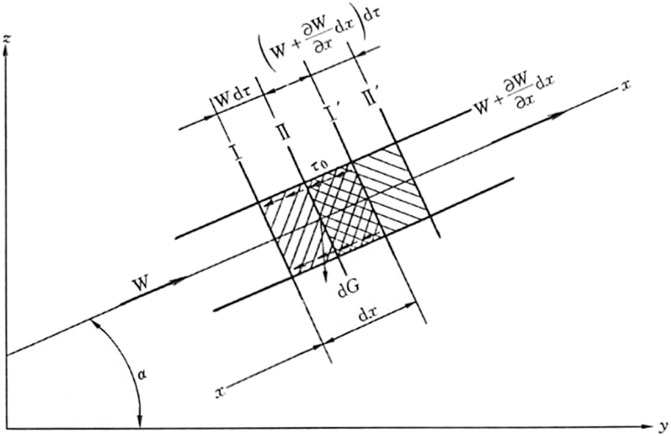
FIGURE 3. Schematic diagram of fluid micro element in pipe.
The governing equations proposed by the one-dimensional model are expressed as:
Continue equation.
Momentum equation.
Energy equation.
where D is the inner diameter of the pipe, f is the friction factor, g is the acceleration of gravity, P is the pressure, t is the time (this paper presents a steady-state condition study and, as such, a time term is not involved), Ta is the ambient temperature, u is the velocity, x is the distance, θ is the pipe inclination angle ρ is the density, and U is the total heat transfer coefficient.
Total heat-transfer coefficient U represents the heat transfer intensity between the gas and environment. Neglecting the heat accumulation of the soil, U can be expressed as follows (Witkowski et al., 2017):
where D is the inner diameter of the pipe, D2 is the outer diameter of the pipe, Db is the outer diameter after adding an insulating layer, z is the buried depth of the pipeline, λ is the thermal conductivity, and g, b, and s indicate the thermal conductivity of the pipe wall, insulation, and anti-corrosion materials and soil, respectively; α is the air convective heat transfer coefficient, which depends on the unpredictable wind velocity. The thermal resistance of the convective heat transfer between the air and the pipe outer wall tends to be much smaller than that of the heat conduction, hence, the heat resistance of convection heat transfer on the air side can be ignored.
The friction coefficient of pipeline flow is determined by the flow pattern, the roughness of the inner wall, the pipe diameter, the flow rate, and the properties of the gas. The Darcy–Weisbach formula is generally employed to calculate the friction between the fluid and a pipe wall. The losses due to friction and potential energy variation are considered in the formula. The formula can be given as follows:
where dP/dx denotes the pressure gradient caused by friction, f is the Darcy friction factor for wall of pipe, and ρ is the density of the fluid.
According to the actual operating parameters of an NG pipeline, the Reynolds number (Re) tends to be as high as 106–107, the Colebrook–White formula was employed to the predict friction coefficient f in the Darcy–Weisbach formula because its calculation reflects the influence of Re in a low Re region and the influence of internal roughness in a high Re region (Helgaker et al., 2014). Eq. 15 shows the ColebrooKe-White equation as follows:
where ε is the equivalent sand grain roughness.
Methodology
Energy Conversion Analysis
The relationship between energy entering and leaving the system is analyzed based on the first law of thermodynamics. In a steady state, the energy carried by gas in a straight pipe primarily comprises internal energy and pressure energy. Internal energy will be lost due to heat exchange between the pipeline and the environment, and pressure energy will be lost owing to friction. The energy carried by gas can be represented as specific enthalpy (h = pv + u). Enthalpy flux is introduced in the present study, where it is expressed by Hf as follows:
where Hf is the enthalpy flux, V is the volume flow rate, M is the mass flow rate, and C is the mass heat capacity of the fluid. The first term on the right represents the pressure energy, and the second term is internal energy.
The pipeline gathering efficiency is a key index for evaluating the network system (Qingqing, 2015). Generally, in this evaluation, the entire pipeline network system is simplified as follows: 1) it is assumed that the pipeline network comprises only primary and branch pipelines; 2) the influence of dynamic and thermal equipment is ignored. The pipeline efficiency of a gas transmission pipeline between pressurization stations is the ratio of outlet Hf2i and inlet Hf1j. The efficiency of the gathering and transportation network is the ratio of the total Hfi at the outlets of all pipelines to the Hfj at the inlets in the entire transportation process. The formula for this is as follows:
where Hf is the enthalpy flux (kJ/h), V is the volume flow rate (m3/h), M is the mass flow (kg/h), C is the mass heat capacity [kJ/(kg/K)], T is the thermodynamic temperature (K), and P is the pressure (kPa). The variables that include 2i are the data of the i-th outlets, and the variables that include 1j are the data of the j-th inlets.
Exergy Analysis
“Exergy” refers to the maximum work that can be produced when a system experiences a reversible process from its current state to equilibrium with its surrounding environment under the condition of only environmental action. The purpose of exergy analysis is to detect the irreversible loss according to an imbalance in the system and to provide a comprehensive evaluation of the system’s energy use (Aihua, 2011). An exergy analysis effectively supplements an energy analysis. Herein, exergy is expressed as
where Ex is the exergy of the fluid, ΔS is the entropy difference between a fluid and environmental reference state, and ΔH is the enthalpy difference between the fluid state and the environmental reference state.
During the exergy analysis, the first step is to define a reference state, where Ex is considered to be 0. Generally, the average ambient temperature and pressure of the area Shan-Jing I pipeline passed through are 25°C (298 K) and 1 atm (101.325 kPa), respectively (Liu et al., 2019b). The present study also adopted this as the reference state. We used the model to calculate the energy loss of each link in the transportation process to analyze the exergy loss and distribution in the system. The exergy carried by gas includes primarily pressure exergy (Exp) and heat exergy (ExT); the latter is based on the environmental temperature according to the following formula:
where Exp refers to the work capacity delivered by the pressure difference between the gas system and the environment, expressed as Eq. 20:
Description of the Pipeline
The Shan-Jing I pipeline employs X60 pipe steel with an outer diameter of 660 mm, an inner diameter of 648 mm, a design working pressure of 6.4 MPa, and has a total length of 792 km (Natural gas in China, 1997). The elevation variation information along the pipeline was obtained using GIS technology as shown in Figure 4. In the region with the most dramatic height change, the pipeline climbs 890 m with a horizontal length of 30 km.
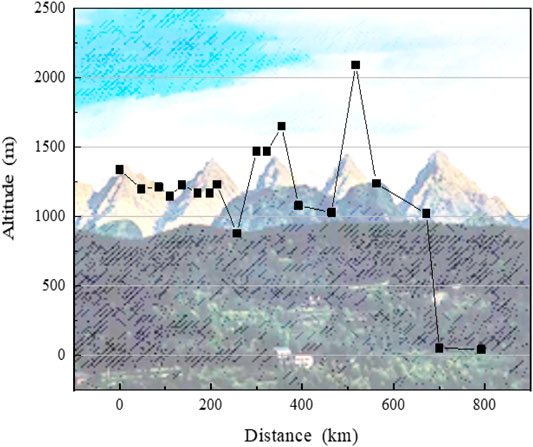
FIGURE 4. A schematic diagram of the altitude change of the Shan–Jing I pipeline.
Pressure stations are required to compensate for pressure losses. According to Specification for Gas Transmission Pipeline Engineering Design GB50251-2015 (Gas Transmission System, 2015), the ratio of inlet and outlet pressure of pressurization station is recommended to be 1.5. Accordingly, this pressure ratio was selected for analyzing the distribution of pressure stations. The equipment in the pressurization station is shown in Figure 5, the compressor in the station adopts centrifugal compressor with pressure ratio of 1.5 and adiabatic efficiency of 85%, an air cooler is set behind the compressor to cool the mixed gas to the operating temperature and pressure.
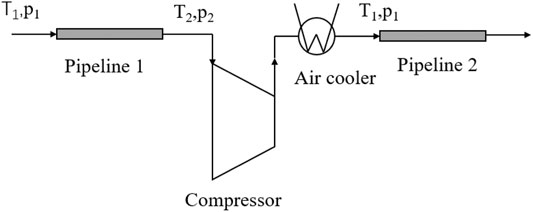
FIGURE 5. A schematic diagram of equipment in pressurization station.
The original distances between NG pressurization stations and the pipeline's starting point are shown in Table 2.
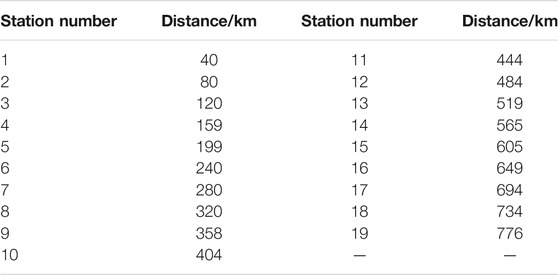
TABLE 2. The original distances between pressurization stations and the pipeline's starting point.
Results and Discussion
Model Validation
In order to evaluate the accuracy of the PR EOS, the mixture density predicted by four EOSs—namely—PR EOS, AGA8 EOS, BWRS EOS and GERG EOS are compared with the experimental data prepared by the Federal Institute for materials research and testing in Berlin, Germany [51]. The mole fractions of the mixture are 0.8845 for CH4, 0.005 for O2, 0.04 for N2, 0.015 for CO2, 0.04 for C2H6, 0.01 for C3H8, 0.002 for n-C4H10, 0.002 for i- C4H10, and 0.0005 for i-C5H12, C5H12, and i-C6H14, respectively (Chemical analysis, 2015). Figure 6 shows the comparison between the predicted densities and the experimental results, and Figure 7 exhibits the relative errors. Clearly, all of the four EOSs are agreement with measured well. The average absolute deviation of PR EOS is less than 2%, and it is closer to the experimental data when the pressure is lower than 10 MPa. Therefore, PR EOS can provide an satisfactory prediction of thermophysical properties, which guarantee an accurate simulation of the pipe flow.
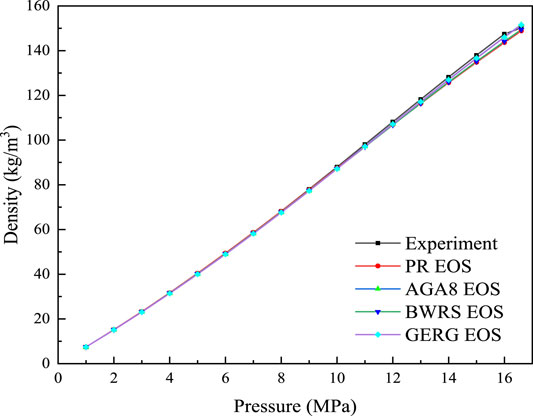
FIGURE 6. The densities of NG predicted different EOSs (300 K).
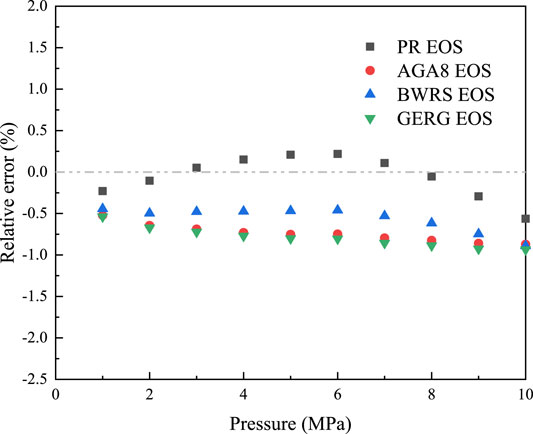
FIGURE 7. The relative errors of different EOSs with experimental data (300 K).
The Effect of Hydrogen Fraction on the Layout of Pressurization Stations
As noted above in Description of the Pipeline, it is suggested that the station pressure compression ratio be 1.5 when a centrifugal compressor is used. Under a full load situation, the average outlet pressure of the first station and each pressurization station in the Shan–Jing I pipeline is 6.4 MPa, the average inlet pressure of the pressurization station tends to be 4.3 MPa, and the pressure drop between the two stations is approximately 2.1 MPa. It is assumed that the velocity and volume flow rate of the blend or NG at the inlet of the pipe is constant in all cases. As shown in Figure 8, due to the relatively lower density of H2, with an increase in H2 fraction, the blend density decreases, which results in both the mass flow rate and the pressure loss decreasing at the same distance. Consequently, the injection of H2 prolongs the distance between pressurization stations. Figure 9 shows the distances between every station and the first station when the pressurization stations are relocated according to the recommended pipeline pressure drop. Observably, the distance increased with an increase in H2 fraction. The distance between stations for the original NG was approximately 40 km/station and approximately 45 km/station for 10% H2, indicating an increase of 12.5%. With a 60% H2 injection, the distance was extended to 85 km/station, an increase of 112.5% compared with the original.
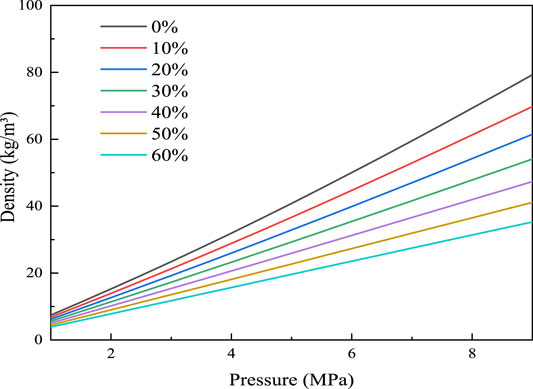
FIGURE 8. The density of different H2 fractions (300 K).
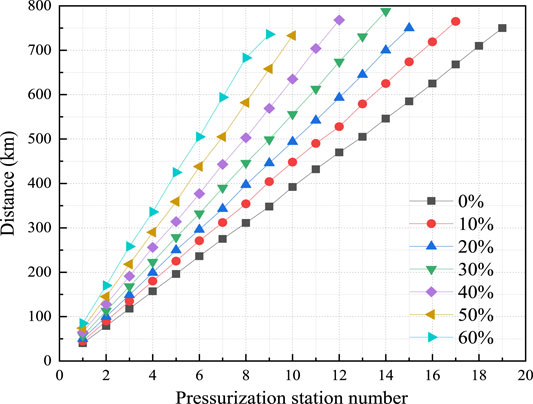
FIGURE 9. The distance between pressurization stations with different H2 mixing ratios.
The construction cost and time were, however, increased by changing the layout of the pressurization stations. Therefore, the effect of H2 injection on the pipeline was also studied without changing the layout of the pressurization stations. Under the condition of keeping the original layout of pressurization stations, when transporting an H2NG blend with different H2 fractions, the inlet pressure of each pressurization station was no longer 4.3 MPa as calculated by the recommended pressure ratio of 1.5. The inlet pressure of each pressurization station is shown in Figure 10. The figure shows that the higher the H2 fraction, the smaller the pressure drop at the same distance, and consequently, the higher the inlet pressure. At this time, if the original pressurization and cooling equipment was used and had not been adjusted properly, accordingly, the phenomenon of overpressure arose, which will also add new challenges to the safety and economy of the equipment. Therefore, it is suggested that the original pressure station equipment be adjusted to ensure safe and stable operation on the premise of reducing energy consumption.
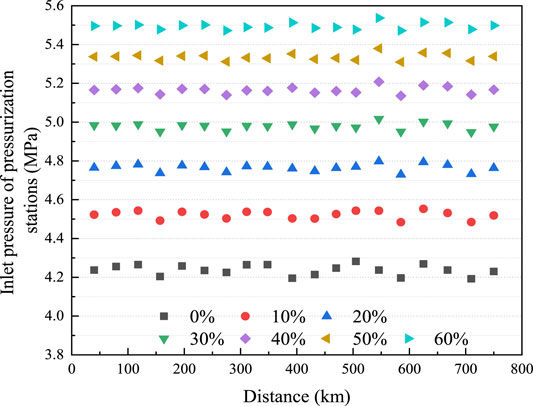
FIGURE 10. The inlet pressure of NG with different H2 blending ratios planned in the original pressurization station referred to Description of the Pipeline.
The Effect of Intermediate Gas Injection on Pressurization Stations
In reality, large-scale H2 production sites may not be closely situated to an NG field; hence, H2 may be injected at different pressurization stations. In this case, the H2NG composition and volume flow rate will change following H2 injection, affecting the transportation process after the H2 injection point. To study the influence of the injection point on the flow, H2 injection points were set at 1/4, 1/2, and 3/4 of the entire length of the original pipeline, and 1/9 or 1/4 of the original volume flow of H2 was injected into the pipeline network. As a result, the volume fraction of H2 in the H2NG blend was 10 or 20%, respectively. The influence of H2 injection on station inlet pressure is shown in Figure 11. For the convenience of comparison, the comparison group in Figure 12 show groups injected with NG with the same composition as the original.
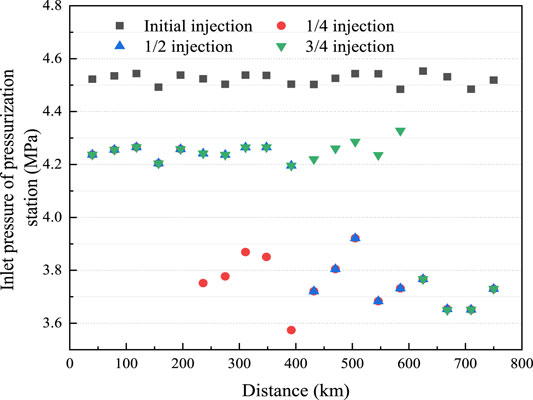
FIGURE 11. The inlet pressure of each pressurization station injected with 10% volume fraction H2 at different H2 injection positions.
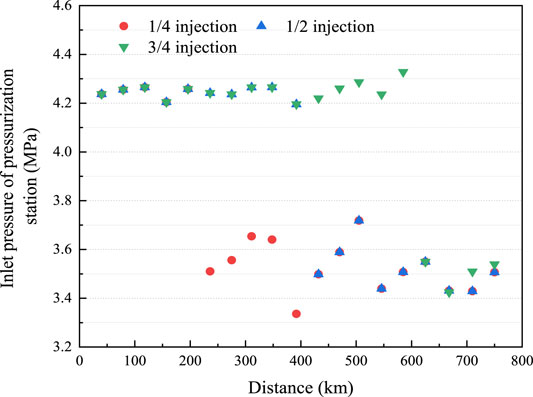
FIGURE 12. Inlet pressure of each pressurization station injected with 10% volume fraction NG at different H2 injection positions.
When H2 was injected directly at the starting point, the average inlet pressure of the subsequent pressurization station was 4.53 MPa. However, when injecting H2 at 1/4 of the total length, the flow rate and the pressure drop increased, resulting in a decrease in the inlet pressure of the downstream pressurization stations. The lowest inlet pressure was as low as 3.57 MPa, and the average was 3.75 MPa. In the case of 1/2 and 3/4 of the total length injection, the influence trend was consistent with that of 1/4 injection. Although the injecting positions were different, the average inlet pressures were all approximately 3.75 MPa, which was 10.7% lower than that of the original pipe network. Compared with the influence of NG injection, the inlet pressure of pressurization stations decreased and the change tendency was essentially the same. The reason for this was because the NG density was much higher than that of H2; consequently, the mass flow rate was larger under the same volume flow rate. This also caused a pressure drop higher than that of H2 injection, and the inlet pressure was lower than that of H2 injection with the same volume flow rate. The average inlet pressure was approximately 3.55 MPa, which was 15.5% lower than that of the original pipeline.
Figure 13 compares the effect of different gas injections at 1/4 of the entire pipeline length on the inlet pressure. When the same gas was injected, with an increase in gas injection, the mass flow rate of the subsequent transportation process and the pressure drop were larger but the inlet pressure was smaller. Compared with CH4 injecting with the same volume flow rate, H2 injection reduced the pressure loss on the subsequent transportation process, and the inlet pressure of the subsequent pressurization station was larger due to its significantly lower density. Intermediate gas injection thus imposes new challenges on original pipeline network equipment, which requires comprehensive review and consideration.
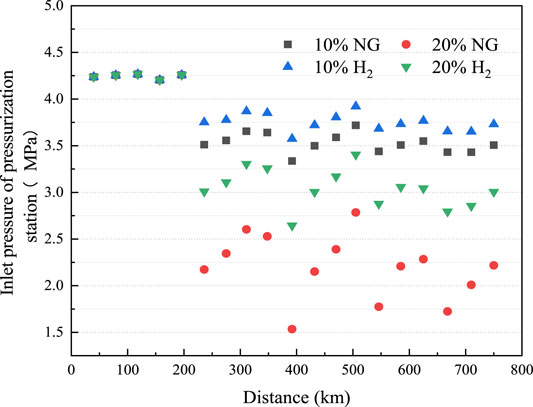
FIGURE 13. The inlet pressure of a pressurization station after injecting different gases at 1/4 of the entire distance of the pipeline.
Analysis of Enthalpy Flux, Exergy, and Pipeline Efficiency
Figure 14 shows the exergy and enthalpy flux at various H2 fractions. The enthalpy flux and exergy were found to increase with an increase in H2 fraction. The original NG exergy component value was 99,057 kW; however, this value reached 108,214 kW with 10% H2 injection (an increase of 9.24%), and this value reached 191,402 kW with 60% H2 injection (an increase of 93.22%). Similarly, H2 injection also led to an increase in enthalpy flux. According to Eq. 16, when the volume flow rate and initial pressure of the blend are the same, the pressure energy (PV in Eq. 16) carried by the blend is the same, and the specific heat capacity of the blend after H2 injection is greater than that of NG (As shown in Figure 15, compared with the original NG at 300 K and 6.4 MPa, the mass heat capacities of H2NG with 10 and 60% H2 fractions increased by 3.5 and 41%, respectively.)
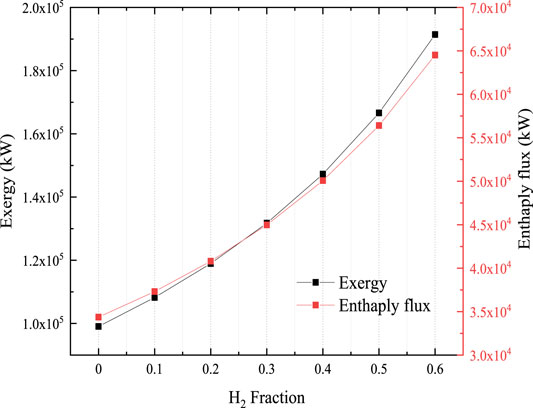
FIGURE 14. The exergy and enthalpy flux at various H2 fractions.
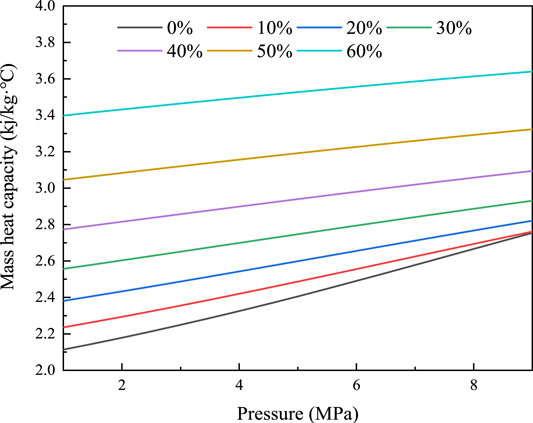
FIGURE 15. The mass heat capacity of different H2 fractions (300 K).
Therefore, the internal energy increases and the Hf also increases correspondingly when H2 is injected. According to Eq. 19, Eq. 20 after H2 injection, although the value of Exp was the same, the Ext was affected by the Cp of the blend. Accordingly, the high H2 fraction also led to a rise in Ex.
Figure 16, Figure 17 show the Ex and Hf at the original pressurization station after using the NG gas pipeline network to transport the gas blend with different H2 fractions. The Exp was determined only by pressure and volume flow, whereas the Ext and Hf were also influenced by specific heat capacity at a given pressure and temperature. With an increase in H2 fraction, the specific heat capacity of the blend increased, the corresponding Ex and Hf increased. A high H2 fraction increased pressure and temperature at the inlets of the pressure stations, and the corresponding inlets Ex and Hf. When the H2 fraction was less than 30%, the Ex and Hf at the inlet of the pressure station essentially remained stable; when the H2 fraction was more than 30%, the fluctuations were considerable. The enthalpy and enthalpy flow of the nodes of the pressurization station fluctuate greatly during the pipeline transportation, which is not conducive to the safety of the gas transportation process Therefore, the existing pipeline and pressure station equipment requires modification to ensure the smooth operation of the existing pipeline network when the volume fraction of H2 is higher than 30%.
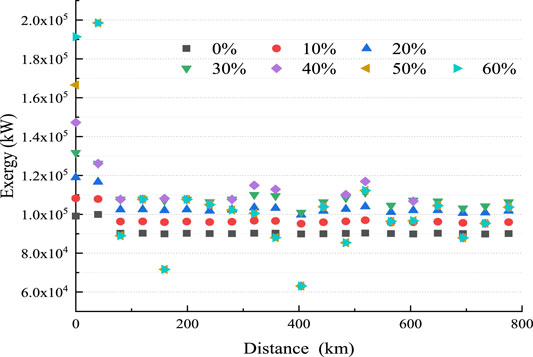
FIGURE 16. The exergy at various H2 fractions.
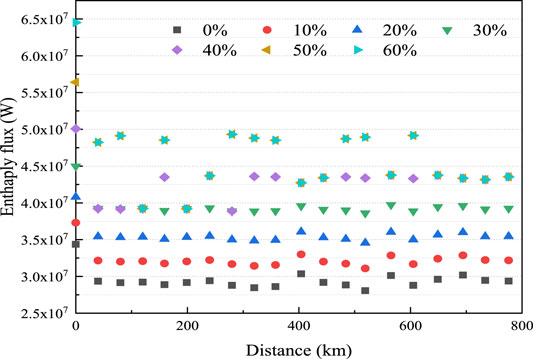
FIGURE 17. The enthalpy flux at various H2 fractions.
In the pipeline transportation process, enhancing the value of η to reduce energy loss in the pipeline network is anticipated. The efficiency of the pipeline network pressurization stations under different H2 fractions is compared in Figure 18. The main factors affecting pipeline efficiency were volume flow, specific heat capacity, inlet and outlet pressure, and temperature. The length of the pipeline between each two pressurization stations was roughly the same, and the inlet and outlet pressure were almost the same as the pressure stations. As a result, although the pipeline efficiency of each pipe section at the same distance was different, it reached an average of 85%. When the H2 fraction was less than 30%, with an increase in the H2 fraction, the pipeline efficiency improved slightly (85.7 for 10%, 86.5 for 20%, and 87.2 for 30% injection). However, when the H2 fraction exceeded 30%, the pipeline’s efficiency was no longer stable and decreased significantly, and transportation became unstable with an increase in the H2 fraction. The lowest pipeline efficiency was 60.8% (when the H2 fraction was 60%). In the actual pipeline transportation process, although a pressure drop at the same distance decreases with an increase in the H2 fraction, a high H2 fraction will boost the possibility of H2 permeation and H2 embrittlement, which will not only affect transportation safety but may also lead to inefficient transportation. That is not conducive to the improvement of gas transmission efficiency. Therefore, it is suggested that the distribution of pressurization stations be adjusted and the operating pressure properly increased when the H2 fraction is higher than 30% to ensure gas transmission efficiency and pipeline safety.
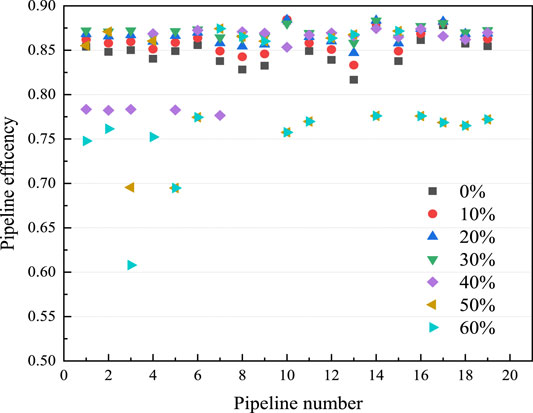
FIGURE 18. The effect of H2 fraction on the efficiency of pipelines in the same position.
Conclusion
The objective of the present study was to analyze the effect of H2 injection on the flow characteristics of an NG pipeline. Based on the Shan–Jing I gas pipeline, this paper used GIS technology to extract terrain information and pipeline data to propose a transportation model for an H2NG-blend pipeline under the conditions of undulating terrain. To produce quantitative data for evaluating the influence of H2 injection on pipe flow character, a parametric study was performed by changing H2 fraction amounts. The primary conclusions of the study are as follows.
1) With an increase in the H2 fraction, the distance between pressure stations increased. When the arrangement of original pressure stations were maintained, overpressure occurred.
2) Intermediate gas injection reduced the inlet pressure of subsequent pressurization stations to gas injection point.
3) When the H2 fraction was less than 30%, the increase in the H2 fraction led to a decrease in the pressure drop and an increase in pipeline efficiency. However, when the H2 fraction exceeded 30%, the transportation process was unstable and the pipeline efficiency decreased.
4) Appropriate H2 addition can improve the economy of pipeline transportation, increase pipeline efficiency and pipeline efficiency. When using existing pipeline network to transport H2NG, it is necessary to make appropriate adjustment to the pipeline network and infrastructure.
Overall, this study show that the proposed transportation model can predict the transportation of H2NG well. This will help the layout design and equipment selection for the subsequent transportation of H2NG, to ensure the safety and efficiency of transportation. Further studies will be carried out to the operation analysis and optimization of the equipment in the pressurization station. This will enable more accurate modeling of an H2NG pipeline transportation.
Data Availability Statement
The original contributions presented in the study are included in the article/Supplementary Material, further inquiries can be directed to the corresponding author.
Author Contributions
JL and LT designed the model and simulated it; BL and PH analyzed the simulation results and data; JL draft papers; PH and WL make important revisions to the paper.
Funding
This work was supported by the the Natural Science Foundation of Hebei Province (E2019210036), the Chongqing Natural Science Foundation (Grant No. CYY202010102001) and the Fundamental research found for Hebei Province administrated Universities (ZCT202002).
Conflict of Interest
The authors declare that the research was conducted in the absence of any commercial or financial relationships that could be construed as a potential conflict of interest.
References
Ali, A. A., Naji, S. Z., Thian, T. C., and Othman, M. R. (2020). Evaluation of Hydrogen Concentration Effect on the Natural Gas Properties and Flow Performance. Int. J. Hydrogen Energ.
Cerniauskas, S., Jose Chavez Junco, A., Grube, T., Robinius, M., and Stolten, D. (2020). Options of Natural Gas Pipeline Reassignment for Hydrogen: Cost Assessment for a Germany Case Study. Int. J. Hydrogen Energ. 45 (21), 12095–12107. doi:10.1016/j.ijhydene.2020.02.121
Chemical analysis (2015). Gas Analysis e preparation of calibration gas mixtures e Part 1: gravimetric method for Class I mixtures. Geneva: International Organization for Standardization.
Chen, C., Li, C., Reniers, G., and Yang, F. (2021). Safety and Security of Oil and Gas Pipeline Transportation: A Systematic Analysis of Research Trends and Future Needs Using WoS. J. Clean. Prod. 279, 123583. doi:10.1016/j.jclepro.2020.123583
Cherigui, A.-N., Mahmah, B., Harouadi, F., Belhamel, M., Chader, S., M'Raoui, A., et al. (2008). Solar Hydrogen Energy: The European–Maghreb Connection. A New Way of Excellence for a Sustainable Energy Development. Int. J. Hydrogen Energ. 34 (11).
Chintala, V., and Subramanian, K. A. (2017). A Comprehensive Review on Utilization of Hydrogen in a Compression Ignition Engine under Dual Fuel Mode. Renew. Sust. Energ. Rev. 70. doi:10.1016/j.rser.2016.11.247
Dall’Acqua, D., Terenzi, A., Leporini, M., D’Alessandro, V., Giacchetta, G., and Marchetti, B. (2017). A New Tool for Modelling the Decompression Behaviour of CO 2 with Impurities Using the Peng-Robinson Equation of State. Appl. Energ., 206.
Deymi-Dashtebayaz, M., Moghadam, A. E., Pishbin, S. I., and Pourramezan, M. (2019). Investigating the Effect of Hydrogen Injection on Natural Gas Thermo-Physical Properties with Various Compositions. Energy, 167.
Elaoud, S., Hafsi, Z., and Hadj-Taieb, L. (2017). Numerical Modelling of Hydrogen-Natural Gas Mixtures Flows in Looped Networks. J. Pet. Sci. Eng. 159. doi:10.1016/j.petrol.2017.09.063
Gas Transmission System (2015). Specification for Gas Transmission Pipeline Engineering Design[S]. Beijing: China Planning Perss.
Haeseldonckx, D., and D’haeseleer, W. (2006). The Use of the Natural-Gas Pipeline Infrastructure for Hydrogen Transport in a Changing Market Structure. Int. J. Hydrogen Energ. 32 (10).
Hafsi, Z., Elaoud, S., and Mishra, M. (2019). A Computational Modelling of Natural Gas Flow in Looped Network: Effect of Upstream Hydrogen Injection on the Structural Integrity of Gas Pipelines. J. Nat. Gas Sci. Eng. 64, 107–117. doi:10.1016/j.jngse.2019.01.021
Hafsi, Z., Mishra, M., and Elaoud, S. (2018). Hydrogen Embrittlement of Steel Pipelines during Transients. Proced. Struct. Integrity 13. doi:10.1016/j.prostr.2018.12.035
Helgaker, J. F., Oosterkamp, A., Langelandsvik, L. I., and Ytrehus, T. (2014). Validation of 1D Flow Model for High Pressure Offshore Natural Gas Pipelines. J. Nat. Gas Sci. Eng. 16. doi:10.1016/j.jngse.2013.11.001
Hengxuan, C. O., Gregory, D., and Dogan, G. (2021). Interactive Effects of Message Framing and Information Content on Carbon Offsetting Behaviors. Tourism Manag., 83.
Kendall, M. (2018). Fuel Cell Development for New Energy Vehicles (NEVs) and Clean Air in China. Prog. Nat. Sci. Mater. Int. 28 (2). doi:10.1016/j.pnsc.2018.03.001
Kouchachvili, L., and Entchev, E. (2018). Power to Gas and H 2/NG Blend in SMART Energy Networks Concept. Renew. Energ., 125.
Li, J., Lu, C., Pei, L., Zhang, C., and Wang, R. (2020). Atomistic Investigation of Hydrogen Induced Decohesion of Ni Grain Boundaries. Mech. Mater., 150.
Liu, B., Liu, X., Lu, C., Godbole, A., Michal, G., and Teng, L. (2019). Decompression of Hydrogen—Natural Gas Mixtures in High-Pressure Pipelines: CFD Modelling Using Different Equations of State. Int. J. Hydrogen Energ. 44 (14). doi:10.1016/j.ijhydene.2019.01.221
Liu, X., Godbole, A., Lu, C., Michal, G., and Venton, P. (2014). Source Strength and Dispersion of CO 2 Releases from High-Pressure Pipelines: CFD Model Using Real Gas Equation of State. Appl. Energ. 126. doi:10.1016/j.apenergy.2014.03.073
Liu, Y., Cheng, Q., Gan, Y., Wang, Y., Li, Z., and Zhao, J. (2019). Multi-objective Optimization of Energy Consumption in Crude Oil Pipeline Transportation System Operation Based on Exergy Loss Analysis. Neurocomputing 332, 100–110. doi:10.1016/j.neucom.2018.12.022
Lu, L. (2011). Database Design Base on GIS Gas Management Network. Proced. Eng. 15, 3954–3958. doi:10.1016/j.proeng.2011.08.740
Mah, A. X. Y., Ho, W. S., Bong, C. P. C., Hassim, M. H., Liew, P. Y., Asli, U. A., et al. (2019). Review of Hydrogen Economy in Malaysia and its Way Forward. Int. J. Hydrogen Energ. 44 (12). doi:10.1016/j.ijhydene.2019.01.077
Mauricio, L., Lára, J., and Brynhildur, D. (2021). The Energy Company of the Future: Drivers and Characteristics for a Responsible Business Framework. J. Clean. Prod., 288.
Meliani, M. H., Azari, Z., Matvienkoc, Y. G., and Pluvinage, G. (2011). The Effect of Hydrogen on the Master Failure Curve of APL 5L Gas Pipe Steels. Proced. Eng. 10. doi:10.1016/j.proeng.2011.04.155
Mi, J., Wang, X., and Zhu, G. (2012). Origin Determination of Gas from Jingbian Gas Field in Ordos basin Collective through the Geochemistry of Gas from Inclusions and Source Rock Pyrolysis[J]. Acta Petrologica Sinica.
Nadaleti, W. C., Santos, G. B. d., and Lourenço, V. A. (2020). Integration of Renewable Energies Using the Surplus Capacity of Wind Farms to Generate H 2 and Electricity in Brazil and in the Rio Grande Do Sul State: Energy Planning and Avoided Emissions within a Circular Economy. Int. J. Hydrogen Energ. 45 (46). doi:10.1016/j.ijhydene.2020.06.226
Natural gas in China (1997). The Shaanxi-Beijing Natural Gas Pipeline Is Put into Operation[J]. Oil & Gas Storage and Transportation (09), 28.
Ogden, J., Jaffe, A. M., Scheitrum, D., McDonald, Z., and Miller, M. (2018). Natural Gas as a Bridge to Hydrogen Transportation Fuel: Insights from the Literature. Energy Policy 115. doi:10.1016/j.enpol.2017.12.049
Omar, B., Hafsi, Z., Djukic, M. B., and Elaoud, S. (2020). The Synergistic Effects of Hydrogen Embrittlement and Transient Gas Flow Conditions on Integrity Assessment of a Precracked Steel Pipeline. Int. J. Hydrogen Energ.
Peng, D.-Y., and Robinson, D. B. (1976). A New Two-Constant Equation of State. Ind. Eng. Chem. Fund. 15 (1), 59–64. doi:10.1021/i160057a011
Pluvinage, G. (2021). Mechanical Properties of a Wide Range of Pipe Steels under Influence of Pure Hydrogen or Hydrogen Blended with Natural Gas. Int. J. Press. Vessels Piping 190, 104293. doi:10.1016/j.ijpvp.2020.104293
Qingmei, J., Qin, W., Ping, X., and Xiangjun, Q. (2019). Development Status and Analysis of Long Distance Hydrogen Pipeline at home and Abroad [J]. oil gas fields Surf. Eng. 38 (12), 6–8.
Qingqing, G. (2015). Analysis and Research on Energy Saving and Consumption Reduction Evaluation of Gathering and Transportation System in Old Oilfields. China University of Petroleum (East China).
Quarton, C. J., and Samsatli, S. (2020). Should We Inject Hydrogen into Gas Grids? Practicalities and Whole-System Value Chain Optimisation. Appl. Energ., 275.
Reuß, M., Welder, L., Thürauf, J., Linßen, J., Grube, T., Schewe, L., et al. (2019). Modeling Hydrogen Networks for Future Energy Systems: A Comparison of Linear and Nonlinear Approaches. Int. J. Hydrogen Energ.
Shay, E., Combs, T. S., Findley, D., Kolosna, C., Madeley, M., and Salvesen, D. (2016). Identifying Transportation Disadvantage: Mixed-Methods Analysis Combining GIS Mapping with Qualitative Data. Transport Policy 48, 129–138. doi:10.1016/j.tranpol.2016.03.002
Sherif, S. A., Barbir, F., and Veziroglu, T. N. (2005). Wind Energy and the Hydrogen Economy — Review of the Technology. Fuel Energ. Abstr. 46 (6).
Singh, V., Singh, R., Singh, A., and Mahajan, D. K. (2018). Tracking Hydrogen Embrittlement Using Short Fatigue Crack Behavior of Metals. Proced. Struct. Integrity 13. doi:10.1016/j.prostr.2018.12.296
Tikhonova, S. A., Kapitonova, T. A., and Struchkova, G. P. (2019). Safety Assessment of Oil and Gas Pipelines Using Satellite Information. Proced. Struct. Integrity 20, 230–235. doi:10.1016/j.prostr.2019.12.144
Timmerberg, S., and Kaltschmitt, M. (2019). Hydrogen from Renewables: Supply from North Africa to Central Europe as Blend in Existing Pipelines – Potentials and Costs. Appl. Energ., 237.
Uilhoorn, F. E. (2009). Dynamic Behaviour of Non-isothermal Compressible Natural Gases Mixed with Hydrogen in Pipelines. Int. J. Hydrogen Energ. 34 (16), 6722–6729. doi:10.1016/j.ijhydene.2009.06.062
Varzandeh, F., Stenby, E. H., and Yan, W. (2017). Comparison of GERG-2008 and Simpler EoS Models in Calculation of Phase Equilibrium and Physical Properties of Natural Gas Related Systems. Fluid Phase Equilibria, 434.
Wang, Y., Yuan, H., Martinez, A., Hong, P., Xu, H., and Bockmiller, F. R. (2021). Polymer Electrolyte Membrane Fuel Cell and Hydrogen Station Networks for Automobiles: Status, Technology, and Perspectives. Adv. Appl. Energ. 2, 100011. doi:10.1016/j.adapen.2021.100011
Witkowski, A., Rusin, A., Majkut, M., and Stolecka, K. (2017). Comprehensive Analysis of Hydrogen Compression and Pipeline Transportation from Thermodynamics and Safety Aspects. Energy, 141.
Zhao, Y., Yao, L., Liu, L., and Xu, Y. (2019). Optimization of Energy Saving Gathering and Transportation Mode in a Block of Tahe Oilfield. Case Stud. Therm. Eng. 13, 100378. doi:10.1016/j.csite.2018.100378
Keywords: hydrogen-natural gas mixture, pipeline, pressurization station, intermediate gas injection, hydrogen transport
Citation: Liu J, Teng L, Liu B, Han P and Li W (2021) Analysis of Hydrogen Gas Injection at Various Compositions in an Existing Natural Gas Pipeline. Front. Energy Res. 9:685079. doi: 10.3389/fenrg.2021.685079
Received: 01 April 2021; Accepted: 28 June 2021;
Published: 16 July 2021.
Edited by:
Guojie Zhang, Taiyuan University of Technology, ChinaReviewed by:
Zhen Wu, Xi’an Jiaotong University, ChinaPeng Wang, Beijing Institute of Petrochemical Technology, China
Copyright © 2021 Liu, Teng, Liu, Han and Li. This is an open-access article distributed under the terms of the Creative Commons Attribution License (CC BY). The use, distribution or reproduction in other forums is permitted, provided the original author(s) and the copyright owner(s) are credited and that the original publication in this journal is cited, in accordance with accepted academic practice. No use, distribution or reproduction is permitted which does not comply with these terms.
*Correspondence: Bin Liu, bGl1YmluQHN0ZHUuZWR1LmNu