 Naveed Raza
 Muhammad Ahsan
 Muhammad Taqi Mehran
 Salman Raza Naqvi
 Iftikhar Ahmad
- School of Chemical and Materials Engineering (SCME), National University of Sciences and Technology (NUST), Islamabad, Pakistan
Fluidized bed gasification has proven to be an appropriate technique for converting various biomass feedstocks into helpful energy. Air distributor plate design is one of the critical factors affecting the thermochemical conversion performance of fluidized bed gasifiers. The present study is proposed to investigate the mixing pattern and pressure drop across different configurations of air distributors using a two-fluid model (TFM) of finite volume method-based solver ANSYS FLUENT. The pressure drop across the bed and mixing pattern have been investigated through qualitative and quantitative analysis of CFD results using three diverse distributor plate designs: perforated plate, 90° slotted plate, and 45° swirling slotted plate. The pressure drop by employing the perforated distributor plate reveals the highest pressure drop due to the smallest open area ratio. However, the pressure drop in the case of 90° slotted plate is found to be 7% and 4% lesser than perforated and 45° slotted plate respectively due to a smaller velocity head developed through the wider open area of the straight slotted plates. The distributor design configuration having a 45° slotted plate exhibits considerable pressure drop compared to the 90° slotted plate due to the longer path length of the slot. Numerical pressure drop results across the bed with different types of distributor plates prove reasonable agreement with the experimental results available in the literature. Mixing behavior in perforated distributor plates exhibits lower portion solid volume fraction of around 0.58. However, it falls rapidly as go up the riser (7.7% of column height); 90° slotted plate shows bottom region solid volume fraction of around 0.5. In addition, it exhibits an even broader range of sand volume fraction and column height (13.46% of column height). Finally, the 45° distributor plate reveals the highest range of volume fraction through the riser height (17.3% of column height), indicating the better mixing characteristics of the fluidized zone.
Introduction
Fluidized bed combustion (FBC) has been renowned as a suitable technology for converting a wide variety of feed, i.e., coal and biomass, into energy due to its superior heat and mass transfer characteristics. By adequately designing fluidized bed reactors (FBR), the emission of SO2 and NOx can be significantly reduced (Downmore et al., 2017). A fluidized bed combustor usually consists of the reaction zone, air distributor plate, combustion chamber for flue gases to preheat the bed material, cyclone separator, and fuel inlet device. FBC uses inert particles, glass beads, or river sand as bed material. The inert particles are preheated to the operating temperature by the flue gases coming from the precombustion chamber, which causes the particles' bed to absorb and store heat. Fluidizing air is passed through the distributor plate. When the air velocity reaches a particular value on which its drag force balances the bed particles’ weight, the bed is fluidized. The velocity at this specific point is called the minimum fluidization velocity (Rao and Bheemarasetti, 2001). Many designs and operating parameters influence the performance of fluidized bed reactor/gasifier, including the type of feedstocks, residence time of gas and fuel particles within the reaction zone, superficial gas velocity, minimum fluidization velocity, particle size distribution, operating and maximum temperature, operating pressure, equivalence ratio (ER), appropriate mixing/contacting of gas-solid phases, pressure drop across the air distributor and throughout the bed, bed height, and temperature and heat transfer coefficients (Armstrong et al., 2011; Baruah and Baruah, 2014).
As far as hydrodynamics of gas and solid particles within the fluidized bed of FBC is concerned, geometric parameters play a vital role in this aspect. Superficial gas velocity, minimum fluidization velocity, gas-particle dispersion enhancement, bubble size and movement behavior, gas-solid contacting pattern, void fraction, residence time distribution of gas and solids, gas-solid movement, and mixing pattern are some of the aspects affected by the distributor plate design. Many distributor designs have been tested, and their impact on the hydrodynamics of the fluidized bed has been reported with various parameter variations (Shukrie et al., 2016). Many types of distributor designs are available in the literature, based on the direction of air entering the column, i.e., normal direction, a lateral direction, and inclined direction. Normal direction includes sparger, perforated plates, and sintered metal. Lateral direction comprises bubble caps, multi-vortex, and nozzles, while inclined direction distributors are classified into annular and helical nozzles (Shukrie et al., 2016). Many researchers and scientists have studied the types mentioned above of distributors to investigate the effect of mixing and pressure drop characteristics of the various fluidized bed phenomena.
Qian et al. (1998) have done a parametric study of a horizontal rotating fluidized bed using slotted and sintered metal cylindrical gas distributors for pressure drop measurement as a function of rotating speed, gas velocity, and bed thickness. After conducting series of experiments for the different densities of particles, they have revealed that the pressure drop for the slotted distributor exhibited pressure overshooting at initial fluidization than the sintered metal distributor.
Sathiyamoorthy and Horio (2003) have experimented with various bed aspect ratios with three-bed materials and two types of multi-orifice distributors. It was revealed that the distributor type, aspect ratio, and operating velocity influence fluidization quality. Moreover, it was concluded that there is a critical aspect ratio where the fluidization quality is maximum. This critical aspect ratio is influenced by operating velocity and distributor type. The critical aspect ratio is found to fall linearly with the increasing operating velocity. The distributor to bed pressure drop ratio has been expressed as a critical aspect ratio function, and the results are compared with the literature data. Paivai et al. (2004) and Sobrino et al. (2009) have studied the distributor plate's influence on a fluidized bed's bottom zone. The cold model was tested for different types of perforated distributor plates having six different perforation grids. It was revealed that for the range of pressure drop (0.05–350 kPa) corresponding to superficial gas velocities (0.1–2.3 ms−1), the distributor plate having a higher open area ratio produced higher pressure drop values in the bottom zone than those expected with the initial fluidization condition. In addition to that, it was concluded that void fraction fluctuation was significant with height and with the fluidization velocity by using a model. Luo et al. (2004) have performed experiments to investigate the effect of parameters, i.e., pressure drop and an aperture ratio of the distributor, on fluidizing and separating performance. Results have shown that the fluidized bed’s fluidizing performance was enhanced for a higher gas distributor’s pressure drop. When the gas distributor's pressure drop is higher than its critical value, the fluidized bed was more uniform and stable density for mineral separation. Moreover, better uniformity and density were observed as the gas distributor’s aperture was smaller.
Fluidization can also be enhanced by rotating the distributor plate. Sobrino et al. (2008) conducted various experiments to examine the effect of the distributor plate's rotational speed on the bed's hydrodynamic behavior, minimum fluidization velocity (Umf), and pressure fluctuations. Furthermore, Sobrino et al. (2009) did a similar study to incorporate rotating distributors to study the bubble characteristics in fluidized bed both theoretically and experimentally (Sobrino et al., 2009; Sobrino et al., 2009). It was concluded in the study that when the distributor was spinning, there was a radial decrease in the bubble size, and also, the bubble growth with the bed height was lowered. Soria-Verdugo et al. (2011) have also investigated the rotating distributor effect on large particles' motion in a bubbling fluidized bed. Yang et al. (2011) have incorporated sintered metal distributors (SMD) for dense medium fluidized bed fluidization. The results have revealed that if a smaller aperture was applied for the same open area ratio (OAR), fluidization quality was enhanced. For more significant open area ratios and keeping the aperture size constant, fluidization quality seemed to be improved as the pressure drop across the SMD increased. Yudin et al. (2016) have performed a series of experiments, including a novel inclined slotted swirling distributor to enhance particulate mixing in a fluidized. Many distributor designs, i.e., perforated plate, circular edged slots (90°), and novel swirling (45°), and different bed aspect ratios were used to investigate the swirling motion in shallow bed and lateral-transverse motion particles in a deep bed. It was concluded from the experiments that enhanced mixing can be achieved in fluidized bed without even rotating the distributors, subject to the proper selection of essential parameters such as distributor designs, bed materials, and bed aspect ratios.
Computational fluid dynamics (CFD) modeling has also been used to predict the flow hydrodynamics and distributor design dependence on the fluidization quality of bubbling fluidized bed. Bin Ibrahim et al. (2012) have conducted a comparative study to investigate the fluidization quality with and without an orifice plate. The simulations were done with three orifice holes, and it was predicted that the model with an orifice plate gives better hydrodynamics, indicating a precise bubble shape with improved amalgamation compared to the model without the orifice plate. Moreover, the simulation results obtained showed good agreement with the available experimental results in the literature. Depypere et al. (2004) have performed CFD simulations to modify the plenum design of fluidized bed equipment in which stainless steel and woven wire mesh distributors were used. Initially, an experiment was performed in which the permeability and the inertial resistance of the proposed distributors were determined. After that, using CFD software ANSYS FLUENT, these inputs incorporated two types of boundary conditions for porous medium to model a distributor. Moreover, flow behavior inside the plenum region was observed qualitatively by exploring the velocity vectors and flow recirculation. It was revealed that there was a large area of recirculation, creating a negative pressure region. Three modified designs were suggested to straighten the flow, i.e., to incorporate the pre-distributor, the ceramic ball packing, and the bottom plenum air inlet. It was observed that due to the incorporation of these three configurations, the flow before entering into the fluidizing zone was straightened enough to provide quality fluidization. Vakhshouri and Grace (2010) have also discussed the effect of plenum volume on fluidization quality. It was revealed that as the plenum volume decreased, the bubbling frequency for a single-orifice distributor increased. Al-Akaishi et al. (2017) have incorporated a discrete phase model (DPM) with a multiphase particle in cell method (MPPIC) as a numerical approach. Four different perforated plate distributors were used to study the effect of configuration on the fluidized bed’s hydrodynamics. It was revealed that distributors with triangular pitch configuration had the best performance in bubble forming, pressure drop, and superficial velocity. Thus, they had better gas-solid flow distribution and mixing within the fluidized bed. Afrooz et al. (2017) have investigated the effects of bed column geometry on the hydrodynamics of gas-solid mixing. The simulations were performed with a swirling tube to see the effect of mixing behavior. Results were compared with the conventional straight tube, and it was established that the swirl tube reactor design usage resulted in a better sideways solid mixing inside the bed. However, due to the swirling motion of solid particles, an increase in the particles' residence time was also observed. Hassan et al. (2016) have predicted the internal solid circulation flux using different distributor designs. Numerical simulations were performed using two-fluid models and incorporating the kinetic theory of granular flow to see the effect of the gas distributor types, superficial gas velocity, and chambers height elevation difference on solid circulation flux. It was revealed that solid circulation flux from the heat exchange chamber (HEC) to the reaction chamber (RC) through the slot under the baffle is increased by increasing the gas velocity (Uf) in the reaction chamber RC regardless of the distributor design.
Furthermore, using a tubular gas distributor, the solids circulation flux and particles radial velocity through the slot were significantly increased compared to the other configurations. Yan et al. (2020) have performed both experiments and numerical simulations to understand the large particles’ dynamic characteristics in the fluidized bed. It was established that the average residence time had most significantly affected the shape and density of the large particles compared to the fluidized air velocity and the particle size. Moreover, the scheme controlling the residence time and movement behavior of the large particles with the different shapes was revealed by analyzing the flow-field distribution of the gas-solid two phases and the evolution of force acting on the large particles.
The 3D modeling of comparative geometric parametric study delineating the cold model fluidization phenomena of BFBG qualitatively and quantitatively is yet to be elucidated. However, most of the previously reported findings have illustrated the overall depiction of fluidization phenomena by describing the pressure drop across the bed without providing sufficient information for fluidized bed inside flow behavior with geometric parameter variations, such as air distributor plate configurations. The present research is focused on the numerical hydrodynamics study of fluidized bed gasifiers through extensive CFD study, which simultaneously describes both pressures drop across the bed and mixing behavior within the fluidization regime using different distributor plate designs. The significant outcomes of the cold model are pressure drop calculation across the bed and mixing characteristics of two-phase flow of fluidization region, identifying the dead zones for each distributor plate. The findings mentioned above will be helpful for the design and development of a hot model of BFBG for enhanced operational efficiency.
Computational Model
Conservation Equations
Conservation of mass and momentum is governed by the continuity and momentum equations for both solid and gas phases. For the two-fluid model (TFM), which is also known as the Eulerian-Eulerian model, the averaging approach is used as a multiphase model. By definition, the sum of volume fractions of all the phases is equal to one:
where
The continuity equations for gas and solid phases are solved separately with time and space and are expressed as follows:
The following set of equations represents the conservation of momentum for the gas phase and solid phase:
where
where
Similarly, solid-phase strain tensor is expressed as
Drag Model
The above Eqs 4, 5 are the interphase momentum transfer between gas and solid phase, which is an important term in gas-solid fluidization modeling. Solid particle fluidization results from the pressurized air (gas) drag exerted on the particulate phase. For the gas-solid interphase exchange coefficient, several drag models have been used so far. Syamlal–O'Brien drag function is more promising and accurate when compared with the other models, so it is more appropriate for predicting the hydrodynamics of gas-solid flows (Kaneko et al., 1999; Taghipour et al., 2005). Terminal velocities of particles are essential parameters in fluidization phenomena and drag law is based on its measured values (Syamlal and O'Brien, 1989; Syamlal and O'Brien, 2003). The empirical correlation for the exchange coefficient in terms of the volume fraction and relative Reynolds number is expressed as follows:
For Syamlal–O'Brien drag function, the fluid-solid drag function is described by Dalla Valle (1948) according to the following relation:
where
Terminal velocity of the solid-phase particles is described by Garside and Al-Dibouni (1977) using the following relation:
where A =
The Kinetic Theory of Granular Flows
Many studies have been carried out on the kinetic theory of fluidized bed behavior’s granular flows (KTGF). The detailed derivation has been explained by Gidaspow (1994) and Peirano and Leckner (1998). Similar to thermodynamic temperature in gas, a granular temperature in the solid phase is also a measure of velocity fluctuations and is defined as follows:
The energy transport equation, which incorporates the granular temperature, is needed to describe this phenomenon. The following equation has been proposed by Ding and Gidaspow (1990):
where
In a fluidized bed simulation, the bulk viscosity of the mixture should be accounted for by Newtonian fluids. The solid shear and normal stresses occur due to granular particles’ random motion and strongly depend on the velocity gradients. There are usually three solid bulk viscosity parts; one is collision viscosity and the others are kinetic viscosity and frictional stress part. The collision viscosity is described by the following relation (Gidaspow et al., 1991):
where g0,ss is the radial distribution function, which is interpreted as a measure of particle contact probability–particle contact and the coefficient of restitution.
where
The kinetic part of the bulk viscosity is described by the following relation (Syamlal et al., 1993):
When the solid-phase volume fraction becomes close to the packing limit, the friction stress part of viscosity becomes more critical (Syamlal and O'Brien, 1989).
The solid pressure, the angle of internal friction, and
Solution Methodology
Transient three-dimensional (3D) simulations of the fluidized bed were performed. The solver used for the simulation was a commercial software package, ANSYS FLUENT 16.0 (Fluent, 2012). For multiphase modeling, the Eulerian multiphase model was used for the analysis. The pressure-based transient solver was used for the analysis. Phase coupled SIMPLE algorithm was used for pressure–velocity coupling. Governing partial differential equations were discretized using the second-order upwind discretization scheme, whereas the high-resolution interface capturing (HRIC) was used for volume fractions of phases. The bounded second-order implicit transient formulation was used for more accurate solutions. Typically, a time step of 0.001°s with 20 inner iterations per time step was used. This number of inner iterations was found to be adequate to achieve convergence for most time steps. For all the equations, 10–3 residual convergence criterion was set during all the simulations.
Geometry and Mesh Generation
Geometry
The geometry of the gasifier used for the simulation is adopted from the experimental work of Yudin et al. (Yudin et al., 2016), having a cylindrical column of height H = 260 mm and diameter D = 108 mm as mentioned in Table 1. The air distributor plates were of three different designs made up of aluminum with 115 mm diameter “D” and 8 mm thickness “t,” as illustrated in Table 2. The first among the three distributors was a perforated distributor plate (Figure 1A) consisting of N = 89 holes having 4 mm diameter “d0” each and arranged in an evenly spaced triangular pitch pattern. Such air distributors are generally used in most fluidized bed reactors and are considered reference distributors for conventional fluidized beds. The second distributor used a circular edged distributor with N = 8 air slots with 6.5 mm in width “W” and 29 mm long “L.” The air angle of attack in this distributor is perpendicular to the fluidized bed material (
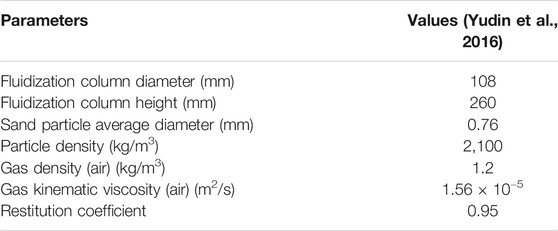
TABLE 1. Simulation parameters.
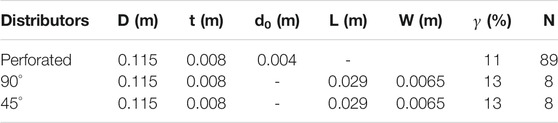
TABLE 2. Geometric details of distributors.

FIGURE 1. geometry of the three types of distributors.
Geometric details of all three types of distributors are explained in Table 3.
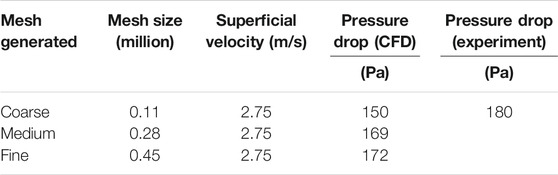
TABLE 3. Details of different mesh sizes.
Geometry details of the gasifier along with distributors are shown in Figure 2.
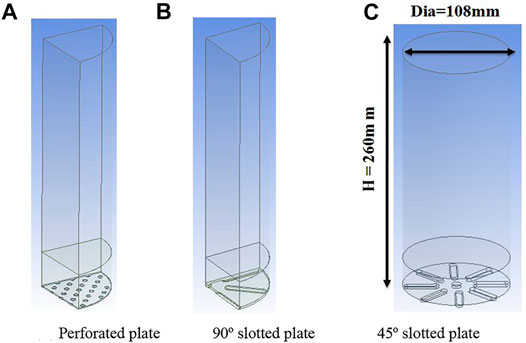
FIGURE 2. The geometry of the gasifier with three distributor plates.
Due to the symmetry of geometry for perforated and 90° distributor plates, the quarter region of the geometry was created compared to the 45° slotted plate configurations for simulation.
Mesh Generation
Geometries of all types of distributors were created using design modular and computational mesh was generated using a meshing tool of ANSYS workbench. Due to the symmetric geometry of both perforated and 90° plates, the mesh was generated on a quarter half of the domain using symmetry boundary conditions (Figure 3). However, a full 360° mesh was generated for 45° plates due to nonsymmetric geometry. Before selecting the final mesh for the analysis, a grid-independent study (explained in the next section) was carried out to get more accurate simulation results.
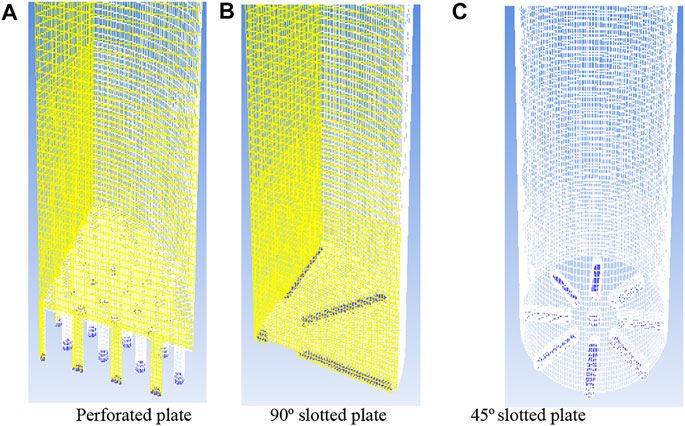
FIGURE 3. Computational mesh of the perforated distributor plate.
Mesh Independence Study
Different mesh sizes for porous plates were evaluated in the present study. The coarse, medium, and fine meshes were 0.11, 0.28, and 0.45 million, respectively, for the perforated distributor plate. The pressure drop across the bed was measured for each mesh at various superficial velocities. The pressure drop for coarse mesh gave crude results as compared to medium and fine meshes. The sequence of mesh independence strategy is shown in Figure 4.
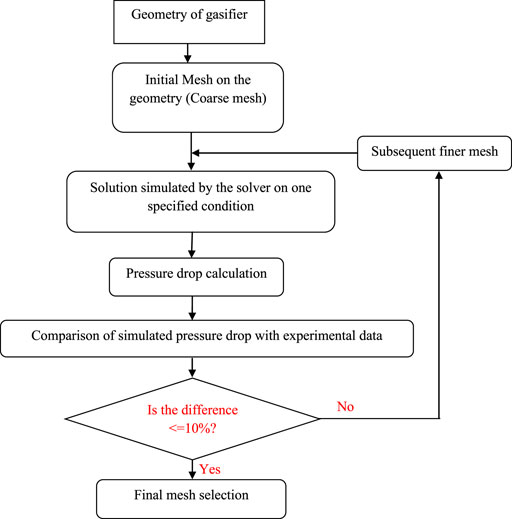
FIGURE 4. Scheme of mesh independence study.
The comparison of pressure drops for coarse medium and fine meshes for perforated plate distributor is tabulated in Table 3.
Medium and fine mesh results were in close agreement with the experimental results, as shown in Table 3. The medium and fine meshes showed inconsiderable pressure drop differences with each other, so medium mesh was chosen as an optimum mesh for the rest of the simulations.
Initial and Boundary Conditions
The solution was initialized with all the specified field variables of the entire computational domain’s solid and gas phases, as listed in Table 1. In addition, simulations were initialized with only air in the domain with no solid particles and superficial air inlet velocity.
The bed material was patched into the lower part of the domain so that the initial patched region containing bed material had an aspect ratio of 0.2 and 0.4 subsequently. The initial solids volume fraction patched in was 0.55. The initial air volume fraction patched in the solid-phase zone is 0.45 and above that zone, such as free broad area, is patched as 1. At the bottom inlet boundary, the constant specified gas inlet velocity and volume fraction were specified for each case. Air inlet velocities range from 0 to 5 m/s with an interval of 0.5 m/s for each simulation run for every distributor plate. The pressure outlet boundary condition was assigned to the upper outer boundary of the computational domain. For the gas phase, no-slip boundary conditions were applied at the wall section of the domain. In contrast, the following boundary equations were applied for the particle’s tangential velocity on the wall and the wall's granular temperature (Lun and Savage, 1987; Patankar, 2018).
Results and Discussion
Bed Pressure Drop
For the validation of the proposed computational model, simulation results were compared with the experimental work of Yudin et al. (2016). Pressure drop predicted by CFD simulation was compared with experimental findings using different plate designs. The range of simulations was carried out at different superficial velocities, i.e., from initial low velocity up to minimum fluidization velocity and even higher velocities to predict pressure drop across the sand bed. The particle size for the simulation was taken as 0.75 mm for all the distributor runs. Figures 5–7 show the pressure drop and their comparison with the published data. Computational results showed that by increasing the superficial air velocity, the pressure drop also increased to minimum fluidization velocity. The pressure drop was not further increased by increasing the velocity of air through the distributors.
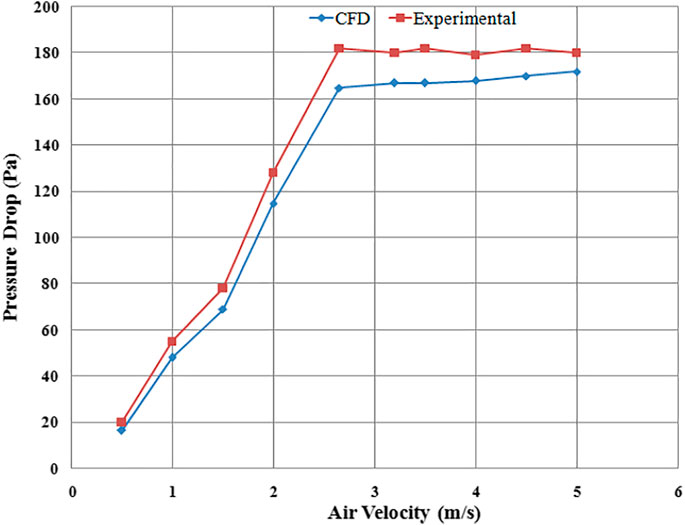
FIGURE 5. Pressure drop fluidized bed for perforated distributor plate.
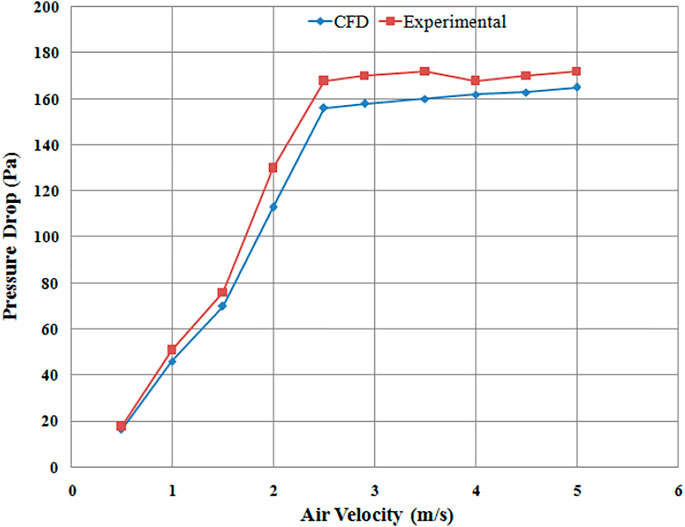
FIGURE 6. Pressure drop fluidized bed for 90° distributor plate.
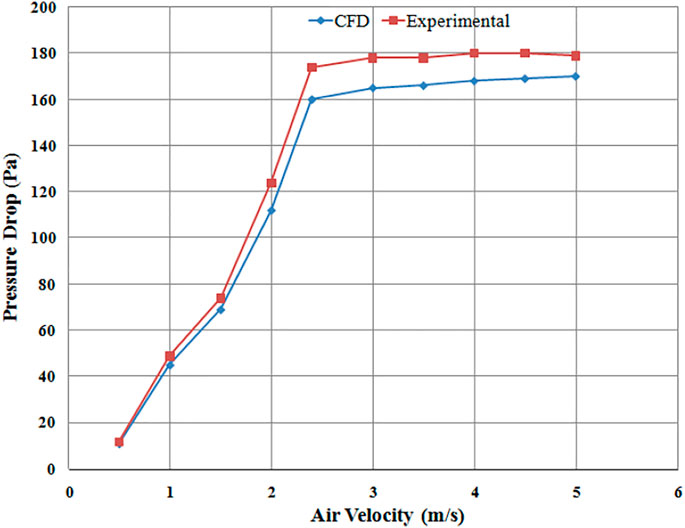
FIGURE 7. Pressure drop fluidized bed for 45° distributor plate.
To observe the effect of distributor configuration on fluidized bed hydrodynamics, the comparison of pressure drops results was obtained using different distributor designs. For example, perforated plate (4 mm diameter, 89 holes), circular edged slotted type (angle of attack of air 90°), and the novel swirling type (air angle of attack 45°) were investigated, as seen in Figure 8, which is the comparison of pressure drop for three different types of distributor plates. Pressure drop was highest for perforated distributor plate followed by 45° plate and lowest pressure drop was observed for 90° distributor plate.
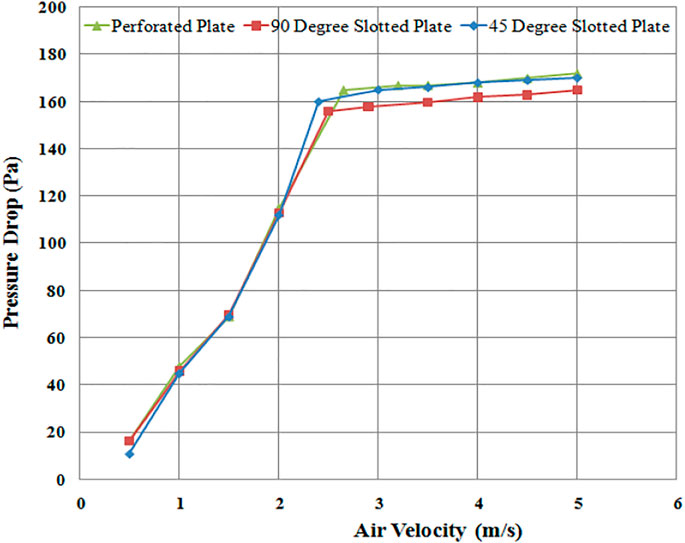
FIGURE 8. Pressure drop comparison (CFD) across the fluidized bed for three different distributor plates.
The pressure drop for the perforated plate distributor is on the higher side due to the flow resistance offered by the smaller circular opening holes located at a relatively smaller distance apart. So significant pressure loss occurred due to the higher kinetic head development while crossing the plate’s narrow holes, depicting the nozzle effect. The early fluidization occurrence of a 45° distributor plate (Figure 8) is due to the inlet airflow's axial and radial components. This axial and sideways flow allows the packed particles of sand to become loosely bound since chaotic motion starts right from the lower portion of the bed, permitting early fluidization. The pressure drop using a 45° plate is slightly higher because the flow has to travel a longer path, thus experiencing more frictional head loss than 90° slotted plate (Aworinde et al., 2015). In fluidized bed hydrodynamics literature, it is generally found that distributor pressure drop becomes significantly high (Sreenivasan and Raghavan, 2002). This effect is most likely found in fluidized beds by using perforated plate distributors due to the formation of smaller bubbles and clusters (Rahimpour et al., 2017; Yudin et al., 2020).
Mixing Behavior of Solid Particles
It can be observed qualitatively from Figure 9 that solid-phase distribution is different for different distributor plates.
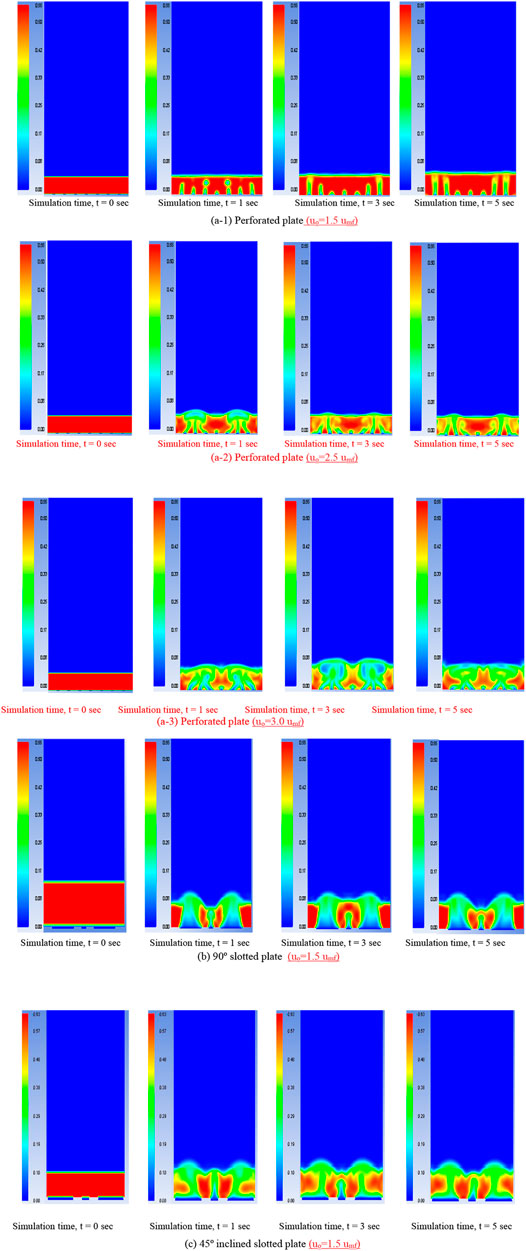
FIGURE 9. A cross-sectional view of solid-phase distribution contours of three different distributor plates at different simulation times (sec).
In general, the central region of the channel, whether its pipe or duct, has a maximum velocity at its center. However, the gas-solid mixing pattern in a fluidized bed is significantly affected by the distributor plate’s orifice arrangements (triangular pitch, radial pitch, or square pitch). In Figure 9A-1, initially, at time 1 s, the bubbles start to grow near the central region of the plate and rise until they reach the surface of the bed, where they collapse, causing the central region to become vacant. This vacant space is filled by the solids from the annular region of the bed, causing the airflow to make channels through the annular region as time proceeds, i.e., time, t = 3 and 5 s. This flow behavior is due to the radial distribution of orifice, which enhances the coalescence of bubbles through the annular region of the fluidized bed. Afrooz et al. (2006) have examined the similar behavior of solid particle movement inside a fluidized bed using a perforated distributor plate having a radial distribution of orifice arrangements.
Moreover, it is also concluded that at low fluidization velocity (uo ∼ 1.5*umf) and having a radial distribution of orifice arrangement, more channeling of air bubbles is usually formed through the annular region of the bed with a broader solid central region. At higher superficial air velocities, such as uo ≥ 2.5*umf, these air bubbles start rising through the orifices by making an angular path to form coalescence with the neighboring bubbles. It results in a slug flow that reaches the bed’s surface, where the larger air bubbles collapse and the process continues as time proceeds. Such transition phenomenon from lower to higher fluidization velocities results in the shift of the annular region of bubbles toward the central core of the fluidized bed. Due to the larger coalescence of air bubbles toward the central zone, the solid region central core of the fluidized bed is narrower. This mixing behavior can be analyzed through qualitative results of solid-phase distribution contours in Figures 9A-2, A-3. This behavior is also depicted by Mu et al. (2020), where the solids have a higher velocity at the annular region when using low superficial gas velocities. However, as the fluidization velocity of air increased, the velocity profile of solids shifted toward the central core of the bed. By examining the contours of slotted plate distributors (b) and (c) of Figure 9, it is revealed that a larger bulk flow of air can quickly be passed through the slots due to a bigger open area ratio. It is showing a lower kinetic head as compared to the perforated plate. Therefore, less pressure was dropped across a 90° slotted plate distributor.
Moreover, the particle movement in a 90° slotted plate distributor comes out to be straight upward, having a maximum axial component. Therefore, the stagnant zone of solid concentration is high enough adjacent to the 90° slots describing the sufficient portion of dead zones at the lower portion of the bed during the fluidization phenomenon, as shown in Figure 9B. The pressure drop across the 45° slotted plate is slightly higher than the 90° slotted plate due to the restrictive angular flow through the distributor’s slots. Furthermore, it can be noticed from the contours of a solid phase (Figure 10) that there is a significant skewed movement of an airflow across the 45° slotted plate. It allows the flow path to be two-dimensional or swirling due to both axial and lateral flow components. Such flow distribution permits the better mixing of solid particles within the fluidized zone and eliminating dead zones within the fluidization regime.
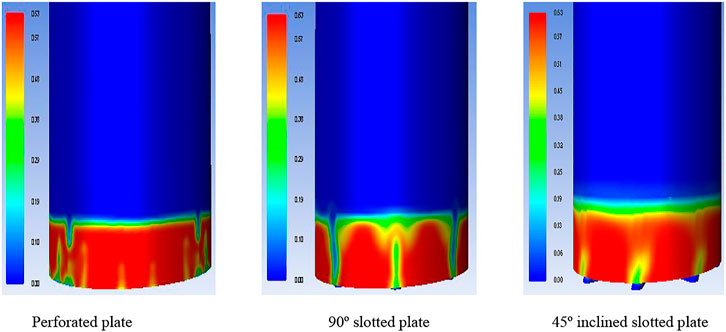
FIGURE 10. 3D view of solid-phase distribution contours of three different distributor plates at a simulation time of 5 s.
Iso-surface of solid-phase distribution further explains the flow pattern inside the fluidization region. From Figure 11, it can be seen how the solid and air phases demonstrate different flow patterns by using different distributor plates. As shown in Figure 11C, a significant swirling flow pattern is observed for a 45° slotted plate distributor. This flow behavior helps to mix binary mixtures and enhance heat transfer and mass transfer rates in the hot model (McAuley et al., 1994; Yang et al., 2021).
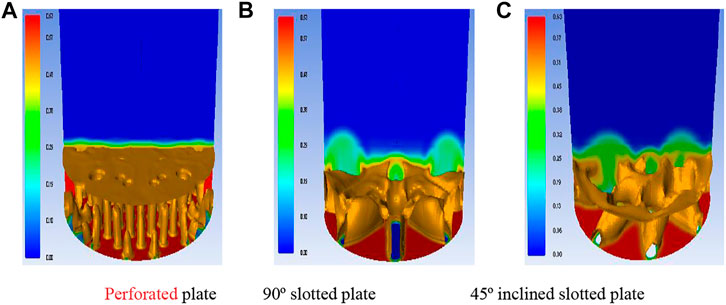
FIGURE 11. Iso-surface of solid-phase for different distributor plates at simulation time of 5 s.
Perforated plate distributor shows uniform flow distributor in Figure 9A. However, there are many chances of dead zones in the lower portion of the bed or near the distributor plate where the airflow direction is almost axial along the fluidization column. It can also be revealed from the qualitative analysis of CFD results using a 90° distributor plate. A large portion of the stagnant region near the lower part of the fluidization column is due to the maximum axial flow with the minimum radial current and less mixing. The only advantage for the 90° distributor plate is its lower pressure drop than that of the other two distributor plates.
Solid-Phase Distribution Along the Height of Fluidization Column
Solid particle distribution along the height of the fluidization column appears to be diverse for different distributor plates. Such solid-phase distribution patterns describe the overall mixing scenario within the fluidization zone. Figure 12 explains the solid particles’ distribution to varying heights of a column using other distributor plates. It can be observed that for the perforated distributor plate, the solid-phase concentration near the distributor plate is maximum, which indicates the existence of numerous dead zones near the lower portion of the sand bed. The solid-phase concentration falls sharply as we go up the column and eventually becomes zero above the fluidization zone (Afrooz et al., 2006). Using a 90° distributor plate, the graph of Figure 12 shows the higher concentration of the solid-phase volume fraction near the plate but not as much when compared to the perforated distributor plate. This effect is due to the larger opening area of the flow to allow the particles to disperse more rapidly, causing a relatively lower concentration near the plate. Using a 90° plate distributor, the solid-phase concentration gradually falls with a more significant slope than the perforated distributor plate. Finally, the 45° distributor plate showed the minimum solid-phase concentration near the distributor plate region due to the swirling flow. This swirling flow is attributed to the slanted (45° inlet air) inlet boundary causing axial and radial flow components to develop in the lower portion of the sand bed.
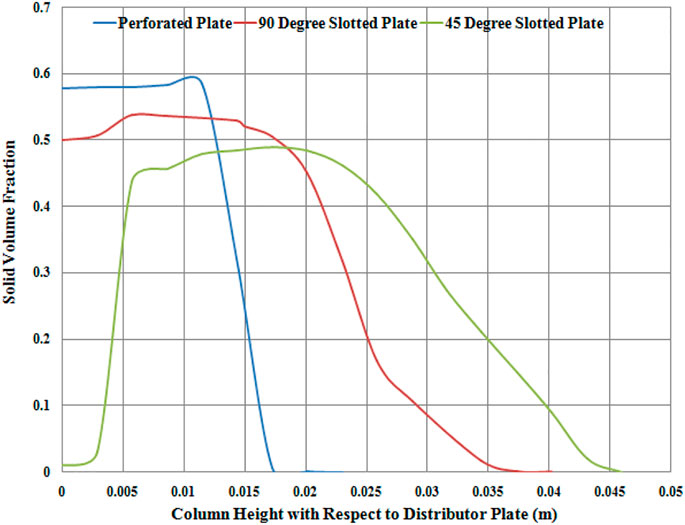
FIGURE 12. Solid-phase volume fraction and column height for different distributor plates at simulation time of 5 s.
As we go up the bed’s height, the solid volume fraction first increases and decreases to the fluidization column’s freeboard region. Quantitatively, the mixing behavior in perforated distributor plates exhibits an initial volume fraction of around 0.58. It falls rapidly as go up the riser (7.7% of column height); 90° slotted plate shows an initial lower volume fraction of around 0.5. Then, it exhibits an even broader sand volume fraction along with the column height (13.46% of column height). Finally, the 45° distributor plate reveals the highest range of volume fraction through the riser height (17.3% of column height), indicating the better mixing characteristics of the fluidized zone. This broad spectrum of solid-phase concentration for the column’s height indicates the better mixing characteristics of the flow inside the fluidized bed. Qualitatively, the solid-phase distribution along the fluidization column's height can be analyzed through volume fraction contours of solid-phase for each distributor plate. Figure 13 describes the particle distribution on the cut plane section at specified heights of the column. The blue color represents the pure gas phase and the red color the solid phase. By observing the perforated distributor plate solid volume fraction contours, it can be monitored that air passes through the perforated plate’s holes by observing the cut plane section near the plate. Still, as we go up the column, the blue color fades down, indicating the pressure drop of fluidizing air as it passes through the sand bed.
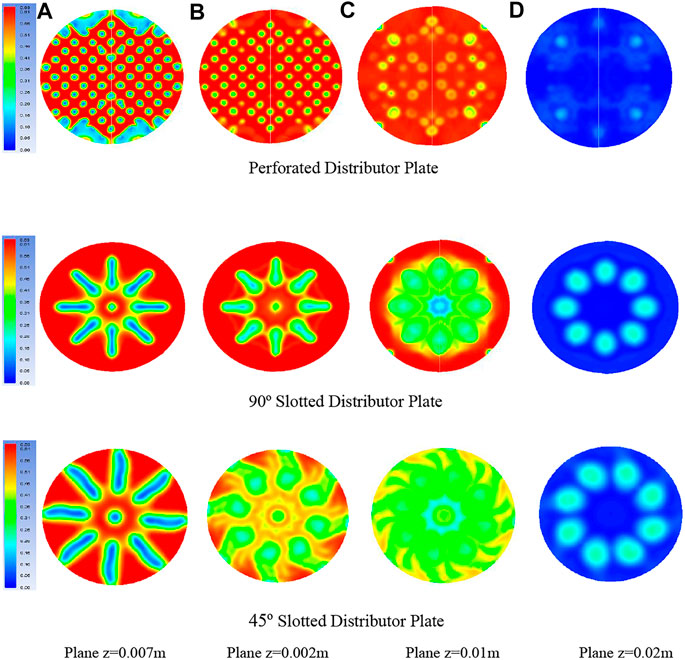
FIGURE 13. Solid-phase volume fraction and column height for different distributor plates at various cut planes and the column height “z” for each distributor plate at a simulation time of 5 s.
Moreover, the lateral component of air velocity and the axial component start to develop, which is depicted by the enlargement of air bubbles. Air passage through the 90° distributor plate slots clearly describes the larger air bubbles rising upward and expanding as they approach the bed surface. This phenomenon helps to mix the particles only on the upper portion of the bed. A significant portion of the solid phase remains almost stagnant, leading to dead zones' formation at the lower portion of the fluidized bed. Solid volume fraction contours of the 45° distributor plate in Figure 13 describe the two-dimensional flow phenomena, i.e., the axial flow, which is along with the column's height, and the lateral or side-wise flow parallel to the radial direction. In this way, as the air enters the 45° distributor plate, the velocity of air splits up into two main components: one is parallel to the riser height (vsin
Various Challenges on Computational Fluid Dynamics Modeling and Simulation
CFD is becoming a viable tool to predict fluid flow, heat transfer, mass transfer, chemical reactions, and related phenomena by solving mathematical equations that govern these processes using a numerical approach with the advancements in computational resources. However, there are many discrepancies involved in simulating all such processes. The first steps involved preprocessing or mesh generation. The grid quality and quantity play a significant role in producing numerical solutions for any physical phenomenon if the quality of the grid is not satisfactory, i.e., high skewness, too much aspect ratio, and non-compliance of first cell height near the wall with the applied turbulence model (y+). Additionally, insufficient grid resolution in each region of the domain, improper selection of structured or unstructured mesh, and improper selection of cell growth could lead to poor results or even divergence of the solution (Körpe et al., 2019).
Similarly, the quantity of mesh also has a significant impact on the overall numerical strategy. Too much coarse mesh leads to unrealistic results and thin mesh results in heavy computational cost (Aqilah et al., 2018). Moreover, for computing of sharp boundaries, such as shock waves or free surface flows where two phases interact, the mesh adaption can also improve results (Wackers et al., 2017). So, the mesh independence study is an appropriate method to first adopt before going for solution development.
After the proper selection of computational mesh, appropriate solution development plays a vital role. Physical model selection is a critical factor depending upon the problem to be simulating. The correct physical model selection according to the physical phenomenon is also important. For example, the flow is turbulent or laminar, unsteady or steady, and compressible or incompressible (Singh et al., 2013). Results obtained from CFD solution runs can only be reliable if the physical models used are correct.
Moreover, numerical errors that include solving equation errors, roundoff errors, and truncation errors can also increase error bars between CFD and experimental results. Mesh refinement and grid adaption are some of the ways to deal with numerical errors (Volk et al., 2017). The accuracy of the CFD solution also depends upon the proper initial and boundary conditions applied to the numerical model. For example, sudden expansion in a duct flow can only give a reliable result if one should use a fully developed velocity profile rather than assuming uniform flow.
Conclusion
Three types of air distributor plates were studied numerically to investigate the flow pattern and pressure drop across the solid bed of bubbling fluidized bed gasifier. The numerical model developed showed quantitatively and qualitatively reasonably good results. The pressure drop using different distributor plates was in close agreement (within 10% error) of published experimental results. Perforated plate distributor has the advantage of uniform flow distribution due to the frequent smaller holes, but it can drop the flow pressure significantly. The 90° slotted distributor plate exhibits the lowest pressure drop compared to the perforated and 45° distributor plate. The reduction in pressure drop for 90° distributor plate is observed in an average of 7–4% compared to that of perforated and 45° distributor plate, respectively. However, the non-uniform distribution of phases is the main disadvantage of the simulation results. The 45° slotted plate distributor showed the significant swirling motion of flow phases inside the fluidization zone. Therefore, the main advantage of using such a distributor is the better mixing behavior of solid phases. For future studies, the combination/blend of 45° slotted and perforate holes plate should be investigated to reduce the overall pressure drop and enhance radial and axial mixing.
Data Availability Statement
The original contributions presented in the study are included in the article/Supplementary Material; further inquiries can be directed to the corresponding author.
Author Contributions
MA and NR proposed the main idea and methodology. NR performed CFD analysis and wrote the manuscript. MM, SN, and IA provided suggestions to improve the manuscript.
Conflict of Interest
The authors declare that the research was conducted in the absence of any commercial or financial relationships that could be construed as a potential conflict of interest.
Publisher’s Note
All claims expressed in this article are solely those of the authors and do not necessarily represent those of their affiliated organizations, or those of the publisher, the editors and the reviewers. Any product that may be evaluated in this article, or claim that may be made by its manufacturer, is not guaranteed or endorsed by the publisher.
References
Afrooz, I. E., Sinnathambi, C. M., Chuang, D. L., and Karuppanan, S. (2017). CFD simulation of bubbling fluidized bed: Effects of bed column geometry on hydrodynamics of gas–solid mixing: Numerische Strömungssimulation einer blasenbildenden Wirbelschicht: Einfluss der Reaktorgeometrie auf die hydrodynamischen Eigenschaften einer Gas‐Feststoff Mischung. Material wissenschaft und Werkstofftechnik 48 (3-4), 226–234. doi:10.1002/mawe.201600761
Afrooz, I., Sinnathambi, C., Karuppanan, S., and Ching, D. (2006). CFD Simulation of Bubbling Fluidized Bed: Effect of Distributor Plate Orifice Pattern Configuration on Hydrodynamics of Gas-Solid Mixing. ARPN J. Eng. Appl. Sci. 11 (2006), 11954–11959.
Al-Akaishi, A., Valera-Medina, A., Chong, C., and Marsh, R. (2017). CFD Analysis of the Fluidised Bed Hydrodynamic Behaviour inside an Isothermal Gasifier with Different Perforated Plate Distributors. Energ. Proced. 142, 835–840. doi:10.1016/j.egypro.2017.12.134
Aqilah, F., Islam, M., Juretic, F., Guerrero, J., Wood, D., and Ani, F. N. (2018). Study of Mesh Quality Improvement for CFD Analysis of an Airfoil. Iiumej 19 (2), 203–212. doi:10.31436/iiumej.v19i2.905
Armstrong, L. M., Gu, S., and Luo, K. H. (2011). Parametric Study of Gasification Processes in a BFB Coal Gasifier. Ind. Eng. Chem. Res. 50 (10), 5959–5974. doi:10.1021/ie1023029
Aworinde, S. M., Holland, D. J., and Davidson, J. F. (2015). Investigation of a Swirling Flow Nozzle for a Fluidised Bed Gas Distributor. Chem. Eng. Sci. 132, 22–31. doi:10.1016/j.ces.2015.04.001
Baruah, D., and Baruah, D. C. (2014). Modeling of Biomass Gasification: A Review. Renew. Sustainable Energ. Rev. 39, 806–815. doi:10.1016/j.rser.2014.07.129
Batcha, M. F. M., Anawi, M. A. H. M, Sulaiman, S. A, and Raghav, V. R, 2013). Numerical Investigation of Airflow in a Swirling Fluidized Bed. Asian J. Scientific Res. 6 (2), 157–166.
bin Ibrahim, M. H., Najib, K.M, Karuppanam, S, and Sinnathambi, C. M (2012). Simulation Study on the Effect of Air Distribution on the Bed Height and Bubble Formation in Bubbling Fluidization Reactor, AIP Conference Proceedings, 1482. doi:10.1063/1.4757440
Depypere, F., Pieters, J. G., and Dewettinck, K. (2004). CFD Analysis of Air Distribution in Fluidised Bed Equipment. Powder Technol. 145 (3), 176–189. doi:10.1016/j.powtec.2004.06.005
Ding, J., and Gidaspow, D. (1990). A Bubbling Fluidization Model Using Kinetic Theory of Granular Flow. Aiche J. 36 (4), 523–538. doi:10.1002/aic.690360404
Downmore, M., Jambwa, S. D., and Kusaziwa, K. P. (2017). Trends in the Control of NOx and SOx Combustion Emissions: Implications to the Design of Fluidised Bed Combustion Operations. Proc. Inst. Mech. Eng. E: J. Process Mech. Eng. 231 (3), 349–358. doi:10.1177/0954408915601296
Garside, J., and Al-Dibouni, M. R. (1977). Velocity-voidage Relationships for Fluidization and Sedimentation in Solid-Liquid Systems. Ind. Eng. Chem. Proc. Des. Dev. 16 (2), 206–214. doi:10.1021/i260062a008
Gidaspow, D., Bezburuah, R., and Ding, J. (1991). Hydrodynamics of Circulating Fluidized Beds: Kinetic Theory Approach. in Illinois Inst. Of Tech. (Chicago, IL (United States): Dept. of Chemical). doi:10.2172/5686161
Gidaspow, D. (1994). Multiphase Flow and Fluidization: Continuum and Kinetic Theory Descriptions. Academic Press.
Hassan, M., Schwarz, M. P., Yuqing, F., Rafique, M., Witt, P., and Huilin, L. (2016). Numerical Investigation of Solid Circulation Flux in an Internally Circulating Fluidized Bed with Different Gas Distributor Designs. Powder Technology 301, 1103–1111. doi:10.1016/j.powtec.2016.07.011
Kaneko, Y., Shiojima, T., and Horio, M. (1999). DEM Simulation of Fluidized Beds for Gas-phase Olefin Polymerization. Chem. Eng. Sci. 54 (24), 5809–5821. doi:10.1016/s0009-2509(99)00153-0
Körpe, D. S., Kanat, Ö. Ö., and Oktay, T. (2019). The Effects of Initial y plus: Numerical Analysis of 3D NACA 4412 Wing Using γ-Reθ SST Turbulence Model. Avrupa Bilim ve Teknoloji Dergisi (17), 692–702. doi:10.31590/ejosat.631135
Lun, C., and Savage, S. (1987). A Simple Kinetic Theory for Granular Flow of Rough, Inelastic, Spherical Particles. J. Appl. Mech. 54(1), 47-53. 10.1115/1.3172993
Luo, Z., Zhao, Y, Chen, Q, Tao, X, and Fan, M (2004). Effect of Gas Distributor on Performance of Dense Phase High Density Fluidized Bed for Separation. Int. J. Mineral Process. 74 (1-4), 337–341. doi:10.1016/j.minpro.2004.04.002
McAuley, K. B., Talbot, J. P., and Harris, T. J. (1994). A Comparison of Two-phase and Well-Mixed Models for Fluidized-Bed Polyethylene Reactors. Chem. Eng. Sci. 49 (13), 2035–2045. doi:10.1016/0009-2509(94)e0030-t
Mu, L., Buist, K. A., Kuipers, J. A. M., and Deen, N. G. (2020). Hydrodynamic and Heat Transfer Study of a Fluidized Bed by Discrete Particle Simulations. Processes 8 (4), 463. doi:10.3390/pr8040463
Paiva, J., Pinho, C., and Figueiredo, R. (2004). The Influence of the Distributor Plate on the Bottom Zone of a Fluidized Bed Approaching the Transition from Bubbling to Turbulent Fluidization. Chem. Eng. Res. Des. 82 (1), 25–33. doi:10.1205/026387604772803043
Peirano, E., and Leckner, B. (1998). Fundamentals of Turbulent Gas-Solid Flows Applied to Circulating Fluidized Bed Combustion. Prog. Energ. combustion Sci. 24 (4), 259–296. doi:10.1016/s0360-1285(98)00002-1
Qian, G.-H., Bagyi, I., Pfeffer, R., Shaw, H., and Stevens, J. G., (1998). A Parametric Study of a Horizontal Rotating Fluidized Bed Using Slotted and Sintered Metal Cylindrical Gas Distributors. Powder Technol. 100 (2-3), 190–199. doi:10.1016/s0032-5910(98)00140-5
Rahimpour, F., Zarghami, R., and Mostoufi, N. (2017). Effect of Distributor on Fluidized Bed Hydrodynamics. Can. J. Chem. Eng. 95 (11), 2221–2234. doi:10.1002/cjce.22895
Rao, T. R., and Bheemarasetti, J. R. (2001). Minimum Fluidization Velocities of Mixtures of Biomass and Sands. Energy 26 (6), 633–644.
Richardson, J., and Zaki, W. (1954). Bed Expansion and Porosity of Liquid Fluidised Beds. Trans. Inst. Chem. Engrs 32, 35–39.
Sathiyamoorthy, D., and Horio, M. (2003). On the Influence of Aspect Ratio and Distributor in Gas Fluidized Beds. Chem. Eng. J. 93 (2), 151–161. doi:10.1016/s1385-8947(02)00257-7
Shukrie, A., Anuar, S., and Oumer, A. N. (2016). Air Distributor Designs for Fluidized Bed Combustors: a Review. Eng. Technol. Appl. Sci. Res. 6 (3), 1029–1034. doi:10.48084/etasr.688
Singh, R. I., Brink, A., and Hupa, M. (2013). CFD Modeling to Study Fluidized Bed Combustion and Gasification. Appl. Therm. Eng. 52 (2), 585–614. doi:10.1016/j.applthermaleng.2012.12.017
Sobrino, C., Acosta-Iborra, A., Santana, D., and de Vega, M. (2009). Bubble Characteristics in a Bubbling Fluidized Bed with a Rotating Distributor. Int. J. Multiphase Flow 35 (10), 970–976. doi:10.1016/j.ijmultiphaseflow.2009.04.005
Sobrino, C., Almendros-Ibañez, J. A., Santana, D., and de Vega, M. (2008). Fluidization of Group B Particles with a Rotating Distributor. Powder Technology 181 (3), 273–280. doi:10.1016/j.powtec.2007.05.014
Sobrino, C., Ellis, N., and de Vega, M. (2009). Distributor Effects Near the Bottom Region of Turbulent Fluidized Beds. Powder Technology 189 (1), 25–33. doi:10.1016/j.powtec.2008.05.012
Soria-Verdugo, A., García-Hernando, N., Almendros-Ibáñez, J. A., and Ruiz-Rivas, U. (2011). Motion of a Large Object in a Bubbling Fluidized Bed with a Rotating Distributor. Chem. Eng. Process. Process Intensification 50 (8), 859–868. doi:10.1016/j.cep.2011.05.004
Sreenivasan, B., and Raghavan, V. R. (2002). Hydrodynamics of a Swirling Fluidised Bed. Chem. Eng. Process. Process Intensification 41 (2), 99–106. doi:10.1016/s0255-2701(00)00155-0
Syamlal, M., and O'Brien, T. J. (1989). Computer Simulation of Bubbles in a Fluidized Bed. AIChE Symp. Ser. New York: Publ by AIChE.
Syamlal, M., and O'Brien, T. J. (2003). Fluid Dynamic Simulation of O3 Decomposition in a Bubbling Fluidized Bed. Aiche J. 49 (11), 2793–2801. doi:10.1002/aic.690491112
Syamlal, M., Rogers, W., and OBrien, T. J. (1993). MFIX Documentation Theory Guide. WV (United States): USDOE Morgantown Energy Technology Center.
Taghipour, F., Ellis, N., and Wong, C. (2005). Experimental and Computational Study of Gas-Solid Fluidized Bed Hydrodynamics. Chem. Eng. Sci. 60 (24), 6857–6867. doi:10.1016/j.ces.2005.05.044
Vakhshouri, K., and Grace, J. R. (2010). Effects of the Plenum Chamber Volume and Distributor Geometry on Fluidized Bed Hydrodynamics. Particuology 8 (1), 2–12. doi:10.1016/j.partic.2009.05.005
Volk, A., Ghia, U., and Stoltz, C. (2017). Effect of Grid Type and Refinement Method on CFD-DEM Solution Trend with Grid Size. Powder Technology 311, 137–146. doi:10.1016/j.powtec.2017.01.088
Wackers, J., Deng, G., Guilmineau, E., Leroyer, A., Queutey, P., Visonneau, M., et al. (2017). Can Adaptive Grid Refinement Produce Grid-independent Solutions for Incompressible Flows?. J. Comput. Phys. 344, 364–380. doi:10.1016/j.jcp.2017.04.077
Yan, L., Liu, H., Li, F., and Liu, J. (2020). Dynamic Characteristics of the Large Particles inside the Fluidized Bed with an Inclined Air Distribution Plate. Powder Technology. 367, 632-642. doi:10.1016/j.powtec.2020.03.069
Yang, S., Wan, Z., Wang, S., and Wang, H. (2021). Reactive MP-PIC Investigation of Heat and Mass Transfer Behaviors during the Biomass Pyrolysis in a Fluidized Bed Reactor. J. Environ. Chem. Eng. 9 (2), 105047. doi:10.1016/j.jece.2021.105047
Yang, X., Zhao, Y., Luo, Z., Chen, Z., and Song, S. (2011). Effects of Sintered Metal Distributor on Fluidization Quality of the Air Dense Medium Fluidized Bed. Mining Sci. Technology (China) 21 (5), 681–685. doi:10.1016/j.mstc.2011.03.009
Yudin, A., Oumer, A. N, Roslan, N, and Zulkarnain, M. A (2020). Computational and Experimental Study on Pressure Drop in a Fluidised Bed with Different Air Distributor Designs. Int. J. Automotive Mech. Eng. 17 (2), 8043–8051. 10.15282/ijame.17.2.2020.22.0603.
Yudin, A. S. M., Anuar, S., and Oumer, A. N. (2016). Improvement on Particulate Mixing through Inclined Slotted Swirling Distributor in a Fluidized Bed: An Experimental Study. Adv. Powder Technology 27 (5), 2102–2111. doi:10.1016/j.apt.2016.07.023
Nomenclature
CD Drag coefficient of phases [-]
ds Diameter of solid particles [m]
ess Restitution coefficient [-]
JT Dissipation or generation of granular energy caused by the exchange of fluctuating energy between the two phases [Nm−2]
kT Granular conductivity [Nm−2]
Res Reynolds number of solid-phase [-]
T Granular temperature [m2sec−2]
u0 Superficial Gas velocity [m sec−1]
umf Minimum fluidization velocity [m sec−1]
Vr,s Terminal velocity of the solid-phase particles [m sec−1].
Keywords: hydrodynamics, fluidization, distributor plates, computational fluid dynamics (CFD), multiphase flow
Citation: Raza N, Ahsan M, Mehran MT, Naqvi SR and Ahmad I (2021) Computational Analysis of the Hydrodynamic Behavior for Different Air Distributor Designs of Fluidized Bed Gasifier. Front. Energy Res. 9:692066. doi: 10.3389/fenrg.2021.692066
Received: 07 April 2021; Accepted: 28 June 2021;
Published: 28 July 2021.
Edited by:
Umakanta Jena, New Mexico State University, United StatesReviewed by:
Biplab Kumar Debnath, National Institute of Technology Meghalaya, IndiaShuai Wang, University of New South Wales, Australia
Copyright © 2021 Raza, Ahsan, Mehran, Naqvi and Ahmad. This is an open-access article distributed under the terms of the Creative Commons Attribution License (CC BY). The use, distribution or reproduction in other forums is permitted, provided the original author(s) and the copyright owner(s) are credited and that the original publication in this journal is cited, in accordance with accepted academic practice. No use, distribution or reproduction is permitted which does not comply with these terms.
*Correspondence: Muhammad Ahsan, YWhzYW5Ac2NtZS5udXN0LmVkdS5waw==