 Xu Li
Xu Li Qing Y. Xiong
- School of Business, Central South University, Changsha, China
As a sustainability policy in emerging markets, the dual-credit policy was implemented in China to promote automakers expanding investment in research and development, and ultimately achieve the energy-saving and emission-reduction goals of the auto industry. We regard the dual-credit policy as a quasi-natural experiment, use the difference-in-difference model to divide Chinese automakers into an experimental group (the passenger vehicle group) and a control group (the commercial vehicle group), and analyze the impacts of the dual-credit policy in the brewing period (2014–2016) and the implementation period on the scale, intensity, and structure of research and development investment. We found that the dual-credit policy has significantly promoted the research and development investment of automakers, and the heterogeneity of automakers has a moderating effect on the policy effects. In addition, we also found that there are certain differences in the significance and stability of the effects of the dual-credit policy during the brewing period and the implementation period. Finally, we presented some management insights into the response to the dual-credit policy.
Introduction
Since 2015, China has become the world's largest producer and marketer of new energy vehicles (NEVs)1 for six consecutive years,2 but there is still a lack of major breakthroughs in the key-core technologies of NEVs (Wang, et al., 2020). One of the important reasons is the excessive dependence of automakers on government subsidies, and the lack of driving force and pressure for technology’s research and development (Wen and Huang, 2020; Yan and Huang, 2020). Therefore, how to use the nonsubsidized policy to continue the cultivation function of industrial policy, enhance the power and pressure of R&D and innovation of automakers, and establish a long-term mechanism for energy-saving and NEV management are the top priorities of policy-makers in industrial policy design (Ministry of industry and information technology of the people's Republic of China, 2017; Fernandez, et al., 2018).
Drawing lessons from the Zero Emission Vehicle Mandate (ZEVM) in California and European Union Emission Trading Scheme (EUETS), China planned originally in 2014 and officially rolled out the “Parallel Administrative Measures for Passenger Vehicle Corporate Average Fuel Consumption and New Energy Vehicle Credits” (the dual-credit policy for short) in September 2017. Among them, the Corporate Average Fuel Consumption Credit (CAFCC) focuses on examining the energy-saving and efficiency-enhancing level of traditional automobile. The New Energy Vehicle Credit (NEVC) focus on the assessment of NEV's energy-saving emission reduction level. The policy stipulates that the CAFC-negative credits (CAFC−) must be offset, and the ways of compensation include the CAFC-positive credits (CAFC+) carry-over in the previous year, CAFC+ transferred by affiliated enterprises, or own NEV-positive credits (NEV+) or NEV+ from other automaker. These rules will force automakers to expand R&D investment in the short term and achieve CAFC+ assessment standards through energy-saving and efficiency-enhancing technologies. At the same time, automaker’s NEV+ must account for 8, 10, and 12% of the sum of the two positive credits, respectively, in 2018–2020, which can be earned by producing or buying. In the long run, these rules can incentivize automakers to expand investment in R&D of NEV in order to seek competitive advantage and profit from point trading. China expects to build a management mechanism of “two integral parallel management, two types of vehicle-coordinated development” by implementing the dual-credit policy (Figure 1). Credit policy, an effective policy instrument, is used widely in the administration of public affairs such as environmental protection (John, 2008), household registration management (Xie, 2014), and social services (Qian et al., 2017). Nevertheless, this is a new exploration for China’s auto industry to introduce such policy. It is still to be proven by the academia whether it is effective for automakers to expand R&D investment.
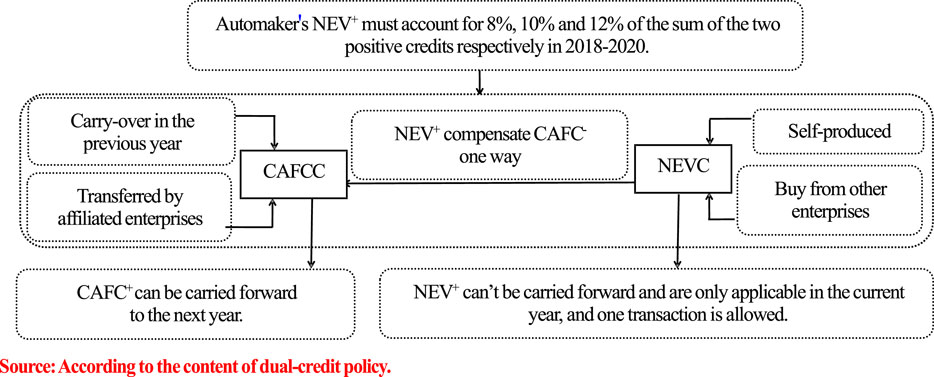
FIGURE 1. Operation mechanism of the dual-credit policy for Chinese automakers.
There are two shortcomings in previous studies. First, China’s dual-credit policy was formulated based on learning from the ZEVM and EUETS, but its contents and quotas were different. There are also differences in NEV technologies and market in China and other countries, so some existing results of ZEVM may not be perfectly suitable for China. In addition, the impacts of an industrial policy often have a pre-diffusion period. Actively picking up policy signals and pre-acting are common in modern enterprise operation (Sierzchula et al., 2012; Cherif and Hasanov, 2019). Actually, the dual-credit policy exerted a considerable impact starting from the brewing period, but existing research gave more weight to its impacts in the implementation period than to those in the brewing period.
In summary, this study focuses on the following issues in the context of China’s dual-credit policy. 1) Does the dual-credit policy encourage automakers to expand R&D investment? What are the characteristics of the scale, intensity, and structure of R&D investment? 2) In the context of the dual-credit policy, does corporate heterogeneity have a moderating influence on policy effects? 3) In the different periods of the dual-credit policy, do the policy effects have phased characteristics?
The main contributions are as follows. 1) In terms of research design, existing researches mainly use theoretical analysis rather than data simulation to study the dual-credit policy (Literature Review Section). However, we regard the dual-credit policy as a quasi-natural experiment, using the DID model to gain some new insights. 2) In terms of research content, on the basis of the scale and intensity of R&D investment, we have added discussions on the structure of R&D investment. In addition, we divide the impact of the dual-point policy into the brewing period and the implementation period, and compare the phased characteristics of the policy effects at different periods (Did Result Section). 3) In terms of research conclusions, we found that the automakers took the initiative to respond during the brewing period and make arrangements in advance. This is different from some conclusions of existing researches, which provides new insights for academic researchers and policy-makers (Conclusion Section).
The rest of this article is structured as follows. The Literature Review and Theoretical Analysis section conducts the literature review and formulates the research hypotheses; The Model and Methods section provides a detailed description of the design of this study; the Empirical Analysis section derives the empirical results; and the Conclusion and Policy Implications section summarizes the full article and draws relevant policy implications.
Literature Review and Theoretical Analysis
Literature Review
1) Nonsubsidized policies in the NEV industry
Our research background is related to nonsubsidized policies, which have become a popular topic in the field of the NEV industry in recent years. Scholars generally believe that nonsubsidized policies, including infrastructure policies (Andrenacci et al., 2016), commercial demonstration (Barton and Schütte, 2017; Li et al., 2019a), government procurement policies (Xiong and Li, 2019), and right-of-way priority policies (Langbroeket al., 2016), have a positive effect on the development of the NEV industry and corporate innovation. Our study also explores nonsubsidized policies in the NEV industry (i.e., China), but the difference is that we focus on the impact of technical standard policy (i.e., the dual-credit policy) on R&D in the NEV industry.
2) Credit policy in the NEV industry
Many literatures explore the ZEVM in the NEV industry. Some scholars believe that the ZEVM has a positive effect in promoting the innovation of NEVs, such as reducing R&D costs (Majumdar, 2005), increasing R&D investment and patents (Stokes and Breetz, 2018), restraining free-riding (Sykes and Axsen, 2017), and mass production (Melton et al., 2016).
Furthermore, some scholars noticed the problems in its implementation, such as “picking the wrong winner” (Nordhaus, 2011), market failure (Weber and Rohracher, 2012), weakening the effects of other policies (Rubal et al., 2019), and increasing carbon emissions in the short term (William et al., 2020).
Our study also explores the credit policy (i.e., the dual-credit policy) in the NEV industry. The difference is that we divide the dual-credit policy into the brewing period and the implementation period, and theoretically analyze the mechanism of action in different periods.
3) The dual-credit policy
Existing research on the dual-credit policy can be divided into two levels. At the micro level, researchers mainly focused on the changes in automakers’ corporate decision-making. Cheng and Mu (2018) discussed the optimal pricing, production, and internally negotiated prices under the three strategies of insufficient credits, surplus credits, and credit balance. Zheng et al. (2019) used a three-stage game model to analyze the impact of positive credit prices on the R&D investment of automakers. Li et al. (2020) discussed optimizing production of NEVs with across-chain cooperation under the dual-credit policy. Tang et al. (2020) analyzed the influence of NEV+ threshold on the optimal decision-making of automakers. Li and Xiong (2021) used the PVAR model to analyze business and environmental performances of automakers. Ma et al. (2021) analyzed the fuel economy, production, and coordination of conventional automotive supply chains under the dual-credit policy.
At the macro level, it focuses on the trend of the EV sales and industry profits (Ou et al., 2018), the market share of different vehicles (Wang et al., 2019), implications for private motorization rate and battery market (Hsieh et al., 2020), and greenhouse gas consequences (He, et al., 2020).
All of the aforementioned literature mainly adopted data simulation methods or pure theoretical analysis, and few empirical analyses using micro data have been conducted. We extended the dimension of R&D structure based on established dimensions, which included R&D scale and R&D intensity. As far as we know, there has been no research studying the multidimensional characteristics of R&D under industrial policy. Our study considers these changes to better predict and explain the impact of the dual-credit policy.
Theoretical Analysis and Assumptions
The theory of innovation deemed that technological coercion standards will bring more constraints and cost to enterprises, but opportunities are given for them to keep original values or create new ones, so R&D investment and technological innovation can be swelled (Oliver and Holzinger, 2008). Moreover, industrial policy has a more positive effect on enterprises’ R&D investment in strategic emerging industries than on those in general industries (Yülek et al., 2020).
1) The dual-credit policy greatly affects the investment from the brewing period to the implementation period and presents fresh characteristics in the scale, intensity, and structure of R&D.
First of all, the mandatory regulatory characteristics of the dual-credit policy in the short term can be effective automakers’ R&D investment and technological innovation (Haščič et al., 2009). So far, China’s auto industry has performed mediocre in innovation, especially in key-core technologies such as batteries, electric drive systems, and power control systems, which needs to be supplemented (Xie and Zeng, 2019). The policy requires automakers to sell enough NEVs every year to earn credits accounting for 8, 10, and 12% in 2018–2020, respectively. Emission requirements of conventional auto can be met, and NEV+ surplus can be earned only through widening the R&D scale and technological innovation. Meanwhile, the compulsory designs of “independent accounting and differentiated calculation” strengthen the motives of materializing benefits of automakers via technological innovation (Sykes and Axsen, 2017); standards may give stronger incentives than permits (Wesseling, et al., 2014).
Second, credits that use rules of “free trade and one-way offset” are substitutes and link with the subsidized policy in favor of enhancing long-term anticipation of automakers’ R&D innovation profits. Tradable NEV+ is essentially a class of pollution rights trading providing long-term incentives to passenger car enterprises through market mechanisms to compensate enterprises’ energy-saving and emission reduction behaviors (Tsakiris et al., 2018). On the one hand, credit calculation and offset rules are not only the law enforcement basis for government to impose penalties but also the policy basis for manufacturers to earn NEV government subsidies after phasing out the NEV subsidy. They are now the government compensation of automakers’ R&D innovation and step-by-step replacement of the subsidized policy. On the other hand, NEV credit surplus can be used to make up for the high R&D investment via market transaction. It aims to indemnify automakers’ R&D innovation through market and connect the original subsidized policy. Consequently, the incentivized characteristic of the dual-credit policy is propitious for intensifying their R&D investment (Wang et al., 2019).
In addition, environmental regulation and technological innovation policies are integrated into the dual-credit policy, alleviating difficulties for automakers’ selections between up-to-standard and R&D investment. Policy regulation and technological innovation promote and interact with each other (Guo et al., 2017). For one thing, the credit evaluation system signaled new regulatory assessments to automakers, so those with sound technological foundation will opt to comply with demands by widening R&D investment, notably the scale of developers, and expanding leading edges via self-innovation. For another, the offset credits boost the capital input of some automakers with weak technological ground. In the short run, their credits will be hit through technological cooperation among enterprises, establishment of affiliated enterprises, or credit trade, and the R&D structure may be changed by the growth of capital. More development of automakers and upgrading transformation in the auto industry are made by these two innovation strategies.
Based on above theoretical analysis, the research hypothesis, “H1 Under the dual-credit policy, automakers invest R&D more,” is proposed to consist of the following three parts:
H1a: Under the dual-credit policy, automakers enlarge their R&D scale,
H1b: Under the dual-credit policy, automakers intensify their R&D intensity,
H1c: Under the dual-credit policy, automakers adjust their R&D structure.
2) China’s automakers are greatly heterogeneous in market orientation, enterprise scale, and profitability, so the moderation effect is reflected in motivating the dual-credit policy to some extent.
First of all, passenger vehicles (PVs) and commercial vehicles (CVs) are two types of market orientation for China's automakers (Xiong and Li, 2019). The dual-credit policy evaluates PVs directly, but the Ministry of Industry and Information Technology (MIIT) held seminars many times on the credit policy of CVs, suggesting that those automakers may not be excluded. At present, the PV makers are facing more pressure on the credit assessment, and the time is urgent and the task is heavy. Therefore, the promotion effect of the dual-credit policy on the scale and intensity of PV makers’ R&D will be more obvious. Otherwise, PV makers are facing more complex types of consumers, richer models, and more difficulty to develop. Therefore, under the dual-credit policy, the adjustment and optimization of the R&D structure of PV makers will be more obvious.
Second, an enterprise scale is an important internal characteristic that affects R&D. The larger the scale of the automakers, the more NEV+ and CAFC+ required for the assessment of compliance, and the greater the difficulty of technological innovation. Therefore, small-scale automakers with limited innovation resources and R&D talents tend to concentrate on breakthrough innovation of key technologies, which is an important growth mechanism for latecomers to achieve industrial breakthrough. Large-scale automakers have certain advantages in the R&D scale and tend to carry out global innovation of common technology from the perspective of long-term interests, and their R&D changes will be more significant (Liu, 2019).
Furthermore, enterprise profitability affects the sustainability of R&D investment (Dimitropoulos, 2020). The R&D of automotive belongs to knowledge and capital intensive risk investment. The profitability and profit level of automakers determine the frequency and intensity of their innovation activities. Therefore, under the dual-credit policy, the higher the degree of profitability, the more obvious the growth of their R&D investment.
With the theoretical analysis given above, the research hypothesis, “H2 automakers’ heterogeneity exerts a moderation impact on the dual-credit policy incentives,” is proposed to compose of the following three sections:
H2a: Under the dual-credit policy, PV makers are motivated more than CV ones,
H2b: Under the dual-credit policy, larger automakers are inspired more than smaller ones,
H2c: Under the dual-credit policy, automakers with better profitability are encouraged more than poorer ones.
3) In order to make up for the disadvantages of the subsidized policy, China began to formulate the dual-credit policy in 2014. The MIIT began to organize government officials, experts, and scholars to learn and discuss ZEVM and other policies. At the same time, it publicly solicited opinions and suggestions from the society, released industrial policy reform signals through various ways, induced automakers to respond positively, and made a layout in advance. In 2017, the dual-credit policy was officially released, and some of the rules were revised every year (Table 1). Therefore, it is necessary to divide the dual-credit policy into the brewing period (2014–2016) and the implementation period (2017–2019) to study its phased impact on the R&D investment of automakers.
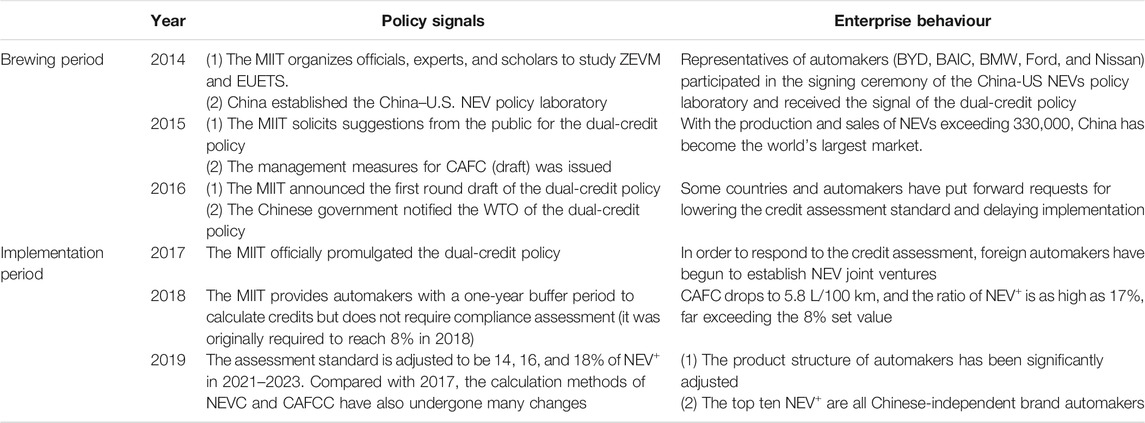
TABLE 1. Main policy signals in different stages of the dual-credit policy.
The relationship between the research hypotheses proposed in this study is shown in Figure 2.
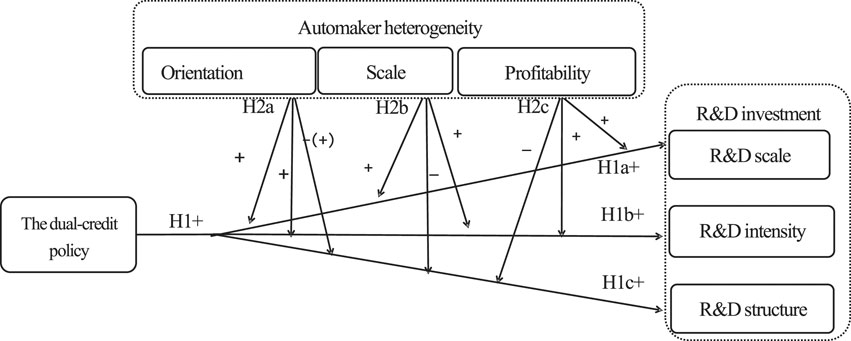
FIGURE 2. Relationship of research hypothesis.
The Model and Methods
Samples and Date
At present, the dual-credit policy assesses automakers with annual production and sales of more than 30,000 passenger vehicles, and listed companies are the focus of the assessment. At the same time, considering the continuity and availability of data, we selected 20 China automakers’ listed companies as our sample.3 Among them, 15 automakers which mainly provide PVs are direct objects of the dual-credit policy, and another five automakers that sold CVs are potential objects. Hence, according to Table 2, this research dissevers these samples as the T-group (PV makers) and the C-group (CV makers).
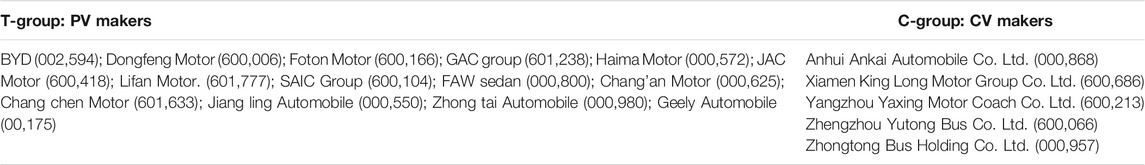
TABLE 2. Basic information on the research samples(stock code).
According to Figure 3, we can find that in 2014 (the year of rolling out the dual-credit policy), the maximum difference of the R&D scale mean value between the T-group and the C-group reaches to 2.63 log units, indicating that the dual-credit policy boosted the R&D scale of PV makers more. The maximum difference of the R&D intensity mean value between the T-group and the C-group automakers reached 1.6% in 2014. In the R&D structure of PV makers, the capitalization ratio (CRD/RD) mean value starts to decrease in general with a clear adjustment direction, and the difference between it and the R&D staff ratio (RDS/AS) mean value of CV makers narrows quickly since 2014 and reaches the minimum of about 5.2%, showing that the enactment and implementation of the dual-credit policy is propitious to promote PV makers’ R&D investment, and credit trade motivates them to enlarge the R&D scale and intensity, and upgrade the R&D structure at the same time.
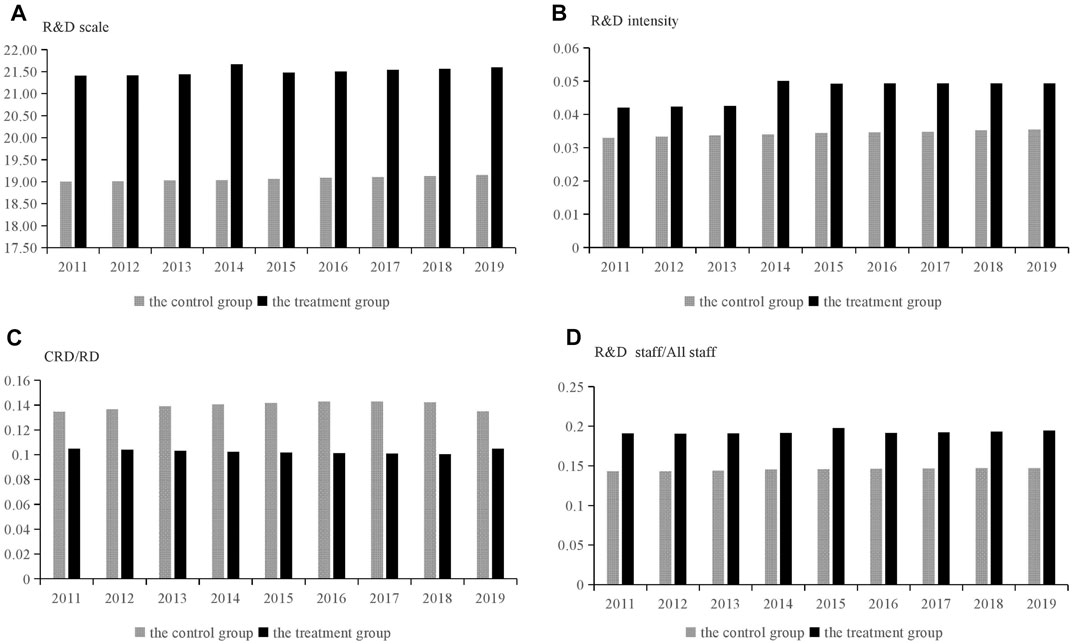
FIGURE 3. Annual statistics of the average R&D investment of the T-group and the C-group.
Model and Variable
The DID model is based on the idea of natural science research, which treats policies as natural experiments or quasi-experiments outside the economic system, and effectively controls the ex ante differences between the research objects through modeling, to separate the real results of policy influences effectively (Ashenfelter and Card, 1985; Yi et al., 2020). It can avoid the endogeneity of explanatory variables (such as policies), especially in the case of using panel data, which not only use the exogeneity of explanatory variables but also control the influence of unobservable overall factors that change over time, and finally get unbiased estimation of policy effects.
Under the dual-credit policy, the impacts on R&D are described as follows:
where Yit represents the R&D of automakers, β1 controls the difference between the T-group and the C-group, β2 controls the common impact of time on the T-group and the C-group, β3 reflects the effect of the dual-credit policy in promoting automakers’ R&D, i means different automakers, and t means different years. The value of Examiit is 1 or 0, which represents the T-group and the C-group. The value of Timeit is 1 or 0, which represents the postimpact (2014–2019) and pre-impact (2011–2013) of the dual-credit policy, respectively. Moderatorit represents moderating variables, that is, automaker heterogeneity. Controlit represents control variables, that is, subsidized policies. β4 and β5, respectively, represent the regression coefficients. εit means the random error term (See Table 3).
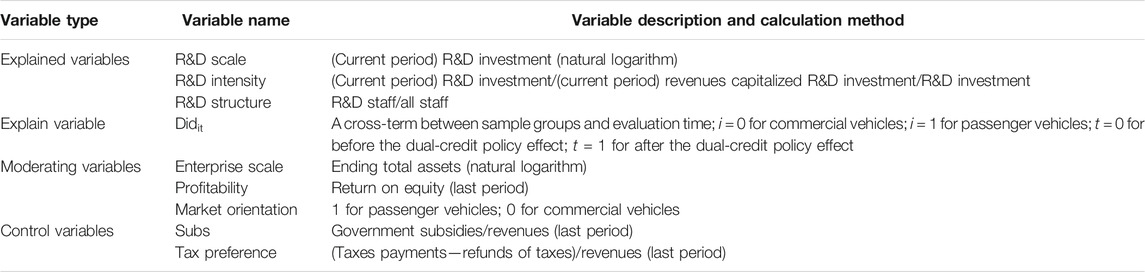
TABLE 3. Variables and index selections.
Robust Test
1) Correlation test. In order to eliminate the correlation between correlated variables and error terms, an endogeneity test is necessary. The results manifest that the correlation coefficient between the R&D scale and dummy variables (Examiit and Timeit) evaluating the dual-credit policy is 0.208 (p < 0.05) and 0.224 (p < 0.05), respectively; between the R&D scale and profitability is 0.652 (p < 0.01) and 0.374 (p < 0.01), respectively; and between the R&D scale and Subs is −0.505 (p < 0.01). High correlation did not exist among other control variables. The VIF of all variables is far smaller than the upper limit of 10. The correlation between R&D intensity, the R&D structure, and other major variables holds the similar feature. Thus, regression results are not intervened by collinearity.
2) Parallel trend test. The interaction term between the dummy variable year of the generation year and the dummy variable treat of the T-group is added to the model 2) for regression (M and N represent the number of periods before and after the policy, respectively), and then the coefficient βj of the interaction term treati × yearj is measured. It is the difference between the T-group and the C-group in periodj. Specifically, β0 is the current effect of the dual-credit policy, β-3–β-1 are the effects of 2011–2013 before the dual-credit policy is brewed, and β1–β5 are after the release of the dual-credit policy signal in 2015–2019. The first period (2013) before the release of the dual-credit policy signal was selected as the model’s benchmark group. The results show (taking the R&D scale as an example) that the coefficients β-3–β-1 are not significantly different from 0, indicating that there is no significant difference between the T-group and the C-group in the one-to-three period before the dual-credit policy. The T-group and the C-group are comparable before the brewing period of the dual-credit policy, and the parallel trend assumption is established.
3) DID-PSM test. In order to eliminate the selection bias caused by the different initial conditions between the T-group and the C-group, the propensity matching method is used for testing (taking the R&D scale as an example). As a reference, first perform a univariate regression; the policy effect is 1.4905 (p < 0.01) and R2 = 0.1379, that is, the impact of the dual-credit policy can explain 13.78% of the change in the R&D scale by the sample enterprise. Further introducing covariates for multiple regression, the Didit is 0.6515 (p < 0.1), market orientation (p < 0.01), the enterprise scale (p < 0.05), and subsidies (p < 0.1) are all significant, and tax preference is not significant.
The data are randomly sorted for propensity score matching. Since the sample size is not large, matching with replacement is performed, and parallel is allowed. The logit regression results show that the estimated ATT is 0.2036, and the t value is less than 1.96, which is not significant. The regression results of sample estimations after matching procedure are consistent with that before matching. Among the total 180 observations, 19 in the C-group are not in the common value range (off support), two in the T-group are not in the common value range (off support), and the remaining observations are in the common value range (on support).
Further examine whether the matching results balance the data well. The results show that the standard deviation of most variables after matching is less than 10%, the deviation of tax preference variables is 11.2%, and the results of most t-tests do not reject the null hypothesis that there is no systematic difference between the T-group and the C-group. It shows that most observations are within the common value range, so only a small number of samples will be lost when propensity score matching is performed.
Empirical Analysis
DID Result
From the perspective of policy effects, as shown in Table 4, the R&D investment is markedly boosted by the dual-credit policy with more obvious growth of scale than that of intensity. The Didit of the R&D scale and R&D intensity is 0.4031 (p < 0.05) and 0.013 (p < 0.05), respectively, meaning that comparing the T-group with the C-group after implementing the dual-credit policy, the R&D scale, which grows more, increased by 40.31% on average and R&D intensity by 1.31%. It proves that the dual-credit policy has indeed promoted the growth of the R&D scale and intensity of PV makers. The reason may be that the incentive mechanism of the dual-credit policy improves the innovation expectation and motivation of PV makers. At the same time, the dual-credit policy has released a strong signal of the adjustment of China’s auto industry to NEVs, which can also lead the capital market to favor the NEV industry and expand the financing channels and the scale of NEVs on the whole. However, the incentive of R&D intensity is relatively weaker. There are two kinds of possible reasons. First, automakers’ revenues in the current period rose faster than their R&D scale in 2011–2019: the rapid growth period of China’s auto consumers. In consequence, the dual-credit policy incentives were dissolved to some extent. Second, R&D intensity might be suppressed by positive externalities of innovation spillovers in part. Empirical results verify the H1a and H1b in H1 hypothesis.
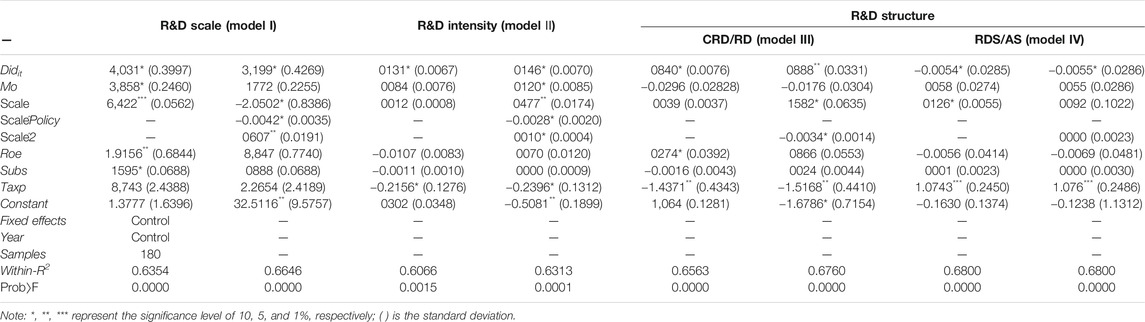
TABLE 4. DID results of the dual-credit policy.
We have an interesting finding in the R&D structure of PV makers, which shows the characteristics of “valuing capital more than talents.” As model I and Ⅱ document in Table 4, the Didit of the capitalization ratio (CRD/RD) and the R&D staff ratio (RDS/AS) is 0.0840 (p < 0.05) and -0.0054 (p < 0.05), respectively. The results show that after the release of the dual-credit policy signals, the R&D structure of the T-Group has been adjusted more significantly than that of the C-Group. Specifically, the capitalization ratio increased by 8.4%, while the R&D staff ratio decreased by 0.54%. It indicates that under the dual-credit policy, PV makers need to have the independent production capacity of NEVs in order to meet the requirements of the mandatory proportion rule of NEV+ so as to ensure that they can produce NEV+ and avoid punishment or reduce the cost of purchasing credits (Li, et al., 2019b). As a result, the adjustment of PV makers’ R&D structure is biased toward capital, and the growth level is even much higher than that of the R&D intensity (1.31%) in the short term. Comparatively speaking, the RDS/AS declined slightly, reflecting the characteristic that the PV makers’ R&D structure is inclined to capital. It may also be due to the rapid growth of China’s automobile market demand, and automakers have a larger increase in the number of employees in production, sales, and other links, leading to a relative decrease in the R&D staff ratio. The empirical results confirm the hypothesis of H1C in H1.
From the perspective of enterprise heterogeneity, such as the market orientation, enterprise scale, and profitability, has a more obvious role in regulating the effect of policy for PV makers. Table 4 shows that the Didit of market orientation (Mo) is 0.3858 (p < 0.1), 0.0084, −0.0296, and 0.0058, respectively, and the result reveals that under the dual-credit policy, automakers targeting the PV orientation are direct subject to policy regulations and are under great pressure for assessment. They urgently need to improve the energy-saving technology of traditional fuel vehicles and the emission reduction technology of NEVs. Therefore, the R&D investment has increased significantly. The Didit of the enterprise scale (scale) is 0.6422 (p < 0.001), 0.0012, 0.0039, and 0.0126 (p < 0.1); it may be that automakers with scale advantages have stronger innovation motives to pursue monopoly advantages and profits; therefore, the performance of expanding the R&D scale and increasing the R&D staff is the most obvious. The Didit of profitability (Roe) is 1.9156 (p < 0.01), −0.0107, 0.0274 (p < 0.1), and −0.0056; it shows that automakers with high profitability are more sustainable in increasing R&D investment, which can support a substantial increase in the scale of R&D investment and a continuous increase in the capitalization ratio. The above results indicate that the three factors have a significant positive moderating effect on the scale of R&D investment; among which, the moderating effect of profitability is the most obvious, and the moderating effect of the enterprise scale is the most significant.
After adding a cross-term between the dual-credit policy and the enterprise scale (scale), the coefficients are in negative values and show prominent statistical significance at the 10% level, suggesting that the policy effect becomes feebler if an automaker becomes larger. Affected by the regulation of the mandatory proportion of NEV+, large-scale automakers have a large output of traditional auto and require a large number of NEV+, which will make it difficult for CAFC+ to meet the target. The adjustment speed of large-scale automakers is relatively slow, and the effect of the dual-credit policy is slightly insignificant. The Didit increases visibly after adding a quadratic term of scale, up by 13.65% (p < 0.1) in the R&D scale and 0.1% (p < 0.1) in R&D intensity, showing positive correlations to them. This suggests that a positive U-shaped relation has emerged between R&D investment and the enterprise scale. As for possible grounds, on the one hand, samples are listed companies with large scale, and the overall relationship between the enterprise scale and R&D investment tends to be U-shaped; on the other hand, there are differences in the innovation strategies of automakers, that is, smaller ones focus on key technology, while larger automakers pursue generic technology, no matter what kind of innovation strategy requires automakers to expand R&D investment. Empirical results verify the H2a, H2b, and H2c in H2 hypothesis.
Phased Characteristics
The self-interested strategic responses of different automakers will cause differences in the significance and stability of the policy effects (Wang et al., 2017; Li and Xiong, 2021). Therefore, in order to better provide empirical evidences for policy optimization, we divided the dual-credit policy into the brewing period (2014–2016) and the implementation period (2017–2019), and explored its phased effects.
During the brewing period, the dual-credit policy has a significant and stable effect on the R&D scale, and it has a stable effect on the R&D intensity and the capitalization ratio. Table 5 and Figure 4 demonstrate that compared to the brewing period ago, the Didit of the R&D scale and intensity are both greater than 0; the R&D scale grows without a lag period, and the R&D intensity lags by two periods. With higher R2 values, the model has good fit. It shows that the reform signal of the dual-credit policy has indeed significantly promoted the expansion of R&D investment made by automakers and has the most obvious effect on the R&D scale. There has been no significant change in the capitalization ratio and so as the R&D staff ratio. The reasons may be that the adjustment of the capitalization ratio is relatively slow, or the automakers are still waiting for the revision of the dual-credit policy.
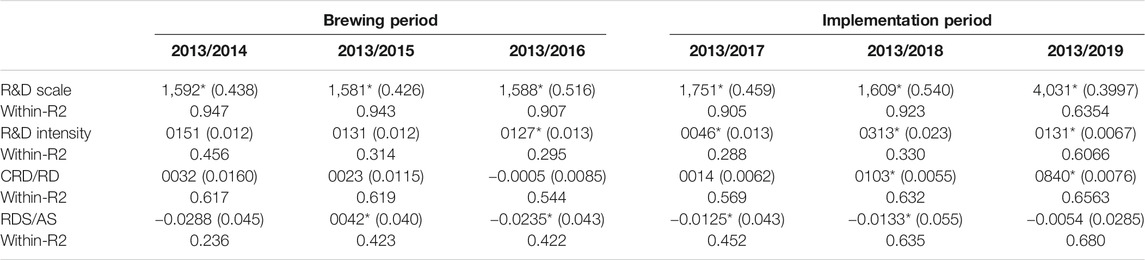
TABLE 5. Results of the characteristics of the dual-credit policy effect in different periods.
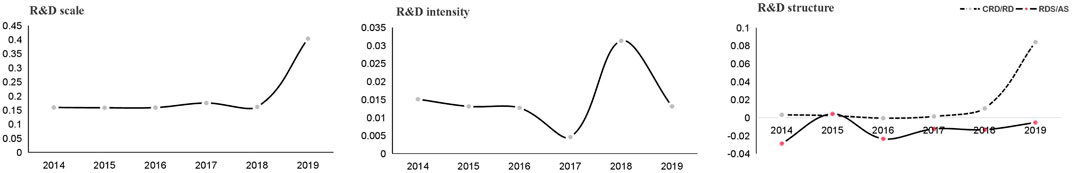
FIGURE 4. A trend chart of the dual-credit policy effect in different periods.
With the release of policy signals, the average growth rates of the R&D scale, intensity, and the capitalization ratio were 15.87, 1.36, and 0.17%, respectively. The Didit of the R&D scale and intensity is relatively stable and that of the R&D staff ratio is unstable. It shows that the policy signal release mechanism can indeed stabilize the expectations of PV makers and encourage automakers to make arrangements in advance. However, the changes in the R&D structure are not significant, which may be related to the fact that the effects of the dual-credit policy need time to accumulate before it becomes apparent.
During the implementation period, the dual-credit policy has a significant and stable effect on the R&D scale, intensity, and the capitalization ratio. Table 5 and Figure 4 show that the Didit is significant in all dimensions at the 10% level; among which, the R&D scale and the capitalization ratio increased by 8.14 and 2.67%, respectively, annually, significantly higher than those of the brewing period. It demonstrates that with the formal implementation of the dual-credit policy and the approaching of the credit assessment date, the pressure and motivation of PV makers’ technology research and development are further enhanced. Under the dual-roles of compulsion and incentive, the PV makers’ R&D investment growth and the R&D structure adjustment are more obvious. Compared with 2018, the Didit of the R&D scale and the capitalization ratio in 2019 increased by 24.22 and 7.37%, respectively. Although the Didit of the R&D staff ratio is less than 0, the growth trend has already appeared. In summary, compared with the brewing period, the policy effects of all dimensions of R&D investment have increased to a certain extent, and the development trend is relatively clear. This manifests that with the gradual strengthening of policy signals and the approaching of credit assessment, the dual-credit policy has become more stable in promoting the expansion of R&D investment.
Conclusion and Policy Implications
Conclusion
We regard China’ dual-credit policy as a quasi-natural experiment using the DID model to divide Chinese automakers into an experimental group and a control group, and analyzed the phased impacts on the scale, intensity, and the structure of R&D in the brewing period and the implementation period.
We have reached some main conclusions about the dual-credit policy. First, the policy has encouraged automakers to expand the R&D scale and intensity, and promoted the adjustment of the R&D investment structure to “valuing capital more than talents.” It indicates that automakers have begun to actively respond after the release of policy signals. These conclusions are different from the “negative” behaviors of some automakers under the ZEVM, such as delaying the implementation of policies through litigation and political lobbying, or demanding to reduce the credit assessment criteria (Collantes and Sperling, 2008). Second, the heterogeneity of automakers’ scale, profitability, and market orientation has obvious moderating effects on policy effects. This is partly consistent with the research conclusion of Xiong et al. (2018). There is a U-shaped relationship between the enterprise scale and the R&D investment, which is inconsistent with the inverted U-shaped relationship theory of modern enterprise R&D tendency (Hu and Li, 2014). This shows that big automakers and small ones have their own advantages in promoting R&D innovation. Third, the effect of China’s dual-credit policy has phase characteristics. During the brewing period, the dual-credit policy has a significant and stable effect on the R&D scale, R&D intensity, and the capitalization ratio. During the implementation period, the dual-credit policy has a significant and stable effect on the R&D scale, intensity, and the capitalization ratio. The policy effects of various dimensions of the R&D investment show shock adjustments, but the trend of change is basically determined.
Policy Implications
Our research provides important management insights and policy implications as shown below.
Policy-makers in China: 1) Policy-makers need 2consider promoting the transition from accounting to compensation for credit assessment. It has been concluded that the dual-credit policy has significantly promoted the R&D investment of automakers. In order to strengthen the effect of the policy, it is possible to further force automakers to expand R&D investment through the implementation of the credit compensation rules. At the same time, it is necessary to improve the credit trading platform and management system. 2) Policy-makers need to consider adjusting the calculation rules of credits and the scope of assessment objects. It has been concluded that automaker heterogeneity has a significant moderating effect on policy effects. In order to have a wider coverage of the policy effects, more automakers need to be included in the assessment scope. At the same time, taking into account the diversity of NEVs, it is necessary to implement classified guidance and key management for different automakers through flexible credit accounting rules.
Other emerging markets: The dual-credit policy provides important references and practical value to emerging markets facing the same problems. Combined with our conclusions, emerging markets can consider implementing the credit policy in phases, releasing signals to automakers during the brewing period, guiding them to make arrangements in advance, changing from passive compliance to proactiveness, and creating a good industrial foundation for the realization of policy goals during the implementation period.
Future studies: In the future, our research may be further optimized, such as analyzing the difference in the effects on conventional automakers and NEV automakers, which will facilitate more precise policy implementation. In addition, we also need to consider the impact of the revision itself on the effect of the dual-credit policy, which will make the model more complex and bring challenges to the optimization solution. The corresponding research results will help to optimize the dual-credit policy. Finally, some global uncertainties such as the COVID-19 will bring a lot of impacts to our research topics. The income and profits of some automakers may have significantly decreased, and the supply–demand ratio of credits will be tightened in 2021, which will affect the stability and continuity of R&D investment. We also need to consider to control these structural breakpoints or exogenous shocks in the empirical model.
Data Availability Statement
The original contributions presented in the study are included in the article/Supplementary Material; further inquiries can be directed to the corresponding author.
Author Contributions
XL contributed to conception and design of the study, wrote the first draft of the manuscript. Thanks to Professor QX for his contribution to the revision of the manuscript. All authors contributed to manuscript revision, read, and approved the submitted version.
Conflict of Interest
The authors declare that the research was conducted in the absence of any commercial or financial relationships that could be construed as a potential conflict of interest.
Footnotes
1New energy vehicles refer to vehicles with new technologies and new structures that use unconventional vehicle fuels as power sources. In China, new energy vehicles mainly refer to hybrid electric vehicle (HEV), battery electric vehicle (BEV), extended-range electric vehicles (EREV), and fuel cell battery electric vehicle (FCBEV).
2Source: https://www.marklines.com
3Every listed company actually includes multiple automakers. For example, the SAIC Group includes Shanghai Volkswagen, Shanghai GM, and SAIC-GM-Wuling, and the GAC Group includes GAC Honda, GAC Toyota, and GAC Mitsubishi.
References
Andrenacci, N., Ragona, R., and Valenti, G. (2016). A Demand-Side Approach to the Optimal Deployment of Electric Vehicle Charging Stations in Metropolitan Areas. Appl. Energ. 182, 39–46. doi:10.1016/j.apenergy.2016.07.137
Ashenfelter, O., and Card, D. (1985). Using the Longitudinal Structure of Earnings to Estimate the Effect of Training Programs. Rev. Econ. Stat. 67 (4), 648–660. doi:10.2307/1924810
Barton, B., and Schütte, P. (2017). Electric Vehicle Law and Policy: a Comparative Analysis. J. Energ. Nat. Resour. L. 35 (2), 147–170. doi:10.1080/02646811.2017.1262087
Cheng, Y. W., and Mu, D. (2018). Optimal Production Decision of Vehicle Manufacturer Based on Double-Score System. Syst. Engineering-Theory Pract. 38 (11), 2817–2830. doi:10.12011/1000-6788(2018)11-2817-14
Cherif, R., and Hasanov, F. (2019). The Return of the Policy that Shall Not Be Named: Principles of Industrial Policy. IMF Working Pap. 19 (74), 1–79. doi:10.5089/9781498305402.001
Collantes, G., and Sperling, D. (2008). The Origin of California’s Zero Emission Vehicle Mandate. Transport. Res. 42 (10), 1302–1313. doi:10.1016/j.tra.2008.05.007
Dimitropoulos, P. E. (2020). R &D Investments and Profitability during the Crisis: Evidence from Greece. R&D Manag. 50 (5), 587–598. doi:10.1111/radm.12424
Fernández Fernández, Y., Fernández López, M. A., and Olmedillas Blanco, B. (2018). Innovation for Sustainability: The Impact of R&D Spending on CO2 Emissions. J. Clean. Prod. 172 (4), 3459–3467. doi:10.1016/j.jclepro.2017.11.001
Guo, L. L., Qu, Y., and Tseng, M.-L. (2017). The Interaction Effects of Environmental Regulation and Technological Innovation on Regional green Growth Performance. J. Clean. Prod. 162 (20), 894–902. doi:10.1016/j.jclepro.2017.05.210
Haščič, I., Vries, F. D., Johnstone, N., and Medhi, N. (2009). Effects of Environmental Policy on the Type of Innovation: The Case of Automotive Emission-Control Technologies. OECD J. Econom. Stud. 2009 (1), 1–18. doi:10.1787/eco_studies-v2009-art2-en
He, X., Ou, S., Gan, Y., Lu, Z., Przesmitzki, S. V., Bouchard, J. L., et al. (2020). Greenhouse Gas Consequences of the China Dual Credit Policy. Nat. Commun. 11 (1), 5214. doi:10.1038/s41467-020-19036-w
Hsieh, I.-Y. L., Pan, M. S., and Green, W. H. (2020). Transition to Electric Vehicles in china: Implications for Private Motorization Rate and Battery Market. Energy Policy 144, 111654. doi:10.1016/j.enpol.2020.111654
Hu, Y. M., and Li, Y. (2014). The Development and Review of Schumpeter Hypothesis Theory-Based on Enterprise Scale, Market Power and R&D Investment. Rev. Economy Manag. 30 (005), 107–113. doi:10.13962/j.cnki.37-1486/f.2014.05.016
John, A. M. (2008). How Carbon Credits Could Drive the Emergence of Renewable Energies. Energy Policy 36 (10), 3633–3639. doi:10.1016/j.enpol.2008.05.033
Langbroek, J. H. M., Franklin, J. P., and Susilo, Y. O. (2016). The Effect of Policy Incentives on Electric Vehicle Adoption. Energy Policy 94, 94–103. doi:10.1016/j.enpol.2016.03.050
Li, G. D., Luo, R. Q., and Gu, Y. F. (2019a). Government's Promotion Policies and the Demand of New-Energy Vehicles: Evidence from Shanghai. China Ind. Econ. 4, 42–61. doi:10.19581/j.cnki.ciejournal.2019.04.003
Li, J., Ku, Y., Yu, Y., Liu, C., and Zhou, Y. (2020). Optimizing Production of New Energy Vehicles with Across-Chain Cooperation under china's Dual Credit Policy. Energy 194, 116832. doi:10.1016/j.energy.2019.116832
Li, X., and Xiong, Y. (2021). Characteristics of the Impact of Corporate Average Fuel Consumption-New Energy Vehicle Credits (CAFC-NEV) Mandate on the New Energy Vehicle Industry: From the Perspective of Business and Environmental Performances. Resour. Sci. 43 (1), 1–11. doi:10.18402/resci.2021.01.01
Li, Y., Zhang, Q., Li, H., Tang, Y., and Liu, B. (2019b). The Impact of Dual-Credit Scheme on the Development of the New Energy Vehicle Industry. Energ. Proced. 158, 4311–4317. doi:10.1016/j.egypro.2019.01.792
Liu, C. D. (2019). Impact of R&D Investment on Firm Performance of Single champion Firms in Manufacturing Industry-Based on Heterogeneity Threshold Effects of Firm Size. R&D Manag. 31 (01), 39–49.
Ma, H., Lou, G., Fan, T., Chan, H. K., and Chung, S. H. (2021). Conventional Automotive Supply Chains under china's Dual-Credit Policy: Fuel Economy, Production and Coordination. Energy Policy 151 (4), 112166. doi:10.1016/j.enpol.2021.112166
Majumdar, S. R. (2005). A Prospect Theory Analysis of California's Initiatives in Implementation of its Zero Emission Vehicles (ZEV) Mandate1. Rev. Pol. Res. 22 (2), 157–169. doi:10.1111/j.1541-1338.2005.00127.x
Melton, N., Axsen, J., and Sperling, D. (2016). Moving beyond Alternative Fuel Hype to Decarbonize Transportation. Nat. Energ. 1 (3), 16013. doi:10.1038/nenergy.2016.13
Ministry of industry and information technology of the people's Republic of China (2017). Measures for parallel management of average fuel consumption and NEV credits of passenger automakers. Available at: http://www.gov.cn/xinwen/2017-09/28/content_5228217.htm
Nordhaus, W. (2011). Designing a Friendly Space for Technological Change to Slow Global Warming. Energ. Econ. 33 (4), 665–673. doi:10.1016/j.eneco.2010.08.005
Oliver, C., and Holzinger, I. (2008). The Effectiveness of Strategic Political Management: A Dynamic Capabilities Framework. Amr 33 (2), 496–520. doi:10.5465/amr.2008.31193538
Ou, S., Lin, Z., Qi, L., Li, J., He, X., and Przesmitzki, S. (2018). The Dual-Credit Policy: Quantifying the Policy Impact on Plug-In Electric Vehicle Sales and Industry Profits in China. Energy Policy 121, 597–610. doi:10.1016/j.enpol.2018.06.017
Qian, X. Y., Hu, Q., and Su, D. R. (2017). Public Service Right, Residential Permit point Sand Measurement on Rural Migrant Citizenization. China Econ. Stud. 9 (05), 47–57.
Rubal, D., Kenneth, W., and Rebecca, L. (2019). Understanding Potential for Battery Electric Vehicle Adoption Using Large-Scale Consumer Profile Data. Energ. Rep. 5, 515–524. doi:10.1016/j.egyr.2019.04.013
Sierzchula, W., Bakker, S., Maat, K., and van Wee, B. (2012). Technological Diversity of Emerging Eco-Innovations: A Case Study of the Automobile Industry. J. Clean. Prod. 37, 211–220. doi:10.1016/j.jclepro.2012.07.011
Stokes, L. C., and Breetz, H. L. (2018). Politics in the U.S. Energy Transition: Case Studies of Solar, Wind, Biofuels and Electric Vehicles Policy. Energy Policy 113, 76–86. doi:10.1016/j.enpol.2017.10.057
Sykes, M., and Axsen, J. (2017). No Free Ride to Zero-Emissions: Simulating a Region's Need to Implement its Own Zero-Emissions Vehicle (ZEV) Mandate to Achieve 2050 GHG Targets. Energy Policy 110, 447–460. doi:10.1016/j.enpol.2017.08.031
Tang, J. H., Yang, F., and Xu, J. W. (2020). Optimization of Manufacturing Decision-Making for Automobile Companies Considering the Drivers of Both Sides of Supply and Demand under the Dual-Credit Policy. Syst. Eng. (4), 59–68.
Tsakiris, N., Hatzipanayotou, P., and Michael, M. S. (2018). The Efficiency of Decentralized Environmental Policies under Global Pollution and Tradable Emission Permits. J. Public Econ. Theor. 20 (4), 541–556. doi:10.1111/jpet.12296
Wang, L. X., Chen, X. G., and Yao, X. L. (2017). Industrial Enterprises’response to Environmental Regulation Policy in China. China Soft Sci. 10, 143–152.
Wang, N., Fang, T., and Liu, X. (2019). Research on the Impact of Double Points Policy on China's Auto Market and Policy Evolution. China Soft Sci. 1, 203–215.
Wang, Z. P., Yuan, C. G., and Li, X. Y. (2020). An Analysis on Challenge and Development Trend of Safety Management Technologies for Traction Battery in New Energy Vehicles. Automotive Eng. 317 (12), 15–29. doi:10.3969/j.issn.1002-9753.2017.10.014
Weber, K. M., and Rohracher, H. (2012). Legitimizing Research, Technology and Innovation Policies for Transformative Change. Res. Pol. 41 (6), 1037–1047. doi:10.1016/j.respol.2011.10.015
Wen, G. R., and Huang, J. Q. (2020). Research on the Impact of Government Subsidies on R&D and Innovation Capacity of High-Tech Industries. East China Econ. Manag. 34 (7), 9–17. doi:10.19629/j.cnki.34-1014/f.200213013
Wesseling, J. H., Farla, J. C. M., Sperling, D., and Hekkert, M. P. (2014). Car Manufacturers' Changing Political Strategies on the ZEV Mandate. Transportation Res. D: Transport Environ. 33, 196–209. doi:10.1016/j.trd.2014.06.006
William, H., Jonn, A., and Erik, K. (2020). How to Slash Greenhouse Gas Emissions in the Freight Sector Policy Insights from a Technology-Adoption Model of Canada. Energy Policy 137, 111093. doi:10.1016/j.enpol.2019.111093
Xie, B. F. (2014). Residence Points System: Another "patch" of Household Registration Reform? Characteristics, Problems and Countermeasures of Shanghai Residence Points System. Popul. Res. 38 (01), 90–97.
Xie, W. H., and Zeng, D. C. (2019). Empirical Study on Competitiveness Evaluation of New Energy Automobile Industry in Guangdong Province Based on the New Diamond Model. Sci. Technol. Manag. Res. 039 (009), 56–61. doi:10.3969/j.issn.1000-7695.2019.09.009
Xiong, Y. Q., and Li, X. L. (2019). Analysis of the Roles and Differences of the Supply and Demand Side Policies of NEV Industry in Heterogeneous Markets. Stud. Sci. Sci. 4, 597–606.
Xiong, Y. Q., Fan, S. W., and Liu, X. Y. (2018). The Difference of Fiscal Subsidies for NEVs and R&D Investment Intensity of the Manufacturers: An Analysis Based on the Heterogeneity of the Manufacturer's Strategic Decision. Sci. Sci. Manag. S.T. 6, 72–83.
Yan, X. C., and Huang, G. T. (2020). Government Subsidies, Enterprise Economic and Innovation Performance, and Overcapacity: An Empirical Research Based on Strategic Emerging Industries. Nankai Econ. Stud. (01), 176–198.
Yi, L., Bai, N., Yang, L., Li, Z., and Wang, F. (2020). Evaluation on the Effectiveness of China's Pilot Carbon Market Policy. J. Clean. Prod. 246 (10), 1–10. doi:10.1016/j.jclepro.2019.119039
Yülek, M. A., Lee, K. H., Kim, J., and Park, D. (2020). State Capacity and the Role of Industrial Policy in Automobile Industry: A Comparative Analysis of turkey and South Korea. J. Industry, Competition Trade 20, 307–331. doi:10.1007/s10842-019-00327-y
Keywords: dual-credit policy, new energy vehicles, R&D investment, difference-in-difference model, industrial policy
Citation: Li X and Xiong QY (2021) Phased Impacts of China’s Dual-Credit Policy on R&D. Front. Energy Res. 9:694338. doi: 10.3389/fenrg.2021.694338
Received: 13 April 2021; Accepted: 10 June 2021;
Published: 15 July 2021.
Edited by:
Chan Wang, Guangdong University of Finance and Economics, ChinaReviewed by:
Ehsan Rasoulinezhad, University of Tehran, IranVidya C T, Center for Economic and Social Studies (CESS), India
Copyright © 2021 Li and Xiong. This is an open-access article distributed under the terms of the Creative Commons Attribution License (CC BY). The use, distribution or reproduction in other forums is permitted, provided the original author(s) and the copyright owner(s) are credited and that the original publication in this journal is cited, in accordance with accepted academic practice. No use, distribution or reproduction is permitted which does not comply with these terms.
*Correspondence: Xu Li, MzY4NDg2NjNAcXEuY29t