 Wantong Sun1,2*
 Na Wei1,2*
 Jinzhou Zhao1,2Shouwei Zhou1,2Liehui Zhang1,2Qingping Li2,3Lin Jiang1Yao Zhang1,2Haitao Li1,2Hanming Xu1Cong Li1Xuncheng Shen1Chenyang Xiong1
- 1State Key Laboratory of Oil and Gas Reservoir Geology and Exploitation, Southwest Petroleum University, Chengdu, China
- 2State Key Laboratory of Natural Gas Hydrate, Beijing, China
- 3CNOOC Research Institutes Limited Liability Company, Beijing, China
In the process of deep-water drilling, gas hydrate is easily formed in wellbores due to the low temperature and high pressure environment. In this study, a new, systematic, and accurate prediction method of temperature, pressure, and hydrate formation region in wellbores is developed. The mathematical models of wellbore pressure and transient heat transfer are established, the numerical solution method based on fully implicit finite difference method is developed, and the accuracy is verified by comparing with the field measured data. Combined with the hydrate phase equilibrium model, the hydrate formation region in wellbore is predicted, and the sensitivity effects of nine factors on wellbore temperature, pressure, and hydrate formation region are analyzed. Finally, the influence regularities and degree of each parameter are obtained. The increases of circulation time, geothermal gradient, displacement of drilling fluid, and injection temperature will inhibit the formation of hydrate in wellbores, and the influence degree increases in turn; the increases of wellhead backpressure and seawater depth will promote the formation of hydrate in wellbores, and the influence degree increases in turn. The changes of drilling fluid density, well depth, and hole deviation angle have little effect on the formation of hydrate in wellbores.
Introduction
Natural gas hydrate is a crystalline cage compound formed by the interaction between methane or other hydrocarbon gases and water at low temperature and high pressure, commonly known as “combustible ice” (Van der Waals and Platteeuw, 1958; Sloan and Koh, 2007). In recent years, the exploration and development of deep-water oil and gas resources have been deepened. Different from drilling on land, the temperature and pressure conditions needed for the formation of natural gas hydrate are much easier to achieve in deep-water drilling, because of the low temperature in wellbores near and above the seafloor under the influence of the low-temperature environment of seawater, and the high pressure in wellbores. After drilling into oil and gas reservoirs, it is very easy to form natural gas hydrate in annulus, which will lead to drilling problems such as wellbore blockage and flow safety (Ng and Robinson, 1976; Bai et al., 2004; Ning et al., 2010). Therefore, the accurate prediction of hydrate formation region in wellbores is very important to ensure the safety of deep-water drilling. It is necessary to make a comprehensive and in-depth study of wellbore temperature fields and pressure fields under different drilling parameters to accurately and reliably predict the hydrate formation region in wellbores of deep-water drilling, as the formation of natural gas hydrate is mainly affected by temperature and pressure (John et al., 1985; Sloan, 2003; Demirbas, 2010; Feng et al., 2019; Kvamme, 2019).
The existing research on wellbore temperature fields mainly focuses on numerical and analytical method. In 1969, Raymond (Raymond, 1969) made great progress in the study of wellbore temperature fields. The transient and quasi-steady numerical calculation models of wellbore temperature were established, but effects of heat source terms and some drilling parameters on wellbore temperature were not considered and calculation results were not accurate enough. This model lays an important basic theory for the development of wellbore temperature field calculation. In 1970, Holmes and Swift (Holmes and Swift, 1970) established an analytical model of wellbore temperature fields based on Raymond’s model, which is simple and convenient to use, but it can only calculate wellbore temperature under steady heat exchange. In 1973, Keller et al. (Keller et al., 1973) established a two-dimensional transient heat transfer model between wellbore and stratum based on Raymond’s model, and solved it using the finite difference method, but they ignored axial heat transfer of drilling fluid. In 1980, Wooly (Wooley, 1980) developed a computer software for calculating wellbore temperature field, which can calculate wellbore transient temperature in drilling, but it only analyzes software function and calculation results, and the mathematical model used is not described. In 1982, Marshall and Bentsen (Marshall and Bentsen, 1982) established a transient mathematical model of wellbore temperature distribution during drilling and cementing, and used partial differential equation to describe temperature distribution in drill string, drill string wall, annulus, and stratum. In 1991 and 1994, Hasan and Kabir (Hasan and Kabir, 1991; Hasan and Kabir, 1994) established an analytical model of wellbore temperature under the condition of positive circulation, reverse circulation, and stop circulation with the assumption of steady heat flow in wellbore and transient heat flow in stratum. This model was based on the analytical model of wellbore temperature field established by Holmes and Swift. In 2004, Gilberto and Alfonso (Espinosa-Paredes and Garcia-Gutierrez, 2004) established the wellbore temperature model and numerical simulator when a mixture of mud, water, and air is used as drilling fluid in geothermal wells. In 2015, Li et al. (Li et al., 2015) established a wellbore temperature differential equation for horizontal well drilling in high temperature stratum, and solved it numerically using the finite volume method. In 2015 and 2016, Yang et al. (Yang et al., 2015; Li et al., 2016) established a wellbore temperature model under the condition of well kick and used the finite difference numerical calculation method to carry out temperature analysis of wellbores and stratum during circulation and shut-in. In 2018, Zhang et al. (Zhang et al., 2018) analyzed heat transfer between wellbores and stratum during drilling, established a heat transfer mathematical model, and carried out numerical calculations of finite volume method. In 2018, Sun et al. (Sun et al., 2018) studied wellbore temperature distribution in the development of horizontal geothermal wells with carbon dioxide as a working fluid, and established a heat transfer model and solution method. In 2019, Yang et al. (Yang et al., 2019) established a method for determining and controlling wellbore thermal variation based on wellbore temperature field analysis in drilling.
In addition, many scholars have carried out numerical calculation and experimental research of wellbore pressure field under different conditions. In 1963, Duns and Ros (Duns and Ros, 1963) designed a gas-liquid two-phase flow experiment, and carried out wellbore pressure experiment and theoretical calculation based on flow pattern division. In 1965, Zuber and Findlay (Zuber and Findlay, 1965) proposed a gas-liquid two-phase flow drift model to accurately calculate pressure distribution of wellbore two-phase flow. In 1982, Sadatomi and Sato (Sadatomi et al., 1982) established a method for calculating the pressure field of gas-liquid two-phase flow in a vertical non-circular pipeline. In 1994, Ansari et al. (Ansari et al., 1994) established a pressure drop model of rising gas-liquid two-phase flow under different flow patterns, and compared this with field data to verify accuracy. In 2003, Lage et al. (Lage et al., 2003) carried out a wellbore pressure field test in underbalanced drilling with gas injection, and established relevant numerical calculation methods. In 2011, Sun et al. (Sun et al., 2011) established a wellbore multiphase flow model in the process of overflow, blowout, and killing based on well control safety, and carried out numerical calculations and applications of wellbore pressure. From 2015 to 2019, Wei et al. established mathematical models of wellbore pressure with multiphase flow during drilling in hydrate reservoir, and developed a corresponding numerical solution method (Wei et al., 2015; Wei et al., 2016; Wei et al., 2018a; Wei et al., 2019).
In view of wellbore temperature fields and pressure fields in the process of drilling, some scholars have carried out a lot of research and made great progress, but the research on deep-water drilling is still insufficient, especially on wellbore temperature fields in deep-water drilling. Moreover, there is no research on the prediction of hydrate formation region in wellbores during deep-water drilling, and an accurate, reliable, and systematic prediction method has not been established. In this study, a new, systematic, and accurate prediction method of temperature field, pressure field, and hydrate formation region in wellbores is developed, which is of great theoretical significance for ensuring safety in the exploration and development of deep-water oil and gas resources.
Physical Model
The physical model of drilling fluid flow and heat exchange in deep-water drilling is shown in Figure 1. The drilling fluid is injected from the wellhead into the drill string, flows down to the bottom hole, flows into the annulus through the bit, and then flows upward from the bottom hole to the wellhead (Wei et al., 2018b). In this process, continuous heat exchange occurs above the mud line among fluid in the drill string, in the drill string, in the fluid in the annulus, in the riser, and in seawater; this also occurs below the mud line among fluid in the drill string, in the drill string, in the fluid in the annulus, in the casing, in the cement ring, and in the stratum. At the same time, fluid flow in wellbores will carry heat and rub against the wall to produce heat. Affected by the low temperature environment of seawater, wellbore temperatures near and above the seafloor is lower. Under the action of gravity and drilling fluid flow, wellbore pressure is high.
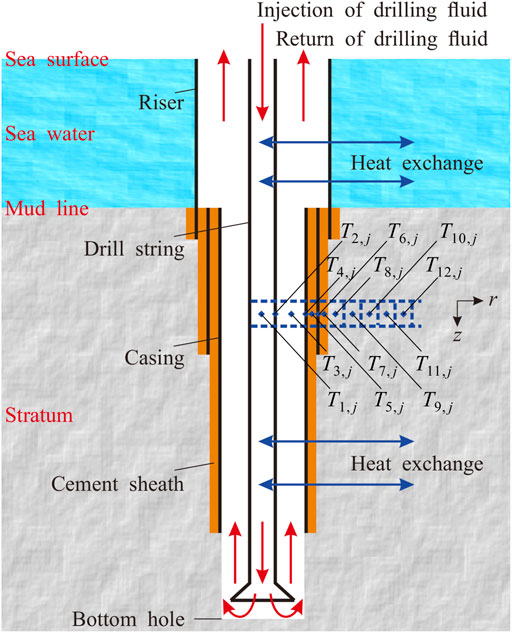
FIGURE 1. Physical model of drilling fluid flow and heat exchange in deep-water drilling.
We set the direction perpendicular to the wellbore as radial (r direction), and divided the wellbore and seawater or stratum around the well into different control layers along a radial direction. It is expressed by i; the control layers are 1, 2, 3, ···, i-1, i, i+1, ···. The wellbore direction is set to axial direction (z direction), and wellbore and seawater or stratum around the well are divided into different control nodes along an axial direction, expressed by j, and the nodes from top to bottom are 1, 2, 3, ···, j-1, j, j+1, ···. In order to simplify the description, casing in radial direction from inside to outside is named as the first, second, third layer, and so on. In this study, the actual process of deep-water drilling is taken as the base of the whole research, hypothetical, initial, and boundary conditions, and various influencing factors are all taken into account. The relevant mathematical models and numerical solution method are established, model verification, application, and sensitivity analysis are carried out, and influence regularities and degree of each factor are obtained.
Mathematical Models
Transient Heat Transfer Models of Wellbore in Deep-water Drilling
The following assumptions are made: 1) drilling fluid is incompressible and dense, thermal conductivity and specific heat capacity are constant; 2) in the process of drilling fluid flow in drill string and annulus, axial velocity is considered and radial velocity is ignored; 3) internal radial temperatures in a certain control layer are equal; 4) drill string is located in the center of the wellbore; and 5) seawater temperature is only related to depth and does not change with time. Then, the mathematical models of wellbore transient heat transfer in deep-water drilling are established as follows.
(1) Heat transfer in drill string
The energy of the fluid unit in the drill string consists of three parts: 1) the heat carried into the unit by the axial downward flow of the drilling fluid in the drill string; 2) the radial convective heat exchange between the drilling fluid in the drill string and the inner wall of the drill string; 3) the heat generated by flow friction between the drilling fluid in the drill string and the inner wall of the drill string. Based on the first law of thermodynamics, the heat transfer control equation in the drill string is established:
(2) Heat transfer of drill string
The heat transfer of the drill string unit consists of three parts: 1) the axial heat conduction of the drill string into the unit; 2) the radial convective heat exchange between the drilling fluid in the drill string and the inner wall of the drill string; 3) the radial convective heat exchange between the drilling fluid in the annulus and the outer wall of the drill string. The heat transfer control equation of the drill string is established:
(3) Heat transfer in annulus
The energy of the fluid unit in the annulus consists of four parts: 1) the heat carried into the unit by axial upward flow of the drilling fluid in the annulus; 2) the radial convective heat exchange between the drilling fluid in annulus and the outer wall of the drill string; 3) the radial convective heat exchange between the drilling fluid in the annulus and the inner wall of the casing; 4) the heat generated by flow friction between the drilling fluid in the annulus and the outer wall of the drill string or the inner wall of the casing. The heat transfer control equation in annulus is established:
(4) Heat transfer of the first layer of the casing
The heat transfer of the first layer of the casing can be divided into the heat transfer of the riser above the mud line and the heat transfer of the casing below the mud line.
For the well section above the mud line, the heat transfer of the riser unit consists of three parts: 1) the axial heat conduction of the riser into the unit; 2) the radial convective heat exchange between the drilling fluid in the annulus and the inner wall of the riser; 3) the radial convective heat exchange between the outer wall of the riser and the seawater. The heat transfer control equation of the riser above the mud line is established:
For the well section below the mud line, the heat transfer of the first layer of the casing unit consists of three parts: 1) the axial heat conduction of the first layer of the casing into the unit; 2) the radial convective heat exchange between the drilling fluid in the annulus and the inner wall of the first layer of casing; 3) the radial heat conduction between the outer wall of the first layer of casing and the cement sheath. The heat transfer control equation of the first layer of casing below the mud line is established:
(5) Heat transfer of casing, cement sheath, and surrounding stratum
For the well section below the mud line, the heat transfer of the unit of the casing, cement sheath, and surrounding stratum consists of the following three parts: 1) the axial heat conduction of the ith layer into the unit; 2) the radial heat conduction between the (i-1)th layer and the ith layer; 3) the radial heat conduction between the ith layer and the (i+1)th layer. The heat transfer control equation of the ith layer below the mud line is established:
Wellbore Pressure Model in Deep-water Drilling
In deep-water drilling, the change of wellbore pressure is mainly affected by gravity pressure drop, friction pressure drop, and accelerated pressure drop (Mohammad et al., 2016; Wei et al., 2018a; Wei et al., 2018b). The pressure gradient models in the annulus are established:
Auxiliary Models
(1) The models for calculating heat source
The heat source of per unit length in the drill string is (Yang et al., 2015):
The heat source of per unit length in the annulus is (Yang et al., 2015):
(2) The models for calculating friction coefficient
Under the condition of laminar flow (
Under the condition of turbulent flow (
(3) The phase equilibrium model of hydrate
The hydrate phase equilibrium model is required to be established in order to determine whether temperature and pressure in wellbores meet the conditions required for hydrate formation (Gao et al., 2019). In order to simplify calculation, this study focus on the methane hydrate and adopts the phase equilibrium model established through experimental data analysis by Dzyuba et al. (Dzyuba and Zektser, 2013):
According to Equation 15, phase equilibrium pressure peq can be calculated in view of annulus temperature T3. If peq is greater than annulus pressure pa, hydrate will not form. If peq is equal to pa, it is regarded as the critical position of hydrate formation. If peq is less than pa, hydrate will form and the position is in the hydrate formation region.
Model Solution and Verification
Initial and Boundary Conditions
(1) Initial conditions
The initial temperature distribution of each layer of the well is equal to the original temperature of the seawater and stratum. Above the mud line (
Below the mud line (
(2) Boundary conditions
The temperature of seawater does not change with time (Gao et al., 2017):
The temperature of distal stratum does not change with time:
The drilling fluid temperature in the drill string at the wellhead is equal to the drilling fluid injection temperature:
The temperatures of the drilling fluid in the drill string and the annulus and the drill string are equal at the bottom hole:
The annulus pressure at the wellhead is equal to wellhead backpressure:
Numerical Solution
In this study, the fully implicit finite difference method is used to solve mathematical models. As shown in Figure 2, two-dimensional mesh is used to describe wellbore and seawater or stratum. The mesh consists of an axial element (j) along the wellbore direction and a radial element (i) perpendicular to the wellbore direction. Combined with Figure 1, each axial unit corresponds to a different part of the axis from the wellhead to the bottom hole, and each radial unit corresponds to a different part of the radial direction from the interior of the drill string to the seawater or stratum.
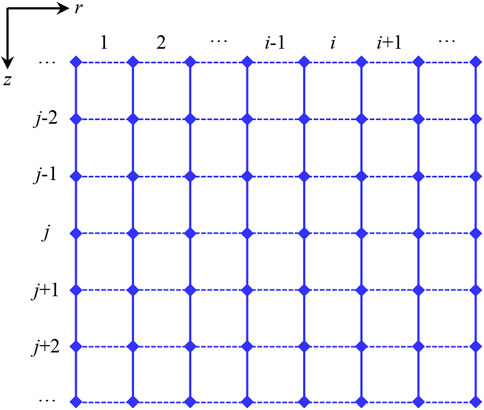
FIGURE 2. Schematic diagram of two-dimensional mesh division of wellbore and seawater or stratum.
The first order spatial derivative of partial differential equation is represented by two-point discrete backward difference:
The first order time derivative of partial differential equation is represented by two-point discrete backward difference:
The second order spatial derivative of partial differential equation is represented by three-point discrete central difference:
The partial differential equations on each mesh can be expressed in the following general format [41]:
Based on the above difference method, the transient heat transfer models can be modified to the following finite difference scheme.
Heat transfer model in the drill string can be written as:
Heat transfer model of the drill string can be written as:
Heat transfer model in the annulus can be written as:
Heat transfer model of the riser in the well section above mud line can be written as:
Heat transfer model of the first layer of casing in the well section below the mud line can be written as:
Heat transfer model of the ith layer in the well section below the mud line can be written as:
The pressure gradient model in the annulus can be modified to the following finite difference scheme:in the well section above the mud line,
in the well section below the mud line,
The hydrate phase equilibrium model can be modified to the following finite difference scheme:
(4) Numerical solution
Combining the above analysis and solution methods, the numerical solution process is established in Figure 3. α and β in Figure 3 are calculated error accuracy. According to the numerical solution process, temperature, pressure, and hydrate formation region in wellbores can be obtained in deep-water drilling by using the models and solution methods. The parameters need to be adjusted according to the actual drilling process in calculation, such as drilling parameters, wellbore structure and casing parameters, basic thermophysical parameters, and so on. If the gas in the reservoir is not only methane, the phase equilibrium model of mixed-gas hydrate should be considered, which can be referred to (Kvamme and Tanaka, 1995; Kvamme et al., 2020; Mohammad et al., 2020). In addition, this method can be used separately to accurately predict temperature and pressure in onshore or offshore drilling without considering hydrate, and the calculation parameters should be adjusted according to the actual basic parameters and boundary conditions.
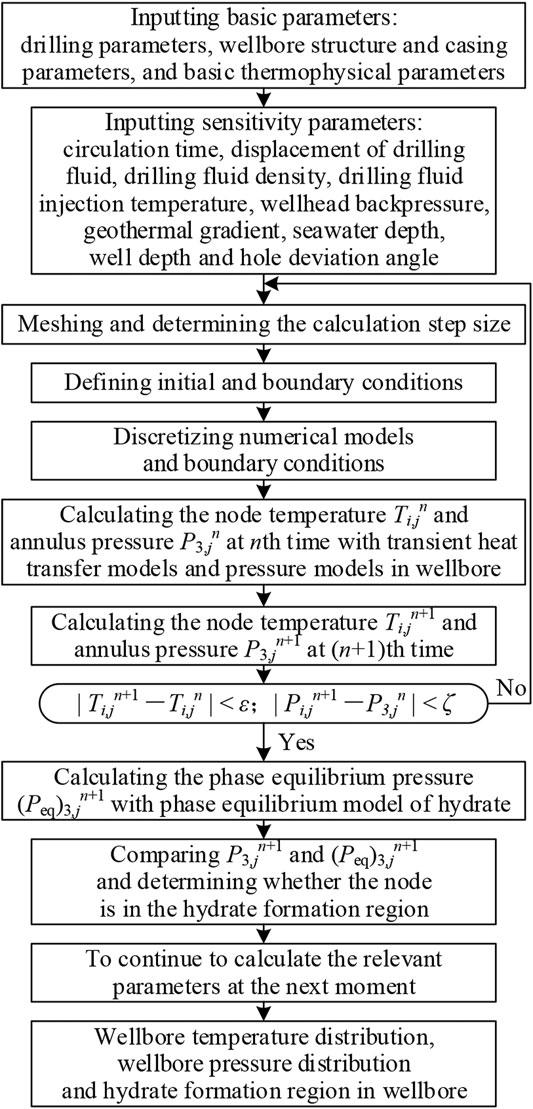
FIGURE 3. Numerical solution process.
Model Verification
In order to verify the accuracy of mathematical models and numerical solution method of wellbore pressure and transient heat transfer in deep-water drilling, the field measurement data during pilot hole drilling of deep-water well LW3-1-1 in the South China Sea (Ge et al., 2014) is selected to be compared with the calculation results. In addition, for further verification, the field measurement data during drilling of onshore well NP-X in China (Yang, 2012) is also used for comparison.
The basic parameters of deep-water well LW3-1-1 are as follows: seawater depth is 1,500.8 m, well depth is 1,530–1,630 m, sea surface temperature is 303 K, geothermal gradient is 0.035 K/m, diameter of wellbore is 0.660 m, outer diameter of drill pipe is 0.127 m, inner diameter of drill pipe is 0.108 m, displacement of drilling fluid is 0.025 m3/s, and drilling fluid density is 1,030 kg/m3. Through the numerical solution method established in this study, annulus temperature and pressure at the bottom hole during drilling are calculated, and the results are compared with field measurement data, shown as Figure 4.
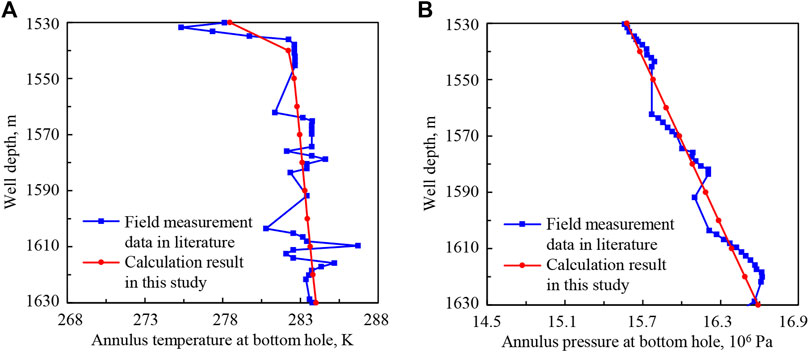
FIGURE 4. The comparisons between numerical results and field measurement data of LW3-1-1: (A) annulus temperature at the bottom hole; (B) annulus pressure at the bottom hole.
The basic parameters of onshore well NP-X are as follows: well depth is 5,105–5,139 m; vertical depth is 4,101–4,114 m; diameter of the wellbore is 0.152 m; surface temperature is 283 K; geothermal gradient is 0.031 K/m; diameters of borehole drills are 660.4, 444.5, 311.1, and 215.9 mm; diameters of casings are 508, 339.7, 244.5, and 177.8 mm at 250, 2000, 4,050, and 5,105 m depths, respectively; outer diameter of drill pipe is 0.127 m, inner diameter of drill pipe is 0.108 m; displacement of drilling fluid is 0.018 m3/s; and drilling fluid density is 930 kg/m3. Then, annulus temperature and pressure at the bottom hole during drilling are calculated, and the results are compared with field measurement data, shown as Figure 5.
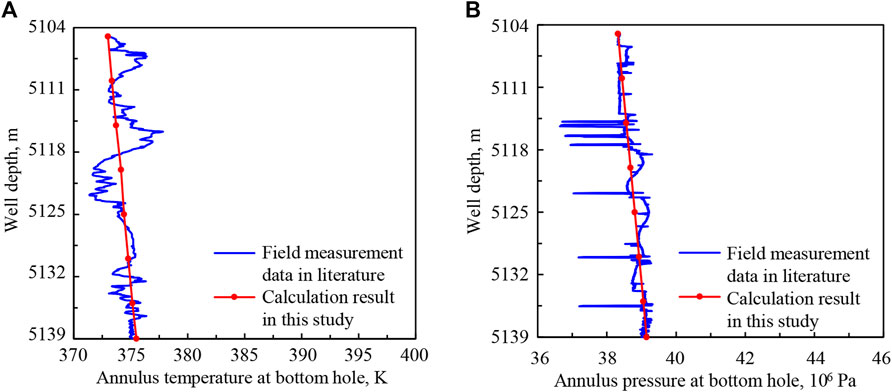
FIGURE 5. The comparisons between numerical results and field measurement data of NP-X: (A) annulus temperature at the bottom hole; (B) annulus pressure at the bottom hole.
As can be seen from Figures 4, 5, the errors between numerical results and field measurement data are small, and change trends are consistent. The accuracy of mathematical models and the numerical solution method of wellbore pressure and transient heat transfer in deep-water drilling is verified, which lays a foundation for the application and sensitivity analysis of the mathematical models.
Model Application and Sensitivity Analysis
The established mathematical models and numerical solution method are used to conduct the sensitivity analysis. Basic parameters of drilling, wellbore structure, and casing parameters, basic thermophysical parameters in the model application, and sensitivity analysis are shown in Tables 1–3.
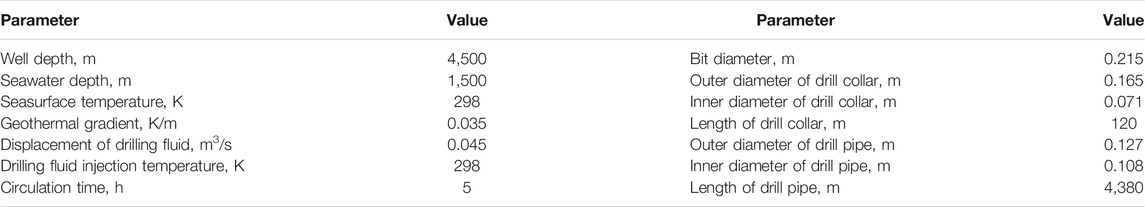
TABLE 1. Basic parameters of drilling.
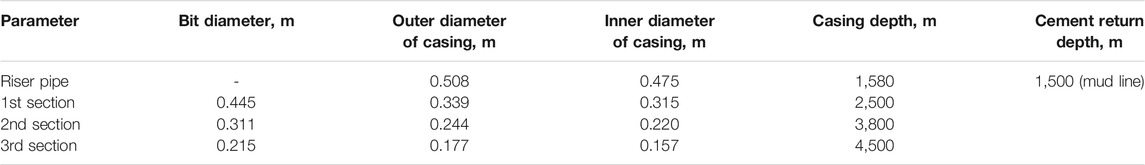
TABLE 2. Wellbore structure and casing parameters.
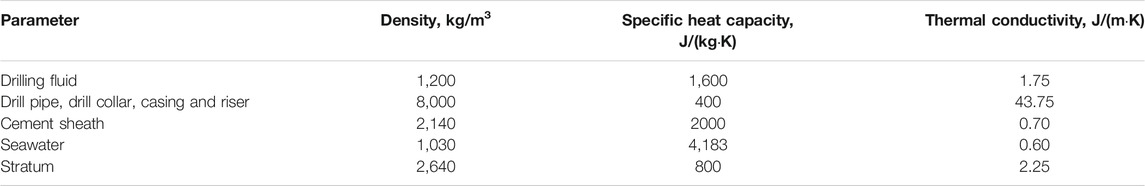
TABLE 3. Basic thermophysical parameters.
Sensitivity Analysis of Circulation Time
Figure 6 shows the variation regularities of wellbore temperature field, pressure field, and hydrate formation region in deep-water drilling under circulation times of 1, 3, 5, 10, and 20 h.
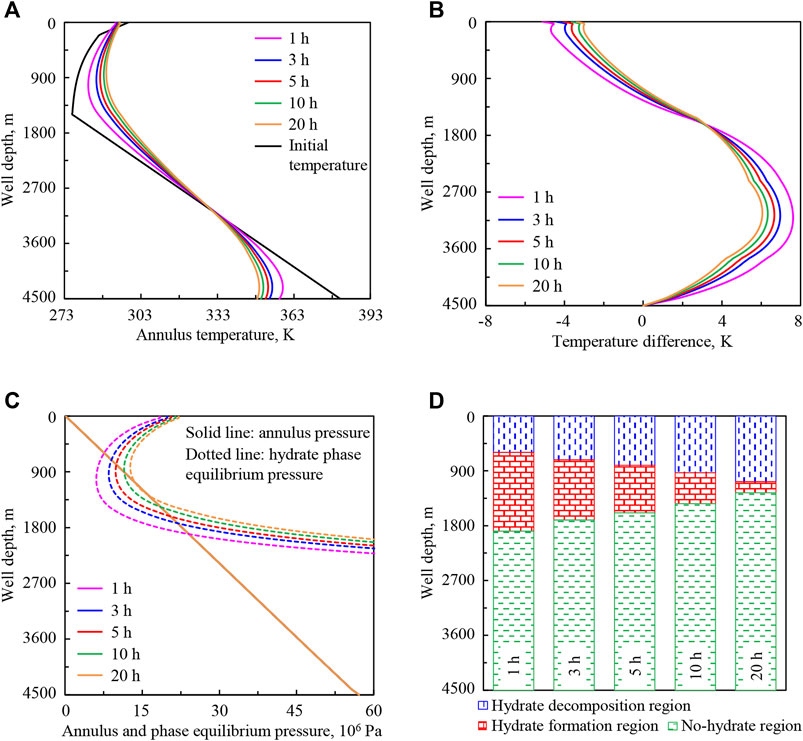
FIGURE 6. Variation regularities of wellbore temperature field, pressure field, and hydrate formation region in deep-water drilling under different circulation times: (A) annulus temperature, (B) temperature difference between the drilling fluid in annulus and in drill string, (C) annulus pressure and phase equilibrium pressure, (D) hydrate formation region. The solid lines under different circulation times in (C) are overlapped.
In Figure 6A, from 4,500 m at the bottom hole to 0 m at the wellhead, annulus temperature decreases at first and then increases. The annulus temperature is lower than the stratum temperature at the bottom hole, higher than the submarine temperature at the seafloor, and the lowest occurs in the well section above the seafloor. With the increase of circulation time from 1 to 20 h (purple to orange curve), the annulus temperature increases in the upper well section and decreases in the lower well section. The main reason is that drilling fluid in the annulus continuously absorbs heat from the drilling fluid in the drill string in the upper well section, and transfers heat to it in the lower part. At the same time, continuous upward return of drilling fluid in the annulus carries heat from the bottom hole and surrounding stratum. In the later stage of the cycle, the temperature balance among the drilling fluid in the drill string, in the drill string, in the drilling fluid in the annulus, in the casing, in the cement ring, and in the stratum or seawater is gradually reached, so variation amplitude of annulus temperature is lower.
In Figure 6B, the temperature of drilling fluid in the annulus is higher than that in the drill string in the lower well section (“positive”), and it is lower in the upper part (“negative”). With the increase of circulation time, the temperature balance among the control layers is gradually reached. The temperatures tend to be closer, and temperature difference (absolute value) is gradually reduced.
In Figure 6C, circulation time has no effect on annulus pressure. According to Equation 15, the hydrate phase equilibrium pressure peq is calculated in view of annulus temperature T3. Therefore, with the increase of circulation time, the hydrate phase equilibrium pressure in the upper well section increases, which is consistent with the change of annulus temperature (Figure 6A).
In Figures 6C,D, the region where the phase equilibrium pressure curve intersects the annulus pressure curve is the “hydrate formation region.” In the hydrate formation region, phase equilibrium pressure peq is less than annulus pressure pa. In the well section below formation region, peq is greater than pa, and hydrate will not form, thus we call it the “no-hydrate region.” In the well section above formation region, peq is also greater than pa, and we call it the “hydrate decomposition region.” With the increase of circulation time, the lower intersection point of phase equilibrium pressure and annulus pressure curves moves up, the upper intersection point moves down, and the intersection region becomes shorter. It shows that the starting position of hydrate formation moves up in the annulus, the end position moves down, and the formation region shortens.
The annulus temperature and hydrate formation region are greatly affected by circulation time. With the increase of circulation time, the annulus temperature tends to be more stable and the variation range decreases, which is beneficial to the stability of drilling fluid parameters. Affected by annulus temperature, the increase of circulation time will inhibit hydrate formation in wellbores in deep-water drilling. In addition, increased circulation time can also clean the wellbore in actual deep-water drilling. All the above factors are beneficial to safe drilling.
Sensitivity Analysis of Displacement of Drilling Fluid
Figure 7 shows the variation regularities of wellbore temperature field, pressure field, and hydrate formation region in deep-water drilling under displacements of drilling fluid of 0.035, 0.040, 0.045, 0.050, and 0.055 m3/s.
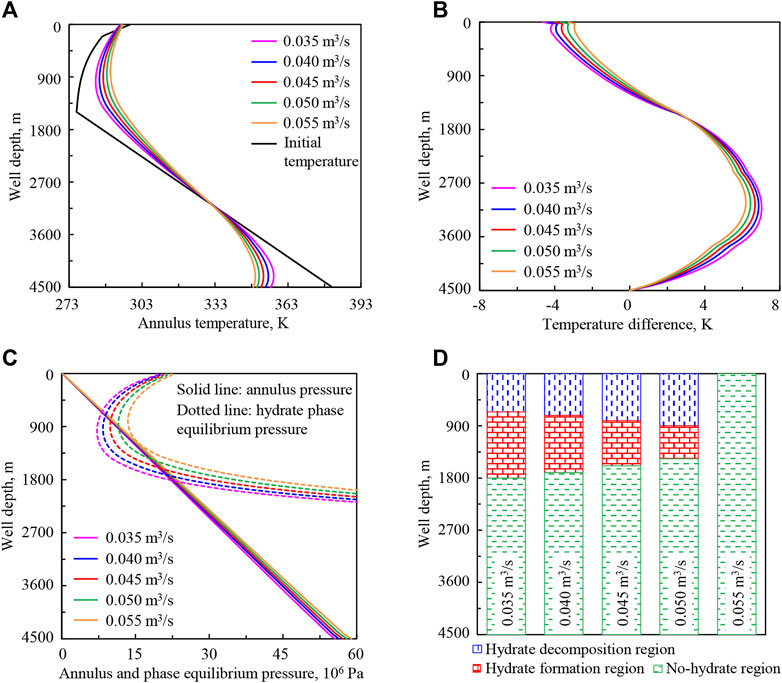
FIGURE 7. Variation regularities of wellbore temperature field, pressure field, and hydrate formation region in deep-water drilling under different displacements of drilling fluid: (A) annulus temperature, (B) temperature difference between the drilling fluid in annulus and in drill string, (C) annulus pressure and phase equilibrium pressure, (D) hydrate formation region.
In Figure 7A, the annulus temperature in the upper well section increases with the increase of displacement of drilling fluid from 0.035 to 0.055 m3/s (purple to orange curve), but that in the lower well section decreases instead. This is because the continuous upward return of drilling fluid in the annulus carries heat from the bottom hole and surrounding stratum. The greater the displacement of drilling fluid, the more heat is carried.
In Figure 7B, the drilling fluid velocity increases with the increase of displacement, the heat exchange between the drilling fluid in the annulus and in the drill string increases, then the temperatures tend to be closer, and temperature difference (absolute value) decreases.
In Figures 7C,D, with the increase of displacement, hydrate phase equilibrium pressure peq increases in the upper well section, and annulus pressure pa increases because of the friction. The increase of peq will inhibit hydrate formation, while the increase of pa will promote that. The lower intersection point of phase equilibrium pressure and annulus pressure curves moves up, the upper intersection point moves down, the intersection region becomes shorter, and finally there is no intersection region. It indicates that the starting position of hydrate formation moves up in the annulus, the end position moves down, the formation region shortens, and finally there is no formation region.
The annulus temperature, pressure, and hydrate formation region are greatly affected by drilling fluid displacement. With the increase of drilling fluid displacement, the variation range of annulus temperature decreases and the drilling fluid parameters will be more stable. In addition, the annulus pressure increases slightly, and the annulus temperature increases as the dominant factor, which inhibits hydrate formation in the wellbore. Increased drilling fluid displacement can also cool the drilling stem, clean the wellbore, and so on.
Sensitivity Analysis of Drilling Fluid Density
Figure 8 shows the variation regularities of wellbore temperature field, pressure field, and hydrate formation region in deep-water drilling under drilling fluid densities of 1,030, 1,100, 1,200, 1,350, and 1,500 kg/m3.
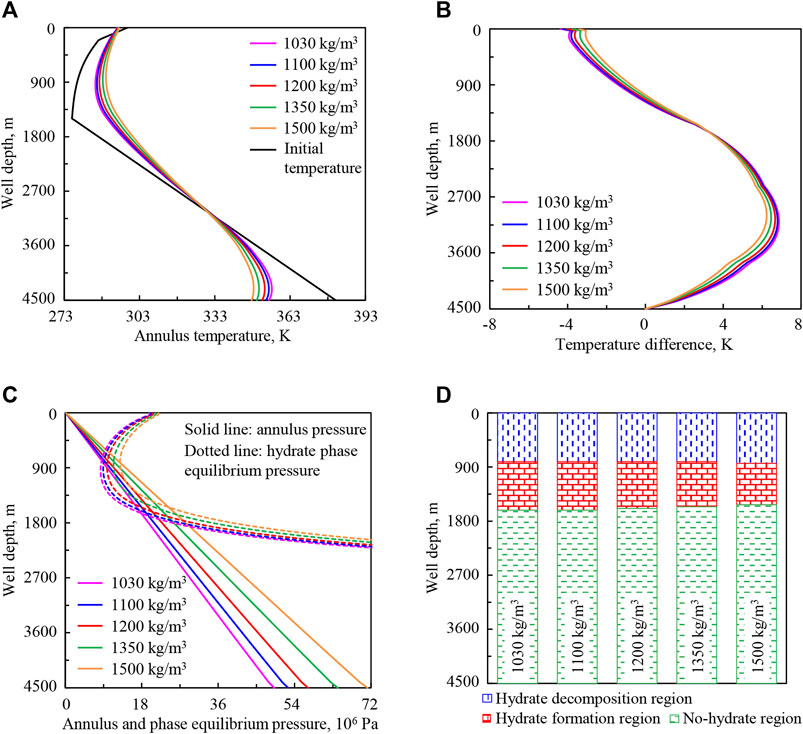
FIGURE 8. Variation regularities of wellbore temperature field, pressure field, and hydrate formation region in deep-water drilling under different drilling fluid densities: (A) annulus temperature, (B) temperature difference between the drilling fluid in the annulus and in the drill string, (C) annulus pressure and phase equilibrium pressure, (D) hydrate formation region.
In Figure 8A, with the increase of drilling fluid density from 1,030 to 1,500 kg/m3 (purple to orange curve), the mass of drilling fluid per unit length in the wellbore increases and the amount of heat carried increases. Therefore, more heat is carried back from the bottom hole and surrounding stratum, and drilling fluid in the annulus absorbs more heat from the drilling fluid in the drill string in the upper well section and transfers more heat to it in the lower part. So the annulus temperature increases in the upper well section and decreases in the lower part.
In Figure 8B, with the increase of drilling fluid density, the heat exchange among the control layers increases. This will promote the temperature balance among the control layers, so that the temperature of drilling fluid in the annulus and in the drill string tends to be closer, and temperature difference (absolute value) is reduced.
In Figures 8C,D, with the increase of drilling fluid density, hydrate phase equilibrium pressure peq increases in the upper well section. The pressure drops as gravity and friction increase, so the annulus pressure pa increases. The lower intersection point of phase equilibrium pressure and annulus pressure curves moves up slightly, the upper intersection point is basically unchanged, and the intersection region is slightly shortened. It indicates that the starting position of hydrate formation moves up slightly in the annulus, the end position is basically unchanged, and the formation region is slightly shortened. The main reason is that the inhibitory effect of the increase of peq on hydrate formation is basically equal to the promotion effect of the increase of pa.
The annulus temperature and pressure are greatly affected by drilling fluid density. With the increase of drilling fluid density, the variation range of annulus temperature decreases and the drilling fluid parameters will be more stable; the annulus pressure increases and this will help to avoid the risk of overflow. Combining the influences of annulus temperature and pressure, the change of drilling fluid density has little effect on the hydrate formation region in wellbores.
Sensitivity Analysis of Drilling Fluid Injection Temperature
Figure 9 shows the variation regularities of wellbore temperature field, pressure field, and hydrate formation region in deep-water drilling under drilling fluid injection temperatures of 288, 293, 298, 303, and 308 K.
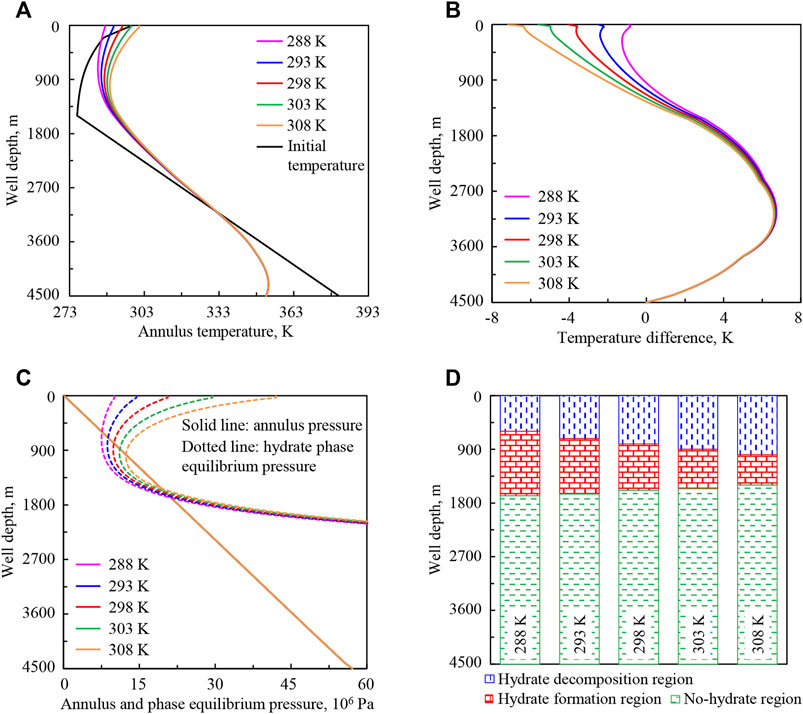
FIGURE 9. Variation regularities of wellbore temperature field, pressure field, and hydrate formation region in deep-water drilling under different drilling fluid injection temperatures: (A) annulus temperature, (B) temperature difference between the drilling fluid in the annulus and in the drill string, (C) annulus pressure and phase equilibrium pressure, (D) hydrate formation region. The solid lines under different drilling fluid injection temperatures in (C) are overlapped.
In Figure 9A, with the increase of drilling fluid injection temperature from 288 to 308 K (purple to orange curve), the drilling fluid injected into the drill string carries more heat, which will be transferred to the annulus, thus the annulus temperature in the upper well section will increase.
In Figure 9B, with the increase of drilling fluid injection temperature, the temperature difference (absolute value) between the drilling fluid in the annulus and in the drill string increases in the upper well section, and the variation amplitude decreases with the well depth increasing. When it comes to the lower section, it is little affected by injection temperature and does not change.
Figures 9C,D show that, with the increase of drilling fluid injection temperature, hydrate phase equilibrium pressure increases in the upper well section, and annulus pressure does not change. The lower intersection point of phase equilibrium pressure and annulus pressure curves moves up, the upper intersection point moves down, and the intersection region becomes shorter. It indicates that the starting position of hydrate formation moves up in the annulus, the end position moves down, and the formation region shortens.
The annulus temperature is greatly affected by injection temperature. The increase of drilling fluid injection temperature will increase annulus temperature and inhibit hydrate formation in the wellbore.
Sensitivity Analysis of Wellhead Backpressure
Figure 10 shows the variation regularities of wellbore temperature field, pressure field, and hydrate formation region in deep-water drilling under wellhead backpressures of 0.1 × 10⁶, 1 × 10⁶, 3 × 10⁶, 5 × 10⁶, and 7 × 10⁶ Pa.
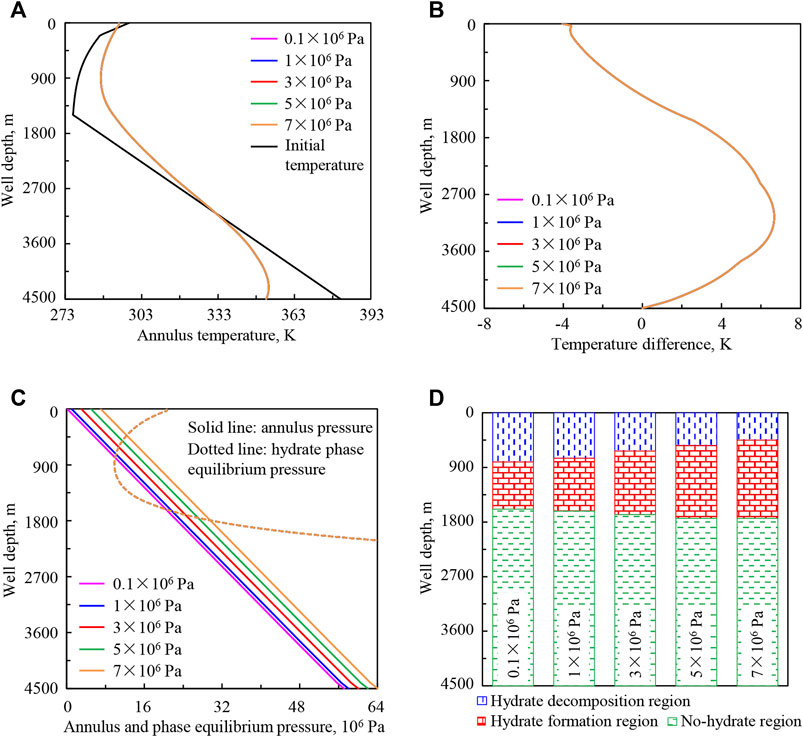
FIGURE 10. Variation regularities of wellbore temperature field, pressure field, and hydrate formation region in deep-water drilling under different wellhead backpressures: (A) annulus temperature, (B) temperature difference between the drilling fluid in the annulus and in the drill string, (C) annulus pressure and phase equilibrium pressure, (D) hydrate formation region. The lines under different wellhead backpressures in (A,B) are overlapped.
In Figures 10A,B, with the increase of wellhead backpressure from 0.1 × 10⁶ to 7 × 10⁶ Pa (purple to orange curve), the wellbore temperature is not affected, and the annulus temperature and the temperature difference between the drilling fluid in the annulus and in the drill string remain unchanged.
In Figures 10C,D, with the increase of wellhead backpressure, hydrate phase equilibrium pressure is constant, and annulus pressure increases significantly, the lower intersection point of phase equilibrium pressure and annulus pressure curves moves down, the upper intersection point moves up, and the intersection region becomes longer. It indicates that the starting position of hydrate formation moves down in the annulus, the end position of hydrate formation moves up, and the hydrate formation region increases.
The annulus pressure and hydrate formation region are greatly affected by wellhead backpressure. In the actual drilling process, the increase of back pressure can quickly adjust the bottom hole pressure and effectively prevent overflow. However, the increase of wellhead backpressure will promote hydrate formation in the wellbore. Therefore, back pressure should be appropriately adjusted in actual deep-water drilling.
Sensitivity Analysis of Geothermal Gradient
Figure 11 shows the initial temperature distributions of wellbore, seawater, and stratum under geothermal gradients of 0.025, 0.030, 0.035, 0.038, and 0.040 K/m. Figure 12 shows the variation regularities of wellbore temperature field, pressure field, and hydrate formation region in deep-water drilling under different geothermal gradients.
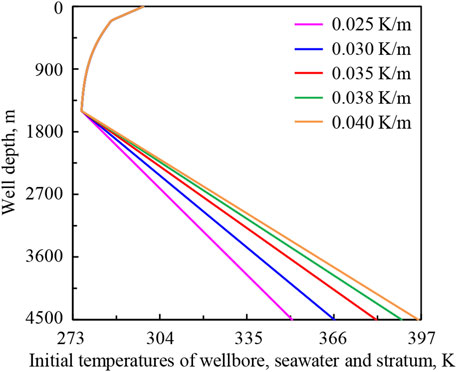
FIGURE 11. The initial temperature distributions of wellbore, seawater, and stratum under geothermal gradients.
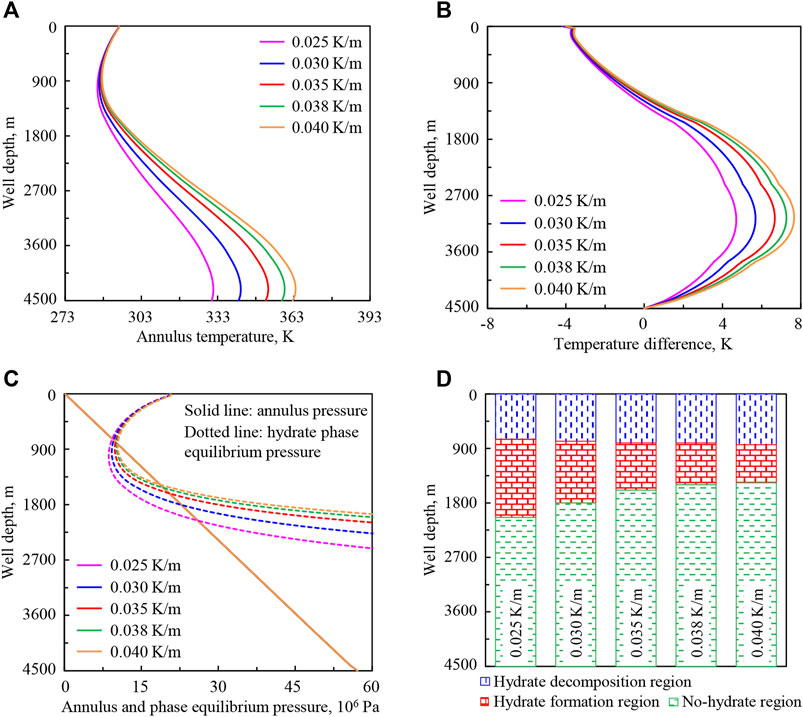
FIGURE 12. Variation regularities of wellbore temperature field, pressure field, and hydrate formation region in deep-water drilling under different geothermal gradients: (A) annulus temperature, (B) temperature difference between the drilling fluid in the annulus and in the drill string, (C) annulus pressure and phase equilibrium pressure, (D) hydrate formation region. The solid lines under different geothermal gradients in (C) are overlapped.
In Figure 12A, with the increase of geothermal gradient from 0.025 to 0.040 K/m (purple to orange curve), the annulus temperature in the lower well section increases and the variation amplitude decreases with the decrease of well depth, and it is basically unchanged near the wellhead. That is because stratum temperature increases, and more heat will be transferred to the drilling fluid in the annulus. Then the annulus temperature will increase in the lower well section and will be less affected after the drilling fluid returns to the well section above the mud line.
In Figure 12B, with the increase of geothermal gradient, the temperature difference (absolute value) between the drilling fluid in the annulus and in the drill string increases, and the variation amplitude increases at first and then decreases with the decrease of well depth.
In Figures 12C,D, with the increase of geothermal gradient, annulus pressure remains unchanged, and hydrate phase equilibrium pressure in the lower well section increases and is basically unchanged near the wellhead. The lower intersection point of phase equilibrium pressure and annulus pressure curves moves up, the upper intersection point moves slightly down, and the intersection region becomes shorter. It indicates that the starting position of hydrate formation moves up in the annulus, the end position moves slightly down, and the formation region is shortened.
The annulus temperature and hydrate formation region are greatly affected by geothermal gradient. With the increase of geothermal gradient, the variation range of annulus temperature increases and the drilling fluid with more stable parameters are needed. The larger the geothermal gradient, the less likely it is to form hydrate in the wellbore, and this is beneficial to safe drilling.
Sensitivity Analysis of Seawater Depth
Figure 13 shows the initial temperature distributions of the wellbore, seawater, and stratum under seawater depths of 500, 1,000, 1,500, 2000, and 2,500 m (corresponding well depths of 3,500, 4,000, 4,500, 5,000, and 5,500 m). Figure 14 shows the variation regularities of wellbore temperature field, pressure field, and hydrate formation region in deep-water drilling under different seawater depths.
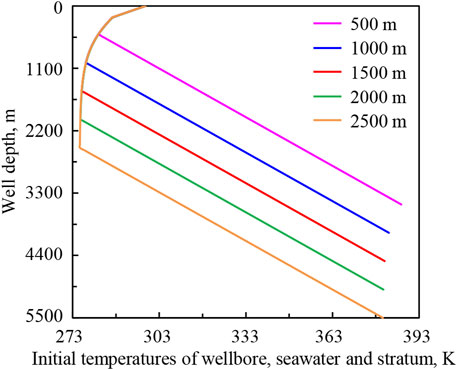
FIGURE 13. The initial temperature distributions of wellbore, seawater, and stratum under seawater depths.
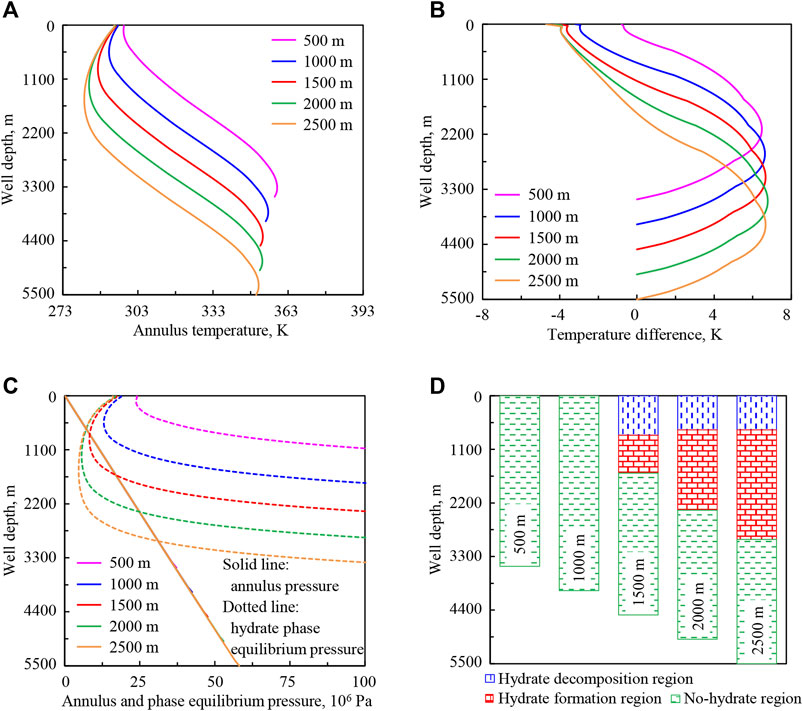
FIGURE 14. Variation regularities of wellbore temperature field, pressure field, and hydrate formation region in deep-water drilling under different seawater depths: (A) annulus temperature, (B) temperature difference between the drilling fluid in the annulus and in the drill string, (C) annulus pressure and phase equilibrium pressure, (D) hydrate formation region. The solid lines under different seawater depths in (C) are overlapped in the upper well section.
In Figure 14A, with the increase of seawater depth from 500 to 2,500 m (purple to orange curve), the annulus temperature in the upper well section is greatly reduced. That is because in the upward return process of drilling fluid in the annulus, the time of heat exchange between the drilling fluid and seawater increases, and more heat will be transferred to the seawater. The temperature difference (absolute value) between the drilling fluid in the annulus and in the drill string increases in the upper well section, and the variation gradients and the maximum values are respectively equal in the lower well section (Figure 14B).
In Figures 14C,D, with the increase of seawater depth, annulus pressure is basically unchanged, and hydrate phase equilibrium pressure is reduced. The lower intersection point of phase equilibrium pressure and annulus pressure curves moves down, the upper intersection point moves up, and the intersection region becomes longer, indicating that the starting position of hydrate formation moves down in the annulus, the end position moves up, and the formation region becomes longer. At the same time, when the seawater depth is 500 or 1,000 m, there is no hydrate formation in the annulus under the calculation conditions.
The annulus temperature and hydrate formation region are greatly affected by seawater depth. With the increase of seawater depth, the variation range of annulus temperature increases and the drilling fluid with more stable parameters will be needed. The deeper the seawater is, the easier it is to form hydrate in the wellbore. This effect should be considered in actual deep-water drilling.
Sensitivity Analysis of Well Depth
Figure 15 shows the variation regularities of wellbore temperature field, pressure field, and hydrate formation region in deep-water drilling under well depths of 3,800, 4,100, 4,500, 5,000, and 5,500 m.
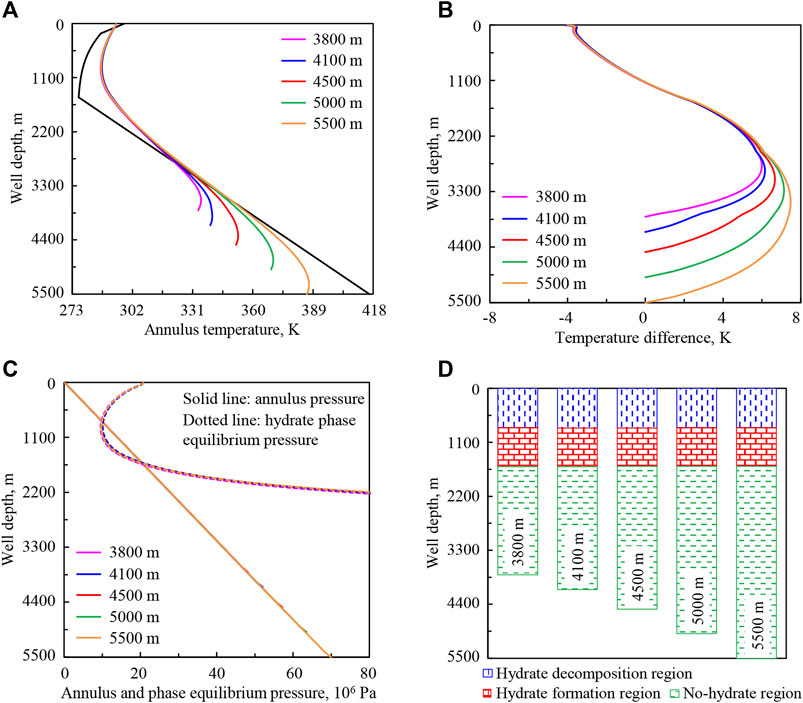
FIGURE 15. Variation regularities of wellbore temperature field, pressure field, and hydrate formation region in deep-water drilling under different well depths: (A) annulus temperature, (B) temperature difference between the drilling fluid in the annulus and in the drill string, (C) annulus pressure and phase equilibrium pressure, (D) hydrate formation region. The solid lines under different well depths in (C) are overlapped in the upper well section.
With the increase of well depth from 3,800 to 5,500 m (purple to orange curve), the time of heat exchange between the drilling fluid in the annulus and the stratum increases, and the drilling fluid will absorb more heat from the stratum. Thus, the annulus temperature in the lower well section increases (Figure 15A). In the upward return process of drilling fluid, the heat exchange between the drilling fluid in the annulus and the stratum or seawater will be stable after a period of time, so the annulus temperature in the upper well section is basically unchanged. Similarly in Figure 15B, the temperature difference between the drilling fluid in the annulus and in the drill string increases in the lower well section and is basically unchanged in the upper part.
Figures 15C,D show that, with the increase of well depth, annulus pressure gradient is basically unchanged, and hydrate phase equilibrium pressure in the upper well section is basically unchanged. The intersection point and intersection region of phase equilibrium pressure and annulus pressure curves are basically stable.
The annulus temperature and pressure in the lower well section are greatly affected by well depth. Therefore, the deeper the well is, the greater the influence on the drilling fluid performance is. Under the calculation conditions, the hydrate formation region in the wellbore is basically not affected by the change of well depth.
Sensitivity Analysis of Hole Deviation Angle
Figure 16 is the schematic diagram of wellbore trajectories with hole deviation angles of 0, π/6, π/3, π/2, and horizontal well. The corresponding depths of the five calculated wells are 4,500, 4,530, 4,646, 4,900, and 5,400 m. The well depths of deviation points are all 3,800 m and the vertical depths at the bottom hole are all 4,500 m. Figure 17 shows the initial temperature distributions of wellbore, seawater, and stratum under different calculation conditions. Figure 18 shows the variation regularities of wellbore temperature field, pressure field, and hydrate formation region in deep-water drilling under different hole deviation angles.
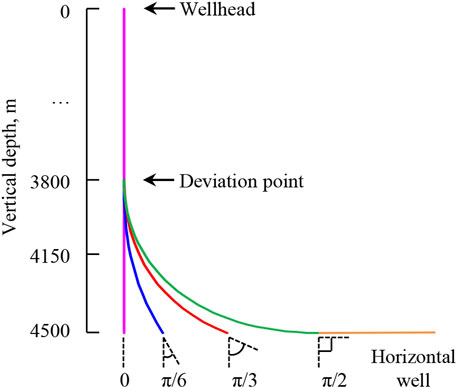
FIGURE 16. The schematic diagram of wellbore trajectories with different hole deviation angles.
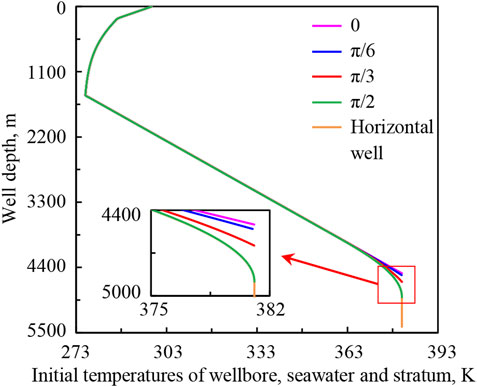
FIGURE 17. Initial temperature distribution of wellbore, seawater, and stratum under different hole deviation angles.
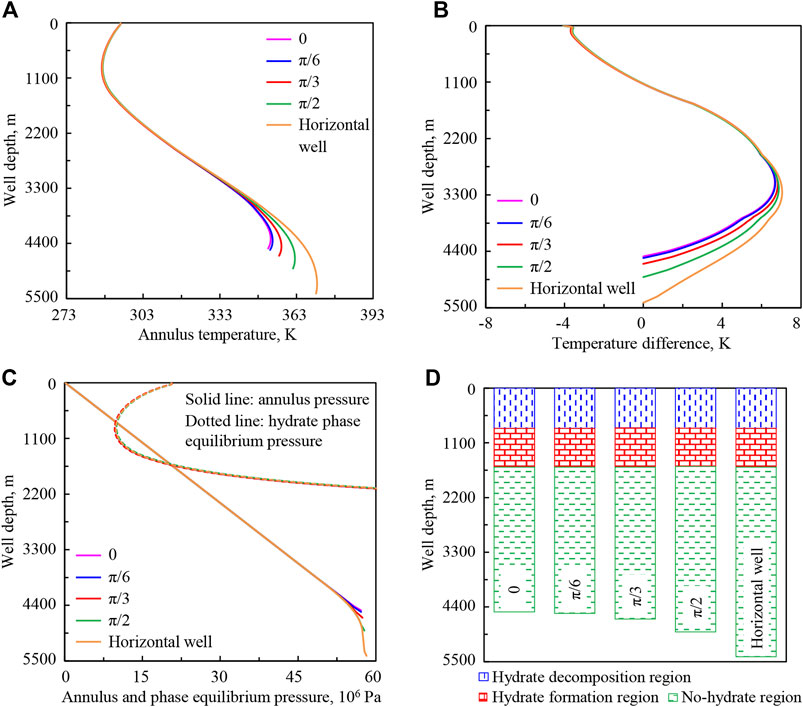
FIGURE 18. Variation regularities of wellbore temperature field, pressure field, and hydrate formation region in deep-water drilling under different hole deviation angles: (A) annulus temperature, (B) temperature difference between the drilling fluid in the annulus and in drill string, (C) annulus pressure and phase equilibrium pressure, (D) hydrate formation region. The solid lines under different hole deviation angles in (C) are overlapped in the upper well section.
In Figure 18A, with the increase of hole deviation angle from 0 to π/2 and then to horizontal well (purple to orange curve), the annulus temperature in the lower well section increases, but that in the upper part is basically unchanged. That is because, in the inclined well section, the time of heat exchange between the drilling fluid in the annulus and the stratum increases, thus more heat will be absorbed from the stratum. The temperature difference between the drilling fluid in the annulus and in the drill string changes same as the annulus temperature (Figure 18B).
In Figures 18C,D, with the increase of hole deviation angle, annulus pressure in the upper well section is unchanged, and increases in the lower part because of the friction. Hydrate phase equilibrium pressure in the upper well section is basically unchanged. The intersection point and intersection region of phase equilibrium pressure and annulus pressure curves are basically stable.
The annulus temperature in the lower well section is greatly affected by hole deviation angle, which will affect drilling fluid performance. Besides, under the calculation conditions, the hydrate formation region in the wellbore is basically not affected by the variation of hole deviation angle.
Comparative Analysis and Discussion
In order to obtain the influence degree of different factors on wellbore temperature field, pressure field, and hydrate formation region in deep-water drilling, we analyzed the effects of the above nine factors on some important parameters. The change rates of the calculation results are obtained when each influencing factor increases by 1%, as shown in Figure 19. The analytical equation is as follows:
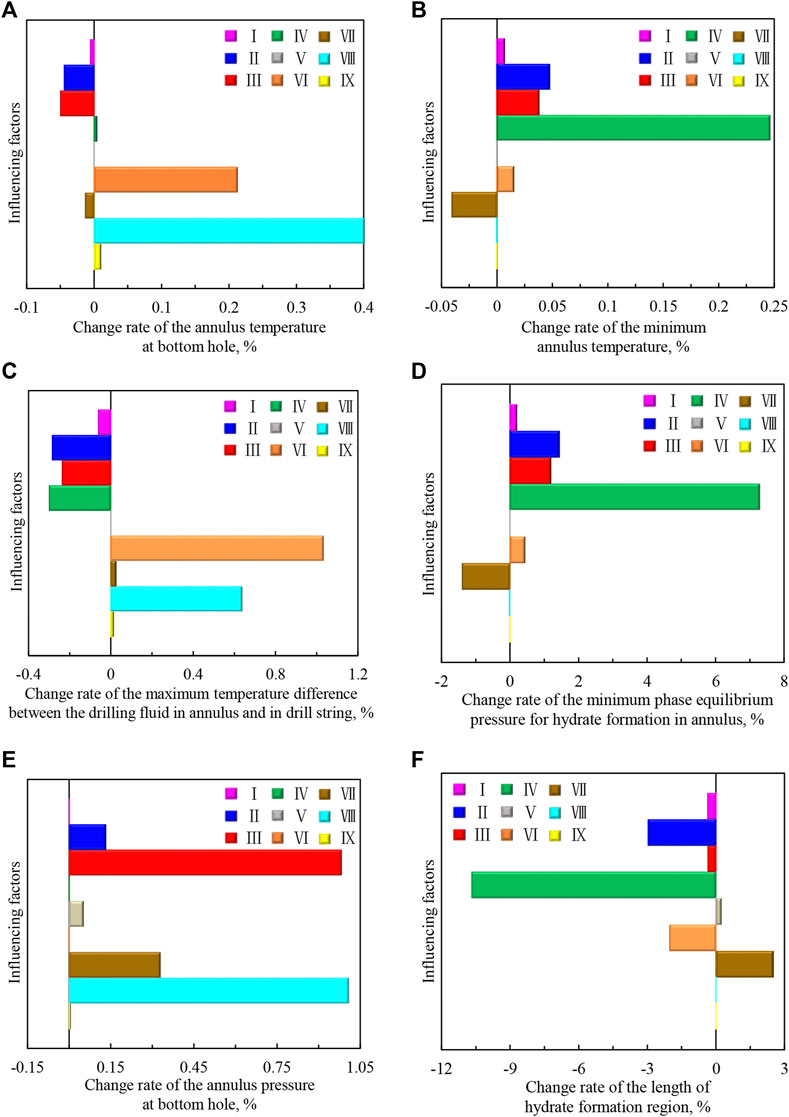
FIGURE 19. The change rates of the calculation results when each influencing factor increases by 1%: (A) the annulus temperature at the bottom hole; (B) the minimum annulus temperature; (C) the maximum temperature difference between the drilling fluid in the annulus and in the drill string; (D) the minimum phase equilibrium pressure for hydrate formation in the annulus; (E) the annulus pressure at the bottom hole; (F) the length of hydrate formation region. (Ⅰ-circulation time; Ⅱ-displacement of drilling fluid; Ⅲ-drilling fluid density; Ⅳ-drilling fluid injection temperature; Ⅴ-wellhead backpressure; Ⅵ-geothermal gradient; Ⅶ-seawater depth; Ⅷ-well depth; Ⅸ-hole deviation angle).
In Figure 19, with the increase of influencing factor, the “positive value” shows that the parameter increases and the “negative value” shows that the parameter decreases. Under the calculation condition of this study, when each factor increases by 1%, the degree of the influence on the annulus temperature at bottom hole is: wellhead backpressure < drilling fluid injection temperature < circulation time < hole deviation angle < seawater depth < drilling fluid displacement < drilling fluid density < geothermal gradient < well depth; the degree of the influence on the minimum annulus temperature is: wellhead backpressure < hole deviation angle < well depth < circulation time < geothermal gradient < drilling fluid density < seawater depth < drilling fluid displacement < drilling fluid injection temperature; the degree of the influence on the maximum temperature difference between the drilling fluid in annulus and in drill string is: wellhead backpressure < hole deviation angle < seawater depth < circulation time < drilling fluid density < drilling fluid displacement < drilling fluid injection temperature < well depth < geothermal gradient; the degree of the influence on the minimum phase equilibrium pressure for hydrate formation in annulus is: wellhead backpressure < hole deviation angle < well depth < circulation time < geothermal gradient < drilling fluid density < seawater depth < drilling fluid displacement < drilling fluid injection temperature; the degree of the influence on the annulus pressure at bottom hole is: circulation time = geothermal gradient = drilling fluid injection temperature < hole deviation angle < wellhead backpressure < drilling fluid displacement < seawater depth < drilling fluid density < well depth; the degree of the influence on the length of hydrate formation region is: hole deviation angle < well depth < wellhead backpressure < drilling fluid density < circulation time < geothermal gradient < seawater depth < drilling fluid displacement < drilling fluid injection temperature.
In the process of deep-water drilling, the performance of drilling fluid is greatly affected by the annulus temperature at the bottom hole, the minimum annulus temperature, and the maximum temperature difference, and the influence degree can be used as a guide for the parameters design of drilling fluid. The influence degree of the annulus pressure at the bottom hole directly provides support for wellbore pressure adjustion and safety design in deep-water drilling. The hydrate formation region is controlled by the minimum annulus temperature, minimum phase equilibrium pressure, and wellbore pressure. The influence degree of the length of hydrate formation region is very important for risk assessment of hydrate formation in deepwater drilling. Overall, parameters should be adjusted based on influence degree in actual deep-water drilling.
Conclusion
In this study, the mathematical models of wellbore pressure and transient heat transfer in deep-water drilling are established, a set of numerical solution method based on the fully implicit finite difference method is developed, and the accuracy is verified by comparison with the field measured data. Combined with the phase equilibrium model, the hydrate formation region in wellbores is accurately predicted, the application and sensitivity analysis of the models are carried out, the influence regularities and degree of each parameter are obtained, and a new, systematic, and accurate prediction method of temperature field, pressure field, and hydrate formation region in wellbores is developed.
With the increase of circulation time, annulus temperature increases in the upper well section and decreases in the lower part, and the hydrate formation region shortens. With the increase of drilling fluid displacement, annulus temperature increases in the upper well section and decreases in the lower part, annulus pressure increases and the hydrate formation region shortens. With the increase of drilling fluid density, annulus temperature increases in the upper well section and decreases in the lower part, annulus pressure increases, and the hydrate formation region changes little. With the increase of drilling fluid injection temperature, annulus temperature increases in the upper well section and does not change in the lower part, and the hydrate formation region shortens. With the increase of wellhead backpressure, wellbore temperature is not affected, annulus pressure increases, and hydrate formation region becomes longer. With the increase of geothermal gradient, annulus temperature increases in the lower well section and changes little in the upper part, and the hydrate formation region shortens. With the increase of seawater depth, annulus temperature in the upper well section decreases greatly and the hydrate formation region becomes longer. With the increase of well depth, annulus temperature increases in the lower well section and is basically unchanged in the upper part, annulus pressure gradient is unchanged, and the hydrate formation region is basically unchanged. With the increase of hole deviation angle, annulus temperature increases in the lower well section, annulus pressure does not change in the upper well section, and the hydrate formation region is basically unchanged.
Under the calculation conditions of this study, the increases of circulation time, geothermal gradient, displacement of drilling fluid, and injection temperature will inhibit hydrate formation in wellbores, and the influence degree increases in turn; the increases of wellhead backpressure and seawater depth will promote hydrate formation in wellbores, and the influence degree increases in turn. The changes of drilling fluid density, well depth, and hole deviation angle have little effect on hydrate formation in wellbores.
Data Availability Statement
The raw data supporting the conclusions of this article will be made available by the authors, without undue reservation.
Author Contributions
WS, NW, and JZ contributed to conception and design of the study. LZ and QL established the model. SZ, YZ, HL, and CX performed the calculations and analysis. WS wrote the first draft of the manuscript. LJ, HX, CL, XS, and NW wrote sections of the manuscript. All authors contributed to manuscript revision, read, and approved the submitted version.
Funding
The research was supported by the 111 Project (D21025), National Key Research and Development Program (No. 2019YFC0312302 and No. 2019YFC0312303), National Natural Science Foundation Item of China (No. 51874252), Open Fund Project of State Key Laboratory of Oil and Gas Reservoir Geology and Exploitation (No. PLN201816), and the Scientific Research Starting Project of Southwest Petroleum University (No. 2018QHZ007).
Conflict of Interest
Author QL was employed by the company CNOOC Research Institutes Limited Liability Company.
The remaining authors declare that the research was conducted in the absence of any commercial or financial relationships that could be construed as a potential conflict of interest.
References
Ansari, A. M., Sylvester, N. D., Sarica, C., Shoham, O., and Brill, J. P. (1994). A Comprehensive Mechanistic Model for Upward Two-phase Flow in Wellbores. SPE Prod. Facil. 9, 143–151. doi:10.2118/20630-pa
Bai, X. D., Huang, J. J., and Hou, Q. L. (2004). Contributing Factors and Preventing Measures of Hydrate in Deep-Water Drilling Mud. Adv. Fine Petrochemicals 5, 52–58.
Demirbas, A. (2010). Methane Hydrates as Potential Energy Resource: Part 2 - Methane Production Processes from Gas Hydrates. Energ. Convers. Manag. 51, 1562–1571. doi:10.1016/j.enconman.2010.02.014
Duns, H., and Ros, N. C. J. (1963). Vertical Flow of Gas and Liquid Mixtures in wells. 6th World Petroleum Congress. Frankfurt am Main, Germany: June 19–26, 1963.
Dzyuba, A. V., and Zektser, I. S. (2013). Variations in Submarine Groundwater Runoff as a Possible Cause of Decomposition of Marine Methane Hydrates in the Artcic. Water Resour. 40 (1), 83–94. doi:10.1134/s009780781301003x
Espinosa-Paredes, G., and Garcia-Gutierrez, A. (2004). Thermal Behaviour of Geothermal wells Using Mud and Air-Water Mixtures as Drilling Fluids. Energ. Convers. Manag. 45, 1513–1527. doi:10.1016/j.enconman.2003.08.023
Feng, Y., Chen, L., Suzuki, A., Kogawa, T., Okajima, J., Komiya, A., et al. (2019). Enhancement of Gas Production from Methane Hydrate Reservoirs by the Combination of Hydraulic Fracturing and Depressurization Method. Energ. Convers. Manag. 184, 194–204. doi:10.1016/j.enconman.2019.01.050
Gao, Y., Chen, Y., Wang, Z., Chen, L., Zhao, X., and Sun, B. (2019). Experimental Study on Heat Transfer in Hydrate-Bearing Reservoirs during Drilling Processes. Ocean Eng. 183, 262–269. doi:10.1016/j.oceaneng.2019.04.092
Gao, Y., Sun, B., Xu, B., Wu, X., Chen, Y., Zhao, X., et al. (2017). A Wellbore/formation-Coupled Heat-Transfer Model in deepwater Drilling and its Application in the Prediction of Hydrate-Reservoir Dissociation. SPE J. 22, 756–766. doi:10.2118/184398-pa
Ge, L., Hu, Z., Chen, P., Ma, T. S., Yang, Q., and Liao, J. B. (2014). Design of Pressure and Temperature Monitoring Device While Drilling in Deepwater Surface. Transducer Microsystem Tech. 33, 92–94. doi:10.13873/J.1000-9787(2014)11-0092-03
Hasan, A. R., and Kabir, C. S. (1991). Heat Transfer during Two-phase Flow in Wellbores: Part I–Formation Temperature. Dallas, TX: SPE Annual Technical Conference and Exhibition.
Hasan, A. R., and Kabir, C. S. (1994). Determination of Static Reservoir Temperature From Transient Data Following Mud Circulation. SPE Drill. Completion 9, 17–24. doi:10.2118/24085-pa
Holmes, C. S., and Swift, S. C. (1970). Calculation of Circulating Mud Temperatures. J. Petrol. Technol. 22, 670–674. doi:10.2118/2318-pa
John, V. T., Papadopoulos, K. D., and Holder, G. D. (1985). A Generalized Model for Predicting Equilibrium Conditions for Gas Hydrates. Aiche J. 31, 252–259. doi:10.1002/aic.690310212
Keller, H. H., Couch, E. J., and Berry, P. M. (1973). Temperature Distribution in Circulating Mud Columns. Soc. Petrol. Eng. J. 13, 23–30. doi:10.2118/3605-pa
Kvamme, B. (2019). Environmentally Friendly Production of Methane from Natural Gas Hydrate Using Carbon Dioxide. Sustainability 11, 1964. doi:10.3390/su11071964
Kvamme, B., and Tanaka, H. (1995). Thermodynamic Stability of Hydrates for Ethane, Ethylene, and Carbon Dioxide. J. Phys. Chem. 99, 7114–7119. doi:10.1021/j100018a052
Kvamme, B., Zhao, J., Wei, N., Sun, W., Saeidi, N., Pei, J., et al. (2020). Hydrate Production Philosophy and Thermodynamic Calculations. Energies 13, 672. doi:10.3390/en13030672
Lage, A. C. V. M., Fjelde, K. K., and Time, R. W. (2003). Underbalanced Drilling Dynamics: Two-phase Flow Modeling and Experiments. SPE J. 8, 61–70. doi:10.2118/83607-pa
Li, G., Yang, M., Meng, Y., Wen, Z., Wang, Y., and Yuan, Z. (2016). Transient Heat Transfer Models of Wellbore and Formation Systems During the Drilling Process Under Well Kick Conditions in the Bottom-Hole. Appl. Therm. Eng. 93, 339–347. doi:10.1016/j.applthermaleng.2015.09.110
Li, M., Liu, G., Li, J., Zhang, T., and He, M. (2015). Thermal Performance Analysis of Drilling Horizontal Wells in High Temperature Formations. Appl. Therm. Eng. 78, 217–227. doi:10.1016/j.applthermaleng.2014.12.055
Liu, G. X., Ling, W. X., Huang, J. H., and Feng, D. H. (2008). Calculation of Wellbore Temperature in Offshore Drilling. Offshore Oil 28, 83–86.
Marshall, S. A., and Bentsen, R. G. (1982). A Revision of the Nearctic Leptocera (Thoracochaeta Duda) (Diptera: Sphaeroceridae). Can. Entomol. 114, 63–78. doi:10.4039/ent11463-1
Mohammad, A. A., Morteza, G., and Seyed, R. (2016). Low Parameter Model to Monitor Bottom Hole Pressure in Vertical Multiphase Flow in Oil Production Wells. Petroleum 2, 258–266. doi:10.1016/j.petlm.2015.08.001
Mohammad, M., Samaneh, H., Shahin, A., Amir, H. S. D., and Sareh, B. (Forthcoming 2020). Developing a Robust Correlation for Prediction of Sweet and Sour Gas Hydrate Formation Temperature. Petroleum In Press. doi:10.1016/j.petlm.2020.07.007
Ng, H.-J., and Robinson, D. B. (1976). The Measurement and Prediction of Hydrate Formation in Liquid Hydrocarbon-Water Systems. Ind. Eng. Chem. Fund. 15, 293–298. doi:10.1021/i160060a012
Ning, F., Zhang, L., Tu, Y., Jiang, G., and Shi, M. (2010). Gas-hydrate Formation, Agglomeration and Inhibition in Oil-Based Drilling Fluids for Deep-Water Drilling. J. Nat. Gas Chem. 19, 234–240. doi:10.1016/s1003-9953(09)60077-3
Raymond, L. R. (1969). Temperature Distribution in a Circulating Drilling Fluid. J. Petrol. Technol. 21, 333–341. doi:10.2118/2320-pa
Sadatomi, M., Sato, Y., and Saruwatari, S. (1982). Two-phase Flow in Vertical Noncircular Channels. Int. J. Multiphase Flow 8, 641–655. doi:10.1016/0301-9322(82)90068-4
Sloan, E. D., and Koh, C. A. (2007). Clathrate Hydrates of Natural Gases. 3rd Edn. Boca Raton, FL: CRC Press.
Sloan, E. D. (2003). Fundamental Principles and Applications of Natural Gas Hydrates. Nature 426, 353–359. doi:10.1038/nature02135
Sun, B. J., Wang, Z. Y., Gong, P. B., and Song, R. R. (2011). Application of a Seven-Component Multiphase Flow Model to Deepwater Well Control. Acta Petrolei Sinica 32, 1042–1049.
Sun, F., Yao, Y., Li, G., and Li, X. (2018). Performance of Geothermal Energy Extraction in a Horizontal Well by Using CO2 as the Working Fluid. Energ. Convers. Manag. 171, 1529–1539. doi:10.1016/j.enconman.2018.06.092
Van der Waals, J. H., and Platteeuw, J. C. (1958). Clathrate Solutions. Advances in Chemical Physics. 1st Edn. Hoboken, NJ: John Wiley & Sons.
Wei, N., Meng, Y.-F., Li, G., Guo, P., Liu, A.-Q., Xu, T., et al. (2015). Foam Drilling in Natural Gas Hydrate. Therm. Sci. 19, 1403–1405. doi:10.2298/tsci1504403w
Wei, N., Sun, W.-T., Meng, Y.-F., Liu, A.-Q., Zhao, J.-Z., Xu, C.-Y., et al. (2019). Change Mechanism of Transient Gas-Liquid Two-phase Flow in Wellbore During Marine Natural Gas Hydrate Reservoir Drilling. Therm. Sci. 23, 2179–2187. doi:10.2298/tsci1904179w
Wei, N., Sun, W., Meng, Y., Liu, A., Zhao, J., Zhou, S., et al. (2018). Multiphase Non Equilibrium Pipe Flow Behaviors in the Solid Fluidization Exploitation of marine Natural Gas Hydrate Reservoir. Energy Sci. Eng. 6, 760–782. doi:10.1002/ese3.251
Wei, N., Sun, W., Meng, Y., Zhou, S., Li, G., Guo, P., et al. (2016). Sensitivity Analysis of Multiphase Flow in Annulus during Drilling of Marine Natural Gas Hydrate Reservoirs. J. Nat. Gas Sci. Eng. 36, 692–707. doi:10.1016/j.jngse.2016.11.007
Wei, N., Xu, C., Meng, Y., Li, G., Ma, X., and Liu, A. (2018). Numerical Simulation of Gas-Liquid Two-phase Flow in Wellbore Based on Drift Flux Model. Appl. Math. Comput. 338, 175–191. doi:10.1016/j.amc.2018.03.067
Wooley, G. R. (1980). Computing Downhole Temperatures in Circulation, Injection, and Production Wells. J. Petrol. Technol. 32, 1509–1522. doi:10.2118/8441-pa
Yang, M. (2012). Basic Theory Study of Managed Temperature Drilling Technology. Chengdu, China: Southwest Petroleum University.
Yang, M., Li, X., Deng, J., Meng, Y., and Li, G. (2015). Prediction of Wellbore and Formation Temperatures During Circulation and Shut-In Stages Under Kick Conditions. Energy 91, 1018–1029. doi:10.1016/j.energy.2015.09.001
Yang, M., Luo, D., Chen, Y., Li, G., Tang, D., and Meng, Y. (2019). Establishing a Practical Method to Accurately Determine and Manage Wellbore Thermal Behavior in High-Temperature Drilling. Appl. Energ. 238, 1471–1483. doi:10.1016/j.apenergy.2019.01.164
Zhang, Z., Xiong, Y., Gao, Y., Liu, L., Wang, M., and Peng, G. (2018). Wellbore Temperature Distribution During Circulation Stage When Well-Kick Occurs in a Continuous Formation From the Bottom-Hole. Energy 164, 964–977. doi:10.1016/j.energy.2018.09.048
Zuber, N., and Findlay, J. A. (1965). Average Volumetric Concentration in Two-phase Flow Systems. J. Heat Trans.-T. ASME 87, 453–468. doi:10.1115/1.3689137
Nomenclature
T temperature, K
Tf stratum temperature, K
Tin drilling fluid injection temperature, K
ρ density, kg/m3
v flow velocity, m/s
c specific heat capacity, J/(kg·K)
λ thermal conductivity, W/(m·K)
h convective heat exchange coefficient, W/(m2·K)
Q heat source per unit length, W/m
di(i) inner diameter of the ith layer, m
di(o) outer diameter of the ith layer, m
dpi inner diameter of drill string, m
dpo outer diameter of drill string, m
dri inner diameter of riser, m
dro outer diameter of riser, m
dci inner diameter of the first layer of casing, m
dco outer diameter of the first layer of casing, m
p3 annulus pressure, Pa
peq hydrate phase equilibrium pressure at a certain temperature, Pa
pa0 wellhead backpressure, Pa
z well depth, m
zw seawater depth, m
zH bottom hole depth, m
t time, s
θ hole deviation angle, radian
f friction coefficient, dimensionless
g gravity acceleration, m/s2
I number of boundary layers in which stratum temperature is affected by wellbore temperature, dimensionless
qV displacement of drilling fluid, m3/s
Re Reynolds number, dimensionless
m calculation coefficient, dimensionless
n fluidity index, dimensionless
GT geothermal gradient, K/m
(z,t = 0) parameters at initial condition, K
(z = 0,t) parameters at wellhead, K; (z = zH,t) parameters at bottom hole
(z = zw,t) parameters at submarine
ε change rate of the calculation result
k number of a certain influencing factor
x0 comparative basis of the same influencing factor
xi ith value of a certain influencing factor
F(x0) calculation result under x0
F(xi) calculation result under xi
Subscript
i parameters of the ith layer, K
i-1 parameters of the (i-1)th layer, K
i+1 parameters of the (i+1)th layer, K
1 parameters of drilling fluid in drill string
2 parameters of drill string
3 parameters of drilling fluid in annulus
4 parameters of the first layer of casing
4r parameters of riser above mud line
4c parameters of the first layer of casing below mud line
5 parameters of the first layer of cement sheath
w parameters of seawater
(i-1)i parameters between the (i-1)th layer and the ith layer
i(i+1) parameters between the ith layer and the (i+1)th layer
12 parameters between the drilling fluid in drill string and the inner wall of drill string
23 parameters between the drilling fluid in annulus and the outer wall of drill string
34 parameters between the drilling fluid in annulus and the inner wall of the first layer of casing
4w parameters between the outer wall of riser and the seawater
45 parameters between the first layer of casing and the first layer of cement sheath
Keywords: temperature, pressure, hydrate, formation region, numerical calculation, deep-water drilling
Citation: Sun W, Wei N, Zhao J, Zhou S, Zhang L, Li Q, Jiang L, Zhang Y, Li H, Xu H, Li C, Shen X and Xiong C (2021) Wellbore Temperature and Pressure Field in Deep-water Drilling and the Applications in Prediction of Hydrate Formation Region. Front. Energy Res. 9:696392. doi: 10.3389/fenrg.2021.696392
Received: 19 April 2021; Accepted: 19 May 2021;
Published: 29 June 2021.
Edited by:
Jiafei Zhao, Dalian University of Technology, ChinaReviewed by:
Yonghai Gao, China University of Petroleum (Huadong), ChinaLunxiang Zhang, Dalian University of Technology, China
Yue Hu, John Wood Group PLC, United Kingdom
Copyright © 2021 Sun, Wei, Zhao, Zhou, Zhang, Li, Jiang, Zhang, Li, Xu, Li, Shen and Xiong. This is an open-access article distributed under the terms of the Creative Commons Attribution License (CC BY). The use, distribution or reproduction in other forums is permitted, provided the original author(s) and the copyright owner(s) are credited and that the original publication in this journal is cited, in accordance with accepted academic practice. No use, distribution or reproduction is permitted which does not comply with these terms.
*Correspondence: Wantong Sun, c3Vud3RAc3dwdS5lZHUuY24=; Na Wei, d2VpbmE4MDgxQDE2My5jb20=