 Ding She
 Fubing Chen
- Institute of Nuclear and New Energy Technology, Tsinghua University, Beijing, China
The 10 MW High Temperature Gas-cooled Reactor-Test Module (HTR-10) is the first High Temperature Gas-cooled Reactor (HTGR) in China, which was operated from January 2003 to May 2007. The HTR-10 operation history provides very important data for the validation of HTGR codes. In this paper, the HTR-10 operation history is simulated with the PANGU code, which has been recently developed for HTGR reactor physics analysis and design. Models and parameters are constructed based on the measured data of the actual conditions. The simulation results agree well with the measurements in all steady-state power periods. The discrepancy of keff is generally below 0.5%, and the discrepancy of coolant outlet temperature is generally below 5°C. It is also figured out that the burnup of graphite impurities has considerable influence on the keff at the end of the operation history, which can cause over 1.5% discrepancy when neglecting the burnup of graphite impurities. By this work, the PANGU code’s applicability in actual HTGR fuel cycle simulations is demonstrated.
Introduction
The 10 MW High Temperature Gas-cooled Reactor-Test Module (HTR-10) Wu et al. (2002), designed, constructed, and operated by Institute of Nuclear and New Energy Technology (INET), Tsinghua University, and is the first High Temperature Gas-cooled Reactor (HTGR) in China. HTR-10 achieved the full power operation in January 2003, and then it was intermittently operated up to May 2007 with various power levels. During this period, kinds of tests were carried out on this reactor. Through the operation and test results of the HTR-10, its inherent safety features were fully demonstrated.
The HTR-10 operation history provides very valuable data to validate the codes employed in the HTGR analysis and design. Some of these data have been explored as benchmark test cases Methnani and Tyobeka (2013) to validate the system analysis codes such as TINTE Gerwin et al. (1989), but the validation work on reactor physics codes have not been well reported.
The PANGU code She et al. (2018b) has been recently developed at INET for pebble-bed HTGR neutronics analyses and fuel cycle simulations. Compared with the legacy codes such as VSOP Rütten et al. (2005), PANGU implements a lot of new methodologies, models, and capabilities (She et al., 2017; She et al., 2018a; Wang et al., 2019). In the work, preliminary validation of the PANGU code was done by code-to-code comparisons. This paper presents a further validation of the PANGU code utilizing the HTR-10 operation history. It is a comprehensive examination on the PANGU code’s applicability in actual HTGR fuel cycle simulations.
Due to the complexity of the HTR-10 operation history, big efforts have been made to prepare the models and parameters for the simulation work. First, fine time steps are employed in the step-by-step fuel cycle simulation, and the input parameters are processed from the measured data in all detailed power periods. Second, the pebble flow and shuffling model is constructed based on the actual pebble loading and discharging records. Third, the burnup of graphite impurity is considered to overcome the keff discrepancy at the end of operation history. As such, satisfactory simulation results are finally obtained with the PANGU code.
The remainder of this paper is organized as follows. The HTR-10 operation history gives a description of the HTR-10 operation history. Parameters and models used in the simulation introduces the key input parameters and calculation models used in the PANGU code simulation. The simulation results are shown and analyzed in Results and analysis. Concluding remarks are provided in Conclusion.
The HTR-10 Operation History
Figure 1 give the scheme of the HTR-10 reactor. The HTR-10 first criticality was attained on December 2000. At this initial core (IC) state, the core bottom conical region and the fuel discharging tube was filled with graphite pebbles, while the cylindrical part of the core was filled with 16,890 fuel and graphite mixing pebbles with the ratio of 57:43. Following the IC state, mixing pebbles were gradually added into the core, while the reactor was not operated until August 2002. From August 2002 to the end of the year, HTR-10 was intermittently operated below a power level of 3 MW. In January 2003, HTR-10 reached the designed full power level of 10 MW and a coolant outlet temperature of 700°C. At this full power initial core (FPIC) state, there were 23,900 mixing pebbles in the pebble bed core. By December 2004, the number of mixing pebbles increased up to about 27,000, which is defined as the full core (FC) state.
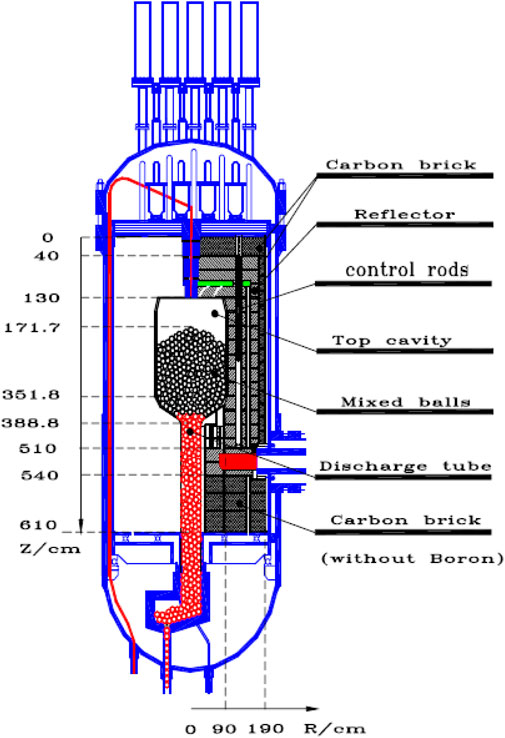
FIGURE 1. The scheme of the HTR-10.
Following the FC state, the pebbles in the core started recycling. The graphite pebbles were at first discharged from the fuel discharging tube and the core bottom, which were partially replaced with fresh fuel pebbles and then reloaded into the core. Thus, the ratio of the fuel pebbles in the core was increased gradually. With the progress of pebble recycling, the mixing pebbles also began to be discharged. The first discharged fuel pebble was recorded in April 2005.
The HTR-10 operation history simulated in this work is ranging from August 2002 to May 2007, lasting for about 1,700 days. The corresponding power history is shown in Figure 2 and summarized in Table 1. It can be seen that HTR-10 experienced frequent and relatively long-period shutdown, while the power operation only took around 30% of the whole operation days. Besides, the power was frequently varied during the power operation periods.
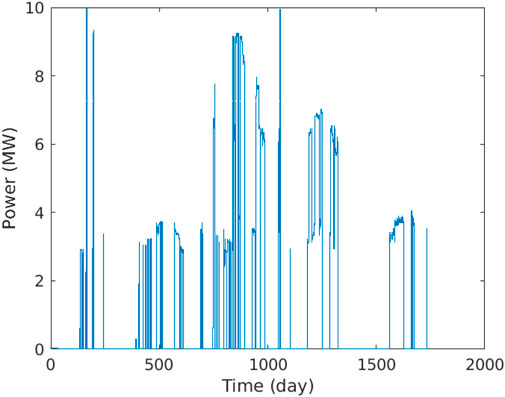
FIGURE 2. HTR-10 detailed power history.
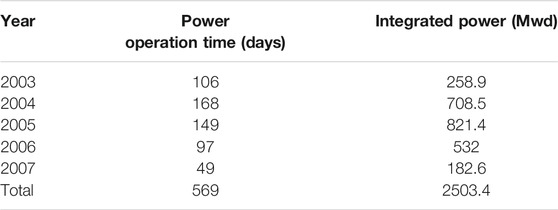
TABLE 1. Summary of HTR-10 power history (Chen et al., 2014).
During the HTR-10 operation history, some important data were measured in details. As for the fuel cycle simulation, the following three categories of measured data need be utilized. The first-category data is the measured control rod position in each power period, as shown in Figure 3. The y-axis value corresponds to the distance between the bottom of the control rod and the bottom of the pebble bed core. The second-category data is the measured thermal hydraulic parameters of the primary helium, mainly including the inlet temperature and the mass flow that are depicted in Figure 4. The third-category data is the number of loaded and discharged pebbles recorded per day. For example, the numbers of loaded fresh fuel pebbles and graphite pebbles are shown in Figure 5.
FIGURE 3. Control rod position (averaged) during the operation history.
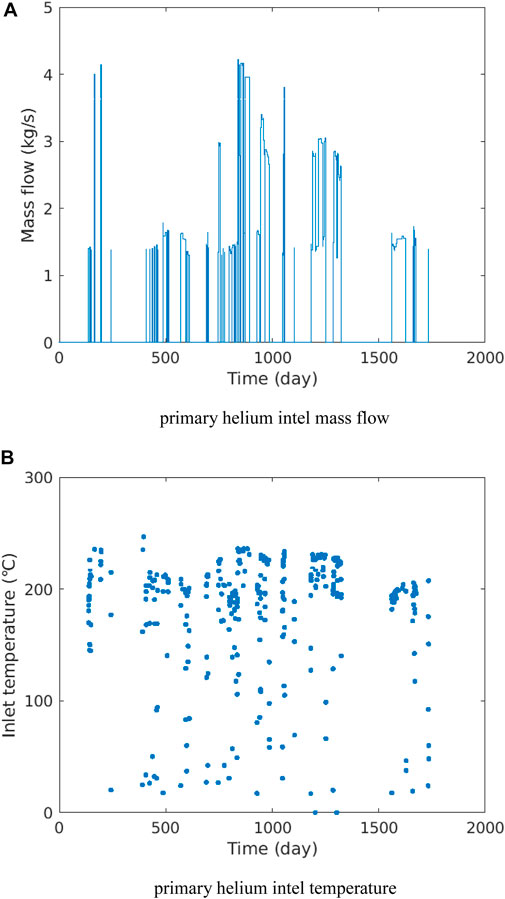
FIGURE 4. (A) primary helium intel mass flow (B) primary helium intel temperature. Thermal hydraulic parameters during the operation history.
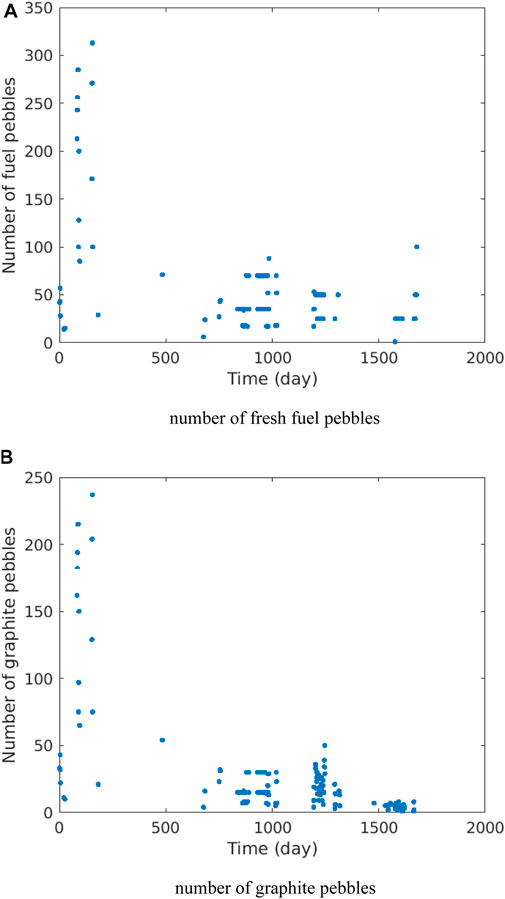
FIGURE 5. (A) number of fresh fuel pebbles (B) number of graphite pebbles. Number of the loaded pebbles recorded per day.
Parameters and Models Used in the Simulation
Time Steps and Input Parameters
The HTR-10 power history includes a total of 1,020 time periods. A lot of the power periods are quite short, reflecting the transient state of reactor starting up, shutting down, or changing power. Since the PANGU code is mainly used for the steady-state analysis, this work is focused on the simulation results of the steady-state power periods. Nevertheless, in order to conform to the realistic burnup and decay history, all of the detailed 1,020 power periods are explicitly treated by step-by-step fuel cycle simulations with PANGU, without any combination of the short power periods.
Noting that the original thermal-hydraulic data were measured in longer time periods compared with the power data, the thermal-hydraulic input parameters of the fine time steps are calculated by linear interpolation. Because PANGU employs a 2D R-Z model for whole core criticality calculations, it uses an averaged control rod position in each power period, which is calculated from the measured data. Finally, a complete input-parameter table is built for the subsequent simulations, the example data of which is shown in Table 2.
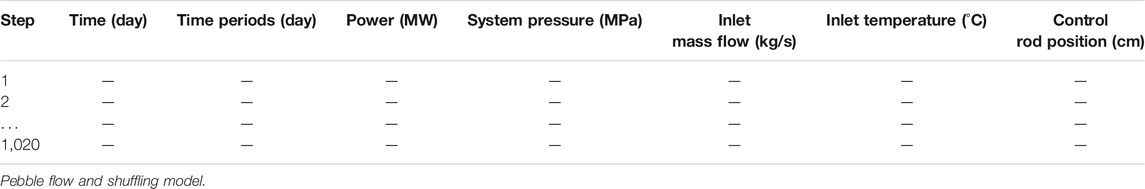
TABLE 2. Input-parameter table used in PANGU simulation (example data).
One main challenge in simulating the pebble-bed HTGR operation is related to the treatment of on-line refueling. In the first stages of the HTR-10 operation history, i.e. from the initial core to the full core state, mixing pebbles were loaded and the core height increased along with the reactor operation. In the second stages, the pebbles were recycled through the core and the graphite pebbles were gradually replaced with the fuel pebbles. The two stages are referred as loading stage and recycling stage, respectively.
The pebble flow model in PANGU is improved from the model used in the VSOP code (Hao and Li., 2014). The pebble-bed zone is radially divided into several flow channels, whose boundaries can be either straight or curved surfaces depending on the flow pattern. Each channel is equally divided into several layers. As such, the core is divided into a number of regions with equal volume. Besides, the pebbles in a region can further include different batches, so that each batch has the same composition. Compared with the VSOP code, PANGU provides a more flexible way of describing arbitrary mixing ratio of batches during the fuel shuffling process.
As shown in Figure 6, the following pebble flow model is employed in PANGU to simulate the HTR-10 fuel loading and recycling procedures. The pebble-bed zone is radially divided into five curved flow channels. Each channel is divided into different number of equal-volume regions, in order to illustrate the flow speed distributions among the channels. Considering there are 27,000 pebbles in the full core state, the core is divided into 270 regions, and each region occupies a volume of 100 pebbles.
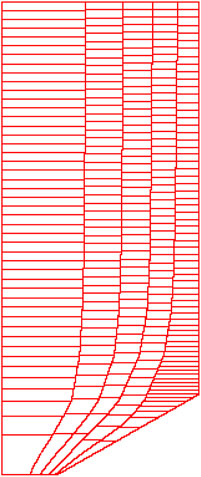
FIGURE 6. Pebble-flow model used in PANGU simulation.
Then, a number of shuffling steps are defined in the PANGU fuel cycle simulation. In the beginning of the loading stage, the regions in certain top layers are set as vacuum according to the actual core height of the first time step. With the increase of the loading height, the vacuum regions are filled with mixing pebbles level by level. During the recycling stage, the pebbles flow down along the channel, so that the pebbles of the bottom layer are discharged and the top layer is filled with new loaded pebbles. In each shuffling step, there are 500 mixing pebbles loaded into the core. The mixing ratio of these pebbles are evaluated from the pebble loading data in the operation history, by simply counting the ratio of the loaded fresh fuel, depleted fuel and graphite pebbles in every 500 pebbles. Table 3 gives the mixing ratio of loaded pebbles in each shuffling step.
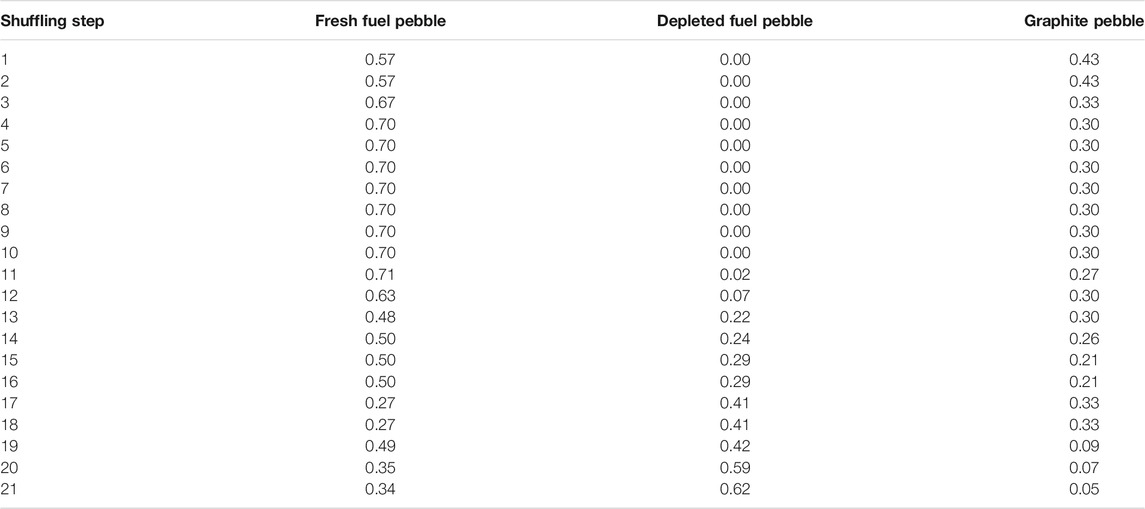
TABLE 3. Mixing ratio of loaded pebbles in the shuffle steps.
Besides, based on the recorded number of discharged pebbles and their mixing ratios, the flow speed of each channel can be roughly estimated. For instance, the flow speed of the central channel is estimated according to the time that the first fuel pebble was discharged. In this work, the number of regions in the five channels are 46, 50, 51, 55, and 68 respectively.
Burnup of Graphite Impurity
In the HTGR graphite, there are dozens of impurity isotopes, such as boron, chlorine, barium, iron, cadmium, and so on, which has considerable influence on keff. In the practical design of HTGR, the graphite impurities are described by the equivalent boron content (EBC) ASTM (2013) which preserves the neutron absorption of the original impurity isotopes. However, it is a problem on how to treat the EBC in burnup calculations.
In our previous study Li et al. (2018), the burnup characteristics of the graphite impurities in HTR-PM Zhang et al. (2006) was investigated to found that about 60% of the impurity isotopes are burnable. In order to simulate the burnup behavior of the graphite impurities, PANGU adopts a simple burnup model to update the time-dependent density of B-10 in EBC:
where n0 is the initial B-10 density, b is the user-input burnable ratio,
Calculation Flow
PANGU adopts a two-step calculation scheme. Burnup and temperature dependent cross-section tables are pre-generated with the lattice code XPZ She et al. (2016) and the multi-group data library processed from the ENDF/B VIII.0. These cross-section tables are then used in the fuel cycle simulations with the PANGU code.
The whole fuel cycle simulation contains 1,020 time steps. In each time step, there are iterations between the criticality calculation and the steady-state thermal hydraulics feedback, to obtain the converged keff and temperatures. After that, burnup or decay calculation is performed for the current-step time period. When required, the control rod position and the fuel shuffling is treated at the end of the step. The overall calculation flow is shown in Figure 7.
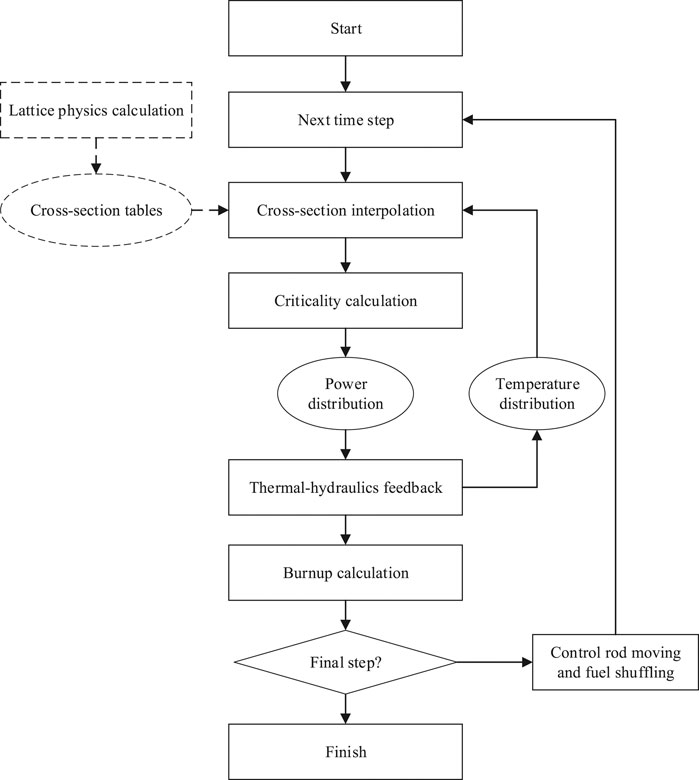
FIGURE 7. Calculation flow of the PANGU code simulation.
Results and Analysis
Figure 8 gives the calculated results of keff and the coolant outlet temperatures during all of the steady-state power periods. In general, the simulation results agree well with the measured data. The difference between the calculated keff and the experimental critical value (keff = 1.0) are generally within 0.5%. The differences between the calculated and measured coolant outlet temperatures are generally below 5°C. The errors in the head and the tail of each power period are relatively larger, because these transient states are beyond the scope of steady-state simulation in this work.
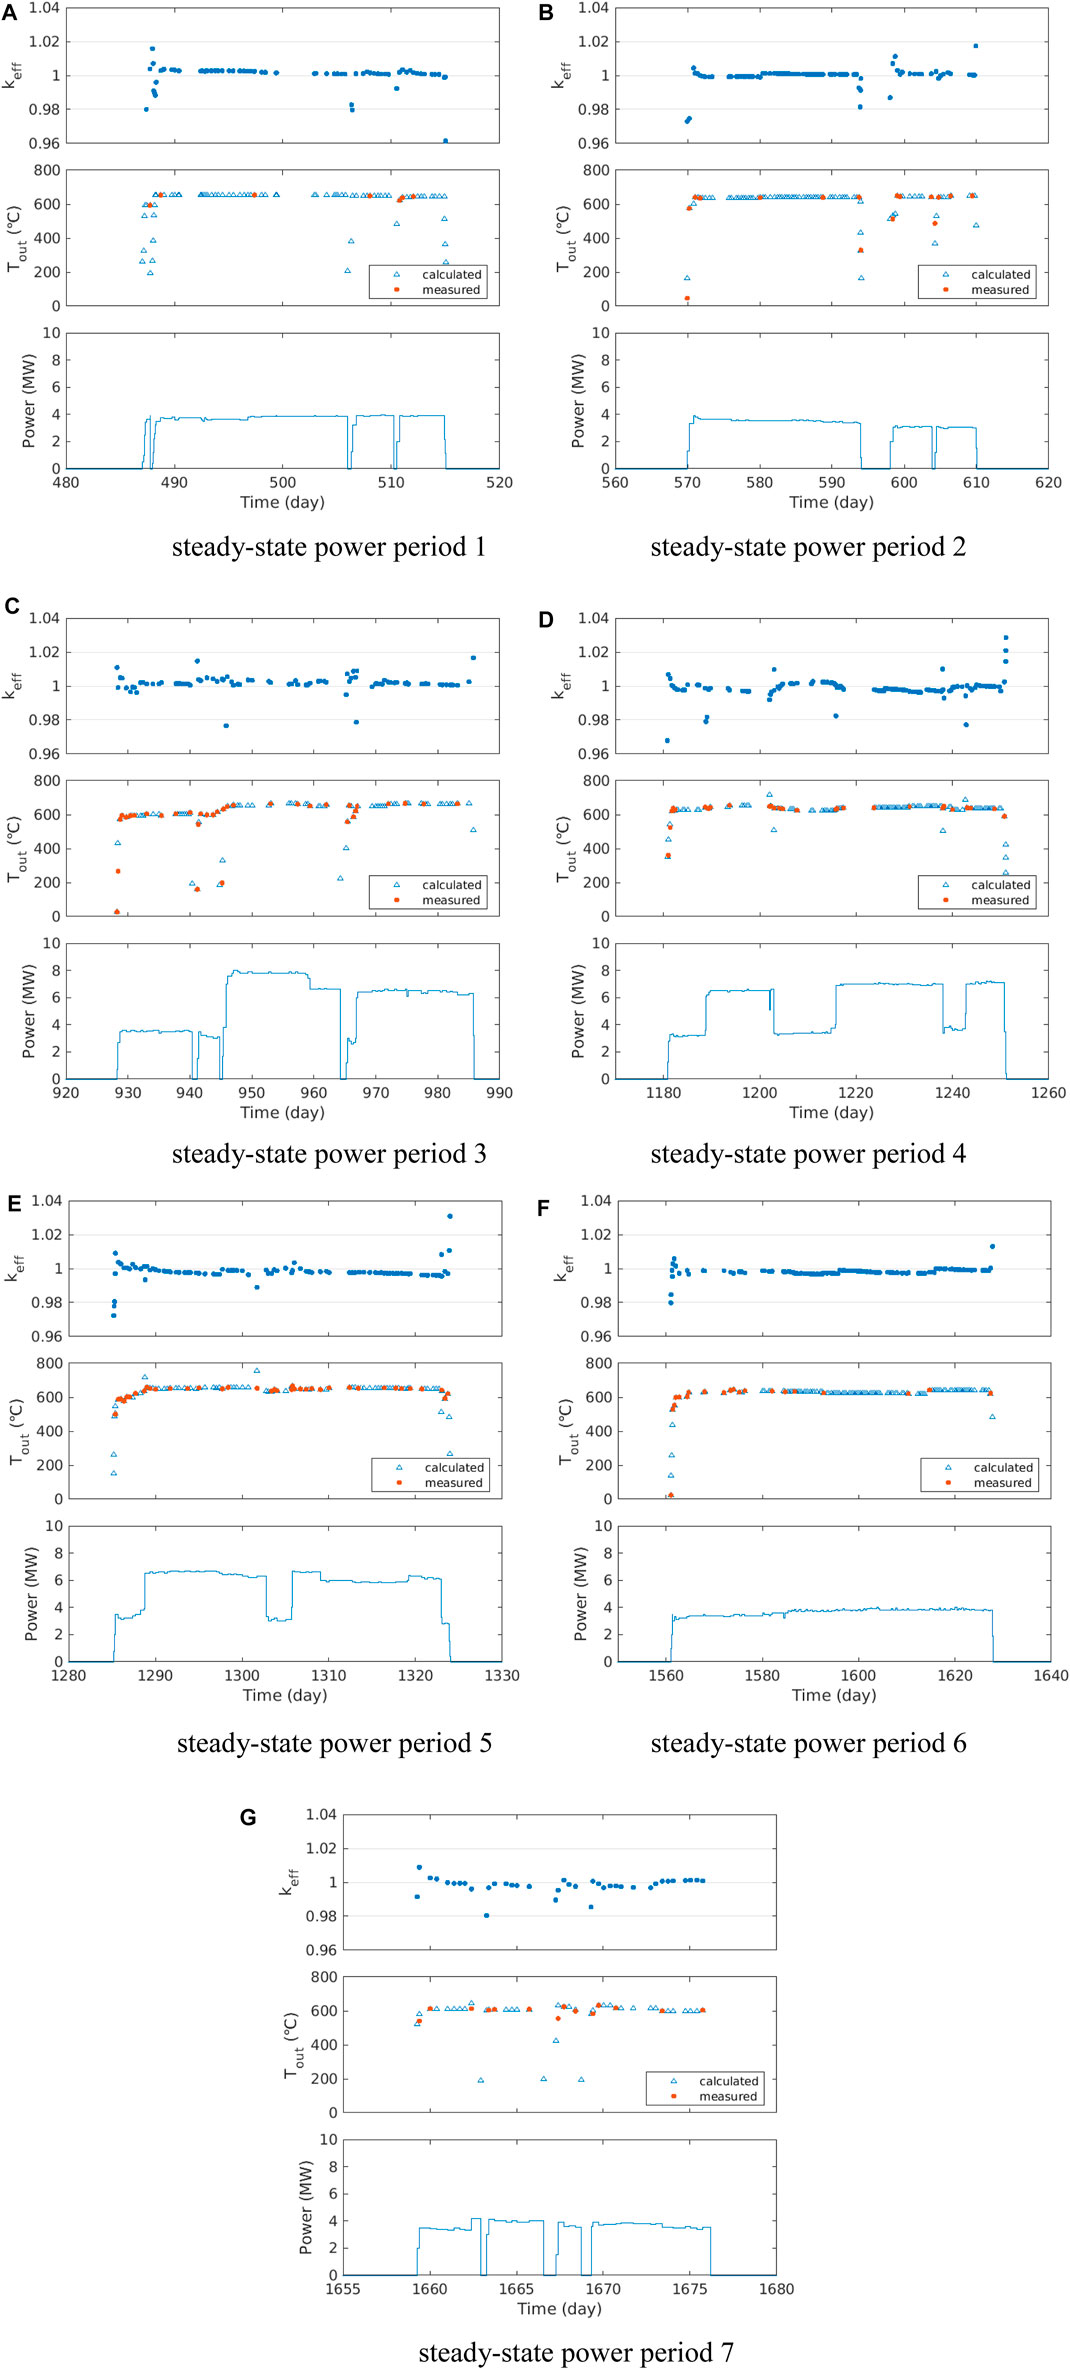
FIGURE 8. (A) steady-state power period 1 (B) steady-state power period 2 (C) steady-state power period 3 (D) steady-state power period 4 (E) steady-state power period 5 (F) steady-state power period 6 (G) steady-state power period 7. Simulation results of the HTR-10 operation history.
In order to analyze the influence caused by the burnup of the EBC, comparison simulations are done by changing the burnable ratio to 0 and 100%, respectively. In case of the non-burnable EBC, the graphite impurities (represented by EBC) are not burned during the power operation, which is expected to cause reactivity penalty in the fuel cycle calculation. In contrary, the 100% burnable EBC calculation condition is expected to result in extra reactivity. In Figure 9, it is seen that the calculated keff at the end of operation history is depressed by about 1.5–2% with the non-burnable EBC assumption, while it is overestimated by about 1–1.5% with the 100% burnable EBC assumption. Thus it is figured that the burnable ratio of EBC has significant influence on the HTGR fuel cycle calculation.
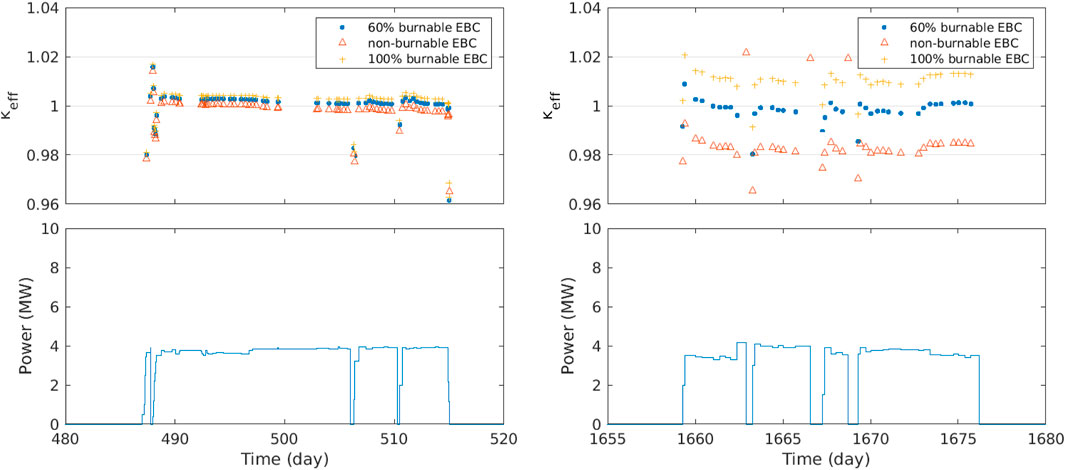
FIGURE 9. Influence of the EBC burnup
The large uncertainties caused by the nuclear data in HTGR simulations have been reported in some previous work (Bostelmann et al., 2020; Zhang et al., 2020). In our simulation of the HTR-10 operation history, it is found that the keff obtained by ENDF/B VII.0 is about 0.7% higher than that by ENDF/B VIII.0. As one limitation of this work, the difference caused by the nuclear data is not analyzed up to now.
Conclusion
The HTR-10 operation history has been simulated with the PANGU code, using delicate models and parameters converted from the measured data. The simulation results are satisfactory, and the PANGU code’s applicability is validated. Future work could be done to investigate the sensitivities and uncertainties caused by the nuclear data and some other input parameters in the simulation. Also, it would be of interest to propose and publish a practical burnup benchmark based on the HTR-10 operation data.
Data Availability Statement
The raw data supporting the conclusion of this article will be made available by the authors, without undue reservation.
Author Contributions
DS: code development, numerical simulation, and manuscript writing. FC: operation data analysis. BX: operation data preparation, and simulation result evaluation. LS: guidance and consultancy.
Funding
This work is supported by the National S&T Major Project (Grant No. ZX06901/ZX06902) of China, and CNNC Youth Research project.
Conflict of Interest
The authors declare that the research was conducted in the absence of any commercial or financial relationships that could be construed as a potential conflict of interest.
References
ASTM (2013). Standard Practice for Determining Equivalent Boron Contents of Nuclear Materials, -09, C1233.
Bostelmann, F., Ilas, G., and Wieselquist, W. A. (2020). Key Nuclear Data Impacting Reactivity in Advanced Reactors (No. ORNL/TM-2020/1557). Oak Ridge, TN (United States): Oak Ridge National Lab.(ORNL). doi:10.2172/1649145
Chen, F., Dong, Y., Zheng, Y., Shi, L., Zhang, Z., and Li, F. (2014). July. Progress of the HTR-10 Measured Data Utilization, 2014 22nd International Conference on Nuclear Engineering. American Society of Mechanical Engineers Digital Collection. doi:10.1115/icone22-30088
Gerwin, H., Scherer, W., and Teuchert, E. (1989). The TINTE Modular Code System for Computational Simulation of Transient Processes in the Primary Circuit of a Pebble-Bed High-Temperature Gas-Cooled Reactor. Nucl. Sci. Eng. 103 (3), 302–312. doi:10.13182/nse89-a23682
Hao, C., and Li, F. (2014). Investigation on the Pebble Bed Flow Model in VSOP. Nucl. Eng. Des. 271, 352–355.
Li, J., She, D., and Shi, L. (2018). Burnup Characteristics Analyses of Graphite Impurities in HTGR Fuel Element. Ann. Nucl. Energ. 118, 165–169. doi:10.1016/j.anucene.2018.04.018
Methnani, M., and Tyobeka, B. (2013). Evaluation of High Temperature Gas Cooled Reactor Performance: Benchmark Analysis Related to the PBMR-400, PBMM, GT-MHR, HTR-10 and the ASTRA Critical Facility. IAEA-TECDOC-1694.
Rütten, H. J., Haas, K. A., Brockmann, H., and Scherer, W. (2005). VSOP (99/05) Computer Code System. doi:10.4324/9780203987117
She, D., Guo, J., Liu, Z., and Shi, L. (2018b). PANGU Code for Pebble-Bed HTGR Reactor Physics and Fuel Cycle Simulations. Ann. Nucl. Energ. 126, 48–58.
She, D., Liu, Z., Guo, J., and Shi, L. (2018a). Leakage Correction in Group-Constant Generation for Pebble-Bed HTGRs. Prog. Nucl. Energ. 105, 76–82. doi:10.1016/j.pnucene.2017.12.015
She, D., Liu, Z., and Shi, L. (2017). An Equivalent Homogenization Method for Treating the Stochastic Media. Nucl. Sci. Eng. 185 (2), 351–360. doi:10.1080/00295639.2016.1272363
She, D., Liu, Z., and Shi, L. (2016). XPZ: Development of a Lattice Code for HTR. Ann. Nucl. Energ. 97, 183–189. doi:10.1016/j.anucene.2016.07.017
Wang, Q., She, D., Xia, B., and Shi, L. (2019). Evaluation of Pebble-Bed Homogenized Cross Sections in HTGR Fuel Cycle Simulations. Prog. Nucl. Energ. 117, 103041. doi:10.1016/j.pnucene.2019.103041
Wu, Z., Lin, D., and Zhong, D. (2002). The Design Features of the HTR-10. Nucl. Eng. Des. 218 (1), 25–32. doi:10.1016/s0029-5493(02)00182-6
Zhang, L., She, D., and Shi, L. (2020). Influence of Graphitization Degree of Nuclear Graphite on HTGR Reactor Physics Calculation. Ann. Nucl. Energ. 143, 107458. doi:10.1016/j.anucene.2020.107458
Keywords: PANGU, HTR-10, operation history, simulation, validation
Citation: She D, Chen F, Xia B and Shi L (2021) Simulation of the HTR-10 Operation History With the PANGU Code. Front. Energy Res. 9:704116. doi: 10.3389/fenrg.2021.704116
Received: 01 May 2021; Accepted: 31 May 2021;
Published: 14 June 2021.
Edited by:
Mingjun Wang, Xi’an Jiaotong University, ChinaReviewed by:
Chen Hao, Harbin Engineering University, ChinaJinfeng Li, Imperial College London, United Kingdom
Dunfu Shi, Institute of Applied Physics and Computational Mathematics (IAPCM), China
Copyright © 2021 She, Chen, Xia and Shi. This is an open-access article distributed under the terms of the Creative Commons Attribution License (CC BY). The use, distribution or reproduction in other forums is permitted, provided the original author(s) and the copyright owner(s) are credited and that the original publication in this journal is cited, in accordance with accepted academic practice. No use, distribution or reproduction is permitted which does not comply with these terms.
*Correspondence: Bing Xia, eGlhYmluZ0B0c2luZ2h1YS5lZHUuY24=