 Xingzhen Bai1
 Leijiao Ge
 Yuanliang Li
- 1College of Electrical Engineering and Automation, Shandong University of Science and Technology, Qingdao, China
- 2Key Laboratory of Smart Grid of Ministry of Education, Tianjin University, Tianjin, China
In this study, the forecasting-aided state estimation (FASE) problem for the active distribution system (ADS) with distributed generations (DGs) is investigated, considering the constraint of data transmission. First of all, the system model of the ADS with DGs is established, which expands the scope of the ADS state estimation from the power network to the DGs. Moreover, in order to improve the efficiency of data transmission under the limited communication bandwidth, a component-based event-triggered mechanism is employed to schedule the data transmission from the measurement terminals to the estimator. It can efficiently reduce the amount of data transmission while guaranteeing the performance of system state estimation. Second, an event-triggered unscented Kalman filter (ET-UKF) algorithm is proposed to conduct the state estimation of the ADS with mixed measurements. To this end, the unscented transform (UT) technique is employed to approximate the probability distribution of the state variable after nonlinear transformation, which can reach more than second order, and then, an upper bound of the filtering error covariance is derived and subsequently minimized at each iteration. The gain of the desired filter is obtained recursively by following a certain set of recursions. Finally, the effectiveness of the proposed method is demonstrated by using the IEEE-34 distribution test system.
1 Introduction
With the widespread integration of distributed generations (DGs) in the power system, the conventional passive distribution system is being transformed into the active distribution system (ADS) (Ehsan and Yang, 2018; Ge et al., 2020a; Li et al., 2020; Luo et al., 2020). It is common that the inherent intermittence and variability of DG generation increase the complexity and uncertainty of the operation state for the ADS (Ge et al., 2021b; 2020b). In this regard, it is necessary to ensure the accuracy and efficiency of state estimation for the ADSs, which is prerequisite for the safe and reliable operation of the power distribution system (Chen Y. et al., 2017; Zhang et al., 2020; Ge et al., 2021a). In general, the traditional static state estimation (SSE) methods are mainly based on the weighted least square (WLS) that cannot meet the estimation requirements of ADSs, because it ignores the dynamics of the system. For this reason, the forecasting-aided state estimation (FASE) is proposed to improve the accuracy and speed of the estimator effectively for the ADSs (Do Coutto Filho and Stacchini de Souza, 2009; Wang et al., 2020). The FASE method takes into consideration the time evolution of the ADS states that can make the state prediction of the next time instant, so as to provide the information required for a security analysis and preventive control functions. Moreover, when the measurement data of ADS are flawed or even unavailable due to certain reasons, the state prediction values can be used to provide a set of pseudo states of the ADS, thus improving the robustness of the estimator to external interference.
Due to the advantages of the FASE method and its promising prospect of practical application, it has attracted increasing attention for research, and there have been plenty of remarkable achievements made in addressing FASE problems for the ADS (Ćetenović and Ranković, 2018; Macii et al., 2020; Cheng and Bai, 2021; Geetha et al., 2021). For instance, a novel approach in assessing the process noise covariance matrix for FASE in ADS has been proposed by Ćetenović and Ranković (2018), which contributes in improving the accuracy of estimation. The asynchronous hierarchical FASE method has been proposed by Geetha et al. (2021). According to this method, the global estimation values are calculated by collating the estimates of smaller reduced order subsystems to reduce the overall level of computational complexity. Cheng and Bai (2021) put forward the robust FASE for ADSs by using a strict linearization method for the purpose of dealing with the nonlinear measurements, which can reduce the nonlinear error for the state estimation. However, in the prior literature, the monitoring scope of the state estimation system is often limited to the power network part of the ADS. In general, the DGs are modeled as equivalent power injection, but they are not monitored and modeled in detail. In fact, when there are a large number of DGs connected to the distribution network, the accurate estimation of real-time DG states plays a crucial role in the flexible control and dispatch of the ADS (Yang et al., 2018). Meanwhile, with the development of smart sensor, more information of the DG system is allowed to be collected to the monitoring center (Fang et al., 2020). The information redundancy can be improved by considering the measurement of DG system in the context of ADS state estimation, thereby facilitating to enhance the estimation performance. Therefore, it is of much practical significance to construct an adequate model of the ADSs with DGs for expanding the scope of state estimation and improving the estimation performance of ADSs.
In addition, due to economic constraint and the complexity of reconstruction, it is impractical to replace all distribution remote terminal units (DRTUs) with phasor measurement units (PMUs) within a short period of time (Yang et al., 2017). In the foreseeable future, both PMUs and DRTUs will provide measurement data for the FASE of the ADSs collectively (Dobakhshari et al., 2021). Therefore, the FASE algorithm is based on PMU/DRTU mixed nonlinear measurements. In practice, it is significant to deal with nonlinear measurement, which would seriously affect the performance of FASE for the ADSs. In this regard, there are various nonlinear filtering algorithms developed to handle the nonlinear system state estimation, such as the particle filter (PF), the extended Kalman filter (EKF), and the unscented Kalman filter (UKF). The PF algorithm can carry out the recursive Bayesian estimation using the nonparametric Monte Carlo simulation method. Due to the high dimension of the distribution system, however, a considerable amount of particles are required, which would give rise to a huge computational workload. The EKF algorithm linearizes the nonlinear system through the Taylor series expansion but ignores the higher order terms (Sun et al., 2017, 2018), which cannot guarantee the high estimation accuracy. As for the UKF algorithm, the unscented transform (UT) technique is applied to approximate the probability distribution of the state variable after nonlinear transformation (Zhao and Mili, 2019; Dang et al., 2020). The UKF algorithm produces better estimation performance than the EKF algorithm, and it is more suitable to realize the online application of estimation.
Furthermore, with the rapid increase in the number of power users and the extensive connection of DGs, the scale of the ADS is also expanding. In order to meet the monitoring requirements of the ADS, it is necessary to install more measurement devices. As a result, a considerable amount of measurement data would be transmitted to the estimator. Due to the limited network communication resources, the transmission of numerous data may contribute to the network-induced phenomena, for example, data loss and transmission delay, which makes it likely to lose useful information, thus affecting the estimation performance of the ADS (Ding et al., 2017; Cheng et al., 2018; Xing et al., 2018). In order to reduce the transmission of redundant data, the communication strategy based on the event-triggered mechanism has been proposed. According to this strategy, the measurement will be transmitted to the data center for processing only when the preset event-triggering conditions are satisfied. Compared with the traditional time-triggered one, the event-triggered mechanism has the advantage in alleviating the communication burden with ensuring the expected estimation performance. Therefore, the estimation problem based on the event-triggered mechanism has recently attracted much attention (Liu et al., 2018; Li et al., 2019; Kooshkbaghi et al., 2020; Shanmugam et al., 2020; Zhu et al., 2020). For instance, an event-triggered PF algorithm has been proposed by Liu et al. (2018) to estimate the state of the synchronous generator in real time, and the UKF algorithm has been used as the local estimator to provide trigger information in the study by Li et al. (2019), which reduces the computational burden of the intelligent terminal. So far, to our knowledge, the FASE of the ADS based on the event-triggered mechanism has not been considered as carefully as required.
As motivated by the above discussion, this study is purposed to address the FASE problem for the ADS with DGs under the constraints of communication resource, and the main contributions of it are detailed as follows.
1) The system model of the ADSs with DGs is established by considering the state variables and measurements of DGs in detail, which expands the estimation scope of the ADS and facilitates the accurate FASE of the ADS.
2) An appropriate component-based event-triggered mechanism is adopted to reduce “unnecessary” data transmissions from the measuring terminals to the monitoring center, thus alleviating the burden placed on the network transmission.
3) Given the nonlinear mixed measurement of the ADS and the intermittent observation attributed to the event-triggered mechanism, the event-triggered UKF (ET-UKF) algorithm is proposed to ensure the performance of the state estimation.
The rest of this article is organized as follows. The state and measurement models of the ADS are built by incorporating the state and measurement information of DGs into the distribution system in System Model of ADS with DGs section. In FASE with Component-Based Event-Triggered Mechanism section, the component-based event-triggered mechanism is introduced, and the ET-UKF algorithm is designed. In Simulation Results and Analysis section, the IEEE-34 distribution test system is taken as an example to verify the effectiveness of the proposed method.
2 System Model of the Active Distribution System With Distributed Generations
For the FASE of ADSs, the system model is composed of the state model and the measurement model. The state model is linear, which represents the transition trajectory between consecutive states (Zhao et al., 2019). The measurement model expresses the functional relationship between measurements and state variables. In this study, considering the widespread connection of DGs in the ADS, the system model is built by combining the state and measurement variables of power networks and DGs.
2.1 State Model
The system state
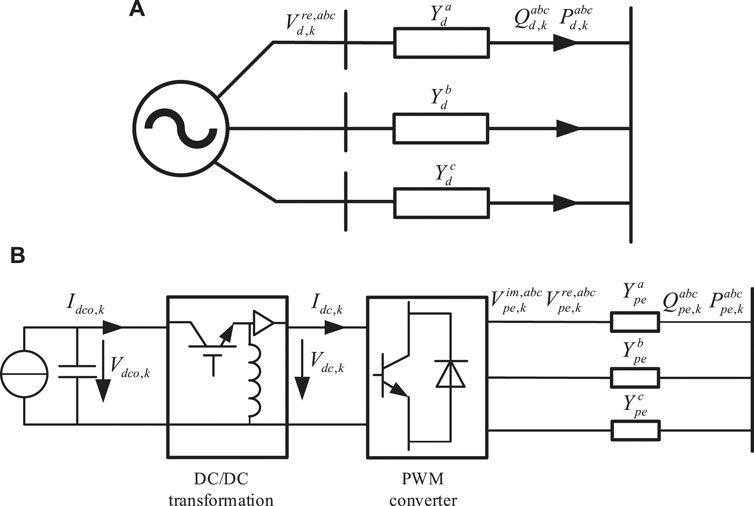
FIGURE 1. The models of the two most commonly used DGs: (A) model of DGs connected to the grid directly and (B) model of direct current type DGs connected to grid via a chopper-inverter device.
For the DGs connected to the grid directly, the state variables are selected as
Then, the state model of the ADS with DGs can be described as
where
where I is the identity matrix;
2.2 Measurement Model
The measured data of the ADS primarily originate from alternating current voltage, power, other measurement information of the network part, and the measurement information provided by sensors in DGs.
In general, the measurements obtained from different types of DGs are different. For the DGs directly connected to the grid, the measurement information is
where
For the direct current DGs connected to the grid by the chopper-inverter device, according to the data that can be measured by the chopper-inverter device sensors, the measurement is
where
The measurement information of the network part is mainly provided by the PMUs and the DRTUs. The PMU can measure the real and imaginary parts of bus voltage and branch current, respectively. Moreover, the DRTU can measure the voltage amplitude, injected power of the bus, and the power flow of the branch. Figure 2 shows the three-phase line model of the distribution system. Combined with the circuit theorem, the functional relationship between measurement variable and state variable can be calculated.
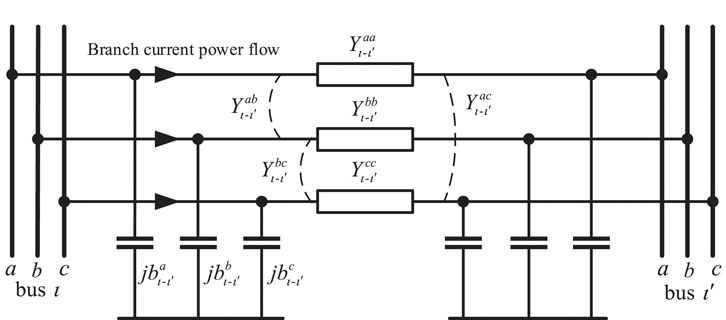
FIGURE 2. Three-phase line model of the distribution system.
Then, the PMU measurements are expressed as
and the DRTU measurements are expressed as
where
Combining all measurements of PMUs, DRTUs, and DGs’ sensors, the measurement output
where
Remark 1: In this study, the system model of ADS with DGs is established by considering the state variables and measurements of DGs in detail, which expands the scope of ADS state estimation from the network to the DGs and improves estimated accuracy. It should be noted that the two most commonly used DGs are taken as examples for modeling in this study. The modeling methods of other DGs are similar to it. In practical applications, the models can be established according to the specific structure of the DGs.
Remark 2: According to the IEEE standard c37.118–2005, the PMUs ought to provide data in both the angular form (i.e., the phasor angles and magnitudes) and the rectangular form (i.e., the real and imaginary parts of voltages of the buses) (Martin et al., 2008). In this study, both the state and measured variables are presented in the rectangular form to build a linear PMU measurement model. In doing so, the complexity of the estimator is reduced, and the estimation performance is improved.
3 FASE With the Component-Based Event-Triggered Mechanism
3.1 Component-Based Event-Triggered Mechanism
With the event-triggered mechanism, the event generator determines whether the newly obtained measurement is sent to the estimator or not, which is based on the difference between the previously transmitted measurement and the latest measurement. To reduce the amount of data transmissions from measurement terminals to the estimator and ensure the desired estimation performance, each measurement terminal examines the event generator independently, and the consistency with other measurement terminals in the ADS is not required. As such, the component-based event-triggered mechanism is adopted in the data transmission of the ADS (Figure 3). The measured data are obtained by the measurement terminals (e.g., the DRTUs, the PMUs, and the DGs’ sensors) and screened by the event generator with the triggering condition. Then, the measured data meeting the triggering conditions are transited to the communication system. Moreover, the trigger detector determines which terminals have triggered and which terminals have not, and then the “zero-order hold” strategy is adopted to update the measurement data in the detector. Last, the data are passed into the estimator for processing.
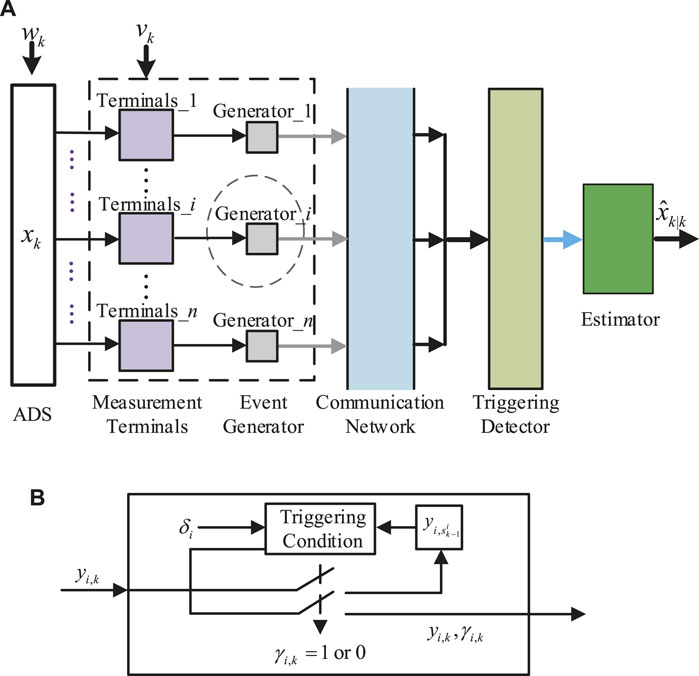
FIGURE 3. State estimation with the event-triggered mechanism in the ADS: (A) flow of the event-triggered mechanism and (B) event generator.
The event-triggered condition is described as
where
In this study, the “zero-order hold” strategy is used to update the measurement
Based on the above analysis, we can get
It is possible for the component-based event-triggered mechanism to make the measurement information transmitted in the communication network incomplete. Despite the “zero-order hold” strategy being used to update the measurement in the triggering detector, the non-triggering error would bring about serious effect on the estimation performance of the ADS. As such, it is necessary to design a suitable filter algorithm for reducing the impact of the non-triggering error. Fortunately, with the component-based event-triggered mechanism, the estimator can acquire some valuable information that will facilitate the effective design of the filter. On the one hand, the triggering sequence of the triggering generator is known. On the other hand, the non-triggering error would fall into a certain range.
Remark 3: In order to save network communication resources of the ADS, the component-based event-triggered mechanism is employed, with which the measurement transmission of each component is scheduled individually according to its own triggering condition. The component-based event-triggered mechanism pays attention on the individual change of each component of the system output, while the usual one focuses on the output vector. Considering that there are the characteristics of extremely different operating states between the busses, complex structure, and wide distribution in the ADS, the component-based event-triggered mechanism is more suitable for the ADS.
3.2 Event-Triggered UKF Algorithm
In order to ensure the state estimation performance of the ADS with DGs under the event-triggered mechanism, a filter is designed based on the framework of the UKF algorithm. First, the one-step prediction and filtering error covariances are calculated. Second, some parameters were adjusted by using some lemmas to find the upper bound of the covariance. Last, such an upper bound is minimized by designing an appropriate filter gain.
For the state model Eq. 1 and event-triggered measurement model Eq. 19, the filter is designed as follows:
where
Before proceeding, the following lemma is recalled, which will be used in later developments.
Lemma 1 (Cheng and Bai, 2021): For any two vectors
where a is a positive scalar.Combining Eqs 19, 21, we can get the state estimation at instant k:
where
Then, covariance of the filtering error can be calculated as following:
Theorem 1: Consider the system described by Eqs 1, 19 with filter Eqs 20, 21 and define the following two Riccati-like different equations.
where
Proof: According to Lemma 1, the following inequalities are obtained:
According to the event-triggered condition Eq. 17, we can obtained
where
This completes the proof.After that, the filter gain
Let
subject to
where
Next, the UT technology is employed to calculate the prediction of measurement and predicted measurement covariance matrix and state-measurement cross-covariance matrix. Considering the high-dimensional nonlinearity of the ADS, in order to ensure the accuracy of the algorithm, while avoiding non-local effects and high-order term errors, in this study, the proportional symmetric sampling strategy is selected as the sigma point sampling strategy of the UT (Wang et al., 2019). The calculation method of the sigma points and its weight is as follows:
where
where
In order to show the proposed filtering algorithm more clearly, the ET-UKF algorithm is summarized as in Algorithm 1.
1: Initialization: select the initial values of
2: At time k, compute the state prediction value
3: Compute
4: Calculate filter gain
5: With the obtained
6: Set
Remark 4: In this study, for the purpose of saving network communication resources of the ADS, the component-based event-triggered transmission mechanism is adopted to reduce the unnecessary data transmission. However, this method makes it difficult to calculate the error covariance matrix recursively. To this issue, an alternative approach is proposed to introduce some adjustable parameters (e.g.,
4 Simulation Results and Analysis
4.1 Simulation Settings
In this section, the IEEE-34 distribution test system is adopted to simulate and verify the effectiveness of the proposed state estimation algorithm. The topology structure and line parameters of the IEEE-34 distribution test system are originated from the study by Kersting (1991). The simulation is implemented in MATLAB R2019b. The dynamic variation of the ADS is simulated by changing the load dynamically. The law of load change is assumed to be
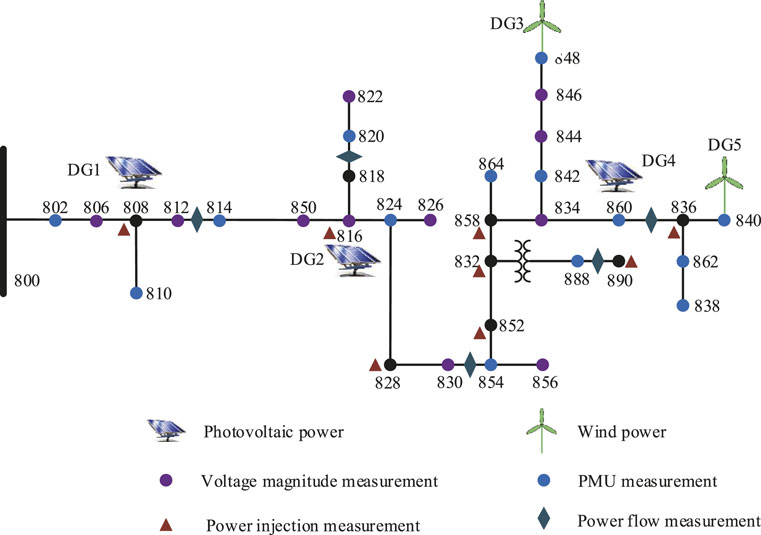
FIGURE 4. Configuration of measurement devices and DGs in the IEEE-34 distribution test system.
In the simulation, the parameters are set to
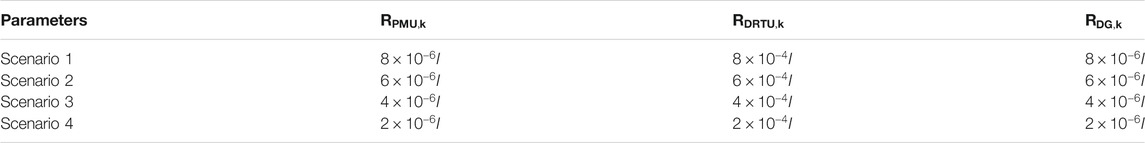
TABLE 1. Measurement noise in different scenarios.
4.2 Result Analysis
1) Verification of the proposed ADS system model.
In this section, the ET-UKF algorithm (
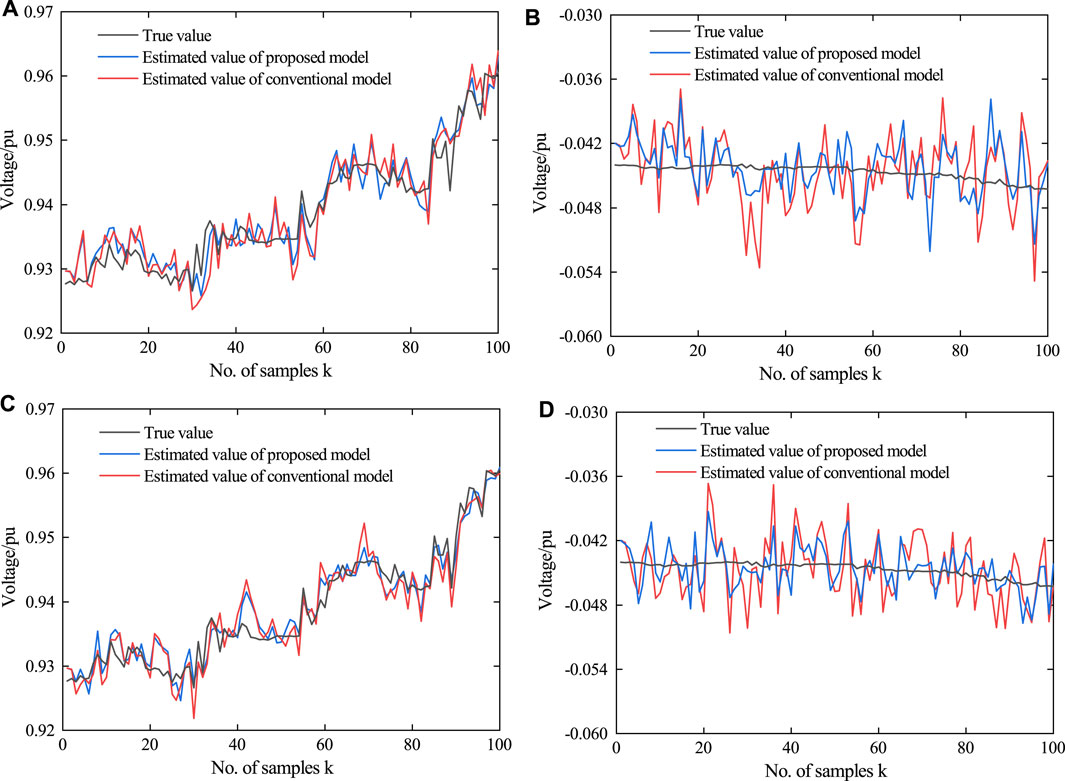
FIGURE 5. Actual state and its estimation of a-phase voltage at the 816 bus. (A) Real part of bus voltage in the case of Scenario 1, (B) imaginary part of bus voltage in the case of Scenario 1, (C) real part of bus voltage in the case of Scenario 2, and (D) imaginary part of bus voltage in the case of Scenario two.
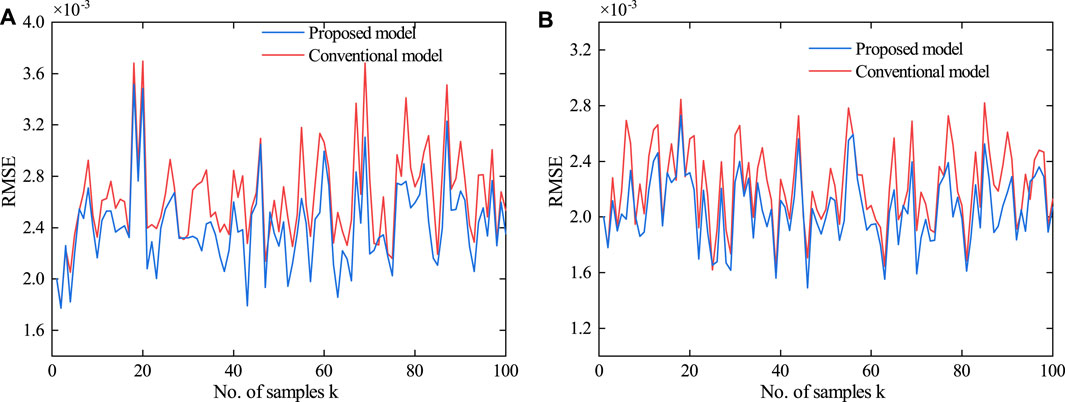
FIGURE 6. RMSE between the estimation and true values under the proposed and conventional models. (A) Scenario 1 and (B) Scenario 2.
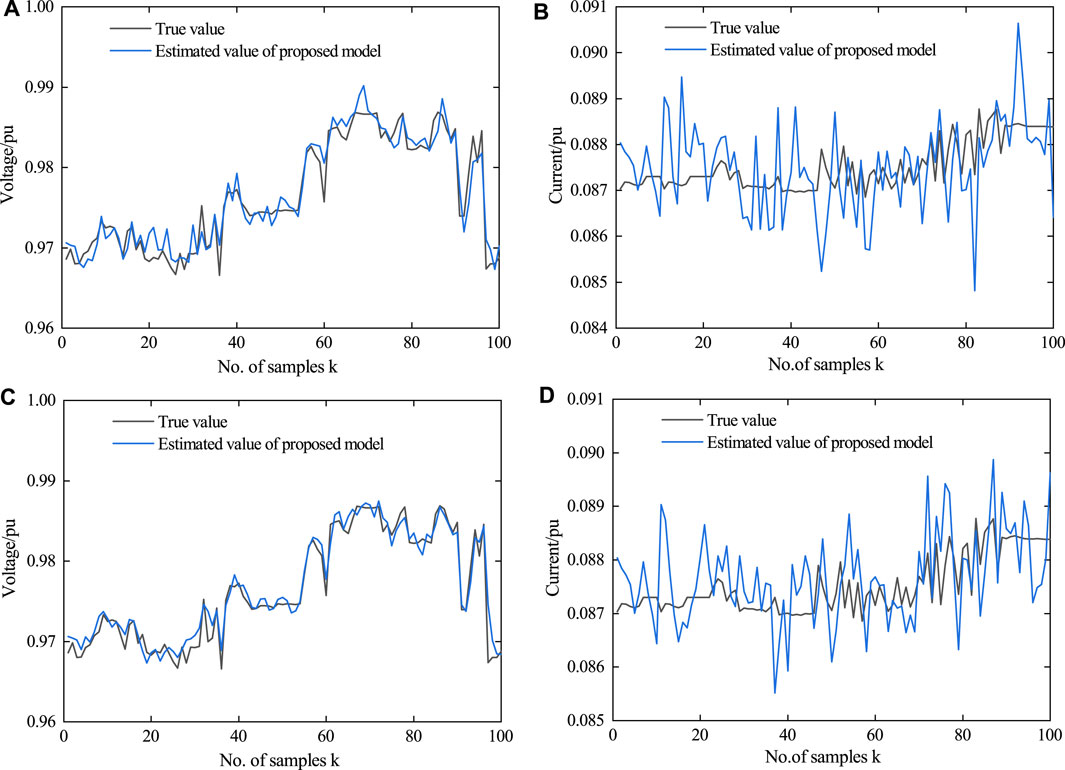
FIGURE 7. Actual state and its estimation of DG2. (A) Voltage output by the DG2 in the case of Scenario 1, (B) current output by the DG2 in the case of Scenario 1, (C) voltage output by the DG2 in the case of Scenario 2, and (D) current output by the DG2 in the case of Scenario 2
2) Verification of the ET-UKF algorithm.
In order to demonstrate the performance of the event-triggered mechanism, a data transmission ratio (DTR) is defined as a transmission performance index by
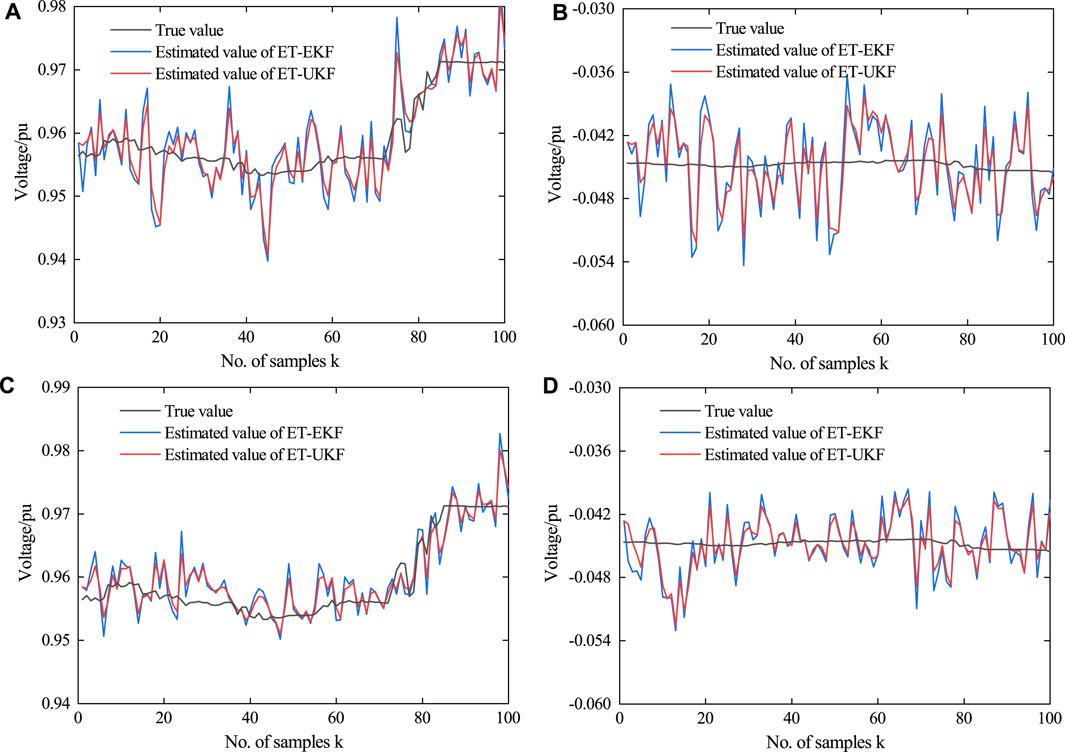
FIGURE 8. Actual state and its estimation of a-phase voltage at 864 bus. (A) Real part of bus voltage in the case of Scenario 3, (B) imaginary part of the bus voltage in the case of Scenario 3, (C) real part of bus voltage in the case of Scenario 4, and (D) imaginary part of bus voltage in the case of Scenario 4.
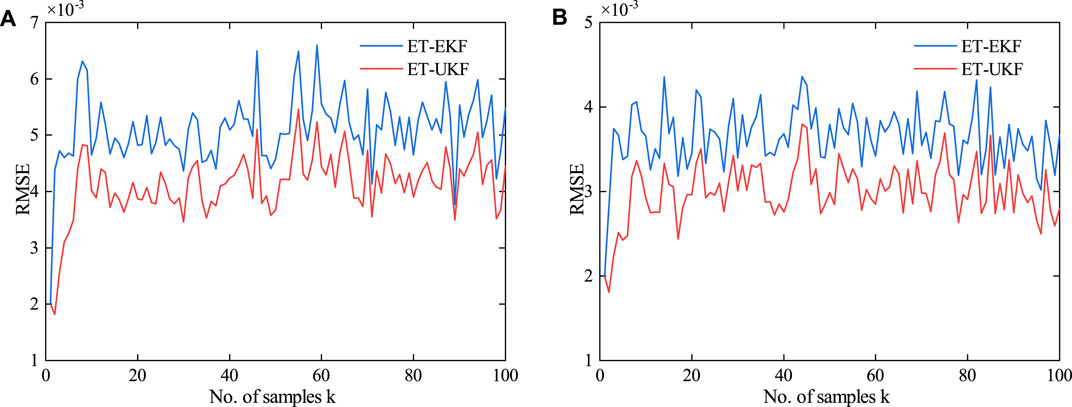
FIGURE 9. RMSE between the estimated and true values for ET-UKF and ET-EKF algorithms. (A) Scenario 3 and (B) Scenario 4.
3) The impact from the different triggering thresholds on estimation performance.
In order to figure out the impact of various triggering thresholds on estimation performance, simulations are conducted with
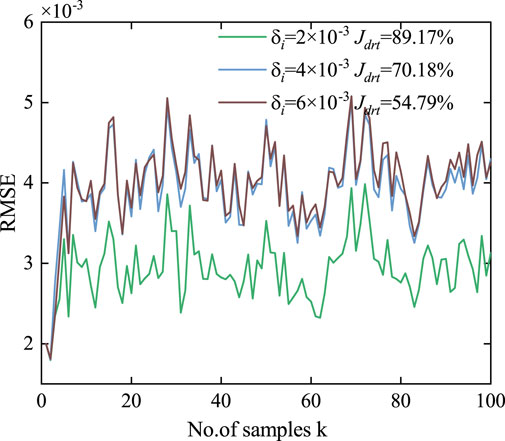
FIGURE 10. Variation of the RMSE and
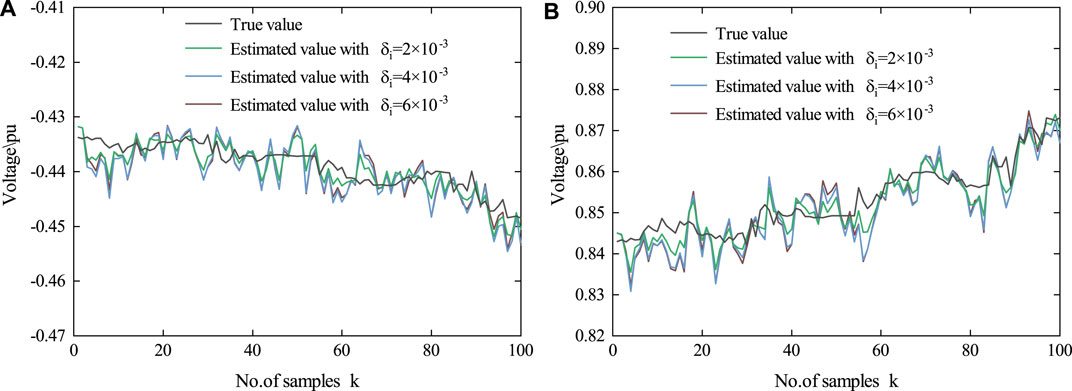
FIGURE 11. Actual state and its estimation of c-phase voltage at the 814 bus (in the case of Scenario 3). (A) Real part of bus voltage and (B) imaginary part of bus voltage.
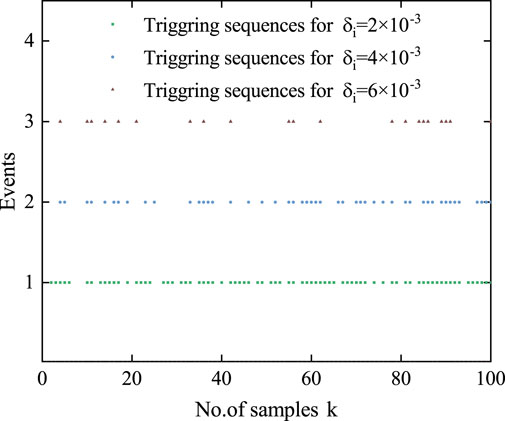
FIGURE 12. Triggering sequences of the measurement device installed at the 814 bus (in the case of Scenario 3).
5 Conclusion
In this study, a FASE method for the ADS with DGs has been developed under the condition of limited communication resources. First, the system model of the ADS has been built to improve the accuracy and extend the scope of state estimation. Moreover, in order to solve the network-induced phenomena attributed to considerable data transmission in ADS, the component-based event-triggered mechanism has been adopted to reduce the amount of data transmitted through communication network and save the communication resources. Besides, the ET-UKF algorithm has been designed to guarantee the estimation performance of the system. Finally, the effectiveness of the proposed method has been verified by the simulation. In view of the importance of the integrated energy system as a development trend in the energy field, the development of high-performance state estimation algorithms for the integrated energy system has become a top priority. Future study will consider the dynamic characteristics and time scales of different systems in the integrated energy system (Chen et al., 2020; Chen et al., 2021) and apply the algorithm proposed in this study to integrated energy systems.
Data Availability Statement
The original contributions presented in the study are included in the article/Supplementary Material; further inquiries can be directed to the corresponding author.
Author Contributions
XB designed the component-based event-triggered mechanism. XZ designed the ET-UKF algorithm for the FASE of the ADSs. LG proposed the state space model of ADS with DGs. FQ and YL conducted the simulation verification.
Funding
This research was supported by the National Natural Science Foundation of China (Grant No. 51807134) and the Shandong Provincial Natural Science Foundation, China (Grant No. ZR2020MF071).
Conflict of Interest
The authors declare that the research was conducted in the absence of any commercial or financial relationships that could be construed as a potential conflict of interest.
Publisher’s Note
All claims expressed in this article are solely those of the authors and do not necessarily represent those of their affiliated organizations, or those of the publisher, the editors and the reviewers. Any product that may be evaluated in this article, or claim that may be made by its manufacturer, is not guaranteed or endorsed by the publisher.
Acknowledgments
We would like to thank the project team members of the National Natural Science Foundation of China and the Shandong Provincial Natural Science Foundation who encouraged this research.
References
Ćetenović, D. N., and Ranković, A. M. (2018). Optimal Parameterization of Kalman Filter Based Three-phase Dynamic State Estimator for Active Distribution Networks. Int. J. Electr. Power Energ. Syst. 101, 472–481. doi:10.1016/j.ijepes.2018.04.008
Chen, S., Wei, Z., Sun, G., Lu, N., Sun, Y., and Zhu, Y. (2017a). Multi-area Distributed Three-phase State Estimation for Unbalanced Active Distribution Networks. J. Mod. Power Syst. Clean Energ. 5, 767–776. doi:10.1007/s40565-016-0237-0
Chen, Y., Ma, J., Zhang, P., Liu, F., and Mei, S. (2017b). Robust State Estimator Based on Maximum Exponential Absolute Value. IEEE Trans. Smart Grid 8, 1537–1544. doi:10.1109/TSG.2015.2485280
Chen, Y., Yao, Y., Lin, Y., and Yang, X. (2020). Dynamic State Estimation for Integrated Electricity-Gas Systems Based on Kalman Filter. CSEE J. Power Energ. Syst., 1–11. doi:10.17775/CSEEJPES.2020.02050
Chen, Y., Yao, Y., and Zhang, Y. (2021). A Robust State Estimation Method Based on Socp for Integrated Electricity-Heat System. IEEE Trans. Smart Grid 12, 810–820. doi:10.1109/TSG.2020.3022563
Cheng, C., and Bai, X. (2021). Robust Forecasting-Aided State Estimation in Power Distribution Systems with Event-Triggered Transmission and Reduced Mixed Measurements. IEEE Trans. Power Syst., 1. doi:10.1109/TPWRS.2021.3062386
Cheng, C., Bai, X., Zhang, Q., and Huang, C. (2018). Set-membership Filtering for Generator Dynamic State Estimation with Delayed Measurements. Syst. Sci. Control. Eng. 6, 35–43. doi:10.1080/21642583.2018.1531794
Dang, L., Chen, B., Wang, S., Ma, W., and Ren, P. (2020). Robust Power System State Estimation with Minimum Error Entropy Unscented Kalman Filter. IEEE Trans. Instrumentation Meas. 69, 8797–8808. doi:10.1109/TIM.2020.2999757
Ding, F., Wang, X., Mao, L., and Xu, L. (2017). Joint State and Multi-Innovation Parameter Estimation for Time-Delay Linear Systems and its Convergence Based on the Kalman Filtering. Digital Signal. Process. 62, 211–223. doi:10.1016/j.dsp.2016.11.010
Do Coutto Filho, M. B., and Stacchini de Souza, J. C. (2009). Forecasting-aided State Estimation––part i: Panorama. IEEE Trans. Power Syst. 24, 1667–1677. doi:10.1109/TPWRS.2009.2030295
Dobakhshari, A. S., Abdolmaleki, M., Terzija, V., and Azizi, S. (2021). Robust hybrid linear state estimator utilizing scada and pmu measurements. IEEE Trans. Power Syst. 36, 1264–1273. doi:10.1109/TPWRS.2020.3013677
Ehsan, A., and Yang, Q. (2018). Optimal integration and planning of renewable distributed generation in the power distribution networks: A review of analytical techniques. Appl. Energ. 210, 44–59. doi:10.1016/j.apenergy.2017.10.106
Fang, Z., Lin, Y., Song, S., Song, C., Lin, X., and Cheng, G. (2020). Active distribution system state estimation incorporating photovoltaic generation system model. Electric Power Syst. Res. 182, 106247. doi:10.1016/j.epsr.2020.106247
Ge, L., Li, Y., Li, S., Zhu, J., and Yan, J. (2021a). Evaluation of the situational awareness effects for smart distribution networks under the novel design of indicator framework and hybrid weighting method. Front. Energ. 15, 143–158. doi:10.1007/s11708-020-0703-2
Ge, L., Song, Z., Xu, X., Bai, X., and Yan, J. (2021b). Dynamic networking of islanded regional multi-microgrid networks based on graph theory and multi-objective evolutionary optimization. Int. Trans. Electr. Energ. Syst. 35, e12687. doi:10.1002/2050-7038.12687
Ge, L., Xian, Y., Yan, J., Wang, B., and Wang, Z. (2020a). A hybrid model for short-term pv output forecasting based on pca-gwo-grnn. J. Mod. Power Syst. Clean Energ. 8, 1268–1275. doi:10.35833/MPCE.2020.000004
Ge, L., Zhang, S., Bai, X., Yan, J., Shi, C., and Wei, T. (2020b). Optimal capacity allocation of energy storage system considering uncertainty of load and wind generation. Math. Probl. Eng. 2020, 2609674. doi:10.1155/2020/2609674
Geetha, S. J., Chakrabarti, S., and Rajawat, K. (2021). Asynchronous hierarchical forecasting-aided state estimator with sub-area data validation for power systems. IEEE Sensors J. 21, 2124–2133. doi:10.1109/JSEN.2020.3017920
Kersting, W. (1991). Radial distribution test feeders. IEEE Trans. Power Syst. 6, 975–985. doi:10.1109/59.119237
Kooshkbaghi, M., Marquez, H. J., and Xu, W. (2020). Event-triggered approach to dynamic state estimation of a synchronous machine using cubature kalman filter. IEEE Trans. Control. Syst. Tech. 28, 2013–2020. doi:10.1109/TCST.2019.2923374
Li, S., Li, L., Li, Z., Chen, X., Fernando, T., Iu, H. H.-C., et al. (2019). Event-trigger heterogeneous nonlinear filter for wide-area measurement systems in power grid. IEEE Trans. Smart Grid 10, 2752–2764. doi:10.1109/TSG.2018.2810224
Li, Y., Wang, C., and Li, G. (2020). A mini-review on high-penetration renewable integration into a smarter grid. Front. Energ. Res. 8, 84. doi:10.3389/fenrg.2020.00084
Liu, X., Li, L., Li, Z., Chen, X., Fernando, T., Iu, H. H.-C., et al. (2018). Event-trigger particle filter for smart grids with limited communication bandwidth infrastructure. IEEE Trans. Smart Grid 9, 6918–6928. doi:10.1109/TSG.2017.2728687
Luo, F., Yang, X., Wei, W., Zhang, T., Yao, L., Zhu, L., et al. (2020). Bi-level load peak shifting and valley filling dispatch model of distribution systems with virtual power plants. Front. Energ. Res. 8, 305. doi:10.3389/fenrg.2020.596817
Macii, D., Fontanelli, D., and Barchi, G. (2020). A distribution system state estimator based on an extended kalman filter enhanced with a prior evaluation of power injections at unmonitored buses. Energies 13, 6054. doi:10.3390/en13226054
Martin, K. E., Hamai, D., Adamiak, M. G., Anderson, S., Begovic, M., Benmouyal, G., et al. (2008). Exploring the ieee standard c37.118–2005 synchrophasors for power systems. IEEE Trans. Power Deliv. 23, 1805–1811. doi:10.1109/TPWRD.2007.916092
Shanmugam, L., Mani, P., and Joo, Y. H. (2020). Stabilisation of event-triggered-based neural network control system and its application to wind power generation systems. IET Control. Theor. Appl. 14, 1321–1333. doi:10.1049/iet-cta.2019.0246
Sun, Y., Wang, Y., Wu, X., and Hu, Y. (2018). Robust extended fractional kalman filter for nonlinear fractional system with missing measurements. J. Franklin Inst. 355, 361–380. doi:10.1016/j.jfranklin.2017.10.030
Sun, Y., Wu, X., Cao, J., Wei, Z., and Sun, G. (2017). Fractional extended kalman filtering for non-linear fractional system with lévy noises. IET Control. Theor. Appl. 11, 349–358. doi:10.1049/iet-cta.2016.1041
Wang, S., Lyu, Y., and Ren, W. (2019). Unscented-transformation-based distributed nonlinear state estimation: Algorithm, analysis, and experiments. IEEE Trans. Control. Syst. Tech. 27, 2016–2029. doi:10.1109/TCST.2018.2847290
Wang, Y., Sun, Y., and Dinavahi, V. (2020). Robust forecasting-aided state estimation for power system against uncertainties. IEEE Trans. Power Syst. 35, 691–702. doi:10.1109/TPWRS.2019.2936141
Xing, Z., Xia, Y., Yan, L., Lu, K., and Gong, Q. (2018). Multisensor distributed weighted kalman filter fusion with network delays, stochastic uncertainties, autocorrelated, and cross-correlated noises. IEEE Trans. Syst. Man, Cybernetics: Syst. 48, 716–726. doi:10.1109/TSMC.2016.2633283
Yang, Q., Jiang, L., Ehsan, A., Gao, Y., and Guo, S. (2018). Robust power supply restoration for self-healing active distribution networks considering the availability of distributed generation. Energies 11, 210. doi:10.3390/en11010210
Yang, Q., Jiang, L., Hao, W., Zhou, B., Yang, P., and Lv, Z. (2017). Pmu placement in electric transmission networks for reliable state estimation against false data injection attacks. IEEE Internet Things J. 4, 1978–1986. doi:10.1109/JIOT.2017.2769134
Zhang, Y., Wang, J., and Li, Z. (2020). Interval state estimation with uncertainty of distributed generation and line parameters in unbalanced distribution systems. IEEE Trans. Power Syst. 35, 762–772. doi:10.1109/TPWRS.2019.2926445
Zhao, J., Gómez-Expósito, A., Netto, M., Mili, L., Abur, A., Terzija, V., et al. (2019). Power system dynamic state estimation: Motivations, definitions, methodologies, and future work. IEEE Trans. Power Syst. 34, 3188–3198. doi:10.1109/TPWRS.2019.2894769
Zhao, J., and Mili, L. (2019). A theoretical framework of robust h-infinity unscented kalman filter and its application to power system dynamic state estimation. IEEE Trans. Signal Process. 67, 2734–2746. doi:10.1109/TSP.2019.2908910
Keywords: active distribution system, forecasting-aided state estimation, event-triggered scheme, unscented Kalman filter, distribution generations
Citation: Bai X, Zheng X, Ge L, Qin F and Li Y (2021) Event-Triggered Forecasting-Aided State Estimation for Active Distribution System With Distributed Generations. Front. Energy Res. 9:707183. doi: 10.3389/fenrg.2021.707183
Received: 09 May 2021; Accepted: 08 June 2021;
Published: 23 July 2021.
Edited by:
Yingjun Wu, Hohai University, ChinaReviewed by:
Yanbo Chen, North China Electric Power University, ChinaQiang Yang, College of Electrical Engineering, Zhejiang University, China
Copyright © 2021 Bai, Zheng, Ge, Qin and Li. This is an open-access article distributed under the terms of the Creative Commons Attribution License (CC BY). The use, distribution or reproduction in other forums is permitted, provided the original author(s) and the copyright owner(s) are credited and that the original publication in this journal is cited, in accordance with accepted academic practice. No use, distribution or reproduction is permitted which does not comply with these terms.
*Correspondence: Leijiao Ge, bGVnZW5kZ2xqOTlAdGp1LmVkdS5jbg==