 Wen-Long Zheng
 Jian-Wei Wang2
 Jin-Feng Li
- 1School of Economics and Management, Chang’an University, Xi’an, China
- 2College of Transportation Engineering, Chang’an University, Xi’an, China
- 3School of Logistics and Electronic Commerce, Henan University of Animal Husbandry Economics, Zhengzhou, China
The logistics and manufacturing industries are basic industries that support social development. First, this study classifies the carbon emissions from the logistics industry and pollution emissions from the manufacturing industry as undesirable outputs and evaluates the ecological efficiency of the logistics and manufacturing industries in the Yangtze River Delta from 2006 to 2016 by using the unexpected slacks-based measure (SBM) model. Second, the study analyzes the spatial differences in industrial correlation efficiency by using the exploratory spatial data analysis method. Third, the spatial econometric model is used to analyze the driving factors of the linkage ecological efficiency between logistics industry and manufacturing industry. Finally, the neural network model is used to predict the linkage ecological efficiency. The results show that the ecological efficiency of the manufacturing industry has steadily improved. The ecological efficiency of the logistics industry presents the rising trend in fluctuation. The level of the linkage development between the logistics and manufacturing industries is high. The results of the spatial heterogeneity analysis show that the spatial differentiation of high–high agglomeration and low–low agglomeration is obvious. The spatial agglomeration characteristics are relatively stable, and the spatial diffusion effect is strong. In space, the linkage ecological efficiency shows a trend of development from multiple agglomeration areas to one agglomeration area. The results of driving factor analysis show that foreign direct investment (FDI), government intervention (GI), and human capital (HP) have positive effects on linkage ecological efficiency, while industrial structure (IS), environmental regulation (ER), and energy intensity (EI) have negative effects on linkage ecological efficiency. The results of the linkage development trend analysis show that the linkage ecological efficiency of the two industries will tend to be stable in the future.
Introduction
At present, with the rapid development of the social economy, China’s logistics demand is increasing rapidly, and the scale of logistics is expanding rapidly. How to continuously improve the quality of the logistics industry while reducing energy consumption and carbon dioxide emissions is an urgent problem to be considered. Similarly, while China’s manufacturing industry has made great achievements, it has also encountered various environmental problems in the process of industrialization similar to developed countries in recent centuries. The extensive economic growth mode of high input and high energy consumption leads to the problems of low resource utilization efficiency and the aggravation of environmental pollution (De Koster, 2003).
The logistics and manufacturing industries have a naturally close relationship; they influence each other and develop interactively (W.L. Zheng et al., 2020). The linkage degree of the logistics and manufacturing industries determines the development level of the “two industries” and the comprehensive competitiveness of the regional economy. In recent years, the development trend of linkage and integration between China’s logistics and manufacturing industries has increased, but the degree of integration is not high enough, the scope is not wide enough, and the degree is not deep enough, which does not meet the general requirements of promoting the formation of a strong domestic market, building a modern economic system, and adapting to the new pattern of “double cycle” development (Notice, 2020).
China’s economy has entered the stage of high-quality development, and the cultivation of industrial clusters with international competitiveness has become a new power source to achieve high-quality economic development. In 2018, the integrated development of the Yangtze River Delta became a national strategy. The Yangtze River Delta is an important gathering area for China’s advanced manufacturing industry. Through informatization, networking, and the integration effect of modern logistics, the logistics cost of manufacturing enterprises can be effectively reduced, and more resources can be concentrated to develop the core competitiveness of the manufacturing industry. Therefore, it is of great practical significance to study the development of the linkage between the logistics and manufacturing industries to promote the transformation and upgradability of the manufacturing industry in the Yangtze River Delta region, to achieve the goal of “made in China 2025” and to realize the high-quality development of the regional economy.
Since the concept of ecological benefit was first proposed by Schartger and Sturm (1990), in recent years, many scholars have studied ecological efficiency (Zhou et al., 2015) (Watanabe and Tanaka, 2007:; Wang et al., 2010). The two directions related to this study are logistics industry’s efficiency and manufacturing industry’s efficiency.
1) In terms of ecological efficiency of the logistics industry:
Long et al. (2020) used carbon dioxide emissions as undesirable outputs to evaluate logistics ecological efficiency. Zhang (2019) used the SBM undesirable model to measure the efficiency of China’s logistics industry under low-carbon constraints, and the panel Tobit model was used to empirically analyze its influencing factors. The results show that the overall efficiency of China’s logistics industry is at the upper middle level, with obvious regional differences.
2) In terms of ecological efficiency of the manufacturing industry:
Zhang et al. (2019) constructed a three-stage efficiency measurement model of advanced manufacturing green technology innovation by using non-mandatory range adjustment and stochastic frontier functions and measured its green technology innovation efficiency based on the manufacturing panel data. The results show that the overall efficiency of green technology innovation in the national advanced manufacturing industry is still low, and the capital intensity and industry profit rate have a significantly positive effect on the efficiency of green technology innovation in the advanced manufacturing industry (Han et al. 2014). Using the directional distance function, the ecological efficiency level of the manufacturing industry is calculated under the condition of considering the energy input and undesirable outputs. The research shows that the ecological efficiency of China’s manufacturing industry is on the rise, but it is significantly lower than that without considering resource input and negative environmental output. The ecological efficiency level of the manufacturing industry shows obvious industry heterogeneity.
Recently, various studies have focused on the production sector for estimation of resources and climatic and institutional barriers in land use (Elahi et al., 2021a; Elahi et al., 2021b; Elahi et al., 2019a; Elahi et al., 2019b; Elahi et al., 2019c: Elahi et al., 2019d; Elahi et al., 2018). Some studies for instance (Peng et al., 2020a; Peng et al., 2020b; Peng et al, 2019; Peng et al, 2019; Peng et al., 2018; Huang et al., 2020; Wang et al., 2019) have focused on ecological security, ecological footprint, ecological carrying capacity, and ecological environmental vulnerability. However, ecological efficiency evaluation and the spatiotemporal characteristics analysis of the linkage development of the logistics industry and the manufacturing industry have not been explored yet. Therefore, the current article aims to determine the ecological efficiency of the linkage development of the logistics industry and the manufacturing industry considering environmental effects as well as the spatial model (spatial heterogeneity, spatial agglomeration, and driver analysis) and trend dynamic evolution of the linkage development efficiency of the two industries.
The rest of this article is organized as follows: The second part introduces relevant models. The third part explains the indicators and unexpected data. The fourth part presents the empirical analysis. Finally, this article summarizes the conclusions and discusses relevant suggestions.
Model Introduction
Slacks-Based Measure Model of Industrial Linkage Ecological Efficiency
In actual social production, when people’s material demand is solved, it also produces various kinds of side effect products, such as wastewater, waste residue, waste gas, and other pollutants. This article defines these indicators as undesirable outputs. People want to avoid this kind of undesirable outputs as much as possible; therefore, undesirable outputs are gradually becoming a concern for relevant scholars. Because there are undesirable outputs in environmental performance evaluation, we cannot simply use traditional DEA for performance evaluation, and we must consider new methods to evaluate environmental performance. Scholars call this kind of system performance, which simultaneously considers input, expected output, and undesirable outputs of environmental factors, an environmental performance, and the corresponding evaluation is called an environmental performance evaluation (Zhou et al., 2008; Sueyoshi et al., 2016). Therefore, Tone proposed a new SBM model in 2003 (Tone, 2003), that is, the unexpected SBM model. The new SBM model has actually made some extensions on DEA, which precisely highlights the progressiveness of the SBM model. The reason is that this model does not need to set the target of the optimal behavior of the production unit and preset the production function. In addition, the novelty of the model is that the results are more accurate because the radial and angular models are used to calculate the production units less than the relaxation variables without considering the relaxation variables. The calculation results (environmental efficiency) of this study are calculated by using Max DEA Ultra 7.10 software (used to measure the efficiency of the logistics industry, manufacturing industry, and the linkage efficiency between the two industries). Therefore, the efficiency (logistics efficiency, manufacturing efficiency, and linkage development efficiency) mentioned in this article is ecological efficiency, which is not repeated later.
Data envelopment analysis (DEA) is a systematic analysis method developed by famous American operational research scientists A. Charnes, W. W. Cooper, and E. Rhodes in 1978 based on the concept of “relative effectiveness” to study the relative effectiveness of multiple-input and multiple-output decision-making units (Chames et al., 1978). Because energy, environment, and output need to be included in the model, the model needs to include both expected and unexpected outputs. Tone (2001) proposed a non-radial and non-angular efficiency measurement method based on relaxation variables—slacks-based measure (SBM) model. Different from the traditional CCR or BCC model, the SBM model directly adds the relaxation vector to the objective function, so the economic interpretation of the SBM model is to maximize the actual profit, not just the benefit proportion. At the same time, Tone (2002) proposed a super efficiency SBM model on this basis to solve the problem of distinguishing and sorting when the efficiency values of multiple decision-making units are all 1. Compared with other DEA models, this super SBM model considering undesired output has the following three advantages: ① taking undesired output units into account; ② the relaxation problem of input–output variables has been effectively solved; and ③ it solves the problem of distinguishing and sorting when multiple decision-making units are effective at the same time. Therefore, this study selects the super-efficiency SBM model considering unexpected output, which can more comprehensively reflect the concept of environmental efficiency of regional logistics efficiency measurement, including the technical structure relationship between an unexpected output and the factor input. The formula is as follows:
In Equation 2, variables
Spatial Diffusion Effect Model
Global Spatial Correlation
Global spatial correlation is used to analyze the spatial association and spatial difference of the research object and to determine whether there is spatial diffusion. It is generally measured by the global Moran index (Moran, 1953).
where I is the Moran index, and
According to the spatial distribution, the expected value of standardized Moran’s I was calculated as follows:
The variance of normal distribution is as follows:
where E(I) is the expectation of autocorrelation of observation variables and VAR (I) is the variance. WI and WJ refer to the sum of columns I and J in the spatial weight matrix, respectively, indicating the proximity of spatial positions I and J. When I and J are adjacent, Wij = 1, and vice versa. The value range of the Moran index is (−1,1). When I > 0, it means that there is a positive correlation in each region; when I = 0, it means that there is no spatial correlation in each region; and when I < 0, it indicates that there is a negative correlation in each city (completed by ArcGIS 10.2, used to analyze the diffusion characteristics of logistics industrial efficiency, manufacturing industrial efficiency, and linkage efficiency of the two industries).
Local Spatial Autocorrelation
Local spatial autocorrelation is the local expression of the Moran index, which is the test form of the agglomeration and dispersion effect of the local area. It reflects the correlation degree between the attribute value of a region and the attribute value of the adjacent region.
where Ii is the local Moran index of area I and other parameters are the same as above.
If Ii is greater than 0, it means that the local area and the surrounding area present similar spatial agglomeration (high or low agglomeration). If Ii is less than 0, it shows different spatial agglomeration (high–low or low–high agglomeration). The cluster of regions can be directly analyzed by the Moran scatter diagram, and the local Moran index is still tested by Z statistic.
Spatial Econometric Model
Common spatial measurement models include the spatial lag model (SLM), spatial error model (SEM), and spatial Durbin model (SDM) (Elhorst, 2014; Liu et al., 2017). When spatial correlation exists in the error terms of the model, then using the SEM it can be expressed as follows:
where Z indicates explained variables and is the vector of (n×1); X indicates explanatory variables, α indicates the regression coefficient, and is the vector of (k×1); μ indicates the random error vector; δ is the coefficient of spatial correlation between regression residuals; W indicates the spatial weight matrix (n×n); and ε indicates distributed random terms independently. If the model has significant dependence between explained variables and would affect its results, then using the SLM model, which can be expressed as follows:
where ρ indicates the coefficient of endogenous interaction effects (WY), with its size representing the degree of spatial diffusion and spatial dependence. A significant value shows that definite spatial dependence exists in explained variables. If the model considers both the endogenous interaction effect of the error term and the endogenous interaction effect of explained variables, then using SDM, which can be expressed as follows:
where θ is the spillover coefficient and others are the same with the SLM model.
Trend Prediction Model
The linkage development of the logistics and manufacturing industries has the characteristics of stage and dynamics. It is difficult to indicate its complexity to predict its development with general linear or non-linear models. Artificial neural networks have been successfully applied in many fields due to their unique information processing ability. A generalized regression neural network (GRNN) is a kind of radial basis function network that has strong a non-linear mapping ability, flexible network structure, high fault tolerance, and robustness. It has strong advantages over the RBF network in the approximation ability and learning speed, and the network converges. When the sample size is large, the prediction effect is good.
The theoretical basis of the GRNN is a non-linear regression analysis, which is composed of four layers in structure: an input layer, a mode layer, an addition layer, and an output layer. The number of neurons in the input layer is equal to the dimension of the input vector in the learning sample, the number of neurons in the mode layer is equal to the number of the learning sample, and the number of neurons in the output layer is equal to the dimension of the output vector in the learning sample (Matlab Chinese Forum, 2010; Zhang et al., 2020; Zheng et al., 2018).
where x is the input variable, xi is the learning sample corresponding to the ith neuron, yij is the connection weight between the pattern layer and the summation layer, and yj is the output result corresponding to the jth neuron in the output layer (the calculation process is programmed and completed by MATLAB 2012, which is used to predict the efficiency of the logistics and manufacturing industries and the efficiency of linkage between the two industries).
Indicators and Undesirable Outputs Data
Selection of Indicators
With reference to very weak research on the linkage efficiency of these two industries, combined with some selection principles (significance, practicability, data availability, and isotropy) of the indicator system, manufacturing and logistics industry, linkage development, and efficiency evaluation, the index system is constructed from the perspective of input and output (Ji et al., 2018; Liang, 2015; Chen et al., 2020). The data used in this study are obtained mainly from the China Statistical Yearbook, the statistical yearbooks of the provinces, the National Bureau of Statistics, the China Industrial Statistical Yearbook, the China Environmental Statistical Yearbook, the China Energy Statistical Yearbook, and the school library. Due to the availability of data, the transportation industry and warehousing, postal, and telecommunications industrial data are generally used as logistics industrial data (since China has not yet established a relatively complete statistical system for the logistics industry and the statistical caliber of the logistics industry in each country is not the same, the model and index selection in this study are only applicable to a single country or region with unified logistics industrial data statistics). The specific selection indicators are as follows.
The linkage efficiency of logistics industry and manufacturing industry is the comparative relationship between input and output or between cost and income in the process of business activities of the whole system formed by logistics industry and manufacturing industry. Therefore, the ecological efficiency of the linkage between the manufacturing industry and the logistics industry means that the ecological efficiency of the logistics industry and the manufacturing industry are input factors to each other, which has an impact on the system. Therefore, referring to the research methods of Wang, 2017, on the basis of Table 1 and Table 2, and after considering the impact of both sides on each other, the index system as shown in Table 3 is constructed (Wang, 2017). To sum up, and consider the driving factor on this basis, so as to form the variable of spatial economic model as shown in Table 4.
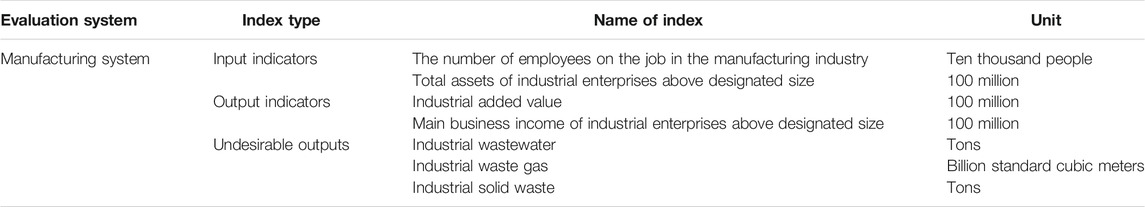
TABLE 1. Index system of manufacturing industry ecological efficiency.
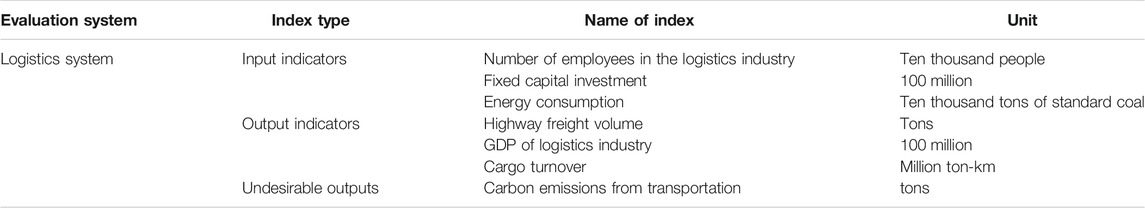
TABLE 2. Index system of logistics industry ecological efficiency.
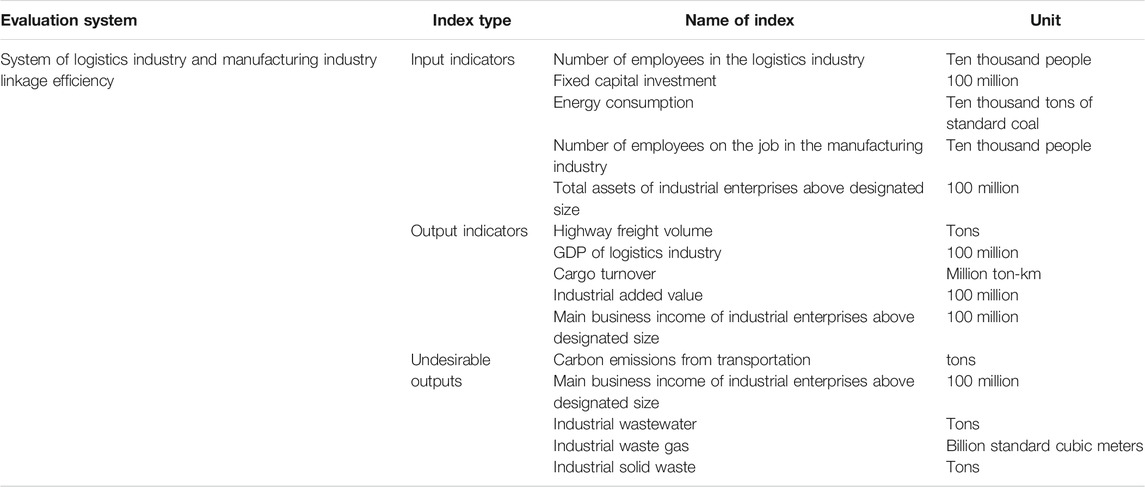
TABLE 3. Ecological efficiency index of the linkage between logistics industry and manufacturing industry.
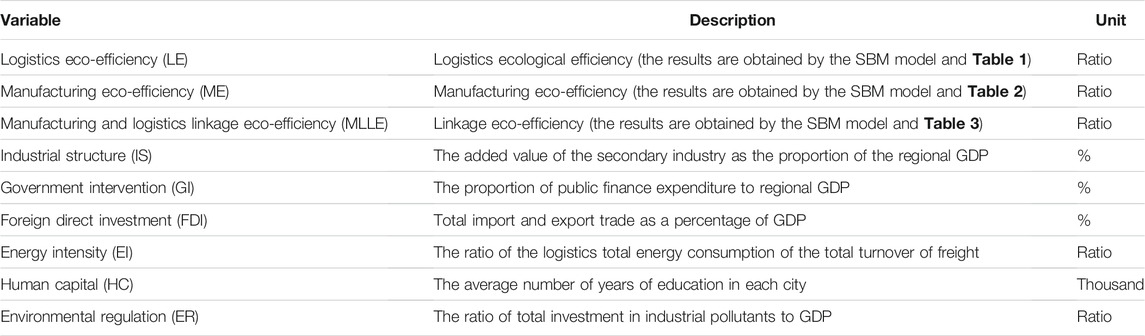
TABLE 4. Variable description for spatial econometric model.
Undesirable Outputs Data
1) Concept of Desirable Outputs and Undesirable Outputs
In the production process of general economic system, we always hope that the smaller the input is, the better the output is. That is to say, we can produce as many outputs as possible with the smallest input, and the relative efficiency of production unit is also higher. The core idea of traditional DEA model in dealing with input–output in efficiency evaluation is also based on this. The output mentioned here is the expected output, which is the main purpose of economic production, and refers to the output with benefit. However, the production process will inevitably produce some negative effects on economic development, and people do not want to produce output. The output mentioned here is undesirable outputs, that is, the output that people do not expect. It is a subsidiary product of economic production, which means the output that is not beneficial or even harmful. For example, the paper products industry, while producing, emits industrial wastewater, waste gas, waste, and other pollutants. The paper or paper products here are called expected output; industrial wastewater, waste gas, waste, and other pollutants are called undesirable outputs. Considering environmental variables and paying attention to undesirable outputs will have important theoretical and practical significance for transforming the mode of economic development, strengthening environmental protection, promoting sustainable development, and establishing a saving and efficient industry.
2) Undesirable Outputs Data of Logistics Industry
Refer to Yuan et al. (2016), Zhang et al., 2017, Zheng et al. (2018) and other relevant scholars’ research on China’s transportation carbon emissions. In this study, the logistics industry unexpected output data are obtained from the transportation carbon emissions data. Due to the availability of the data, the undesirable outputs of the manufacturing industry is derived from China’s Urban Statistical Yearbook, and the logistics industry’s undesirable outputs is selected from transportation carbon emissions (that is, the undesirable outputs of logistics industry in Table 1, 2, and 3). The specific calculation method is as follows.
To ensure the accuracy of calculations of carbon emissions in the transportation industry in each province, this analysis uses 21 kinds of energy sources, including raw coal, cleaned coal, other washed coal, briquette, coke, coke oven gas, other gas, crude oil, gasoline, kerosene, diesel, fuel oil, liquefied petroleum gas, refinery dry gas, natural gas, and electric power as statistical objects, which are different from those in the past. The carbon emission amount (D) of the transportation industry is calculated as shown in the following formula.
where
3) Undesirable Outputs Data of Manufacturing Industry
Due to the availability of data, combined with domestic and foreign scholars’ research (Watanabe and Tanaka, 2007; Han et al., 2014), two indicators of wastewater and solid waste are finally determined as the undesirable outputs of manufacturing industry. The data of undesirable outputs of manufacturing industry are from《China Environmental Statistical Yearbook》.
Empirical Analysis
Evaluate the Overall Efficiency Value
The calculation results of the efficiency of the logistics industry, manufacturing industry, and two industrial linkages are shown in Figure 1. 1) From 2006 to 2016, the efficiency of the manufacturing industry in the Yangtze River Delta was stable. From 2006 to 2008, it increased slightly; from 2009 to 2012, it decreased slightly; from 2012 to 2014, it began to rise steadily and reached the highest value in 2014; and from 2014 to 2016, it decreased first and then increased, with slight fluctuation. 2) From 2006 to 2016, the efficiency of the logistics industry in the Yangtze River Delta increased slightly. It increased slightly from 2006 to 2011 and decreased significantly from 2011 to 2016. After efficiency reached the highest value in 2014, it rapidly decreased to the lowest value in 2016. When the manufacturing and logistics industries are both effective in the DEA, they can achieve linkage development. 3) The deviation of the efficiency curve between the manufacturing and logistics industries shows that the study area failed to achieve linkage development considering undesirable outputs, but the main industries that failed to achieve linkage development were not the same. Among them, the low efficiency of the manufacturing industry in 2009–2013 failed to achieve linkage development, and the low efficiency of the logistics industry in 2014–2016 failed to achieve linkage development.
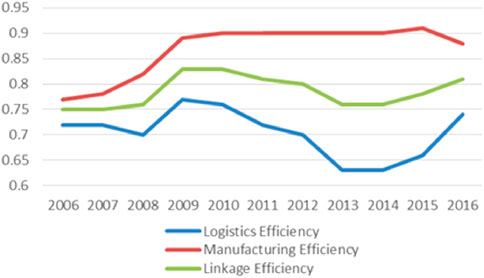
FIGURE 1. Efficiency changing trend of the logistics industry, manufacturing industry, and manufacturing and logistics linkage efficiency.
Empirical Analysis of Spatial Diffusion Effect
1) Empirical Analysis of Global Spatial Autocorrelation
Utilizing ArcGIS 10.2 software, the data of the logistics and manufacturing industries in 25 cities in the Yangtze River Delta from 2006 to 2016 are calculated, and Moran’s I value and its standardized Z value are obtained (see Table 5). The results show that the index of the logistics and manufacturing industries of 25 cities in the Yangtze River Delta is positively correlated. The Z value for each year is positive, and the p-value is less than α (0.05), which indicates that the spatial autocorrelation is significant. This indicates that the regions with similar development levels (high or low) of the logistics and manufacturing industries in the Yangtze River Delta are concentrated in space; that is, the cities with higher linkage levels of the two industries have higher linkage levels of the two industries in their peripheral cities, and vice versa. From 2006 to 2016, the Moran index of the logistics and manufacturing industry in the Yangtze River Delta showed a trend of first rising and then declining, but the Z value of the linkage efficiency of the two industries was greater than 5, indicating that the spatial distribution of the logistics and manufacturing industries in the Yangtze River Delta during this period showed a globally significant similar level of agglomeration characteristics.
2) Empirical Analysis of Local Spatial Autocorrelation
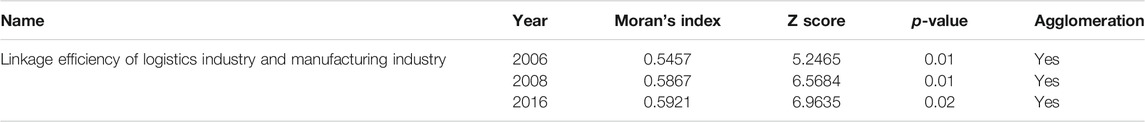
TABLE 5. Global autocorrelation analysis of linkage efficiency between logistics industry and manufacturing industry in the Yangtze River Delta.
In order to reflect the spatial structure changes of logistics industry and manufacturing industry in the Yangtze River Delta region from 2006 to 2016, according to the local spatial autocorrelation analysis method, this study selects the linkage efficiency of logistics industry and manufacturing industry in 2006, 2008, and 2016 as the research data and analyzes the spatial characteristics and changes of the linkage efficiency between each city and adjacent cities in the Yangtze River Delta region. The results (Table 6) show that there is an obvious spatial distribution pattern of logistics and manufacturing industry in the Yangtze River Delta.

TABLE 6. Results of the Lisa analysis on the linkage efficiency of logistics industry and manufacturing industry in the Yangtze River Delta in 2006, 2008, and 2016.
According to the results of Lisa, each city is divided into four quadrants according to its nature. As shown in Table 6, this study selects several representative cities for analysis.
The first quadrant is the HH agglomeration type of logistics and manufacturing linkage ecological efficiency. The cities in this quadrant have relatively large local Moran values, and the local Moran values of the surrounding cities are also relatively large. That is to say, the logistics and manufacturing linkage efficiency of this city is relatively high, and it has a significant positive impact on the logistics and manufacturing linkage efficiency of neighboring cities. The high-value area of industry linkage efficiency is surrounded by the same high-value area, and the diffusion effect is obvious. It can be seen that the high agglomeration areas of logistics and manufacturing linkage efficiency in the Yangtze River Delta are mainly concentrated in Shanghai, Hangzhou, and Nanjing. By comparing 2006 and 2016, it can be found that in 2006, they were mainly distributed in Shanghai, the provincial capital and municipality directly under the central government; in 2016, Wuxi, Suzhou, Changzhou, and other surrounding cities were added. The linkage efficiency of the two industries in these cities represents a development trend from multiple agglomeration areas to one agglomeration area in the space, which indicates that the linkage of logistics industry and manufacturing industry in the research area has entered a relatively centralized development stage (Li et al., 2020).
The second quadrant is the LH agglomeration type. The local Moran value of cities in this quadrant is relatively small, and the local Moran value of surrounding cities is relatively large, that is, the cities with low linkage efficiency of logistics and manufacturing industry are surrounded by high-value cities. It can be seen that the low and high efficiency agglomeration areas of logistics and manufacturing in the Yangtze River Delta are mainly concentrated in Jiaxing, Taizhou, and other cities. By comparing 2006 and 2016, it can be found that in 2006, they were mainly distributed in Jiaxing, a city close to Shanghai, and Taizhou, a city close to the Suzhou Wuxi Changzhou economic zone. By 2016, they were reduced to only Jiaxing, and the surrounding areas of Jiaxing were developed by Shanghai, Hangzhou, Ningbo, and other cities. It is surrounded by the city.
The third quadrant is LL agglomeration type. The local Moran value of cities in this quadrant is relatively small, and the local Moran value of surrounding cities is also relatively small. That is to say, the linkage efficiency of logistics and manufacturing in this city is low, and it has a significant negative impact on the linkage efficiency of logistics and manufacturing in neighboring cities The low value area of industry linkage efficiency is surrounded by the same low value area. It can be seen that the low efficiency of the linkage between logistics industry and manufacturing industry in the Yangtze River Delta is mainly concentrated in the northern and southern mountainous areas, such as Suqian, Lishui, Quzhou, and other cities. By comparing 2006 and 2016, we can find that the low and low concentration areas are all the cities in northern Jiangsu and southern Zhejiang. The linkage efficiency of the two industries in these cities presents a negative externality agglomeration in space, and these cities will easily cause a vicious circle between cities and form a marginal area through the spatial spillover effect (Hackius and Petersen, 2020; Kant and Pal, 2017; Zhang et al., 2018; Chen et al., 2020; Li et al., 2018).
The fourth quadrant is the HL agglomeration type. The cities in this quadrant have relatively large local Moran values, and the local Moran values of the surrounding cities are relatively small, that is, the logistics and manufacturing linkage efficiency of the city is higher, and the local Moran values of the surrounding cities are relatively low, that is, the cities with high logistics and manufacturing linkage efficiency are ignored Surrounded by low value cities, it has spatial spillover effect on the surrounding cities. It can be seen from Table 6 that the agglomeration areas of logistics and manufacturing linkage efficiency in the Yangtze River Delta are mainly concentrated in Wenzhou and other cities. By comparing 2006 and 2016, it can be found that these cities are concentrated in southern Jiangsu. There are too many low value cities around, which indicates that Wenzhou, as a big city around, has limited power to drive the efficiency of the two industries linkage (Chen et al., 2020; Wang et al., 2015; Choi et al., 2016; Shi et al., 2016).
To sum up, the spatial agglomeration attribute of logistics and manufacturing linkage efficiency in the Yangtze River Delta is relatively stable, and the spatial diffusion effect is strong. In recent years, the rise of Suzhou, Wuxi, and Changzhou makes the Yangtze River Delta form a development trend from multiple agglomeration areas to relatively concentrated agglomeration areas. Jiaxing and Taizhou are the typical cities in the low–high agglomeration type. These cities are in the transition zone of Shanghai, Nanjing, and Hangzhou megalopolis; surrounded by these developed these low-low cluster type cities are the transition zone of the study area megalopolis used for factor flow. Lishui and Suqian are typical cities in low–low cluster type. The development level of logistics industry in these cities is backward, the foundation of manufacturing industry is poor, and the linkage efficiency of the two industries in the surrounding areas is also low, which is easy to form marginal areas. The typical city in high–low agglomeration type is Wenzhou, where the export-oriented economy is developed, and the manufacturing industry has a good foundation, resulting in the spatial spillover effect (Jiang et al., 2018; He et al., 2020; John., 2018).
Empirical Analysis of Spatial Econometrics
According to the previous analysis, the spatial autocorrelation test of linkage efficiency of logistics industry and manufacturing industry indicates that it exists as a spatial agglomeration. To find a proper spatial econometric model, this study use (robust) Lagrange multipliers (LM) test, the likelihood ratio (LR) test, the Wald test, and Hausman test (Table 7).
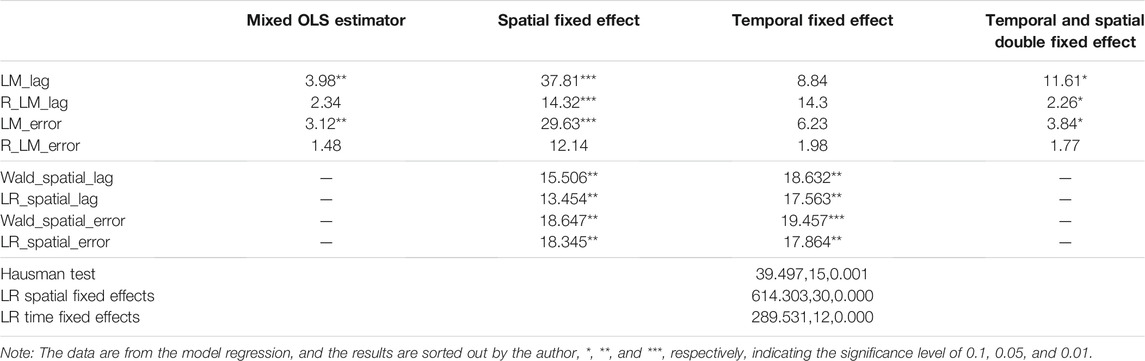
TABLE 7. Estimation results without spatial interactive effects.
LM test results show that the spatial lag effect is more significant than the spatial error effect. Therefore, it is more suitable to use the spatial Durbin model.
It is noteworthy that the coefficients of the SDM model do not directly reflect the marginal effects of the corresponding explanatory variables on the dependent variable (LeSage and Pace, 2010), so it needs to verify spatial effects from the total effect, the direct effect, and indirect effect (Table8).
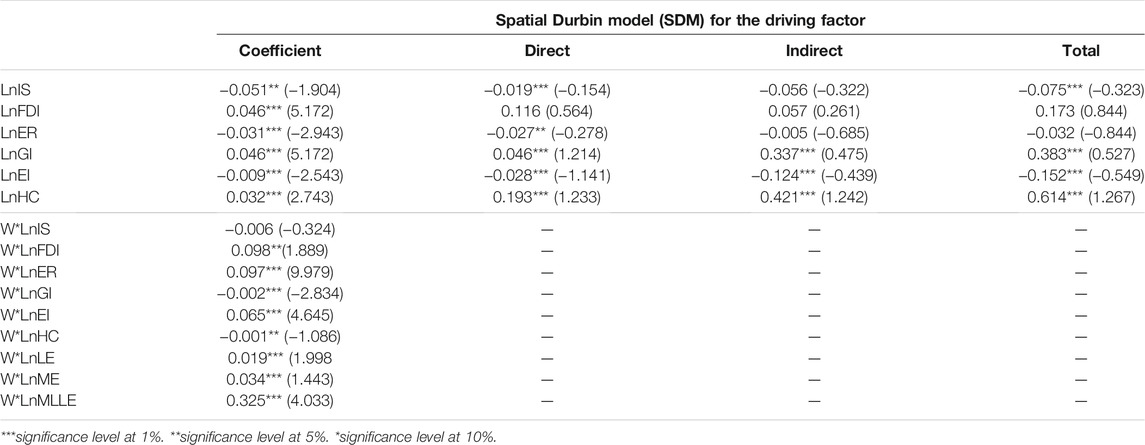
TABLE 8. Estimation and test results based on the spatial Durbin model (SDM) for the driving factor.
The regression results are shown in Table 8; the industrial structure (IS) has a negative impact on the linkage ecological efficiency; it fully shows that the increase in the proportion of China’s logistics industry and manufacturing industry has a negative effect on ecological efficiency. With the acceleration of industrialization, the secondary industry drives economic growth will not change in a short period of time.
Foreign direct investment is the invisible driving force of the logistics industry and manufacturing industry development. Foreign direct investment increases 1%, linkage ecological efficiency will increase 0.116%, the hypothesis of ‘‘polluting heaven’’ is not established. This is mainly because in the process of logistics and manufacturing transformation, China gives priority to the development of green logistics and advocates green production. Relevant documents have been formulated and very strict measures have been taken for pollution prevention and ecological protection. In addition, we should pay more attention to the introduction of high-quality foreign investment and strengthen the examination and approval of foreign investment. The spillover effect of high-quality foreign capital is conducive to improving the linkage ecological efficiency of logistics industry and manufacturing industry in the Yangtze River Delta.
Environmental regulation has a negative impact on the improvement of logistics ecological efficiency, the higher the intensity of environmental regulation, the lower the logistics ecological efficiency. The inefficiency of environmental regulation is caused by the decentralized governance structure and the performance appraisal mechanism. This leads to the “race-to-the-bottom” competition of local governments in the process of enacting and implementing environmental regulations. Because environmental pollution is external and can be transmitted between regions, even if strict environmental regulations are implemented in this region, it will not necessarily reduce the damage caused by environmental pollution.
The government intervention direct coefficient is 0.046, indicating that the current government intervention has a positive impact on the linkage ecological efficiency. The problems existing in the linkage development of logistics industry and manufacturing industry are that the degree of marketization is not enough, the direct information asymmetry of the two industries, and the willingness of active cooperation is still not high. Therefore, government intervention can play a positive role in standardizing the market order, coordinating the operation of logistics and manufacturing industries, continuously guiding the two industries to actively cooperate, and improving the linkage efficiency of the two industries.
The energy intensity direct coefficient is 0.028, indicating that the energy intensity has a significant negative effect on the improvement of logistics ecological efficiency. The greater the energy intensity, the stronger will be the dependence of logistics industry and manufacturing industry on energy and also the greater the energy consumption. At the same time, the proportion of clean energy used in China’s logistics industry is small. Therefore, high energy consumption and high carbon emission restrict the efficient and sustainable development of logistics industry.
Human capital direct coefficient is 0.193, indicating that the human capital has a positive impact on linkage ecological efficiency. The indirect coefficient of human capital is 0.421, indicating that human capital has a positive spillover effect. The result shows that the higher the education level of the labor force in a certain city, the more propitious it is to promote the progress of linkage ecological efficiency in neighboring city. This is related to the development stage of logistics and manufacturing in the Yangtze River Delta. At present, the Yangtze River Delta is the most active region in China’s economic development and the leading region of high-tech development. The logistics industry and manufacturing industry have gradually crossed the primary stage driven by material capital and labor input, and entered the growth stage driven by human capital and core technology.
Empirical Analysis of Trend Prediction
According to the index system analyzed and the ecological efficiency results (logistics industrial efficiency, manufacturing industrial efficiency, and two industries’ linkage efficiency) calculated by the SBM model in the previous study, three input indexes of the logistics industry and two input indexes of the manufacturing industry are selected as network input, and the logistics industrial efficiency (LE), manufacturing industrial efficiency (ME), and two industrial linkage efficiencies (MLLE) are utilized as network output to establish the GRNN network. In view of the small amount of data and to improve the accuracy of the prediction, K-Fold cross-validation is used for data cross-validation, the GRNN network is trained, and the best SPREAD is found by circulation. The calculation process is programmed and completed in MATLAB 2012, and the calculation value of the linkage efficiency of the two industries from 2006 to 2016 is taken as the test sample for simulation. From the calculation results, it can be found that when the spread value of the network is 0.44, the prediction effect of the network is the most ideal, the simulation value is consistent with the actual value, and the feasibility of the model is high (Table 9). (LE is logistics efficiency; ME is manufacturing efficiency; MLLE is manufacturing and logistics linkage efficiency; SV is sample value; AV is analog value; Me is measurement error.)
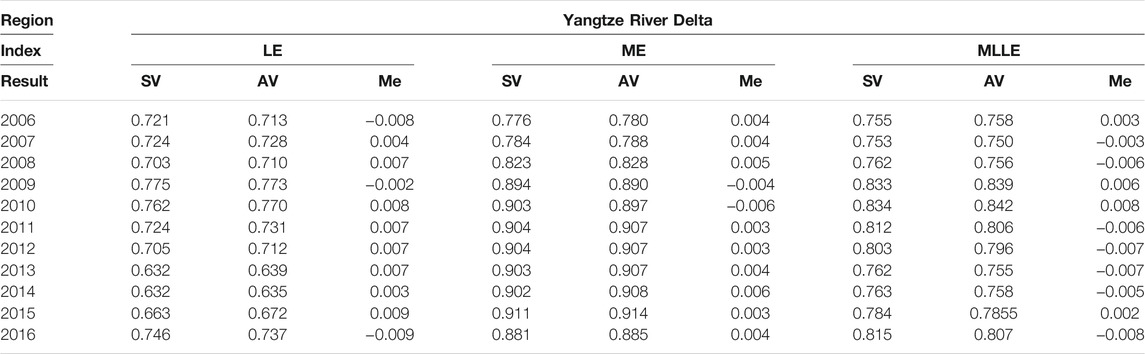
TABLE 9. Network training error test of the efficiency of two industries linkage development in the Yangtze River Delta from 2006 to 2016.
Using the established GRNN model, the efficiency of the logistics and manufacturing industries and the linkage efficiency of the two industries in 2017–2025 are simulated (Table 10). It can be seen from the table that the linkage efficiency of the two industries will continue to be at a high level in the future and that the overall linkage development is relatively stable at a medium and high level, but there is still room for improvement.
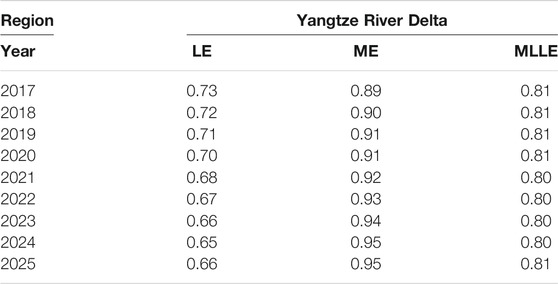
TABLE 10. Development trend forecast of the efficiency of the linkage development of the two industries in the Yangtze River Delta from 2017 to 2025.
Conclusion
In this study, the ecological efficiency of logistics and manufacturing industry is evaluated by the SBM model; the spatial heterogeneity and spatial aggregation of the efficiency of the two industries are analyzed by the spatial correlation analysis; the driving factors of linkage efficiency are analyzed by using the spatial measurement method; and the dynamic evolution of the trend is predicted by using a neural network. It provides a theoretical reference and decision support for improving the linkage efficiency of logistics and manufacturing industry in the Yangtze River Delta.
The calculation results of industrial linkage ecological efficiency show that the ecological efficiency of the manufacturing industry in the study area has steadily improved; the ecological efficiency of the logistics industry has fluctuated greatly, first rising, then falling, and finally steadily improving; and the deviation of the ecological efficiency curve between the logistics and manufacturing industries shows that when considering the undesirable outputs, the logistics and manufacturing industries cannot achieve an absolutely high level of linkage development during the research period, but the ecological efficiency of the logistics and manufacturing industries is relatively stable. The linkage development is at a high level.
The results from spatial heterogeneity show that there is a positive spatial correlation between the indexes of the logistics and manufacturing of 25 cities in the Yangtze River Delta. Areas with similar development levels (high or low) of the logistics and manufacturing industries are concentrated in space. From 2006 to 2016, the Moran index of the logistics and manufacturing industries in the Yangtze River Delta region showed a trend of first rising and then declining, which indicates that the spatial distribution of the logistics and manufacturing industries showed a significantly similar level of agglomeration characteristics.
The results of the local spatial autocorrelation analysis show that the linkage ecological efficiency of the two industries in the Yangtze River Delta presents a development trend from multiple agglomeration areas to one agglomeration area in space, which indicates that the linkage of logistics industry and manufacturing industry in the Yangtze River Delta has entered a relatively centralized development stage.
The results show that FDI, GI, and HC have positive effects on the linkage ecological efficiency, while IS, ER, and EI have negative effects on the linkage ecological efficiency. The future trend of linkage development shows that the linkage ecological efficiency of the two industries will continue to be at a high level in the future and that the overall linkage development is relatively stable, which is at medium and high levels, but there is still room for improvement.
Suggestions and Policy Implications
According to the aforementioned research conclusion, this study presents some suggestions for the linkage development of the logistics and manufacturing industries in the Yangtze River Delta region.
First, although the efficiency of the regional logistics industry is at a high level, this still cannot meet the needs of the manufacturing industry, and the linkage ecological efficiency of the two industries lags behind the efficiency of the manufacturing industry. Therefore, in order to improve the level of linkage development, it needs to continue to make greater effort to develop high-end logistics dominated by high-tech, which can greatly improve the service level, specialization level, and economies of scale that are advantageous for logistics enterprises, and to help the manufacturing industry to reduce costs and to improve efficiency.
Second, the transformation and upgrading of the local manufacturing industry need to be continually promoted. Although the efficiency of the manufacturing industry in the research area is at a high level, there is still room for development. In the future, the transformation and upgrading of China’s manufacturing industry should be promoted under the guidance of the Internet of Things, artificial intelligence, big data, cloud computing, and other advanced technologies to achieve the goal of “made in China 2025.”
Third, it is increasing concern to society about the environment impact of the development of the logistics and manufacturing industries. The development policies of the logistics and manufacturing industries formulated by relevant managers should not only consider the economic benefits but also consider the impact on the environment.
Fourth, energy conservation and emission-reduction technology should be promoted. The government should increase investment in the development of energy-saving and emission-reduction technology, enhance the exchange of advanced technology and the management experience of energy savings and environmental protection, and actively develop and promote energy savings and emission-reduction technology to effectively improve the increasingly serious problem of environmental pollution.
Fifth, the government should actively develop the circular economy and realize the recycling of resources. Government managers can expand the scope of circular economy pilots to spread all over the country, formulate environmental regulation policies reasonably, encourage industries with high-energy consumption and large amounts of pollution to develop an internal circular economy, and reduce undesirable outputs.
The limitations of this study include the following. Regarding research data acquisition: because the logistics industry is a network industry involved in many other industries, currently, a systematic evaluation index of the efficiency of the logistics industry is still missing; there are currently no authoritative logistics statistical indicators in China; compared to urban logistics and manufacturing data, the availability of undesirable outputs data is poorer.
Regarding future research, with the development of informatization, big data, and the Internet of Things, more extensive research can be conducted on index selection and data acquisition in the future. This study is limited to the Yangtze River Delta region. The interaction between the logistics and manufacturing industries has a different development status in different regions in China. In the future, the study area can be extended to the entire country.
Data Availability Statement
The original contributions presented in the study are included in the article/Supplementary Material; further inquiries can be directed to the corresponding author.
Author Contributions
X-HM designed the manuscript framework. W-LZ wrote the manuscript. J-WW provided policy recommendations. J-FL provided data.
Funding
This research was funded by the Fundamental Research Funds for the Central Universities (Grant Number 300102341513). This work was supported in part by the Fundamental Research Funds for the Central Universities under Grant 300102230501 and in part by the Major Theoretical and Practical Problems Research Project of Social Science Circles in Shaanxi Province in 2020; Project name: Research on coupling mechanism and congestion management strategy of urban comprehensive transportation network system based on hypernetwork, under Project 2020Z033. This work was supported in part by the Innovation capability support plan of Shaanxi Province—Research on the construction of modern industrial system from the perspective of “new infrastructure” —taking Shaanxi Province as an example (2021KRM042). This study is funded by the National Natural Science Foundation of China (Grant Number 52102374). The authors are grateful for the financial support provided by the Natural Science Basic Research Plan in Shaanxi Province of China under Grant 2020JQ-360.
Conflict of Interest
The authors declare that the research was conducted in the absence of any commercial or financial relationships that could be construed as a potential conflict of interest.
Publisher’s Note
All claims expressed in this article are solely those of the authors and do not necessarily represent those of their affiliated organizations, or those of the publisher, the editors, and the reviewers. Any product that may be evaluated in this article, or claim that may be made by its manufacturer, is not guaranteed or endorsed by the publisher.
Acknowledgments
We are thankful for the comments and advice which are given by the reviewers. They have improved the content of this work and pointed out some research directions of particular interest.
References
Chames, A., Cooper, W. W., and Rhodes, E. (1978). Measuring the Efficiency of Decision Making Units.J. Eur. J. Oper. Res. 2 (6), 429–444.
Chen, C, Chen, J., and Gu, J. (2020). Research on the Evolution of the Linkage Development between Manufacturing Industry and Logistics Industry in China .J. Shandong Univ. (philosophy Soc. Sci 02, 73–81. doi:10.19836/j.cnki.37-1100/c.2020.02.008
Chen, J, J., Li, H., and Zheng, T. (2020). Network Evolution of Logistics Service Effect of Port Infrastructure in Coastal China. J. IEEE Access 08, 1. doi:10.1109/access.2020.2975364
Choi, T.-M., Wallace, S. W., and Wang, Y. (2016). Risk Management and Coordination in Service Supply Chains: Information, Logistics and Outsourcing. J. Oper. Res. Soc. 67 (2), 159–164. doi:10.1057/jors.2015.115
De Koster, R. B. M. (2003). Distribution Strategies for Online Retailers. IEEE Trans. Eng. Manage. 50 (4), 448–457. doi:10.1109/tem.82013510.1109/tem.2003.820135
Elahi, E., Khalid, Z., and Cui, W. (2019c). The Public Policy of Agricultural Land Allotment to Agrarians and its Impact on Crop Productivity in Punjab Province of Pakistan.J. Land Use Policy 90, 104324. doi:10.1016/j.landusepol.2019.104324
Elahi, E., Abid, M., Zhang, L., ul Haq, S., and Sahito, J. G. M. (2018). Agricultural Advisory and Financial Services; Farm Level Access, Outreach and Impact in a Mixed Cropping District of Punjab, Pakistan. Land Use Policy 71, 249–260. doi:10.1016/j.landusepol.2017.12.006
Elahi, E., Khalid, Z., Tauni, M. Z., Zhang, H., and Lirong, X. (2021b). Extreme Weather Events Risk to Crop-Production and the Adaptation of Innovative Management Strategies to Mitigate the Risk: A Retrospective Survey of Rural Punjab, Pakistan. Technovation, 102255. doi:10.1016/j.technovation.2021.102255
Elahi, E., Weijun, C., Jha, S. K., and Zhang, H. (2019a). Estimation of Realistic Renewable and Non-renewable Energy Use Targets for Livestock Production Systems Utilising an Artificial Neural Network Method: A Step towards Livestock Sustainability. Energy 183, 191–204. doi:10.1016/j.energy.2019.06.084
Elahi, E., Weijun, C., Zhang, H., and Abid, M. (2019b). Use of Artificial Neural Networks to rescue Agrochemical-Based Health Hazards: A Resource Optimisation Method for Cleaner Crop Production. J. Clean. Prod. 238, 117900. doi:10.1016/j.jclepro.2019.117900
Elahi, E., Weijun, C., Zhang, H., and Nazeer, M. (2019d). Agricultural Intensification and Damages to Human Health in Relation to Agrochemicals: Application of Artificial Intelligence. Land Use Policy 83, 461–474. doi:10.1016/j.landusepol.2019.02.023
Elahi, E., Zhang, H., Lirong, X., Khalid, Z., and Xu, H. (2021a). Understanding Cognitive and Socio-Psychological Factors Determining Farmers' Intentions to Use Improved Grassland: Implications of Land Use Policy for Sustainable Pasture Production. Land Use Policy 102, 105250. doi:10.1016/j.landusepol.2020.105250
Elhorst, J. P. (2014). Linear Spatial Dependence Models for Cross-Section Data. Spat. Econom. 9, 5–36. doi:10.1007/978-3-642-40340-8_2
Hackius, N., and Petersen, M. (2020). Translating High Hopes into Tangible Benefits: How Incumbents in Supply Chain and Logistics Approach Blockchain. IEEE Access 8 (1), 34993–35003. doi:10.1109/access.2020.2974622
Han, J., Chen, C., and Shi, F. (2014). Environmental Efficiency, Industry Heterogeneity and Optimal Regulation Intensity of China's Manufacturing Industry.J. Stat. Res. 31 (03), 61–67. doi:10.19343/j.cnki.11-1302/c.2014.03.009
He, D., Yang, J., Wang, Z., and Li, W. (2020). Has the Manufacturing Policy Helped to Promote the Logistics Industry. PLOS ONE 15, e0235292. doi:10.1371/journal.pone.023529210.1371/journal.pone.0235292
Huang, Q., Peng, B., and Elahi, E. (2020). Evolution and Driving Mechanism of Ecological Security Pattern: A Case Study of Yangtze River Urban Agglomeration.J. Integrated Environ. Assess. Manag. 17, 573–583. doi:10.1002/ieam.4358
Ji, X., Zhou, W., and Ma, T. (2018). Innovation of Logistics Cost Management and Competitiveness of Manufacturing Enterprises in Yangtze River Delta -- Based on the Comparison of Logistics Efficiency between Chinese and American Manufacturing Industries.J. Discussion Mod. economy (8), 91–97. doi:10.3969/j.issn.1009-2382.2018.08.012
Jiang, P., Hu, Y. C., and Yen, G. F. (2018). Using a Novel Grey DANP Model to Identify Interactions between Manufacturing and Logistics Industries in China.J. Sustainability 10 (10). doi:10.3390/su10103456
John, E. (2018). Spillan,Alma Mintu-Wimsatt,Ali Kara. Role of Logistics Strategy, Coordination and Customer Service Commitment on Chinese Manufacturing Firm Competitiveness.J. Asia Pac. J. Marketing Logistics 30 (5), 1365–1378. doi:10.1108/APJML-09-2017-0224
Kant, K., and Pal, A. (2017). Internet of Perishable Logistics. IEEE Internet Comput. 21 (1), 22–31. doi:10.1109/mic.2017.19
Li, J., Li, T., and Wang, Y. (2018). Spatial Effect of Regional Logistics Industry Efficiency Considering Undesirable Output.J. J. Arid Land Resour. Environ. 032 (008), 67–73. doi:10.13448/j.cnki.jalre.2018.237
Li, Z., Li, Y., Lu, W., and Huang, J. (2020). Crowdsourcing Logistics Pricing Optimization Model Based on DBSCAN Clustering Algorithm (IEEE Access), 1. doi:10.1109/access.2020.2995063
Liang, H. (2015). Research on the Influence Mechanism of Logistics Development on Manufacturing Efficiency .J. Southeast Acad. (1), 88–97. doi:10.13658/j.cnki.sar.2015.01.011
Liu, H., Fang, C., Zhang, X., Wang, Z., Bao, C., and Li, F. (2017). The Effect of Natural and Anthropogenic Factors on Haze Pollution in Chinese Cities: A Spatial Econometrics Approach. J. Clean. Prod. 165, 323–333. doi:10.1016/j.jclepro.2017.07.127
Long, R., Ouyang, H., and Guo, H. (2020). Super-slack-based Measuring Data Envelopment Analysis on the Spatial-Temporal Patterns of Logistics Ecological Efficiency Using Global Malmquist Index Model. Environ. Techn. Innovation 18, 100770. doi:10.1016/j.eti.2020.100770
Matlab Chinese Forum (2010). Analysis of 30 Cases of MATLAB Neural Network. Beijing, China: M. Beijing University of Aeronautics and Astronautics Press.
Moran, P. A. P . (1953). The Statistical Analysis of the Canadian Lynx Cycle.J. Aust. J. Zoolog. 1. doi:10.1071/zo9530291
Notice (2020). On Printing and Distributing the Implementation Plan for Promoting the Deep Integration and Innovative Development of Logistics Manufacturing Industry. J. Shanghai Building Materials (05), 9–12.
Peng, B., Wang, Y., and Zahid, S. (2020a). Platform Ecological circle for Cold Chain Logistics Enterprises: the Value Co-creation Analysis.J. Ind. Manag. Data Syst. doi:10.1108/IMDS-10-2019-0531
Peng, B., Li, Y., Elahi, E., and Wei, G. (2019a). Dynamic Evolution of Ecological Carrying Capacity Based on the Ecological Footprint Theory: A Case Study of Jiangsu Province. Ecol. indicators 99 (APR), 19–26. doi:10.1016/j.ecolind.2018.12.009
Peng, B., Wang, Y., Elahi, E., and Wei, G. (2018). Evaluation and Prediction of the Ecological Footprint and Ecological Carrying Capacity for Yangtze River Urban Agglomeration Based on the Grey Model. Ijerph 15 (11), 2543. doi:10.3390/ijerph15112543
Peng, B., Zheng, C., Wei, G., and Elahi, E. (2020b). The Cultivation Mechanism of green Technology Innovation in Manufacturing Industry: From the Perspective of Ecological Niche. J. Clean. Prod. 252, 119711. doi:10.1016/j.jclepro.2019.119711
Peng, B., Huang, Q., Elahi, E., and Wei, f. (2019b). Ecological Environment Vulnerability and Driving Force of Yangtze River Urban Agglomeration. Sustainability 11 (23), 6623. doi:10.3390/su11236623
Schaltegger, S., and Sturm, A. (1990). Kologische Rationalitt (German/in English: Environmental Rationality). J. Die Unternehmung 4 (4), 117–131.
Shi, Y., Zhang, A., Arthanari, T., Liu, Y., and Cheng, T. C. E. (2016). Third-party purchase: An Empirical Study of Third-Party Logistics Providers in China. Int. J. Prod. Econ. 171 (jan2), 189–200. doi:10.1016/j.ijpe.2015.08.028
Sueyoshi, T., Yuan, Y., and Goto, M. (2016). A Literature Study for DEA Applied to Energy and Environment.J. Energ. Econ. 62 (FEB.), 104–124. doi:10.1016/j.eneco.2016.11.006
Tone, K. (2001). A Slacks-Based Measure of Efficiency in Data Envelopment Analysis. Eur. J. Oper. Res. 130 (3), 498–509. doi:10.1016/s0377-2217(99)00407-5
Tone, K. (2002). A Slacks-Based Measure of Super-efficiency in Data Envelopment Analysis. Eur. J. Oper. Res. 143 (1), 32–41. doi:10.1016/s0377-2217(01)00324-1
Tone, K. (2003). Dealing with Undesirable Outputs in DEA: A Slacks2 Based Measure ( SBM)Approach, I-2003-0005. Toronto: J.GR IPS Research Report Series.
Wang, B., Wu, Y., and Yan, P. (2010). China's Regional Ecological Efficiency and Environmental Total Factor Productivity Growth. J. Sci. Technol. Commun. 05 (05), 95–109.
Wang, J. J., Wang, M., Liu, F., and Chen, F. (2015). Multistakeholder Strategic Third-Party Logistics Provider Selection:. Transportation J. 54 (3), 312–338. doi:10.5325/transportationj.54.3.0312
Wang, Y., Peng, B., Wei, G., and Elahi, E. (2019). Comprehensive Evaluation and Spatial Difference Analysis of Regional Ecological Carrying Capacity: A Case Study of the Yangtze River Urban Agglomeration. Ijerph 16 (18), 3499. doi:10.3390/ijerph16183499
Wang, Z. (2017). Efficiency Evaluation of the Linkage Development of China's Manufacturing and Logistics Industry -- Based on Super Efficiency Ccr-Dea Model. J. China's Circulation Economy 2 (2). doi:10.14089/j.cnki.cn11-3664/f.2017.02.003
Watanabe, M., and Tanaka, K. (2007). Efficiency Analysis of Chinese Industry: A Directional Distance Function Approach. Energy Policy 35 (12), 6323–6331. doi:10.1016/j.enpol.2007.07.013
Wen-Long, Z., Jian-Wei, W., Shi-Qing, Z., Rehman Khan, S. A., An-Ding, J., Xu-Quan, Y., et al. (2021). Evaluation of Linkage Efficiency between Manufacturing Industry and Logistics Industry Considering the Output of Unexpected Pollutants. J. Air Waste Manag. Assoc. 71, 304–314. doi:10.1080/10962247.2020.1811799
Yuan, Ci., Zhang, Q., and Rui, Xi. (2016). Spatiotemporal Evolution and Difference Analysis of Transportation Carbon Emissions in China. J. J. Environ. Sci. 12 (12). doi:10.13671/j.hjkxxb.2016.0206
Zhang, F., Shi, Z., and song, X. (2019). Green Technology Innovation Efficiency and Environmental Regulation Threshold Effect of Advanced Manufacturing Industry .J. Prog. Countermeasures Sci. Technol. 36472 (12), 68–76. doi:10.6049/kjbydc.2018100165
Zhang, L. (2019). Research on the Efficiency and Influencing Factors of China's Logistics Industry under the Constraint of Low Carbon .J. Value Eng. 38 (26), 129–131.
Zhang, S., Wang, J., and Zheng, W. (2017). Spatiotemporal Difference Analysis of Carbon Emissions and Influencing Factors of Transportation in China. J. J. Environ. Sci. 12 (12), 4787–4797. doi:10.13671/j.hjkxxb.2017.0242
Zhang, Y., Guo, Z., Lv, J., and Liu, Y. (2018). A Framework for Smart Production-Logistics Systems Based on CPS and Industrial IoT. IEEE Trans. Ind. Inf. 14 (9), 4019–4032. doi:10.1109/tii.2018.2845683
Zhang, Z., Hui, J., and Shi, Z. (2020). Cycle Condition Identification of Loader Based on Optimized KNN Algorithm, J. IEEE Access 08 1. doi:10.1109/access.2020.2985052
Zheng, W L, W. L., Wang, J. W., and Zhang, S. Q. (2018). Road Transportation Network Planning and Design Based on the BP Neural Network.J. Adv. Transportation Stud. 3, 117–124. doi:10.4399/978882552166515
Zheng, W., Wang, J., and Zhang, Sg. (2018). Analysis on Carbon Emission Decoupling Effect and Driving Factors of Environmental Pollution in China Transportation Industry. J. Chem. Eng. Trans. 66, 637–642. doi:10.3303/CET1866107
Zhou, P., Ang, B. W., and Poh, K. L. (2008). Measuring Environmental Performance under Different Environmental DEA Technologies. Energ. Econ. 30 (1), 1–14. doi:10.1016/j.eneco.2006.05.001
Keywords: ecological efficiency, logistics industry, manufacturing industry, spatiotemporal characteristics, spatial econometric model
Citation: Zheng W-L, Wang J-W, Mao XH and Li J-F (2022) Ecological Efficiency Evaluation and Spatiotemporal Characteristics Analysis of the Linkage Development of the Logistics Industry and Manufacturing Industry. Front. Energy Res. 9:709582. doi: 10.3389/fenrg.2021.709582
Received: 14 May 2021; Accepted: 31 December 2021;
Published: 26 January 2022.
Edited by:
You-hua Chen, South China Agricultural University, ChinaReviewed by:
Jibiao Zhou, Tongji University, ChinaEhsan Elahi, Shandong University of Technology, China
Copyright © 2022 Zheng, Wang, Mao and Li. This is an open-access article distributed under the terms of the Creative Commons Attribution License (CC BY). The use, distribution or reproduction in other forums is permitted, provided the original author(s) and the copyright owner(s) are credited and that the original publication in this journal is cited, in accordance with accepted academic practice. No use, distribution or reproduction is permitted which does not comply with these terms.
*Correspondence: Xin Hua Mao, bWFveGluaHVhQGNoZC5lZHUuY24=