 Fuliang Xue
 Xiaotong Feng
 Jing Liu
- School of Management Science and Engineering, Tianjin University of Finance and Economics, Tianjin, China
The development and competition of the new energy industry will become an important battlefield of a new round of technological and industrial competition. This study use the annual data from 1990 to 2019 to understand the factors affecting the development of new energy development in China by examining the long-run and causal relationship among the proportion of new energy consumption, energy prices, carbon emissions, industrial structure, economic growth, and new energy power generation in a multivariate model for China. The findings indicate that in the long run, new energy generation is positively linked with new energy consumption, whereas energy prices and carbon emissions have a negative and significant impact on new energy consumption. In the short run, economic growth can promote the growth of new energy consumption. However, this positive effect is gradually formed and is unlikely to happen soon. However, whether the impact of industrial structure optimization on new energy consumption is a long- or short-run estimate is not significant. Causality results suggest that a one-way Granger causality exists between each factor and new energy consumption in different lag orders, except for industrial structure. Re-examining the energy price mechanism and carbon emission mechanism policy, maintaining stable GDP growth, increasing the installed capacity of new energy power generation, and improving power generation conversion efficiency are vital for ensuring new energy development.
Introduction
Energy is an important material basis for the survival and development of modern society (Cao and Huan, 2020). The sustainable development of China’s economy and society mainly benefits from the sustainable supply of traditional energy, such as coal, oil, and natural gas (Ellabban et al., 2014). Thus far, at least five energy crises have broken out in the world, and energy problems will always hinder and inhibit social and economic development (Randall, 2014; Radcliffe, 2018). For many countries, the development of new energy can not only promote the economy out of a crisis but also enhance the security of energy supply and improve the international competitiveness in the future era of low-carbon economy (Zhaoyuan and Ishwaran, 2020). Therefore, new energy development has become the consensus of major countries in the world. Many scholars have researched the current state of energy in their country, providing new insights and suggestions for energy development and policy formulation (Husaini, 2014; Liu et al., 2021; Saqib et al., 2021). For China, this situation is a rare development opportunity. China has advantages and potentials in new energy. If we judge the situation and make scientific planning, then new energy will become a great help to solve energy problems and improve international competitiveness.
As the world’s second-largest economy, China has become the world’s largest energy consumer. Moreover, its energy output has entered the forefront of the world, but the pressure of demand growth is huge. In 2019, China’s total primary energy consumption reached 3,384.4 Mtoe, ranking the first in the world. Among them, the new energy consumption reached 502.8 Mtoe, accounting for 14.9% of China’s total primary energy consumption, with a year-on-year increase of 9.81%. Figure 1 shows that coal and oil dominate China’s energy consumption, accounting for 57.64 and 19.69%, respectively. More than three-quarters of China’s energy consumption comes from low-cost and high pollution nonrenewable fossil energy.

FIGURE 1. Proportion of China’s primary energy consumption structure in 2019.
Although China is currently rich in coal reserves, coal production has fallen rapidly since the government promoted supply-side reform in 2015 (Yaodong and Gillespie, 2020). As a result, the national coal supply and demand are unbalanced, and the price increases periodically, thereby easily leading to the disturbance of economic market order. Although the global reserves for oil are considerable, the traditional oil fields, which are easy to exploit, are generally exhausted. However, the exploration of new oil fields is a long-term task with a huge investment. In the past 10 years, the international oil giants have been exhausted only by maintaining production. The peak oil (Ghosh and Prelas, 2009; da Luz Sant'Ana et al., 2018) has not yet come, but it is approaching quickly. China has a vast territory and abundant resources. However, its population base is too large, and its energy demand is amazing, particularly the energy demand of enterprises such as ceramics, thermal power, and steel. Domestic coal supply is insufficient. Oil basically depends on imports, and many energy gaps exist. Only imports can fill these gaps. In 2019, the import of coal was 299.52 Mt, and the import of crude oil was 505.68 Mt, and these amounts increased up to $2.33 million and $24.23 million, respectively. However, the energy lifeline Strait of Malacca is in the hands of others. In case of war or political turmoil, the consequences will be unimaginable. Therefore, we should fully tap the development potential of China’s new energy and firmly hold the lifeline in our own hands.
In addition, the unimaginable ecological and environmental problems caused by the massive exploitation and use of coal and oil, such as destruction of land and plant resources, groundwater resource pollution, and the greenhouse effect emergence, must be given attention. For example, at least 50 km2 of sea surface was polluted by crude oil in the Dalian oil pipeline explosion on July 16, 2011. Energy use can benefit humanity, but its negative consequences are also directed to humanity. Studies have found that if coal is completely replaced by alternative energy, then human health in China can be improved, avoiding 17,137 to 24,220 premature deaths and reducing energy power generation costs (Scott et al., 2021). The energy crisis may also be caused by soaring prices, market shortages, and poor market circulation. The best way to deal with the energy crisis is to develop new energy sources and establish a new energy production and supply system.
During the 13th Five-Year Plan period, China has withdrawn 810 million tons of backward coal production capacity by eliminating and shutting down more than 30 million kW of backward coal power units. In 2019, the installed capacity of renewable energy power generation exceeded 700 million kW, and the installed capacity of nuclear power under construction and operation will reach 58 million kW. On December 21, 2020, the State Council issued China’s Energy Development in the New Era. This report emphasized the importance of intensifying the energy reform and accelerating clean and low-carbon energy transformation in the 14th Five-Year Plan to ensure that nonfossil energy will account for 20% of primary energy consumption by 2030. As a vital force of energy transformation, new energy has been given close attention and corresponding policy guidance by the state.
Given the sharp increase of China’s energy consumption demand, nonrenewable chemical energy depletion, and ecological environment deterioration, we use empirical research methods based on the research on the current situation and development trend of new energy to explore the factors affecting new energy development from the existing data. We also analyze the influence mode and influence of these factors on new energy development. The present study provides a theoretical basis for the sustainable development of national new energy consumption and suggestions and references for national policy formulation. This study also effectively ensures new energy development, realizes the overtaking of energy corners, breaks the dependence on imports, completes the transformation of China’s energy system, and establishes the strategic advantage of the energy structure of the whole country.
In the past, new energy research usually focused on the total output or consumption (Pao et al., 2014; Ren et al., 2015; Qiu et al., 2017) rather than the energy structure. The total output and consumption of new energy definitely increase with the development of the economy and technology, whereas the change in energy structure can reflect the substitution efficiency of new energy for traditional energy. The research on the influencing factors of new energy development is often limited to qualitative analysis and theoretical research on the influencing factors of new energy development in the past (Zhao et al., 2014; Zhang et al., 2019). A few quantitative analyses only examine the influence degree of individual factors on new energy development (Zou and Wang, 2019; Li and Xu, 2020). Therefore, this article is based on the actual new energy development from 1990 to 2020 combined with multiple indicators. The changes in energy structure are also considered. Moreover, autoregressive distributed lag (ARDL) bounds cointegration test, vector error correction models (VECMs), and Granger causality tests are used. Furthermore, this study quantitatively analyzes the long-run and short-run impacts of these indicators on China’s new energy development and provides policy recommendations based on research results.
The remainder of this paper is arranged as follows. Literature Review reviews the previous studies on the development of new energy. Research Design introduces the selected indicators and the methodology used in this study. Empirical Results carries on the empirical analysis, and Discussion of Results analyzes the empirical results to discuss the impacts of the related factors on the development of new energy. Finally, basic conclusions are summarized, and policy recommendations are presented in Conclusion and Policy Recommendations.
Literature Review
Related Influencing Factors Research Review
Researchers have sought to identify the factors that impact new energy development. The influencing factors mainly focus on energy price, carbon emissions, economic level, industrial structure, and power generation capacity.
Energy Price
Mi et al. (2020) concluded that the pricing mechanism in China increases the gap of financial subsidies and fails to realize the reasonable optimal allocation of resources. Xiao and Ye (2016) compared and analyzed the substitution effect and income effect of the three mechanisms of renewable energy price. They argued that establishing a renewable energy price mechanism based on energy tax promotes renewable energy development. On the basis of E-G cointegration analysis and Granger causality test, Han (2011) studied the relationship between the proportion of new energy consumption and the relative index of energy price in China. They determined that energy price change is the main factor determining the development trend of new energy in China. We determined from the relevant literature and interview records that new energy development in China is in the primary stage, and the most critical problem in its development is policy guidance. As one of the national regulatory tools for new energy development, energy price plays a key role.
Carbon Emissions
Most of the existing literature studies the impact of new energy use on carbon emissions and economic growth (Yan, 2014; Sharif et al., 2019; Weerasinghe et al., 2020). Few studies also focus on antidriving mechanism and the effect of carbon emissions and economic aggregate on the use and development of new energy in China. Fang et al. (2020) discussed the impact of carbon trade on new energy with regard to the antidriving mechanism of carbon emission. The results showed that a mature carbon trading market can promote new energy development, whereas carbon trading and new energy are very sensitive to government control. Wang (2020) established a vector autoregressive model and determined that a long-term and stable equilibrium relationship exists among green energy use, carbon emissions, and economic growth in China. In addition, green energy use in China was primarily affected by the increase in carbon emissions and economic growth. Ren et al. (2015) conducted an empirical study on the total new energy production, carbon emissions, economic-level hydropower, nuclear power, and wind power in China from 1985 to 2013. They found that carbon emissions and new energy development are mutually Granger causes, and GDP is a one-way Granger cause for new energy development. Therefore, carbon emission, which has a counter-driving mechanism for new energy development, is one of the factors influencing the development of new energy.
Economic Growth
Pao et al. (2014) used panel integration test and Granger causality study and determined that a two-way long-term causality exists between renewable/nuclear energy consumption and economic growth. In particular, economic or income growth increases renewable/nuclear energy demand in the long run. Fan and Hao (2020) investigated the relationship between renewable energy consumption and gross domestic product in 31 Chinese provinces from 2000 to 2015. The empirical results indicated that a modest slowdown in gross domestic product growth can generate a considerable boost in renewable energy demand in China in the long run. Li and Xu (2020) used Granger causality test on the data of China’s renewable energy consumption and economic growth from 1978 to 2017. They found that real GDP is the Granger cause of renewable energy consumption in the short term, but it cannot promote the growth of renewable energy consumption in the long term.
Therefore, we conclude from the above research that economic growth tilts abundant resources stimulating the development of the new energy industry. However, some researchers hold a negative opinion that carbon emissions and economic growth cannot promote new energy development. For example, Qiu et al. (2017) used autoregressive distributed lagged model to study China’s per capita renewable energy consumption, per capita energy carbon emissions, and per capita GDP from 1980 to 2012. They determined that the growth of energy carbon emissions and per capita GDP does not necessarily lead to increased renewable energy consumption. Consequently, it is necessary to explore further whether economic growth can affect new energy development.
Industrial Structure
Ma et al. (2018) found through international comparison and CGE model research that a high per capita GDP and an optimized industrial structure are necessary for energy transition. They also determined that China has the industrial structure foundation of energy transformation. Zou and Wang (2019) constructed a spatial Durbin model to explore the mechanism of industrial structure on energy consumption structure in 30 provinces of China. The research showed that industrial structure upgrading can promote the substitution effect of new energy. Accordingly, industrial structure adjustment has a considerable impact on new energy replacing traditional energy.
Power Generation Capacity
Pan et al. (2019) analyzed the existing problems of new energy development in China. They concluded the main factors affecting the large-scale development and utilization of new energy in China: security and stability of the power generation system and the imperfect power market mechanism. Lu et al. (2015) discussed the optimal development path of wind power generation in China. They found that the grid absorptive ability is the most crucial factor constraining wind power development in the initial stage, whereas carbon emission permit price is the critical factor affecting the wind power development in the subsequent stages. Xu et al. (2020) determined that GDP growth rate has a limited impact on the development of solar photovoltaic power generation. However, grid absorption capacity and carbon emission permit price are critical factors affecting the development path in the later period. The above literature analysis indicated that new energy power generation capacity is a key factor in new energy development.
Gaps and Deficiencies in the Existing Literature
The following research gaps are determined based on the review of the existing research on the influencing factors of new energy development. First, most of the existing studies analyze the influence and mechanism of a single variable on new energy development but fail to consider the internal influence and combined effect of various factors. Second, prior research focuses on the total consumption or power generation of all kinds of renewable energy and green energy, whereas the research on the proportion of new energy consumption in the total energy consumption is overlooked. The rapid development of industrialization increases the demand and consumption of traditional energy and new energy. The energy consumption structure can effectively reflect the development process of new energy use. Therefore, this study discusses the relationship between multiple influencing factors and a proportion of new energy consumption in the energy consumption structure.
In addition, prior researchers on the influencing factors of new energy development have widely used econometric models and methods, including binary models (Han, 2011; Fan and Hao, 2020; Li and Xu, 2020), multivariate models (Lu et al., 2015; Ren et al., 2015; Qiu et al., 2017; Wang, 2020; Xu et al., 2020), time series analysis methods (Han, 2011; Lu et al., 2015; Ren et al., 2015; Qiu et al., 2017; Li and Xu, 2020; Wang, 2020; Xu et al., 2020), and panel data analysis methods (Pao et al., 2014; Zou and Wang, 2019; Fan and Hao, 2020). Among them, cointegration test method (MacDonald, 1998; Zhong and Lei, 2008) is mainly used to study whether a long-term stable relationship exists among economic nonstationary variables. VECM is used for a short-term correction and adjustment of the long-term stable relationship among multivariable (Lütkepohl, 2005). Granger causality test is used to measure the interaction between time series (Kirchgssner and Wolters, 2007). We also found that most researchers often use E-G and Johansen cointegration tests to study the relationship between factors in China’s energy field research. However, China’s economic phenomenon has a common problem of short sample data time span. E-G and Johansen methods tend to be biased when the sample size is small, resulting in unreliable analysis results.
Therefore, this study aims to overcome the insufficiency of the current research literature using China’s new energy related annual time series data from 1990 to 2019 based on the existing research. Moreover, ARDL marginal cointegration test and Granger causality test method are used. The empirical research on the growth of new energy consumption and energy prices, carbon emissions, and other factors in China is also performed. The differences between the present study and other studies are reflected in the following aspects: First, the research methods are different. Different from the qualitative analysis of previous literature studies, the present study adopts ARDL marginal cointegration test developed by Pesaran et al. (2001) and Granger causality test (Toda and Yamamoto, 1995) by Clive W. J. Granger developed to analyze quantitatively the impact of energy prices, carbon emissions, economic growth, energy structure, and new energy power generation capacity on the growth of new energy consumption in China. Second, the research objects are different. Unlike the previous literature, which focused on the total consumption or total power generation of new energy, the present study considers the change of energy structure and the comprehensive effect of various factors and takes the proportion of new energy consumption in the total energy consumption as the research object. The present study also investigates the long-run and short-run effects of various influencing factors on new energy development in China. In addition, this article is not the same as the previous studies in terms of research time span and data frequency.
Research Design
Variable Selection and Data Description
The proportion of new energy consumption is increasing each year. The world energy structure has experienced a significant change. This study uses the energy consumption structure to investigate the regularity of China’s new energy development by reflecting the development process of new energy. In addition, the proportion of China’s new energy consumption in the total energy consumption (Y, data source: BP p.l.c. (2020)) is taken as the dependent variable.
The new energy studied in this work is relative to traditional energy, such as firewood, coal, and oil. New energy consumption refers to the sum of all kinds of new energy consumed by various industries of the national economy and households in a certain period and region, including water energy, wind energy, solar energy, geothermal energy, biomass energy, and other renewable energy and nuclear energy consumption.
New energy development is affected by national environmental policies, technological development, and other factors. However, performing quantitative measurement is impossible or difficult because direct data regarding these factors are not published in China. Therefore, indirect factors are chosen to reflect these influencing factors in this study. We consider that energy consumption is directly or indirectly affected by energy prices, carbon emissions, industrial structure, economic growth, energy output, and other factors; thus, we select the following factors:
1) Energy Price (EP). Energy is an important input factor in economic output. Changes in its price undoubtedly affect all walks of life. Energy price includes the price of coal, coke, oil, electricity, and other energy products. Energy price policy can promote production, encourage savings, and make the most efficient and reasonable energy use. The nation has not clearly announced the prices of various energy products, and the prices of various energy products fluctuate. Thus, this study follows the practice of using the internal energy price relative index (Jie and He, 2014) as a proxy, which can characterize transformation law in energy prices.
“Fuel and power purchase price index” is a statistical index reflecting the trend and degree of price changes paid by industrial enterprises when they purchase fuel and power products from the material trading market and energy production enterprises as production inputs (He et al., 2016; Du, 2019).“Retail prices index,” which represents the full extent of the products and services available for consumers to buy, is used to track prices of the component items, reflecting the purchasing power of residents and the balance between supply and demand in the market (Ralph et al., 2020).
The rate of the two reflects the relative price changes at the economic level, the price that consumers are willing to pay for the energy in retail goods, and the general equilibrium attribute of energy prices. “Fuel and power purchase price index” and “retail prices index” come from the China Statistical Yearbook 2019, and they are compared with each other on a year-on-year basis, with the 1989 price index as the base period index.
2) Carbon Emissions (CE). At present, the global warming and environmental pollution caused by excessive emissions of greenhouse gases (e.g., carbon dioxide) have become one of the serious problems faced by humanity (Akhmat et al., 2014; Dilmore and Zhang, 2018; Zhang et al., 2020) and one of the important driving factors for the rise of new energy industry (Ren et al., 2015; Fang et al., 2020; Wang, 2020). Carbon emission data are measured by carbon dioxide emission data in China. The statistics of carbon dioxide emissions are mainly from the statistical results of the Chinese government, World Bank, International Energy Agency (IEA), BP Group, and other institutions. However, the statistical results are quite different because of the differences in the statistical and calculation methods. The Chinese government has not published official carbon emissions, and the World Bank lacks data after 2017. Fortunately, the data from the IEA and BP are relatively close. Therefore, this study uses the carbon emissions data released by the IEA.
3) Industrial Structure (IS). Among the tertiary industry structures in China, the secondary industry, which mainly produces the required industrial products through a large number of materials and a large amount of energy input, derives the largest energy demand and consumption (Xu, 2015). The adjustment and upgrading of China’s industrial structure are in the rapid development stage, which drives the change in energy supply and energy consumption structure (Zou and Wang, 2019). The rapid development of the secondary industry, including mining, manufacturing, electric power, and construction, poses a large demand for energy, including new energy. In this study, the proportion of the added value of the secondary industry in GDP is used to measure the industrial structure.
4) Economic Growth (GDP). Economic growth is reflected in terms of China’s per capita GDP (Cao and Huan, 2020). The relationship between energy consumption and economic growth is complex, having synchronous growth and asynchronous growth. The so-called synchronous growth relationship means that the economy grows faster as more energy is consumed (Song and Zhang, 2017). Asynchronous growth relationship means that the growth trend of energy consumption and the trend of economic growth show opposite trends. In recent years, rapid economic growth has presented high requirements for energy demand, mining, and processing. Under the premise of economic growth, the problems in developing and utilizing the gradually depleting nonrenewable energy also present high requirements for the adjustment of energy consumption structure.
5) New Energy Generation Capacity (GC). Energy users do not choose new energy “Lin Boqiang: New energy development cannot only look at the number of installed capacity” China Power News Network, 2014) if it is not presented with a long-term and stable electricity supply, no matter how low the cost of new energy is, and no matter how competitive its price is compared with coal power generation. The power generation of new energy is affected by the installed capacity of new energy power generation and the conversion efficiency of power generation (Pan et al., 2019). In recent years, China’s technological progress in new energy development can be reflected in the rapid growth of installed capacity of new energy power generation and the improvement of power generation conversion efficiency, both of which jointly determine the power generation capacity of new energy. Therefore, the index of new energy power generation can reflect the progress of new energy technology. The long-term and stable power supply of new energy can promote the high-quality development of new energy.
Among them, energy price data, industrial structure, and economic growth are all from the 2020 China Statistical Yearbook. Over the years, the data about new energy consumption and generating capacity are from BP, whereas those about carbon emission are from IEA. The data are selected from 1990 to 2019. Table 1 summarizes these data. LNY, LNEP, LNCE, LNIS, LNGDP, and LNGC are obtained using natural logarithm processing on all variables to eliminate all heteroscedasticity and other problems, as shown in Figure 2.
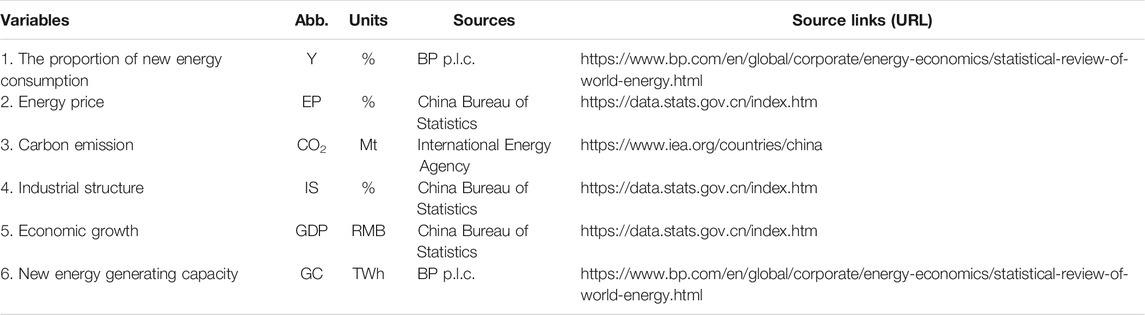
TABLE 1. Data description and sources.
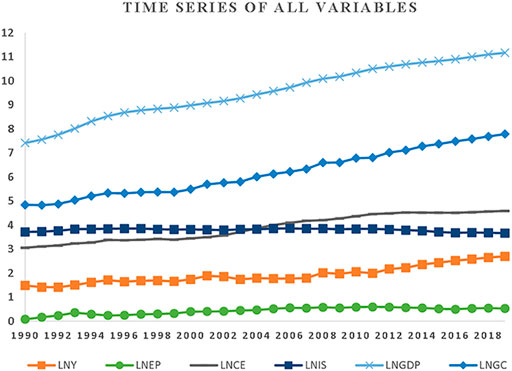
FIGURE 2. Time series plot for all variables.
The general formal equation is as follows:
Research Methods
Unit Root Test
When cointegration analysis is performed on time series data, checking whether the analyzed time series data are stable is necessary to prevent the “pseudo regression” problem (MacDonald, 1998). Two standard unit root test methods, augmented Dickey-Fuller (ADF) (Dickey and Fuller, 1979; Dickey and Fuller, 1981) and Phillips-Perron (PP) (Phillips and Perron, 1986; Phillips, 1987), are used to test the stationarity of the data. These unit root tests may reject or accept the original unit root existence hypothesis when LNY, LNEP, and other time series samples have structural mutations, leading to errors in the test results. Hence, we use the minimum negative value of the unit root statistic of zero hypothesis proposed by Zivot and Andrews (1992) as the criterion to select the structural mutation point and determine all the variables that meet the stability requirements of ARDL boundary test.
ADRL Bounds Cointegration Test
The linear combination of a nonstationary time series group may have a stable long-term equilibrium relationship. Cointegration test method is one of the most important tools to analyze the quantitative relationship among nonstationary variables (Zhong and Lei, 2008). In this study, ARDL cointegration test method for multiple explanatory variables is used to determine whether a stable long-term equilibrium relationship exists among the variables.
The performance of ARDL cointegration model when estimating parameters for a small sample is more robust than that of the traditional EG and Johansen cointegration test (Haug, 2002). ARDL cointegration model also allows variable data to be integrated into the order I (1) or I (0) or a mixture of both. Moreover, ARDL, which does not need to consider the endogeneity of explanatory variables, obtains a dynamic ECM through a simple linear transformation to estimate the short-term effects among variables.
Granger Causality Test
Granger causality is most likely to exist when cointegration vectors are established between sequences. Granger causality test method solves whether X causes Y depending on the extent to which the present Y can be explained by the past X (Kirchgässner and Wolters, 2007). “Y is caused by X Granger” or “X is the Granger cause of Y” can be supported if X is helpful in the prediction of Y, or if the correlation coefficient between X and Y is statistically significant.
Empirical Results
Stationarity Test of Variables
Unit Root Tests
The empirical analysis data are time series data. Thus, checking whether these data are stable is necessary to avoid the occurrence of “pseudo regression” and to estimate the long-run relationship among variables. The tests applied are ADF and PP unit root test, and the results are reported in Table 2.
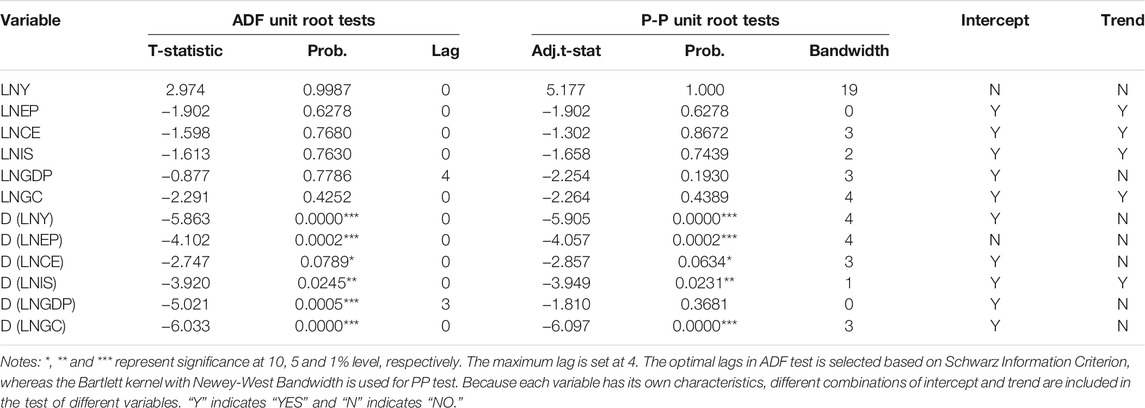
TABLE 2. Conventional unit root tests.
The test statistics show that the ADF and PP test statistics are less than the critical value at a significant level of 10%, and the null hypothesis that the original sequence has unit root cannot be rejected, indicating that the variables are not stationary in level. However, the first-order difference sequences of all the original data sequences are stationarity. Hence, all the variables are I (1), and they can be used for the subsequent cointegration analysis.
Breakpoint Unit Root Tests
Given the large-scale abrupt incidents, such as financial and oil crises, the time series data may contain a stable trend of structural breakpoints. The traditional unit root tests (e.g., ADF and PP) tend to ignore structural breakpoints, thereby likely leading to misjudgment of the stability test results. Therefore, the breakpoint unit root test is subsequently performed. Table 3 shows that the null hypothesis of the unit root for most variables cannot be rejected when they are in level form. However, the null can be rejected for all variables when these variables are specified in the first difference.
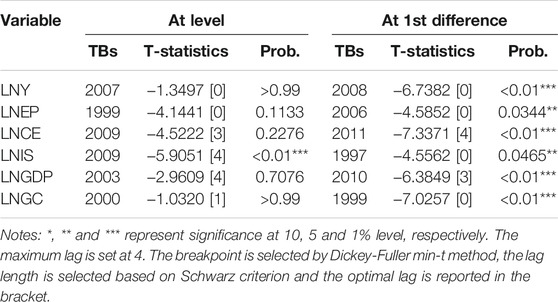
TABLE 3. Breakpoint unit root test.
Bounds Cointegration Test of Variables
Determine Cointegration Relationship
According to the analysis in Stationarity Test of Variables, the original sequence is not stable, but its first-order difference sequence is stationary. Therefore, the combination may have a stable long-term equilibrium relationship. The existence of a cointegration relationship is determined by constructing an ARDL model and bounds test. The chosen model for the case of the lag period judgment under the AIC criterion, restricted constant and no trend is ARDL (2, 2, 2, 0, 2, 2). The bounds test results are presented in Table 4.
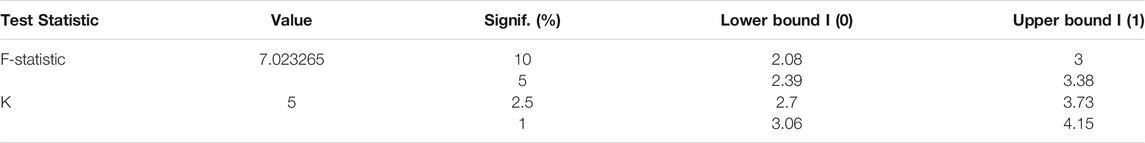
TABLE 4. Bounds test results.
The F-statistic for the bounds test is 7.023265, which is greater than the respective 99% upper bound. The ARDL bounds test results show that a long-run cointegration exists among LNY, LNEP, LNCE, LNIS, LNGDP, and LNGC.
Long-Run and Short-Run Estimate
After the existence of the cointegration relationship is determined, the next step is to reveal the long-run equilibrium relationship among the variables using the ARDL (2, 2, 2, 0, 2, 2) model. Tables 5, 6 report the results for the ARDL long-run and short-run estimates, respectively.
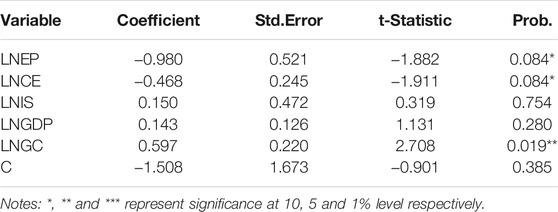
TABLE 5. ARDL (2, 2, 2, 0, 2, 2) long-run estimates.
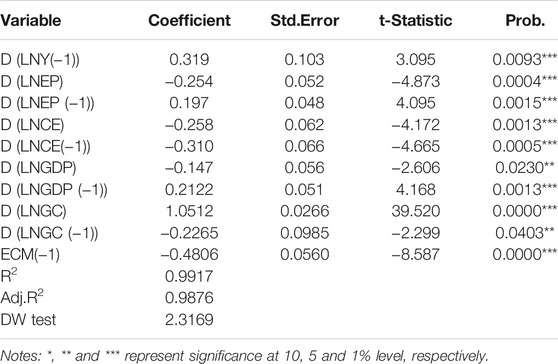
TABLE 6. ARDL-ECM short-run estimates.
In short-run estimates, the ECM expression is as follows:
Diagnostic and Stability Test
Table 6 shows that the ARDL model fits well, as proved by the R2 value. The adjusted R2 value is 0.9917 and 0.9876. The value of the Durbin-Watson test statistic is 2.32, indicating that no spurious regression exists in the model.
Diagnostic tests confirm that neither autocorrelation nor heteroscedasticity phenomena are problematic and that the model does not suffer from nonnormality (Table 7). CUSUM test is used to test and verify model structure stability (Figure 3). The test results indicate that the sum of residual errors is stable at the critical level of 5%. Thus, the regression equation has good statistical properties, and the estimated results are reliable.
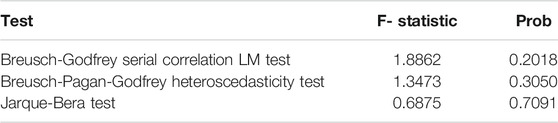
TABLE 7. Diagnostic tests results.
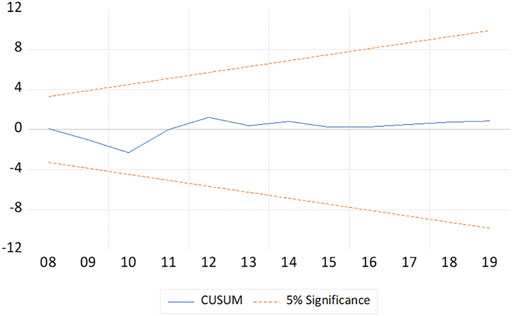
FIGURE 3. Plot of the cumulative sum of recursive residuals.
Granger Causality Test of Variables
The cointegration test results prove that a long-run stable equilibrium relationship exists between new energy development and the five influencing factors. However, these test results cannot explain the regression relationship among variables. Whether this long-run stable equilibrium relationship constitutes a causal relationship requires further verification. Granger causality test method is adopted in this study.
The results of Granger causality test are shown in Table 8. In a lag period of 7, energy price, carbon emissions, economic growth, and new energy generation capacity are the Granger causes of new energy consumption at the significance level of 10%, indicating that the impact of these factors on the development of new energy changes is lagging. When the lag period is 1, carbon emissions, economic growth, and new energy generation capacity are the Granger causes of new energy consumption.
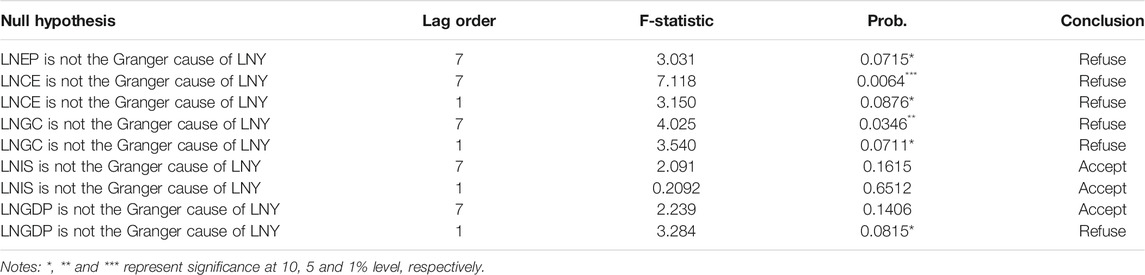
TABLE 8. Granger causality test results.
According to the test results, the change in the industrial structure is not the Granger cause for new energy development when it lags one to nine periods, indicating that industrial structure change has no impact on the development of new energy and cannot predict the trend of new energy development.
Discussion of Results
We first implemented the traditional unit root test (i.e., ADF and PP) and ZA unit root test with one break. On the basis of these tests, we concluded that nearly all variable time series types are I (1) at a significant level of 5%.
We then tested cointegration among energy price, carbon emission, GDP, industrial structure, new energy power generation capacity, and the proportion of new energy consumption. We identify the existence of the cointegration relationship and estimate the long-run equilibrium and short-run relationship among the variables using ARDL specification (2, 2, 2, 0, 2, 2). We find that industrial structure, economic growth, and new energy generation capacity have a positive impact on new energy development, whereas energy price and carbon emission have a negative impact on new energy development in the long run. A 1% increase in the proportion of new energy consumption is linked with a 0.980% decrease in energy price in the long run, implying that an increase in traditional energy price leads to the increasing use of new energy. Increasing energy prices may inspire people to switch to new energy sources, and this view is seconded by Li and Leung (2021). If a 1% decrease occurs in carbon emissions, then the proportion of new energy consumption increases by 0.468% in the analyzed period. Hence, the pressure of rising carbon emissions has considerably promoted the greening of energy use in the country. This finding is consistent with the results of Wang (2020)’s research. The state can call on enterprises to use new energy and improve the rules on carbon emission market to reduce carbon emissions. Enterprises can also develop and use new energy for energy saving, emission reduction, and social benefits. The proportion of new energy consumption increases by 0.642% when new energy generation capacity increases by 1%. This finding indicates that the increase in new energy generation capacity at this stage has a promoting effect on new energy development. It also reflects that adequate supply of new energy in China can stimulate its consumption. At present, the country can focus on the development of new energy installed capacity and improve the conversion efficiency of power generation.
Industrial structure and economic growth increase the proportion of new energy consumption, holding other factors constant. However, the impacts are not significant, which can be explained by the following reasons: 1) Given that the economic and industrialization level in China is ahead of energy consumption, its economic development and industrialization process has broken through the constraints of new energy sources, such as solar, wind, and nuclear energy. New energy efficiency is high, that is, a high level of industrialization is obtained with minimal energy. 2) At present, the use of new energy in China is still challenged by high costs and difficulties in large-scale applications. Thus, the economic input to new energy development technology and investment publicity has yet to be increased. China still has a long way to change its energy consumption structure and improve its energy quality. 3) The energy consumption of China’s secondary industry remains dominated by traditional energy sources, such as coal, oil, and natural gas. China is a large energy producer country. The supply of traditional energy sources is relatively sufficient. Therefore, a change in the secondary industry in the industrial structure has no impact on new energy development. 4) China has the industrial structure foundation of energy transformation (Ma et al., 2018). Simply optimizing the industrial structure does not necessarily promote new energy development.
In the short-run estimate, the coefficient of ECM (−1) is negative and significant, verifying the cointegration relationship among variables. ARDL-ECM short-run estimates show that the short-run deviation of the new energy consumption proportion is corrected by 48.06% annually (Table 6). The growth of new energy consumption returns to the original equilibrium within 2 years and 1 month in China. We particularly notice that GDP, which is not significant in the long-run estimate, appears in the short-run estimate results, and the results are significant, indicating that economic growth can promote the growth of new energy consumption. However, this positive effect is gradually formed, and the effect cannot happen quickly. Once a new momentum is formed, economic growth may drive long-run sustained growth.
Finally, we perform Granger causality test. At the significance level of 10%, energy price, carbon emissions, economic growth, and new energy generation capacity are Granger causes of the proportion of new energy consumption in different lag orders. Table 8 shows that (lag period = 7), energy price, carbon emissions, and new energy generation capacity are the Granger causes of new energy consumption in the long run, indicating that the impact of these factors on the development of new energy changes is lagging. This finding is consistent with the long-run cointegration test results in Long-Run and Short-Run Estimate. In the short-run (lag period = 1), carbon emissions, economic growth, and new energy generation capacity influence new energy development and play a short-run forecasting role to a certain extent. This finding is consistent with the short-run estimate results in Long-Run and Short-Run Estimate. According to the test, the change in the industrial structure is not the Granger cause for new energy development when it lags one to nine periods. This analysis is also consistent with the previous long-run and short-run cointegration analysis results in Long-Run and Short-Run Estimate.
Conclusion and Policy Recommendations
The study investigates the long-run and causal relationship among the proportion of new energy consumption, energy prices, carbon emissions, industrial structure, economic growth, and new energy power generation from 1990 to 2019 in China. ARDL bounds test results confirm the dynamic relationship among variables in the presence of a structural fracture. The research results show that, in the long run, new energy generation has a positive and significant impact on new energy consumption. Moreover, energy prices and carbon emissions have a negative and significant impact on new energy consumption, and the impact of industrial structure optimization and economic growth on new energy consumption is positive but not significant. However, economic growth in the short run can promote the growth of new energy consumption, but this positive effect is gradually formed and is unlikely to happen soon.
We also reveal a one-way causal relationship among energy prices, carbon emissions, economic growth, new energy power generation capacity, and new energy consumption. They have a short- or long-run impact on new energy development and play a certain predictive role. However, simply optimizing the industrial structure may not predict the development trend of new energy.
Therefore, the following suggestions are proposed according to the above conclusions to promote the development of new energy:
1) Improving the new energy price mechanism and the subsidy policy for new energy power generation
The current price of new energy power generation in China is dominated by the government, which adopts two pricing methods: benchmark price and concession bidding price. These pricing methods set new energy prices based on conventional energy and electricity prices as the benchmark. They are not sensitive to market response and cannot be adjusted accordingly with the decline of new energy development and transmission costs, thereby affecting the long-term interests of all stakeholders. Therefore, the new energy price mechanism must be improved, and the price relationship between new energy products and traditional energy must be fixed.
The fossil energy taxation policy and the new energy power generation subsidy policy must be improved. The tax on fossil energy increases fossil energy cost, and its price will continue to rise relative to the price of new energy. For economic benefits, energy users choose new energy instead of seriously polluted fossil energy. Subsidies for new energy power generation will reduce the development and operation costs of power generation enterprises, thereby reducing the actual price level of new energy, expanding the purchasing power of energy users for new energy, increasing the demand for new energy use, and promoting the substitution of new energy for traditional energy.
2) Maintaining stable economic growth and standardizing the trading order of carbon emission market
China’s industrial structure is constantly optimizing and upgrading, and the per capita GDP is constantly improving, thereby providing a good economic foundation for new energy development. Global warming and other environmental pollution problems caused by the increase in carbon emissions have aroused great attention in the country. The government should continue to maintain stable economic growth, attach importance to carbon dioxide emissions, standardize the trading order of carbon emission market, and accelerate the establishment of a carbon emission trading mechanism to realize the sustainable development of China’s economy and society. These strategies can effectively promote the transformation of power generation industry to a clean and low-carbon direction, restrict high-energy consumption enterprises to use clean energy, reduce coal consumption, and promote energy conservation emission reduction.
Formulating the corresponding new energy industry supporting policies can help increase the factory volume of new energy products, promote the use of new energy products, and reduce the consumption of traditional fossil energy. In addition, the government should invest a lot of funds and talents to build a development platform in the field of new energy technology, focus on overcoming core technical problems, such as the development, utilization, transmission, and storage of new energy, strengthen the construction of energy transportation facilities, and ultimately realize the “low-carbon economy.”
3) Improving the new energy industry policy and optimizing the energy consumption structure
Unlike the world’s primary energy structure, China’s energy consumption structure is dominated by coal and oil, which exceeds three-quarters of the total. According to the Bulletin of the General Administration of Customs, the imports of raw coal, crude oil, and natural gas have maintained a rapid growth throughout 2019. Among them, 300 million tons of raw coal, 510 million tons of crude oil, and 96.56 million tons of natural gas were imported, with a year-on-year growth of 6.3, 9.5, and 6.9%, respectively.
The government should optimize the energy consumption structure of China, change the status quo of overreliance on coal and oil, increase the development and use of solar energy, wind energy, nuclear power, and other new energy sources, and make great efforts to promote the large-scale development of new energy sources, such as photovoltaic and wind power. Moreover, the government should promote the advancement of new energy technology and industrial upgrading, continue to improve the new energy industry policy, actively promote the consumption of new energy, and promote the coordination of planning policies and innovation of system and mechanism. Furthermore, the government should meet people’s energy demand as much as possible, reduce energy imports, ensure safe production of new energy development and adequate supply to achieve stable energy supply and demand, and create favorable opportunities for the high-quality development of new energy.
4) Strengthening the supervision of the grid-connected operation of new energy power generation, ensuring the safety and stability of new energy transmission
The cumulative installed capacity of wind power, photovoltaic power generation, hydropower, and bio-intelligent power generation in China ranks the first in the world. According to the 2019 statistics of China Photovoltaic Industry Association (2020), China’s newly added photovoltaic grid-connected installed capacity reached 30.1 GW, and the cumulative photovoltaic grid-connected installed capacity reached 204.3 GW with a year-on-year growth of 17.3%. The newly added and cumulative photovoltaic installed capacity remains to rank first in the world. China’s photovoltaic power generation reached 224.36 billion kWh with a year-on-year increase of 26.3%, accounting for 3.1% of China’s total annual power generation with a year-on-year increase of 0.5%. According to the data released by the National Energy Administration of China (2020), the scale of national wind power installed capacity continued to expand in 2019, with the total installed capacity exceeding 220 million kW, ranking the first in the world. Wind power generation reached 405.7 billion kWh, exceeding 400 billion kWh for the first time, accounting for 5.5% of the total power generation.
Given China’s economic growth and the surge in energy demand, the installed capacity of new energy generation will continue to grow. Therefore, the government should effectively strengthen the supervision and management of new energy power generation and grid connection, grasp the construction and quality supervision of new energy power generation projects and transmission lines, improve grid construction technology and grid absorption capacity to ensure the safe and orderly access of new energy projects, as well as the safety and stability of new energy transmission, and realize the high-quality development of new energy.
Data Availability Statement
The original contributions presented in the study are included in the article/Supplementary Material, further inquiries can be directed to the corresponding author.
Author Contributions
FX: Propose research ideas and methods XF: Data collection and collation, empirical analysis and paper writing JL: Writing and verifying papers.
Funding
This work was supported by the general project of Philosophy and Social Science Planning of Tianjin, China “Research on the Construction Method of Domain Emotional Dictionary Based on E-commerce User Comment Text” (No.TJGL19-009).
Conflict of Interest
The authors declare that the research was conducted in the absence of any commercial or financial relationships that could be construed as a potential conflict of interest.
Publisher’s Note
All claims expressed in this article are solely those of the authors and do not necessarily represent those of their affiliated organizations, or those of the publisher, the editors and the reviewers. Any product that may be evaluated in this article, or claim that may be made by its manufacturer, is not guaranteed or endorsed by the publisher.
References
Akhmat, G., Zaman, K., Shukui, T., Sajjad, F., Khan, M. A., and Khan, M. Z. (2014). The Challenges of Reducing Greenhouse Gas Emissions and Air Pollution through Energy Sources: Evidence from a Panel of Developed Countries. Environ. Sci. Pollut. Res. 21 (12), 7425–7435. doi:10.1007/s11356-014-2693-2
BP p.l.c. (2020). Data From: BP Statistical Review of World Energy - All Data,1965-2019. Available at: https://www.bp.com/en/global/corporate/energy-economics/statistical-review-of-world-energy.html (Accessed December 1, 2020).
Cao, J., and Huan, M. (2020). “Study on the Mechanism of Energy Structure Optimization to Low-Carbon Economy,” in Proceedings of the Sixth International Forum on Decision Sciences. Editors X. Li, and X. Xu (Singapore: Springer Singapore), 229–242. doi:10.1007/978-981-13-8229-1_20
China Photovoltaic Industry Association (2020). Data From: Grid Connected Operation of Photovoltaic Power Generation in 2019 Data Statistics. Available at: http://www.chinapv.org.cn/data_statistics/836.html (Accessed December 21, 2020).
China Power News Network (2014). Lin Boqiang:New Energy Development Cannot Only Look at the Number of Installed Capacity. Available at: https://www.china5e.com/news/news-870091-1.html (Accessed May 16, 2014).
da Luz Sant'Ana, I., Román-Román, P., and Torres-Ruiz, F. (2018). The Hubbert Diffusion Process: Estimation via Simulated Annealing and Variable Neighborhood Search Procedures-Application to Forecasting Peak Oil Production. Appl. Stoch. Models Bus Ind. 34 (3), 376–394. doi:10.1002/asmb.2306
Dickey, D. A., and Fuller, W. A. (1979). Distribution of the Estimators for Autoregressive Time Series with a Unit Root. J. Am. Stat. Assoc. 74 (366), 427–431. doi:10.2307/2286348
Dickey, D. A., and Fuller, W. A. (1981). Likelihood Ratio Statistics for Autoregressive Time Series with a Unit Root. Econometrica 49 (4), 1057–1072. doi:10.2307/1912517
Dilmore, R., and Zhang, L. (2018). “Greenhouse Gases and Their Role in Climate Change,” in Greenhouse Gases and Clay Minerals. Editor V. Romanov (Cham: Springer), 15–32. doi:10.1007/978-3-319-12661-6_2
Du, S. (2019). Research on the Influence of Energy Price Change on Energy Consumption Intensity Analysis Based on Direct and Regulatory Effects. Price:Theory Pract. (07), 61–64. doi:10.19851/j.cnki.cn11-1010/f.2019.07.014
Ellabban, O., Abu-Rub, H., and Blaabjerg, F. (2014). Renewable Energy Resources: Current Status, Future Prospects and Their Enabling Technology. Renew. Sustain. Energ. Rev. 39, 748–764. doi:10.1016/j.rser.2014.07.113
Fan, W., and Hao, Y. (2020). An Empirical Research on the Relationship Amongst Renewable Energy Consumption, Economic Growth and Foreign Direct Investment in China. Renew. Energ. 146, 598–609. doi:10.1016/j.renene.2019.06.170
Fang, G., Lu, L., Tian, L., he, Y., and Yin, H. (2020). Research on the Influence Mechanism of Carbon Trading on New Energy-A Case Study of ESER System for China. Physica A: Stat. Mech. its Appl. 545, 123572. doi:10.1016/j.physa.2019.123572
Ghosh, T. K., and Prelas, M. A. (2009). “Hubbert Peak Theory,” in Energy Resources and Systems: Volume 1: Fundamentals and Non-renewable Resources (Dordrecht: Springer Netherlands), 649–676. doi:10.1007/978-90-481-2383-4_10
Han, C. (2011). Factors on New Energy Development Based on Cases Studies from Co-integration and granger Test. Resour. Ind. 13 (01), 32–36. doi:10.13776/j.cnki.resourcesindustries.2011.01.022
Haug, A. A. (2002). Testing Linear Restrictions on Cointegrating Vectors: Sizes and Powers of Wald and Likelihood Ratio Tests in Finite Samples. Econom. Theor. 18 (2), 505–524. doi:10.1017/S0266466602182119
He, L., Ding, Z., Yin, F., and Wu, M. (2016). The Impact of Relative Energy Prices on Industrial Energy Consumption in China: a Consideration of Inflation Costs. Springerplus 5 (1), 1001. doi:10.1186/s40064-016-2661-z
Husaini, D. H. (2014). Does Electricity Drive the Development of Manufacturing Sector in Malaysia? Front. Energ. Res. 3, 18. doi:10.3389/fenrg.2015.00018
Jie, S., and He, L. (2014). The Moderating Effect of Internal Energy Price RelativeIndices to Energy Consumption Based on Technical Efficiency Change. Resour. Sci. 36 (03), 520–529.
Kirchgässner, G., and Wolters, J. (2007). “Granger Causality,” in Introduction to Modern Time Series Analysis (Berlin, Heidelberg: Springer), 93–123. doi:10.1007/978-3-540-73291-4_3
Li, R., and Leung, G. C. K. (2021). The Relationship between Energy Prices, Economic Growth and Renewable Energy Consumption: Evidence from Europe. Energ. Rep. 7, 1712–1719. doi:10.1016/j.egyr.2021.03.030
Li, P., and Xu, W. (2020). Empirical Analysis on the Relationship between Renewable EnergyConsumption and Economic Growth in China. Energ. Conser. Techn. 38 (04), 365–370.
Liu, W., Fan, W., Hong, Y., and Chen, C. (2021). A Study on the Comprehensive Evaluation and Analysis of China's Renewable Energy Development and Regional Energy Development. Front. Energ. Res. 9, 635570. doi:10.3389/fenrg.2021.635570
Lu, Z.-Y., Li, W.-H., Xie, B.-C., and Shang, L.-F. (2015). Study on China's Wind Power Development Path-Based on the Target for 2030. Renew. Sustain. Energ. Rev. 51, 197–208. doi:10.1016/j.rser.2015.06.024
Lütkepohl, H. (2005). “Specification of VECMs,” in New Introduction to Multiple Time Series Analysis (Berlin, Heidelberg: Springer), 325–352. doi:10.1007/978-3-540-27752-1_8
Ma, L., Shi, D., and Fei, Q. (2018). Low-carbon Transformation of China’s Energy in 2015—2050:renewable Energy Development and Feasible Path. China Popul. Res. Environ. 28 (02), 8–18. doi:10.12062/cpre.20170916
MacDonald, G. A. (1998). Critical Values for Unit Root and Cointegration Test Statistics - the Use of Response Surface Equations. Appl. Econ. Lett. 5 (12), 741–744. doi:10.1080/135048598353916
Mi, N., Liu, D., Qiao, N., Wang, L., Li, Q., Zhang, C., et al. (2020). Situation Analysis on the Price Formation Mechanism of New Energy in China. IOP Conf. Ser. Earth Environ. Sci. 603, 012006. doi:10.1088/1755-1315/603/1/012006
National Energy Administration of China (2020). Data From: Grid Connected Operation of Wind Power in 2019. Available at: http://www.nea.gov.cn/2020-02/28/c_138827910.htm (Accessed December 21, 2020).
Pan, X., Huang, Y., Tang, J., and Yang, L. (2019). Influencing Factors and Prospects for Development of Renewable Energy Power Generation. Smart Power 47 (11), 41–47.
Pao, H.-T., Li, Y.-Y., and Hsin-Chia Fu, F. (2014). Clean Energy, Non-clean Energy, and Economic Growth in the MIST Countries. Energy Policy 67, 932–942. doi:10.1016/j.enpol.2013.12.039
Pesaran, M. H., Shin, Y., and Smith, R. J. (2001). Bounds Testing Approaches to the Analysis of Level Relationships. J. Appl. Econ. 16 (3), 289–326. doi:10.1002/jae.616
Phillips, P. C. B., and Perron, P. (1988). Testing for a Unit Root in Time Series Regression. Biometrika 75 (2), 335–346. doi:10.1093/biomet/75.2.335
Phillips, P. C. B. (1987). Time Series Regression with a Unit Root. Econometrica 55 (2), 277–301. doi:10.2307/1913237
Qiu, Q., Li, S., and Xia, Q. (2017). Renewable Energy Consumption-Energy-Related CO2 Emission Nexus for China. Ecol. Economy 33 (02), 19–23.
Radcliffe, J. C. (2018). The Water Energy Nexus in Australia - The Outcome of Two Crises. Water Energy Nexus 1 (1), 66–85. doi:10.1016/j.wen.2018.07.003
Ralph, J., O'Neill, R., and Smith, P. A. (2020). The Retail Prices Index. Cham: Palgrave Pivot. doi:10.1007/978-3-030-46563-6
Randall, S. J. (2014). State Behavior in Energy Crises. Int. Stud. Rev. 16 (2), 331–332. doi:10.1111/misr.12120
Ren, X. H., Wang, Z., and Zhang, Y. M. (2015). An Empirical Research Based on China's Carbon Emissions,Clean Energy and Economic Growth. China Popul. Resour. Environ. 25 (S2), 6–9.
Ren, Y. (2014). An Empirical Research on Relationship between Economic Growth and New Energy Consumption in China. Adv. Mater. Res. 1073-1076, 2583–2586. doi:10.4028/www.scientific.net/AMR.1073-1076.2583
Saqib, A., Chan, T.-H., Mikhaylov, A., and Lean, H. H. (2021). Are the Responses of Sectoral Energy Imports Asymmetric to Exchange Rate Volatilities in Pakistan? Evidence from Recent Foreign Exchange Regime. Front. Energ. Res. 9, 215. doi:10.3389/fenrg.2021.614463
Scott, M., Sander, R., Nemet, G., and Patz, J. (2021). Improving Human Health in China Through Alternative Energy. Front. Public Health 9, 613517. doi:10.3389/fpubh.2021.613517
Sharif, A., Raza, S. A., Ozturk, I., and Afshan, S. (2019). The Dynamic Relationship of Renewable and Nonrenewable Energy Consumption with Carbon Emission: A Global Study with the Application of Heterogeneous Panel Estimations. Renew. Energ. 133, 685–691. doi:10.1016/j.renene.2018.10.052
Song, Y., and Zhang, M. (2017). Using a New Decoupling Indicator (ZM Decoupling Indicator) to Study the Relationship between the Economic Growth and Energy Consumption in China. Nat. Hazards 88 (2), 1013–1022. doi:10.1007/s11069-017-2903-6
Song, L., Kir, K. F., Shu, P., Shu, P., Wu, J., and Weng, C. H. (2020). Relationships Among Energy Consumption, Air Pollution and Economic Growth in China. E3s Web Conf. 194, 04003. doi:10.1051/e3sconf/202019404003
Toda, H. Y., and Yamamoto, T. (1995). Statistical Inference in Vector Autoregressions with Possibly Integrated Processes. J. Econom. 66 (1), 225–250. doi:10.1016/0304-4076(94)01616-8
Wang, S. (2020). Research on the Relationship between China's Energy UseGreenization,Carbon Dioxide Emissions and Economic Growth. Soft Sci. 34 (10), 7–11+24. doi:10.13956/j.ss.1001-8409.2020.10.02
Xiao, W., and Ye, J. (2016). A Comparison between the Price Mechanisms of Renewable Energy and Policy Choice. J. Jiangxi Univ. Finance Econ. (01), 21–27. doi:10.13676/j.cnki.cn36-1224/f.2016.01.003
Xu, M., Xie, P., and Xie, B.-C. (2020). Study of China's Optimal Solar Photovoltaic Power Development Path to 2050. Resour. Pol. 65, 101541. doi:10.1016/j.resourpol.2019.101541
Xu, L. (2015). Low Carbon Optimization of Industrial Structure Based on Economy-Energy-Environment System Coordination. Adv. Intell. Syst. Comput. 362, 1345–1355. doi:10.1007/978-3-662-47241-5_113
Yaodong, S., and Gillespie, A. (2020). “Special Report 4: China's Energy System Revolution,” in China's Energy Revolution in the Context of the Global Energy Transition (Cham: Springer), 393–590. doi:10.1007/978-3-030-40154-2_5
Zhang, Y., Liu, J., Zhang, J., and Wang, C. (2019). Study on the Development of Renewable Energy during "Post-Subsidy Period" in China. Electric Power 52 (04), 1–7. doi:10.11930/j.issn.1004-9649.201811125
Zhang, Z., Ma, X., Lian, X., Guo, Y., Song, Y., Chang, B., et al. (2020). Research on the Relationship between China's Greenhouse Gas Emissions and Industrial Structure and Economic Growth from the Perspective of Energy Consumption. Environ. Sci. Pollut. Res. 27 (33), 41839–41855. doi:10.1007/s11356-020-10091-w
Zhao, E. C., Wang, Y. L., and Yan, B. T. (2014). A Review of the Research of New Energy Industry Development. Adv. Mater. Res. 1008-1009, 1409–1414. doi:10.4028/www.scientific.net/AMR.1008-1009.1409
Zhaoyuan, X., and Ishwaran, M. (2020). “Overview: High-Quality Energy for High-Quality Growth: China's Energy Revolution in the New Era,” in China's Energy Revolution in the Context of the Global Energy Transition (Cham: Springer), 1–39. doi:10.1007/978-3-030-40154-2_1
Zhong, Z., and Lei, Q. (2008). Some Notes on Johansen and Juselius Cointegration Test. Stat. Inf. Forum 10, 80–85+90.
Zivot, E., and Andrews, D. W. K. (1992). Further Evidence on the Great Crash, the Oil-Price Shock, and the Unit-Root Hypothesis. J. Business Econ. Stat. 10 (1), 251–954. doi:10.2307/1391541
Keywords: new energy development, cointegration test, granger causality, policy recommendations, ARDL
Citation: Xue F, Feng X and Liu J (2021) Influencing Factors of New Energy Development in China: Based on ARDL Cointegration and Granger Causality Analysis. Front. Energy Res. 9:718565. doi: 10.3389/fenrg.2021.718565
Received: 01 June 2021; Accepted: 09 August 2021;
Published: 19 August 2021.
Edited by:
Hooi Hooi Lean, Universiti Sains Malaysia (USM), MalaysiaReviewed by:
Festus Victor Bekun, Gelişim Üniversitesi, TurkeyJung Wan Lee, Anhui University of Finance and Economics, China
Copyright © 2021 Xue, Feng and Liu. This is an open-access article distributed under the terms of the Creative Commons Attribution License (CC BY). The use, distribution or reproduction in other forums is permitted, provided the original author(s) and the copyright owner(s) are credited and that the original publication in this journal is cited, in accordance with accepted academic practice. No use, distribution or reproduction is permitted which does not comply with these terms.
*Correspondence: Fuliang Xue, ZnVsaWFuZ3h1ZUAxNjMuY29t