 Ye Cai1
 Ying Liu
 Xiafei Tang
- 1School of Electrical and Information Engineering, Changsha University of Science and Technology, Changsha, China
- 2State Grid Hunan Electric Power Company Limited Economic and Technical Research Institute, Changsha, China
The limited regulation capacity of the power grid, coupled with the imperfect market mechanism, has squeezed the space for renewable energy consumption in China. This article proposes a renewable energy consumption mechanism through the monthly interprovincial transaction market, to balance the revenue of each market participant and improve the consumption of renewable energy. A new player named “interprovincial traders” is introduced to serve as the middleman for the renewable generation, users, and the power grid company. The main function of “interprovincial traders” is to coordinate and match the user load with the output of renewable energy. In such a market mechanism, the social factors, influenced by the revenue of each trading cycle, are considered in the user responding model from the perspective of consumer psychology. Finally, a two-phase optimization model is proposed to promote renewable energy consumption coordination with the monthly interprovincial market. The optimization model is simulated in a provincial power grid example. The results show that the model can effectively increase the consumption of renewable energy as well as improve the profit of power grid companies and users.
Introduction
Serious environmental problems affect sustainable development in China (Yang et al., 2010). To reduce their impact on the society, vigorous development of renewable energy sources, such as wind power and photovoltaic (PV), is one of the ambitious goals in China. At present, renewable energy installed capacity in China ranks the first in the world (Li J. et al., 2019). However, a series of difficulties, such as irrational energy structure, the mismatched spatial distribution of supply and demand, limited flexible regulation of power grids, and imperfect market mechanisms, have severely restricted the elevation of the renewable energy consumption ratio.
Several scholars make efforts to improve the renewable energy consumption through better generating forecast, joint scheduling, and electricity market. Improving the accuracy of generating estimation is important for dispatching and optimization in the short-time scale. Several methods are proposed and implied in renewable energy forecast through machine learning algorithm (Quan et al., 2014; Razavi et al., 2020) and the big data-driven method (Zhou et al., 2017). In terms of joint scheduling, it is mainly to use energy storage equipment to track and synchronize renewable energy generation Shim et al. (2018) and Latifi et al. (2019) to alleviate the abandonment problem caused by the volatility of renewable energy. It is also an effective approach to improve renewable energy consumption through the electricity market transaction in the long-time scale. By providing ancillary services Melo et al. (2018) or making renewable portfolio standards Kroposki et al. (2013), users and the power grid company can be incentivized to participate in demand response to increase the consumption of renewable energy. However, these methods do not consider the impact of social factors on demand response in the long-time scales.
Power grid operation in China is security-oriented; thus, some different ideas for resolving the conflict between security and cleanliness are proposed through the demand response Xu et al. (2020) and interprovincial transactions (Wen et al., 2020). Under the organization of the national development and reform commission, the pilot construction work of demand response has been implemented in Jiangsu, Shanghai, and Beijing in China (Li B. et al., 2019). But it is difficult to take effect, for users who are not price-sensitive. The power grid company needs to start from interprovincial medium and long-term transactions, to achieve the purpose of renewable energy consumption.
In this article, a framework of increasing the renewable energy consumption through the interprovincial transactions is proposed. The transaction process involves day-ahead scheduling, intraday execution, and transaction settlement. A new player of “Interprovincial Traders” has been proposed as a middleman to coordinate and match the user load with the output of renewable energy. Social factors, such as the sensitivity to policy publicity and interactions among group behavior, are considered in the long-time scale, which are used to describe the impact of the phased revenue in the monthly interprovincial transaction process on user demand responsiveness. A two-phase optimization model is proposed to optimize the revenues of each market participant and to maximize the consumption of renewable energy.
The remainder of the article is organized as follows. The framework of interprovincial transactions is proposed in Renewable Energy Consumption Mechanism in the Interprovincial Transaction. User Demand Response Model Considering Social Factors introduces the user demand response model considering social factors. In Medium- and Long-Term Source–Load Interactive Optimization Model to Promote Renewable Energy Consumption, a two-phase optimization model is introduced in detail. Case studies are performed in Case Studies, where the results are discussed thereafter. Finally, the conclusions are presented in Conclusion.
Renewable Energy Consumption Mechanism in the Interprovincial Transaction
Interprovincial Transaction Mechanism with Interprovincial Traders
The interprovincial transaction market is one of the main electricity markets in the Chinese market. China has built the world’s largest and most complex ultrahigh-voltage AC/DC power grid Li et al. (2018), which provides the possibility for the implementation of interprovincial transactions. The main function of interprovincial transactions is as follows.
Interprovincial transactions mainly use the surplus transmission capacity of trans-provincial tie-line to organize power trading, transmitting surplus power from renewable energy-rich areas to the areas on the demand side, and realizing the cross-regional consumption of renewable energy. It mainly adopts the daily clearing and the monthly settlement trading method.
Considering that most users cannot directly participate in electricity market transactions, the interprovincial traders (IPTs) play the role of the middleman for interprovincial transactions. As it is in the early stage of interprovincial transaction market construction, the power grid company participates in interprovincial transactions as IPTs (Guo et al., 2019). The framework of the interprovincial transaction mechanism is shown in Figure 1.
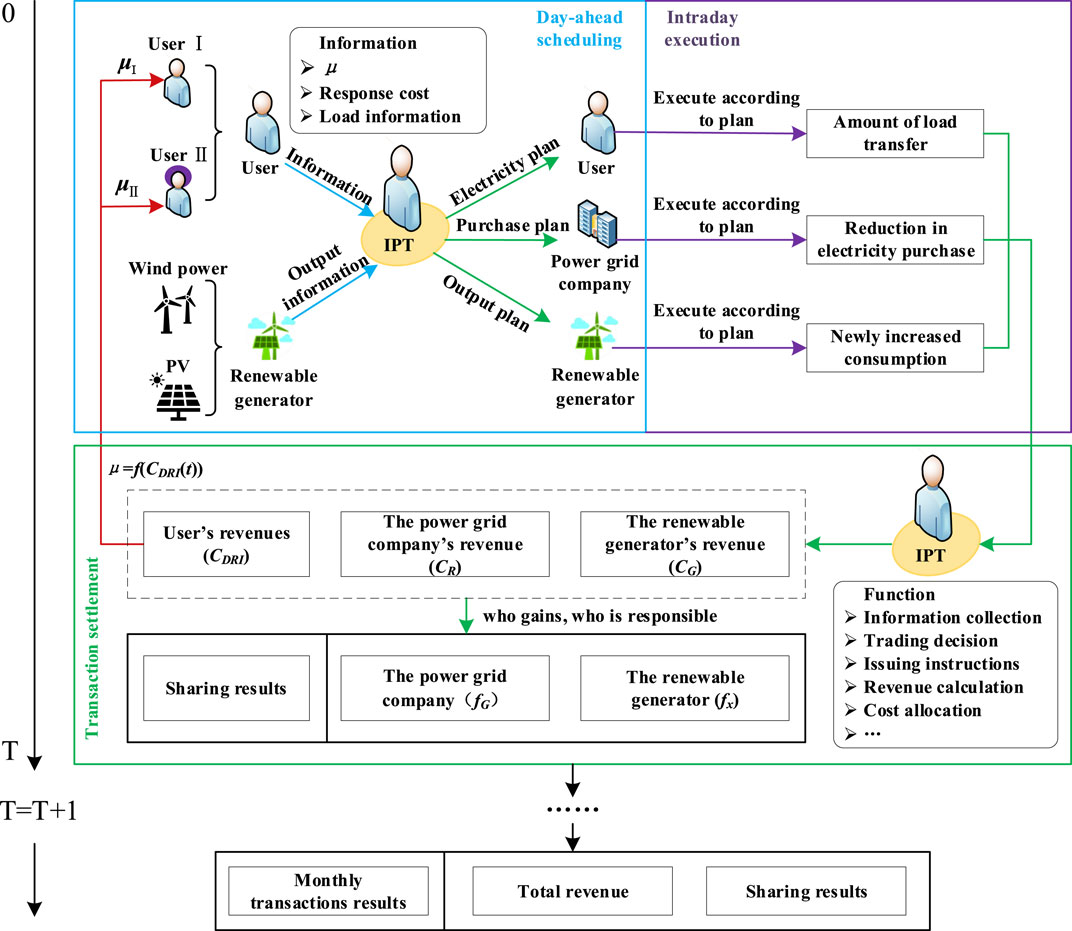
FIGURE 1. Transaction mechanism diagram.
In Figure 1, the transaction mechanism is divided into two phases, short-time scales and long-term scales.
The short-time scale consists of three components: day-ahead scheduling, intraday execution, and transaction settlement. First, in the day-ahead scheduling, users report relevant information to IPTs, including load information, demand responsiveness, and demand response costs. Renewable generators report output information to IPTs. Based on the above information, IPTs determine the scheduling plan of each market participant on the next day and send the plan to them. Then, in the intraday execution, each market participant executes the corresponding day-ahead scheduling plan and reports the day execution to IPTs. Finally, in the transaction settlement, IPTs conduct trade settlements, including revenue calculations and cost allocations, based on the executions reported by each market player.
The long-term scale is mainly to carry out monthly continuous interprovincial transactions, based on daily settlement results. In the process of transaction, it is necessary to report the periodic revenue results to users, to further motivate users to participate in demand response and improve user demand responsiveness. Transactions are at last cleared at the end of the month.
Day-Ahead Scheduling
In the day-ahead scheduling, the information interaction among users, IPTs, and power company is shown in Figure 1. In Figure 1, the users need to report individual information of peak shaving power to IPTs, according to their electricity plan, including corresponding compensation cost, which reflects the loss caused by changing their electricity habits to participate in demand response.
Renewable generators forecast renewable energy output information for the next day based on historical weather data and report the output information to IPTs.
IPTs provide the service for users and renewable generators. They also collect the forecasted renewable energy output and load information. Based on the information provided by users and renewable generators, IPTs calculate the matching degree between user load and renewable energy output, and determine whether to activate users to participate in demand response according to the matching degree. From the relevant information, IPTs determine the out-purchased electricity information, the day-ahead scheduling plan, and report the day-ahead scheduling plan to the market participants.
Intraday Execution
During the intraday execution phase, users are required to consume electricity according to the scheduling plan, likewise renewable generators to generate power and power grid companies to purchase electricity. Errors between the forecasted and actual output of renewable energy can be adjusted by the thermal power units.
Transaction Settlement
At the end of the intraday execution, IPTs calculate the revenue of each market participants on that day, and settle the transactions according to the following mechanism.
After the user participates in the demand response, renewable generators receive renewable energy power generation revenue due to the increasing on-grid electricity. The power grid company can reduce power purchase expenditures due to the reduction of out-purchased electricity. The revenue of each market participants is as follows:
1) Revenues from user participation in demand response through load shifting
where
2) Revenues of increased on-grid electricity from renewable generators
where
3) The revenue of power grid company by reducing power purchase expenditures
where
A transaction settlement method is designed based on the fairness criterion of “who gains, who is responsible” (Zhang and Zhou, 2018). The power grid company and renewable generators have profited after users participated in the demand response. Therefore, both sides have to share the compensation costs of the users. The sharing ratio is determined according to the proportion of the reduction in out-purchased power and the increase in renewable energy consumption. The specific calculation formula is as follows:
where
Finally, the daily settlement results are accumulated to generate the monthly transaction results.
User Demand Response Model Considering Social Factors
Effects of Consumer Psychology on Demand Response
User electricity demand is influenced not only by the price of electricity but also by social factors. Changes in electricity prices can cause users to shift their electricity demand from peak period to valley period, thus increasing the consumption of renewable energy in the valley period. Due to individual difference to the incentives of users, social factors such as the sensitivity to policy publicity and interactions among group behavior, all of them, will also affect user electricity consumption behavior, so as to affect the consumption of renewable energy.
Based on consumer psychology (Rogers, 1995; Haws et al., 2017), this article establishes a response model to express the influence of social factors on the user’s behavior.
In the early stages of monthly interprovincial transactions, because of low publicity and ignorance of new policy by users, there were two ways of participating in demand response. One is not to participate in demand response. The other is to participate in demand response but with little willingness to participate. Then, as the publicity increased, when those nonresponsive users in the early stage observed the considerable economic benefits of those participating in the demand response, the demand responsiveness of both ways increased. Until the end, most of users participated in the demand response. The demand responsiveness can be approximated as a piecewise-linear function, as shown in Figure 2.
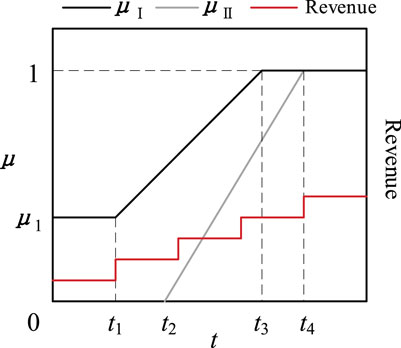
FIGURE 2. Piecewise linear function of demand responsiveness.
In Figure 2, the x-axis represents time, the left side of the y-axis is the demand responsiveness, and the right side of the y-axis is the user’s revenues.
The demand responsiveness of the above two ways can be described as follows:
where
The demand response model considers both the social and economic factors.
At time t, based on Eq. 11 and Eq. 12, the electricity consumption under user participation response can be designed as follows:
where
A Medium- and Long-Term Source–Load Interactive Optimization Model to Promote the Renewable Energy Consumption
Model Framework
The medium- and long-term source–load interactive optimization model framework to promote the renewable energy consumption includes two stages: short-time scale and monthly interprovincial transactions.
On a short-time scale with the day as the trading cycle, the user demand response model is used to reflect the user demand response-ability under the consideration of social environmental factors. Since most of the wind and PV power is abandoned during the flat and valley periods, users are guided to shift their load from peak periods to valley periods by implementing peak-cutting and valley-filling subsidies. Under such circumstances, the user load demand and wind/PV generation curves are close to each other, as well as the possible consumption of renewable energy.
Based on the short-time scale clearing results, monthly interprovincial transactions on the medium- and long-term scale are carried out. A monthly interprovincial transaction optimization model that promotes the consumption of renewable energy is established. The model takes the interests of the power grid company and renewable generators jointly as the objective function. Then, after the transaction is cleared, the user subsidy cost is reasonably allocated according to the settlement rules designed in Transaction Settlement.
Objective Function
Based on the safe and stable operation of the grid, the business goal of the power grid company and renewable generators is to maximize their economic benefits. Therefore, considering the economics of the power grid company and the capacity of renewable energy consumption, to promote the consumption of renewable energy and maximize the benefit of the power grid company, the objective function of this article is given as follows:
where Q is the total revenue. The time period T = 31 in this article.
Constraints
1) Output constraints of thermal power units
where
2) Uncertainty constraints of wind power and PV output:
Errors affected by natural conditions and other unknown external factors occur between the results of the existing forecast methods and the actual output. When wind power and PV are connected to the grid on a large scale, the forecast errors cannot be ignored. In this article, the output uncertainty using the method is expressed as follows: (Yi et al., 2018)
where
3) Wind power and PV output limit constraints are denoted as follows:
4) Operating time constraints of thermal power units are obtained as follows:
where
5) Ramp rate constraints of thermal power units are obtained as follows:
where
6) Power balance constraints are obtained as follows:
where
7) Out-purchased electricity power constraints are obtained as follows:
where
The model in this article is a mixed-integer nonlinear programming problem, which can be optimally solved by using an improved particle swarm optimization algorithm (Lee et al., 2016). The particle repair strategy (Lee et al., 2016) is used to repair the particle encoding matrix that does not meet the constraints until the conditions are fulfilled. Meanwhile, a penalty function is added in the iterative solution process, and a larger threshold is set for particles that do not meet the constraints, to make the search jump out of the infeasible region.
Case Studies
Simulation Model of Renewable Energy Consumption Mechanism Considering the Monthly Interprovincial Transaction
In this section, monthly interprovincial transactions are carried out with data from the Hunan Province power grid in China, of which the structure is shown in Figure 3. In this case, due to the presence of renewable energy abandonment at the beginning of the month, only the user demand response scenario of way I is considered. The peak-valley time-of-use (TOU) price and time period data are shown in table 1.
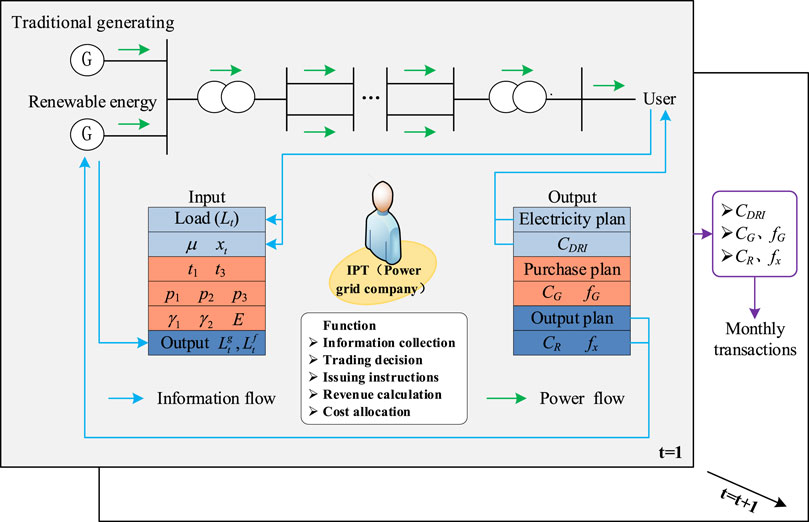
FIGURE 3. Structure of monthly interprovincial transactions.
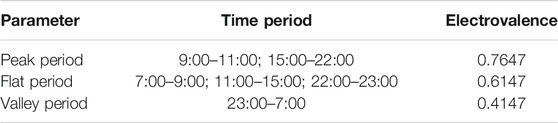
TABLE 1. Peak-valley TOU price and time period.
Analysis of Monthly Trading Results
Revenue of all Participators in the Monthly Interprovincial Transaction Market
The revenue results for each market participant are shown in Figure 4. From day 0 to day 10, as the initial stage of the monthly transaction, the user’s willingness to participate in the demand response is not high when the revenue is less. The revenue of power grid company remains at around 4.5 million RMB during this period. Due to the volatility of the renewable energy output, the revenue of the renewable generators shows a fluctuating state, especially on day 2 and day 8, when the renewable energy output increases sharply. The revenue of the renewable generators then increases, leading to a decrease in the power purchased by the power grid company, and a slight decrease is observed in the revenue of the power grid company compared to the other time of the period.
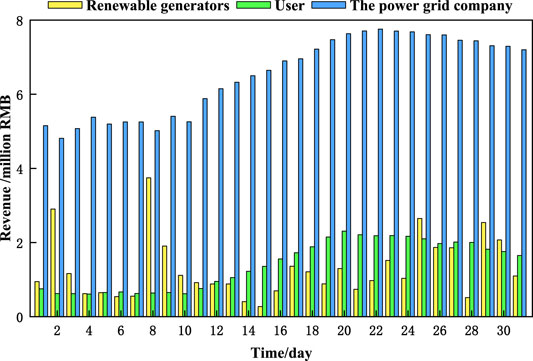
FIGURE 4. Revenue results for each market participant.
From day 10 to day 20, as users gain revenue, the demand responsiveness increases. With the rise of the amount of load shifted by users, user revenue gradually increases, showing a ladder growth trend. Then the power grid company revenue continues to increase along with the reduction of out-purchased electricity demand.
From day 20 to day 30, the user demand response capacity reaches saturation. Compared with the previous 10 days, the total load of each day during this period has been reduced. Therefore, the user revenue is reduced. The grid company revenue also drops correspondingly.
Analysis of Monthly Trading Results
Table 2 shows the changes of renewable energy consumption and out-purchased electricity, and the sharing results of each beneficiary body after monthly interprovincial transaction. By guiding users to participate in demand response, the monthly consumption of renewable energy increases from 597,625.5 to 680,910.7 MW h, which is an increase of 13.9%. Monthly out-purchased electricity decreases from 3621429.1 to 2910808.1 MW h, which is a decrease of 19.6%. In this month, users need to be compensated with 43.47 million RMB. According to the settlement mechanism, renewable generators need to share 4.58 million RMB. The power grid company needs to share 38.89 million RMB. From the above analysis, the optimization model proposed in this article can not only effectively enhance the consumption of renewable energy but also effectively optimize the demand for out-purchased electricity and realize the optimal allocation of resources in different provinces.
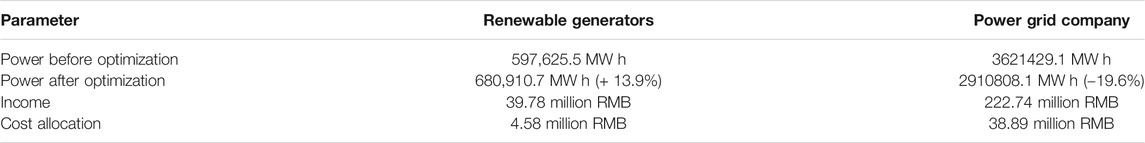
TABLE 2. Allocation results of user compensation costs for each beneficiary body.
Analysis of Typical Day Results
To further discuss the rationality and validity of the model, a typical day of the month is used as an example for specific analysis. The results of the analysis are as follows:
1) Unit scheduling results
By implementing price subsidies, the dispatch results of each unit are shown in Figure 5 after users are guided to participate in the demand response. The total output situation of each unit is consistent with the change in load demand, in which the output of thermal power units is the largest, accounting for 40–55% of the user load demand. The output of hydropower units is relatively stable. At the same time, the load in the flat-valley period increases with the decrease of the load in the peak period after users participated in demand response. The system load peak-valley difference decreases by 4.6%.
2) Renewable energy consumption results
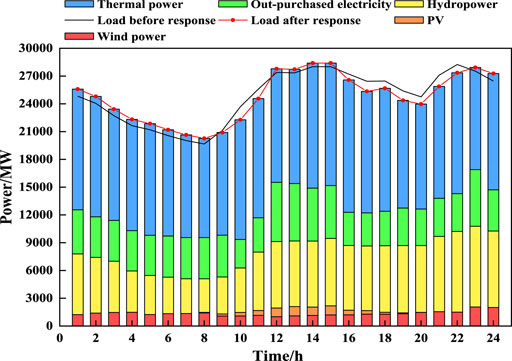
FIGURE 5. Output diagram of various units after optimization.
Figure 6 shows the consumption and output of wind power and PV before optimization. Wind power is abandoned the most in the early morning. The cumulative abandoned wind power is 3,668.73 MW h throughout the day, accounting for 11.37% of the total wind power output. The PV is abandoned the most at noon. The accumulative abandoned PV is 1,191.68 MW h throughout the day, accounting for 20.02% of the total PV output. Combined with Figure 5, it can be seen by guiding users that to participate in the demand response, their load demand has to be shift and electricity consumption during the flat-valley period has to be increased, and the wind power consumption rises by 4.5% and PV consumption by 9.1%. The problem of wind and PV abandonment is effectively alleviated.
3) Situation of out-purchased electricity
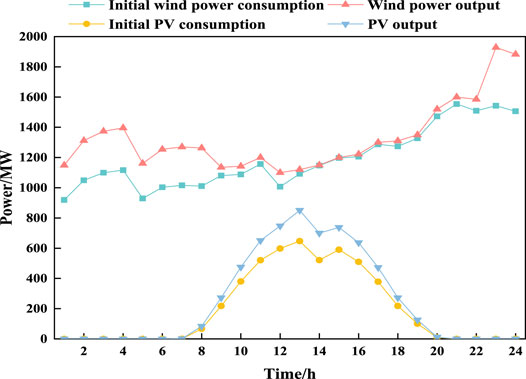
FIGURE 6. Renewable energy output.
According to the actual operation mode, a three-step segmented operation mode is used for interprovincial power transmission. Figure 7 shows the transmission power curve of the trans-provincial tie-line before and after optimization. Compared with the power transmission curve before optimization, the optimized out-purchased power is significantly reduced from 9:00 to 24:00. Since the peak periods are at this period, by guiding users to participate in the demand response and shifting a load of peak periods to the valley periods, the electricity demand of users is significantly reduced at this time. Therefore, the demand of inner-provincial out-purchased power drops accordingly.
4) Allocation situation of user compensation cost
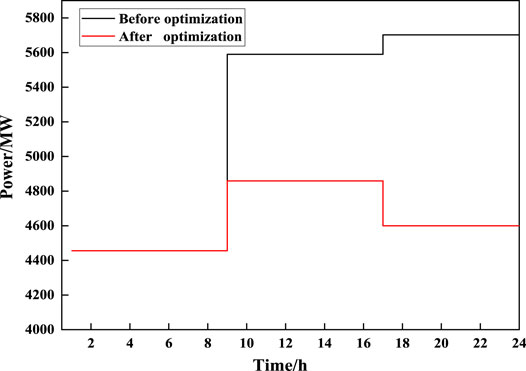
FIGURE 7. Transmission power curve of the trans-provincial tie-line.
The allocation results for each beneficiary body are shown in table 3. The typical daily renewable energy consumption increases by 1988.38 MW h, and it is calculated that the renewable generator new income is 945,300 RMB. Meanwhile, the out-purchased electricity decreases by 15,316.19 MW h; after calculating, the cost of the power grid company for out-purchased electricity decreases by 4,800,900 RMB. According to the cost-sharing rules, renewable generators need to share 86,200 RMB, while the reduction of out-purchased power is more reduced, and the benefits are greater. Therefore, the power grid company needs to share 663,900 RMB, which bears about 88.5% of user compensation costs. By reasonably sharing user compensation costs, while incentivizing the power grid companies to rationally use demand-side resources to reduce out-purchased electricity, it also provides an effective market settlement method for further consumption of renewable energy.
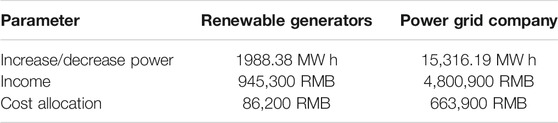
TABLE 3. Allocation results of user compensation costs for each beneficiary body.
Conclusion
With the increasing penetration of renewable energy, the problem of renewable energy consumption is standing out, especially in China, in which operational reliability is a priority. From the perspective of existing Chinese interprovincial transactions, this article proposes a medium- and long-term transaction mechanism that promotes the consumption of renewable energy and realizes the interaction among renewable generators, users, and power grids by setting a new player. The main contributions are as follows:
1) Through the implementation of price subsidies, innerprovincial users are guided to change their electricity consumption habits. Therefore, the closeness between user load demand and wind power/PV power output curves is maximized. The renewable energy consumption increases by 13.9%. Purchased power decreases by 27.9%. Common profit of grid companies, renewable generators, and users are realized.
2) According to the fairness principle of “who gains, who is responsible,” the user compensation cost is reasonably shared among the beneficiaries. The fact provides an effective market settlement model for further promoting the consumption of renewable energy.
3) Interprovincial transaction can not only increase the consumption of inner-provincial renewable energy but also realize the optimal allocation of resources in different provinces.
In this article, the impact of user participation in interprovincial transactions on the consumption of renewable energy is studied. In the future, considering the different sensitivity of different industries to electricity prices, the renewable energy consumption measures under interprovincial transactions involving different types of users can be studied.
Data Availability Statement
The original contributions presented in the study are included in the article/Supplementary Material; further inquiries can be directed to the corresponding author.
Author Contributions
YeC and YL conceptualized the study. YeC and YL performed the analysis. XT and YT acquired resources. YeC, XT, and YiC acquired funding. YL wrote the original draft. YeC, XT, and YT reviewed and edited the manuscript. All authors agreed to be accountable for the content ofthe work.
Funding
This work is supported by the Joint Funds of the National Natural Science Foundation of China (No. U1966207), the Hunan Natural Science Foundation (No. 2020JJ5573), and the National Natural Science Foundation of China (No. 51807010).
Conflict of Interest
Author YT was employed by the State Grid Hunan Electric Power Company Limited Economic and Technical Research Institute.
The remaining authors declare that the research was conducted in the absence of any commercial or financial relationships that could be construed as a potential conflict of interest.
Acknowledgments
The authors gratefully acknowledge the support of the Joint Funds of the National Natural Science Foundation of China (No. U1966207), the Hunan Natural Science Foundation (No. 2020JJ5573), and the National Natural Science Foundation of China (No. 51807010).
References
Gao, Y., Lv, M., Liang, H., and Zhang, J. (2014). Power Demand Price Elasticity Matrix Based on Discrete Attraction Model. Automation Electric Power Syst. 38 (13), 103–107+144. doi:10.7500/AEPS20131015003
Guo, L., Ding, Y., Bao, M., and Zeng, D. (2019). An Optimal Power Purchase Model of Inter-provincial Traders in Two-Level Electricity Market Considering Risk Management, Power Syst. Tech. 43, 2726–2734. doi:10.13335/j.1000-3673.pst.2019.0668
Haws, K. L., Mcferran, B., and Redden, J. P. (2017). The Satiating Effect of Pricing: The Influence of price on Enjoyment over Time. J. Consumer Psychol. 27, 341–346. doi:10.1016/j.jcps.2017.03.001
Kirschen, D. S., Strbac, G., Cumperayot, P., and de Paiva Mendes, D. (2000). Factoring the Elasticity of Demand in Electricity Prices. IEEE Trans. Power Syst. 15 (2), 612–617. doi:10.1109/59.867149
Kroposki, B., Sen, P. K., and Malmedal, K. (2013). Selection of Distribution Feeders for Implementing Distributed Generation and Renewable Energy Applications. IEEE Trans. Ind. Applicat. 49 (6), 2825–2834. doi:10.1109/TIA.2013.2262091
Latifi, M., Khalili, A., Rastegarnia, A., and Sanei, S. (2019). A Bayesian Real-Time Electric Vehicle Charging Strategy for Mitigating Renewable Energy Fluctuations. IEEE Trans. Ind. Inf. 15 (5), 2555–2568. doi:10.1109/TII.2018.2866267
Lee, J. H., Kim, J.-W., Song, J.-Y., Kim, Y.-J., and Jung, S.-Y. (2016). A Novel Memetic Algorithm Using Modified Particle Swarm Optimization and Mesh Adaptive Direct Search for PMSM Design. IEEE Trans. Magn. 52 (3), 1–4. doi:10.1109/TMAG.2015.2482975
Li, B., Chen, J., Li, D., Shi, K., Yang, B., Qi, B., et al. (2019a). Analysis and Prospect of Key Issues in China’s Demand Response for Further Large Scale Implementation. Power Syst. Tech. 43 (02), 694–704. doi:10.13335/j.1000-3673.pst.2018.0737
Li, J., Fu, Y., Xing, Z., Zhang, X., Zhang, Z., and Fan, X. (2019b). Coordination Scheduling Model of Multi-type Flexible Load for Increasing Wind Power Utilization. IEEE Access 7, 105840–105850. doi:10.1109/ACCESS.2019.2932141
Li, Y., Yuan, S., Liu, W., Zhang, G., Teng, Y., and Chen, X. (2018). A Fast Method for Reliability Evaluation of Ultra High Voltage AC/DC System Based on Hybrid Simulation. IEEE Access 6, 19151–19160. doi:10.1109/ACCESS.2018.2817247
Quan, H., Srinivasan, D., and Khosravi, A. (2014). Short-Term Load and Wind Power Forecasting Using Neural Network-Based Prediction Intervals. IEEE Trans. Neural Netw. Learn. Syst. 25 (2), 303–315. doi:10.1109/TNNLS.2013.2276053
Razavi, S. E., Arefi, A., Ledwich, G., Nourbakhsh, G., Smith, D. B., and Minakshi, M. (2020). From Load to Net Energy Forecasting: Short-Term Residential Forecasting for the Blend of Load and PV behind the Meter. IEEE Access 8, 224343–224353. doi:10.1109/ACCESS.2020.3044307
Recalde Melo, D. F., Trippe, A., Gooi, H. B., and Massier, T. (2018). Robust Electric Vehicle Aggregation for Ancillary Service Provision Considering Battery Aging. IEEE Trans. Smart Grid 9 (3), 1728–1738. doi:10.1109/TSG.2016.2598851
Rogers, E. M. (1995). “Diffusion of Innovations, Fourth Edition,” in Ordinary Non-linear Differential Equations in Engineering and Physical Sciences.
Shim, J. W., Verbic, G., Zhang, N., and Hur, K. (2018). Harmonious Integration of Faster-Acting Energy Storage Systems into Frequency Control Reserves in Power Grid with High Renewable Generation. IEEE Trans. Power Syst. 33 (6), 6193–6205. doi:10.1109/TPWRS.2018.2836157
Wen, M., Li, Y., Xie, X., Cao, Y., Wu, Y., Wang, W., et al. (2019). Discussion on Key Factors for Efficient Consumption of Renewable Energy in Provincial Power Grid at Southern China. Csee Jpes 6 (3), 554–562. doi:10.17775/CSEEJPES.2019.01970
Xu, H., Jin, X., Kong, F., and Deng, Q. (2020). Two Level Colocation Demand Response with Renewable Energy. IEEE Trans. Sustain. Comput. 5 (1), 147–159. doi:10.1109/TSUSC.2019.2904867
Yang, X., Song, Y., Wang, G., and Wang, W. (2010). A Comprehensive Review on the Development of Sustainable Energy Strategy and Implementation in China. IEEE Trans. Sustain. Energ. 1 (2), 57–65. doi:10.1109/TSTE.2010.2051464
Yi, W., Zhang, Y., Zhao, Z., and Huang, Y. (2018). Multiobjective Robust Scheduling for Smart Distribution Grids: Considering Renewable Energy and Demand Response Uncertainty. IEEE Access 6, 45715–45724. doi:10.1109/ACCESS.2018.2865598
Zhang, H., and Zhou, (2018). “The Application of Electricity-sale in Operation Mode of Pumped Storage Power Station,” in 2018 International Conference on Power System Technology. (POWERCON), 869–872.
Keywords: renewable energy consumption, uncertainty, interprovincial transactions, demand response, source–load interaction
Citation: Cai Y, Liu Y, Tang X, Tan Y and Cao Y (2021) Increasing Renewable Energy Consumption Coordination With the Monthly Interprovincial Transaction Market. Front. Energy Res. 9:719419. doi: 10.3389/fenrg.2021.719419
Received: 02 June 2021; Accepted: 21 June 2021;
Published: 15 July 2021.
Edited by:
Yingjun Wu, Hohai University, ChinaCopyright © 2021 Cai, Liu, Tang, Tan and Cao. This is an open-access article distributed under the terms of the Creative Commons Attribution License (CC BY). The use, distribution or reproduction in other forums is permitted, provided the original author(s) and the copyright owner(s) are credited and that the original publication in this journal is cited, in accordance with accepted academic practice. No use, distribution or reproduction is permitted which does not comply with these terms.
*Correspondence: Xiafei Tang, eGlhZmVpLnRhbmdAcXEuY29t