 Xueyi Li1
 Huai Su
- 1National Engineering Laboratory for Pipeline Safety/ MOE Key Laboratory of Petroleum Engineering /Beijing Key Laboratory of Urban Oil and Gas Distribution Technology, China University of Petroleum-Beijing, Beijing, China
- 2Natural Gas Marketing Company, PetroChina Co. Ltd., Beijing, China
As the total mileage of natural gas pipeline network continues to increase, the topological structure of natural gas pipeline network will become more and more complex. The complicated topological structure of natural gas pipeline network is likely to cause inherent structural defects, which have serious impacts on the safe operation of natural gas pipeline network. At present, related researches mainly focused on the safe and reliable operation of natural gas pipeline network, which has become a research hotspot, but few of them considered the complexity of natural gas pipeline network and its potential impacts. In order to understand the complexity of natural gas pipeline network and its behaviors when facing structural changes, this paper studied the robustness of natural gas pipeline network based on complex network theory. This paper drew on the methods and experience of robustness researches in other related fields, and proposed a robustness evaluation method for natural gas pipeline network which is combined with its operation characteristics. The robustness evaluation method of natural gas pipeline network is helpful to identify the key components of the pipeline network and understand the response of the pipeline network to structural changes. Furthermore, it can provide a theoretical reference for the safe and stable operation of natural gas pipeline network. The evaluation results show that natural gas pipeline network shows strong robustness when faced with random disturbances represented by pipeline accidents or component failures caused by natural disasters, and when faced with targeted disturbances represented by terrorist disturbances, the robustness of natural gas pipeline network is very weak. Natural gas pipeline network behaves differently in the face of different types of random disturbances. Natural gas pipeline network is more robust when faced with component failures than pipeline accidents caused by natural disasters.
Introduction
As the total mileage of natural gas pipeline network continues to increase, the topology of natural gas pipeline network will become more and more complex, and then gradually show a trend of system complexity (Ayala and Leong, 2013; Su et al., 2018; Lustenberger et al., 2019). The complicated topological structure of natural gas pipeline network is likely to cause inherent structural defects in natural gas pipeline network, which has serious impacts on the safe operation of natural gas pipeline network (Beyza et al., 2019; Chen et al., 2019; Cavalieri, 2020).
At present, related researches mainly focused on ensuring the safe and reliable operation of natural gas pipeline network which has become a research hotspot (Loktionov, 2018; Su et al., 2018; Almoghathawi et al., 2019; Chen et al., 2019; Chi et al., 2020; Hu et al., 2021). However, a detailed analysis of the current researches reveals that few studies have considered the complexity of natural gas pipeline network and its potential impacts. Therefore, the research on the complexity and robustness of natural gas pipeline network is not in-depth. The accidents that have occurred over the years have also highlighted the fragile side of the modern large-scale natural gas pipeline network system structure, and it objectively shows that the complexity and robustness research of natural gas pipeline network is imperative (Su et al., 2018; Munikoti et al., 2021).
Complexity is an inherent property of a large-scale network topology. Knowing this property not only helps to better grasp the controllability of the network system, but also helps to understand the dynamic behaviors that occur on the network, such as cascade effects, robustness, etc. Robustness evaluation is to evaluate the ability of a system to maintain its inherent functions in the case of structural changes. In related research fields, such as the electricity field, the research momentum of robustness is in the ascendant. Robustness researches mainly focus on changes in capabilities caused by changes in the system structure, and have scientific judgments on the fragility of natural gas pipeline network system, which can be used as a part of reliability researches (Carvalho et al., 2014; Wang et al., 2017; He et al., 2018; Sacco et al., 2019; Liu et al., 2020; Ramos and Batista, 2020).
As a combination of statistical physics and graph theory, complex network theory is an important method for studying complex systems which focus on the topological structure formed by the interaction of all units in the system and the dynamic behaviors that occur in the system. The view that structure determines function is the basis for understanding the researches of complex systems. At the beginning of the 21st century, the development of complex network theory has reached its own golden age. In recent years, its effective application in the fields of sociology, biology, etc. provides theory and technical support for the study of complexity and robustness of natural gas pipeline network (Ayala and Leong, 2013; Rădulescu and Nedelcu, 2017; Su et al., 2017, 2018, 2019; Lustenberger et al., 2019; Beyza et al., 2020).
There are few research materials related to robustness in the field of natural gas pipeline network. Therefore, the few references in the field of natural gas pipeline network have been referred to in this paper’s research process, and the ideas and methods of robustness researches in other fields have also been used for reference.
In the field of natural gas pipeline network, (Munikoti et al., 2021) proposed a modeling framework based on heterogeneous function graph theory (HFGT) for integrated infrastructure such as natural gas pipeline network, and analyzed the robustness of the network. This method quantifies the impact of full/partial and random/targeted disturbances on the system as a whole, simulates various disturbance scenarios, and uses several robustness indicators to comprehensively evaluate the robustness of the system. The research results show that protecting system information and reducing disturbance intensity are feasible measures to enhance the robustness of integrated infrastructure. In view of the uncertainties of wind power, electric load and gas load, (Wang et al., 2019) proposed a two-stage robust day-ahead dispatch model for the Integrated Electricity and Natural Gas System (IEGS). The simulation results show that the uncertainty level and uncertainty budget directly affect the worst case selected in the test system. The two-stage robust day-ahead scheduling model can be extended to other uncertain application scenarios, such as the interruption of power transmission lines and pipelines.
The current theories have become an effective analysis tool for the robustness evaluation of natural gas pipeline network. Each research property has proposed its own natural gas pipeline network robustness (vulnerability) analysis model or method, but the current research is insufficient: 1) these researches rarely consider the source of network vulnerability, and the network performance when the network structure changes; 2) these researches rarely consider the complex system characteristics of natural gas pipeline network.
In contrast, in the field of power grids and transportation networks, robustness research materials are relatively abundant. Crucitti (Crucitti et al., 2004) took the Italian power grid as the research object and established the robustness evaluation system of the power grid. The results show that the Italian power grid is very vulnerable under targeted disturbances, and its robustness is weak; Albert (Albert et al., 2004) analyzed the robustness of North American power grid. The robustness evaluation results show that North American power grids are weaker in robustness when facing targeted disturbances. The main steps of robustness research are as follows: building network model, establishing robustness evaluation indicators, simulating disturbances to change the network structure, and analyzing the results of evaluation indicators, and all of the above steps need to take into account the operation characteristics of the network itself. Due to the similarities among natural gas pipeline network, power grid and transportation network, it is feasible to study the robustness of natural gas pipeline network, whose system function is natural gas supply capacity, but the robustness evaluation method of natural gas pipeline network must be combined with the operation characteristics of natural gas pipeline network.
This research is an exploration of applying the emerging complex network science to the robustness analysis of natural gas pipeline network. This paper draws on the methodological experience of network robustness analysis in other research fields, and proposes a robustness evaluation method for natural gas pipeline network, combined with the operation characteristics of natural gas pipeline network. The robustness evaluation method can be used to distinguish key system components and understand the response of natural gas pipeline network to structural changes, so as to provide a theoretical reference for the safe and stable operation of natural gas pipeline network.
Methods and Materials
Changes in the network structure will affect the function of the network and the dynamic behavior on the network. Therefore, it is of great theoretical significance to study the ability of the network to maintain its function when the structure is disturbed. This chapter proposes a method for evaluating the robustness of a natural gas pipeline network. This method focuses on analyzing the ability of the pipeline network to resist excessive changes in its gas supply capacity after the structure of the pipeline network is changed.
Definition of Robustness of Natural Gas Pipeline Network
As a large-scale complex system, the robustness of natural gas pipeline network needs to be defined with its own characteristics. The robustness of natural gas pipeline network refers to the ability of the pipeline network system to maintain its gas supply function without excessive changes when the topological structure changes due to changes in the internal or external environment. In the concept of the robustness of natural gas pipeline network, the factors that cause the change in the gas supply capacity need to be determined in conjunction with the operating characteristics of natural gas pipeline network:
1) Pipeline Accidents
Pipeline accidents refer to the general term for all incidents in which natural gas leaks and causes pipeline failure. According to relevant statistical data, the main causes of pipeline failure are external interference, construction or material defects, pipeline maintenance errors, and pipeline corrosion.
After carefully analyzing the causes of pipeline accidents, this paper divides the causes into two categories: accidental causes which is represented by natural disasters and pipeline aging, and purposeful causes which is represented by deliberate damage by a third party. According to the above two types of reasons, this study divides pipeline accidents into accidental pipeline accidents and purposeful pipeline accidents. When a certain pipeline in the pipeline network fails due to an accidental pipeline accident or a purposeful pipeline accident, the pipeline can be considered to have no gas transmission capacity, which means that the pipeline exits the pipeline network and causes structural changes, thereby affecting the supply of the pipeline network.
2) Component Failures
In addition to natural gas pipelines, a long-distance natural gas pipeline network also consists of a first station, a gas compressor station and other parts. These components themselves have a certain failure rate. When the external or internal environment changes, these components may fail, which will affect the gas supply capacity to a certain extent.
Method Framework
The framework of studying the robustness of natural gas pipeline network in this paper is shown in Figure 1. The first step to evaluate the robustness of natural gas pipeline network is to determine the robustness definition of natural gas pipeline network. The second step is to summarize robustness research models in related fields. The third step is to establish an index system for identifying key components of the pipeline network model and establish a complex network model for the pipeline network. The fourth step is to determine the robustness evaluation indexes and scenarios. The fifth step is to propose a robustness evaluation system and algorithm. And the last step is to draw conclusions by case studies.
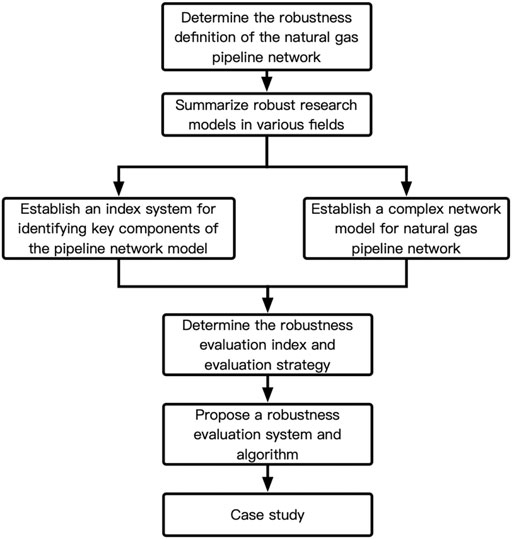
FIGURE 1. The research framework of natural gas pipeline network’s robustness evaluation method.
Modeling Method for Complex Network Model of Natural Gas Pipeline Network
The first step of the robustness evaluation method is the complex network modeling of the network topology. The modeling method of this part is briefly summarized in this section.
Each element in the pipeline network is mapped to the complex network model according to the corresponding relationship in Table 1. The network structure changes caused by each element are different. For example, the failure of the transmission station is equivalent to the node exiting the network, which causes the structure to change and the function is reduced, and the failure of the pipeline section is equivalent to the edge exiting the network, resulting in structural changes and service performance reduce.
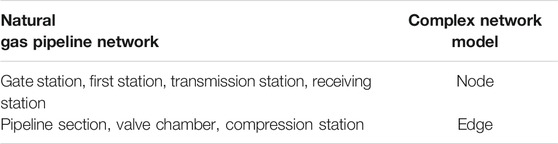
TABLE 1. The relationship between the complex network and pipeline network table.
Other simplification principles and steps are as follows:
① Only the network topology is considered, and the operating hydraulic and thermal conditions of each pipeline section in the network are not considered for the time being.
② Establish an undirected graph with a weight of 1, assuming that the length of each pipeline section is the same, the pipeline diameter is the same, the design pressure is the same, the relative roughness of the pipeline section is the same, and the undirected graph is at the network level.
③ Ignore the internal structure of the valve chamber, compression station, etc., and treat them as part of the pipeline section.
④ For a given piece of pipeline network, traverse the pipeline network information in turn, transform each element into the corresponding part of the complex network according to the above principles, and then number the nodes and edges according to certain rules and store them in the corresponding data table.
After the above simplifications and steps, the actual natural gas pipeline network can be transformed into a complex network with N nodes and K edges. A large sparse matrix can be used to represent the network, and a series of calculations and statistics can be performed.
Key Node and Key Edge Identification Method Based on Pipeline Network Topological Structure
The criticality of each element in natural gas pipeline network is not only related to the properties of each element, such as pipeline length, pipeline diameter and other parameters, but also related to the gas supply task to which each element is “allocated” during the operation of the pipeline network. This research assumes that the attributes and tasks of each component are almost the same. Based on this assumption, the importance of each component is related to its topological structure attributes.
Key Node Identification Method
There are many indicators for judging the importance of nodes, which can be summarized into three categories: degree category, center category, and betweenness category. The degree indicators reflect the importance of the component at the connection level, the central indicators reflect the influence of the component in the entire network, and the betweenness indicators reflect the degree of contribution of each component to the network efficiency. The indicators constructed in this paper is an improvement or combination of one or more of the above three categories and they are as follows:
1) Central value of local proximity
This paper defines the local proximity center value as the sum of its own proximity center value and the proximity center value of adjacent nodes, as shown in Eq. 2.1:
where
2) Local node betweenness
On the basis of node betweenness, local node betweenness is defined as its own node betweenness plus the node betweenness of adjacent nodes, as shown in Eq. 2.2:
where
3) Local node degree
The local node degree is defined as its own node degree plus the node degree of adjacent nodes, as shown in Eq. 2.3:
where
4) Comprehensive evaluation index
This paper proposes a comprehensive evaluation indicator to consider the importance of nodes, as shown in Eq. 2.4:
where
The above indicators not only take into account the importance of the nodes themselves, but also consider the importance of adjacent nodes. However, the above indicators do not incorporate the operating characteristics of natural gas pipeline network. Next, improvements will be made to each indicator.
Natural gas pipeline network is characterized by directional flow, and the nodes have functional differences, which can be divided into gas source nodes and gas demand nodes. The calculation basis of the original proximity centrality and node betweenness is all possible node pairs in the network. However, due to the characteristics of directional flow, only consideration can be taken when calculating the proximity centrality and node betweenness of natural gas pipeline network. For some node pairs, not all node pairs can be included in the calculation, so this research changes the central value of proximity and node betweenness.
The changed central value of proximity is shown in Eq. 2.5:
where
The changed node betweenness is shown in Eq. 2.6:
where
Therefore, the improved central value of local proximity is shown in Eq. 2.7:
where
The improved local node betweenness is shown in Eq. 2.8:
where
The improved comprehensive index of node importance is shown in Eq. 2.9:
The improved evaluation index of key nodes takes into account the importance of the node itself and the importance of adjacent nodes, and also combines the operating characteristics of natural gas pipeline network.
Key Edge Identification Method
At present, the indicators for judging key edges in various fields are relatively uniform. A common judgment index is the betweenness number. According to the operating characteristics of natural gas pipeline network, its improvement can better analyze the importance of the connection of natural gas pipeline network.
With reference to the method for improving the evaluation index of key nodes, the changes to the evaluation index of key edges are as follows:
where
The Robustness Evaluation Method of Natural Gas Pipeline Network
Evaluation Index
There are many indicators for evaluating changes in network functions. In this study, combined with the operating characteristics of natural gas pipeline network, the following indicators are used:
1) Relative efficiency ratio of pipeline network
Pipeline network efficiency refers to its own transmission efficiency under the condition that the pipeline network meets the gas supply requirements within a certain range. The pipeline network efficiency in this paper is defined as follows:
where M is the number of nodes in the gas source node set, T is the number of nodes in the gas demand node set,
The relative efficiency ratio of the pipeline network used in this study reflects the degree of change in the transmission efficiency of the pipeline network, and its expression is shown in Eq. 2.12:
where
2) The largest subgraph ratio of the pipeline network
The failure of a certain component of natural gas pipeline network is equivalent to the temporary withdrawal of the component from the network, which causes a change in the network structure, and even changes the connected network to a disconnected network. In this study, the maximum subgraph ratio of the pipeline network is used to reflect the degree of change in the gas supply range of the pipeline network, which is defined as follows:
where
Disturbance Scenarios
Natural gas pipeline network robustness evaluation method chooses two disturbance scenarios including random disturbances and targeted disturbances. Random disturbances mainly correspond to accidental pipeline damage caused by pipeline aging and natural disasters, while targeted disturbances mainly correspond to planned pipeline damage or shutdown caused by terrorist disturbances and pipeline construction. The changes reflected in the network structure after any disturbance on the pipeline network needs to be improved based on the operating characteristics of natural gas pipeline network.
In the pipeline network model of this study, pipeline sections, valve chambers, compression stations, etc. are all components of the edge, so the disturbance on the edge is equivalent to the actual pipeline accident or the original failure of the compressor.
When a pipeline accident occurs, the pipeline needs to be inspected and repaired. The pipeline section does not have any gas supply capacity, which is equivalent to completely removing the pipeline section from the network, as shown in Figure 2.

FIGURE 2. Edge’s disturbance schematic diagram.
When the compressor and other components fail, the entire connection side will act as a gas storage. From a structural point of view, the network structure has not changed, but the gas supply capacity has changed. This study believes that any failure can be equivalent to a certain network structure change, and the structure change leads to a decrease in its gas supply capacity. Therefore, in this case, this study does not delete the connected edge where the compressor fails, but changes the weight of this edge from 1 to 100, as shown in Figure 3. In fact, the edge of the network that is removed due to a failure is equivalent to the weight of the edge changes from one to

FIGURE 3. Edge’s disturbance schematic diagram.
Algorithm Design of Robustness Evaluation Method for Natural Gas Pipeline Network
The above sections have elaborated the research ideas of the robustness evaluation method in detail, and designed the robustness research algorithm according to the research ideas.
1) Disturbance modes
① Pipeline accidents: delete the corresponding connection from the network.
② Compressor and other components failures: the side is not deleted, but the weight is changed from 1 to 100.
2) Disturbance scenarios
① Random disturbances: randomly select edges from the network to delete or change the weight to 100.
② Targeted disturbances: purposefully select an edge to delete or change its weight to 100.
3) The overall algorithm flow chart and simulation flow charts
The overall algorithm flow chart is shown in Figure 4. The first step is to establish a complex network model of the pipeline network. The second step is to calculate the network size and the number of connected edges. The third step is to evaluate the critical nodes and critical paths of the network. The fourth step is to choose disturbance mode. The fifth step is to choose disturbance scenario. The sixth step is to run a simulation. The seventh step is to calculate changes in the network. The eighth step is to check if it is less than the predetermined number of nodes. The nineth step is to draw the corresponding evaluation index change curve. The last step is to evaluate the robustness of the pipeline network.
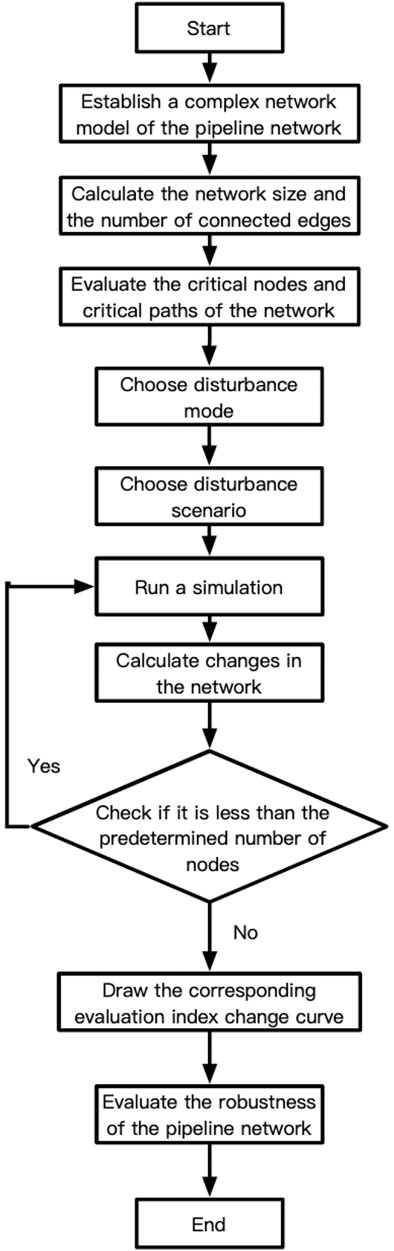
FIGURE 4. The overall algorithm flow chart.
The disturbance mode one simulation algorithm flow chart in the overall flow chart is shown in Figure 5. The first step is to use edge betweenness to rank the importance of connecting edges. The second step is to choose disturbance scenario. The third step is to remove edges from the network according to the disturbance mode. The fourth step is to check whether the network is connected. The fifth step is to calculate the network efficiency ratio. And if the network is disconnected, calculate the maximum subgraph ratio. The sixth step is to check whether the number of deleted nodes is less than the set valued. The seventh step is to draw the network efficiency ratio change curve.
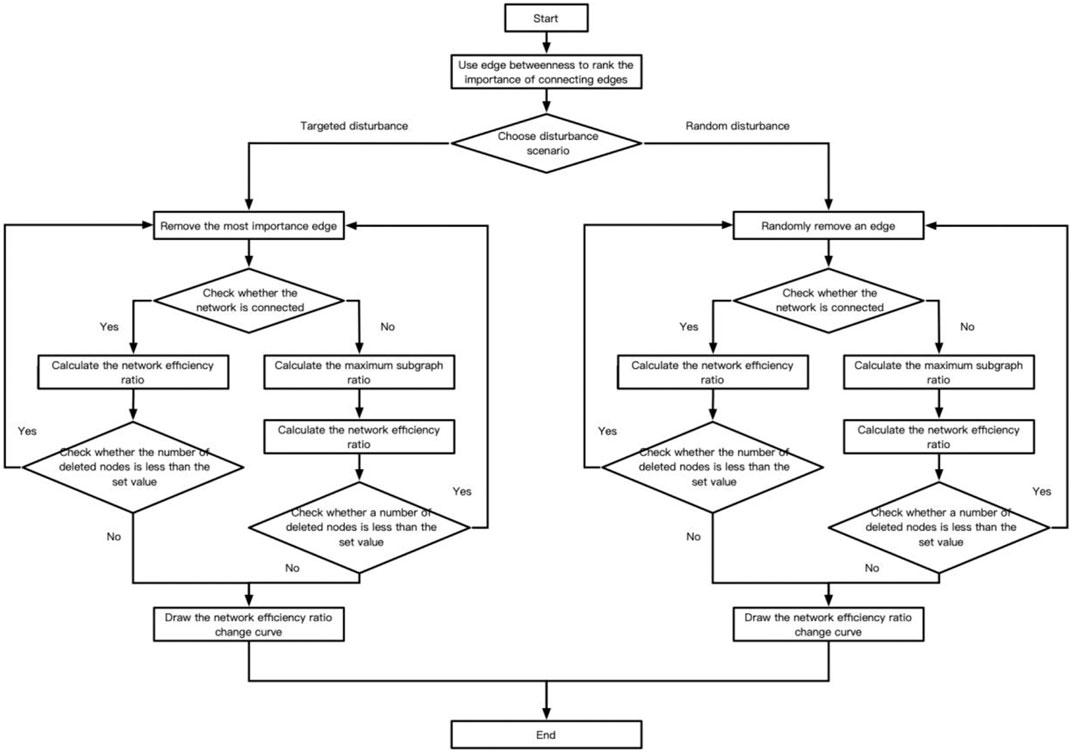
FIGURE 5. Disturbance model one simulation algorithm flow chart.
The disturbance mode two simulation algorithm flow chart in the overall flow chart is shown in Figure 6. The first step is to use edge betweenness to rank the importance of connecting edges. The second step is to choose disturbance scenario. The third step is to set the edge weight according to the disturbance mode. The fourth step is to calculate the network efficiency ratio. The fifth step is to check whether the number of deleted nodes is less than the set value. The last step is to draw the network efficiency ratio change curve.
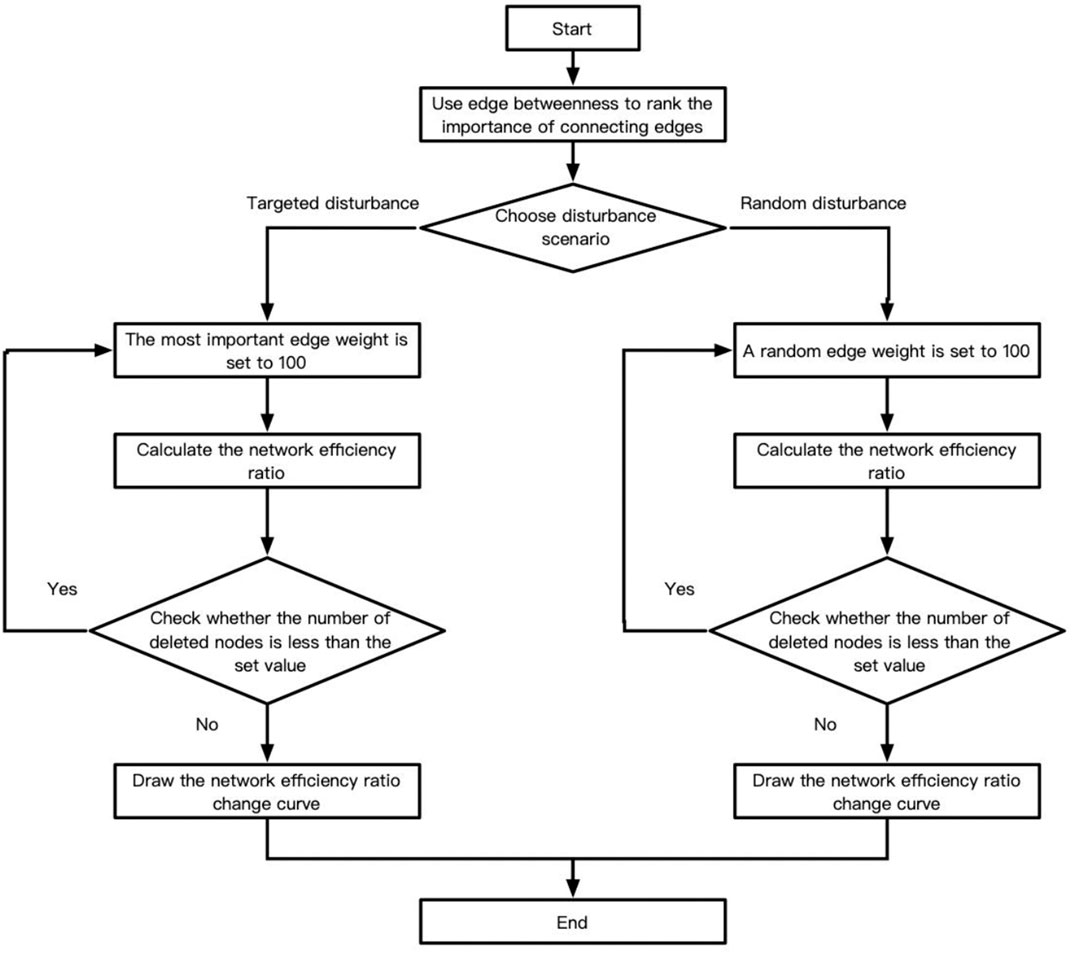
FIGURE 6. Disturbance model two simulation algorithm flow chart.
Results and Discussions
This section uses natural gas pipeline network robustness evaluation method proposed in this paper to evaluate the robustness of the actual natural gas pipeline network, and identifies the key components in the network according to the key component identification method.
The Complex Network Modeling of Natural Gas Pipeline Network
According to the modeling rules, simplification principles and modeling steps in the evaluation method, the actual natural gas pipeline network is abstracted into a complex network, as shown in Figure 7.
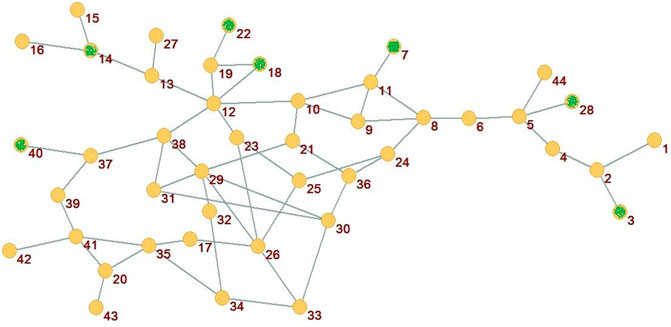
FIGURE 7. The complex network model diagram of natural gas pipeline network.
In this paper, the pipeline network robustness evaluation focuses on the connection relationship at the topological structure level, so it is assumed that the length of each pipeline section is the same, the pipeline diameter is the same, the design pressure is the same, and the relative roughness of the pipeline section is the same. The network is an undirected graph with a weight of 1.
The network has a total of 44 nodes and 59 edges. All nodes are divided into two categories. The node classification information of all nodes of gas source node and gas demand node (gate station) is shown in Table 2.

TABLE 2. The node classification table.
Identification of Key Nodes
Node Influence
The improved central value of local proximity is used as a part of evaluating the criticality of each node. The central value of local proximity can well reflect the influence of the node. The central value information of the local proximity of each node is shown in Figure 8. The central value of the local proximity of the node 12, the node 31, and the node 29 is obviously larger than that of other nodes.
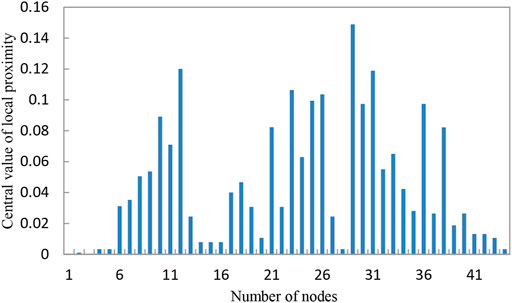
FIGURE 8. The statistical diagram of each node’s local closeness centrality value.
According to the relative size of the central value of the local proximity of each node, the influence of each node is sorted. Table 3 lists the top 10 nodes with the central value of the local proximity.
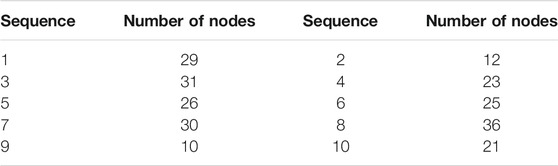
TABLE 3. The node’s influence degree sorting table.
The Degree of Contribution of Nodes to Network Efficiency
The improved local node betweenness is used as a part of the critical degree of the evaluation node. The betweenness of local nodes reflects the contribution degree of nodes to network efficiency. The local node betweenness value of each node is shown in Figure 9. The contribution of node 38, node 41, and node 42 to network efficiency is obviously higher than that of other nodes.
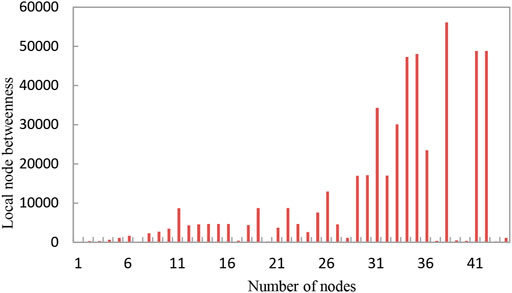
FIGURE 9. The statistical diagram of each node’s local betweenness centrality value.
According to the relative size of each node’s local betweenness, the efficiency contribution degree of each node is ranked. Table 4 lists the top 10 nodes.
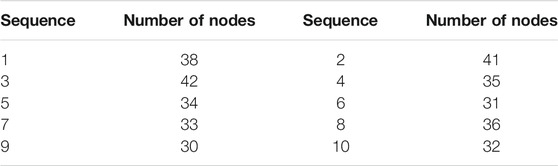
TABLE 4. The node’s efficiency contribution sorting table.
The Importance of Node Location
The local node degree is used as a part of evaluating the criticality of nodes. The node degree reflects the importance of the position of the node in the network. The local node degree information of each node is shown in Figure 10. The local node degree of node 29, node 12, and node 11 is significantly higher than other nodes.
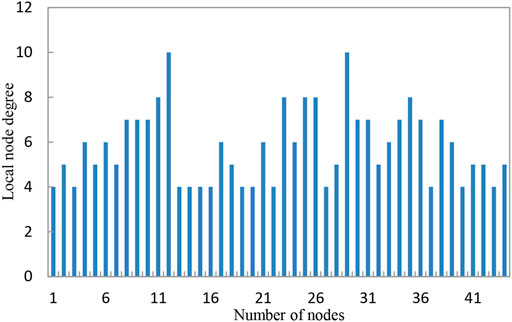
FIGURE 10. The statistical diagram of each node’s local degree.
According to the relative size of the local node degree of each node, the position importance degree of each node is sorted. Table 5 lists the top 10 nodes in terms of importance degree.
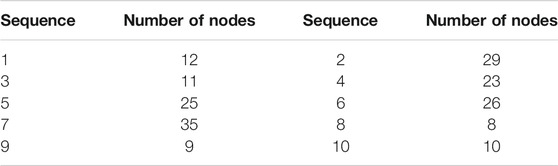
TABLE 5. The node’s position importance sorting table.
Comprehensive Indicators to Judge Key Nodes
The importance of the position of the node, the influence of the node in the network, and the contribution of the node to the network efficiency are considered at the same time. Using the comprehensive index proposed in this paper, sorting according to the value of the comprehensive index, the top 14 important nodes are listed in Table 6.
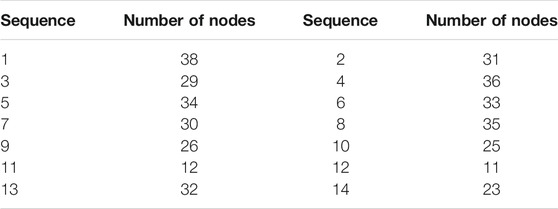
TABLE 6. The node’s importance sorting table.
It can be seen from Table 6 that node 31, node 29, and node 38 are the three most critical nodes and need to be protected.
Identification of Critical Path
The improved edge betweenness number is used to measure the relative importance of each edge. The greater the betweenness of an edge, the more critical it is. According to the value of each edge, the edges in the pipeline network are sorted. The sorting results are shown in Table 7 (due to the large number of edges, this paper only lists the top 20 edges).
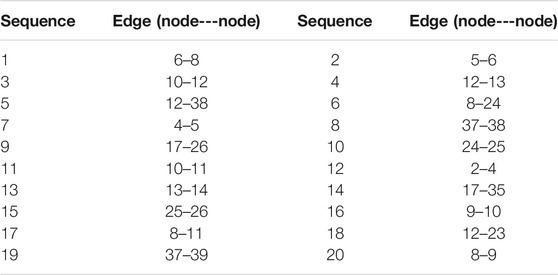
TABLE 7. The edge’s importance sorting table.
Evaluation of Pipeline Network Robustness
According to the operating characteristics of natural gas pipeline network, different disturbances have different effects on the pipeline network structure.
Analysis of the Robustness Performance of the Pipeline Network Under Random Disturbances
Firstly, the robustness of natural gas pipeline network in the face of pipeline accidents caused by natural disasters is analyzed. The pipeline accident caused by a natural disaster in the pipeline network is equivalent to a random disturbance on the pipeline network model. In this case, any pipeline section where the accident occurred will not have the ability to transport gas, which means that any disturbed side will completely exit the network.
Figure 11 and Figure 12 are graphs showing the change of the pipeline network robustness evaluation index as the degree of network damage increases. In the random disturbance mode, as the number of deleted edges increases, the efficiency ratio of the pipeline network continues to decrease. When the number of deleted connections is less than 10, the rate of decrease of the pipeline network efficiency ratio is slower, and when the number of deleted connections is between 10 and 20, the rate of decrease of the pipeline network efficiency ratio increases significantly. When the scale of damage is small, the pipeline network can maintain its ability. In other words, the pipeline network has a threshold phenomenon, which has strong robustness. When the number of deleted edges reaches half of the total number of network connections, the network’s efficiency has dropped to 0.2. As the number of deleted connections increases, the scale of the network changes step by step, but when the number of deleted nodes reaches 25, the maximum subgraph order of the network changes significantly. At this time, the network has been divided into multiple subgraphs.
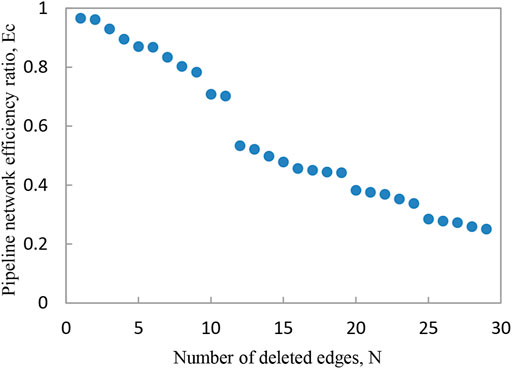
FIGURE 11. The diagram of pipeline network efficiency ratio.
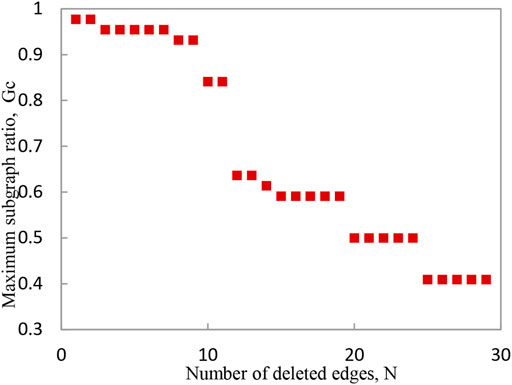
FIGURE 12. The diagram of pipeline network maximum subgraph ratio.
Secondly, analyze the robustness of natural gas pipeline network in the face of component failures. A component failure in the pipeline network is equivalent to a random disturbance on the pipeline network model. In this case, any pipeline section where the accident occurred has gas storage capacity. The disturbanceed edges were not deleted from the network, but only affected the network’s gas transmission function.
Figure 13 is a graph showing the change of the pipeline network robustness evaluation index as the degree of network damage increases. In the random disturbance mode, as the number of deleted edges increases, the rate of decrease of the pipeline network efficiency ratio is slower. There is a threshold phenomenon in the pipeline network, that is, it has strong robustness. When the number of deleted edges reaches half of the total number of connected edges in the network, the efficiency of the network has dropped to 0.4, and a certain gas supply capacity can still be maintained. As the network structure remains unchanged, the largest subgraph of the network does not change.
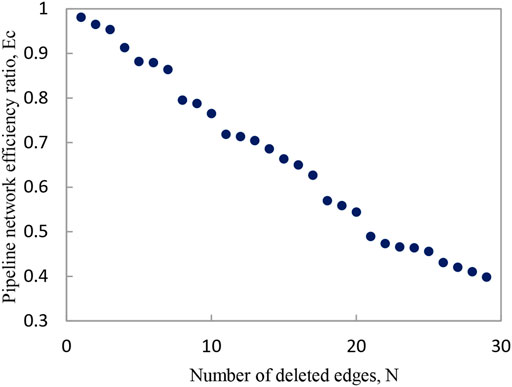
FIGURE 13. The diagram of pipeline network efficiency ratio.
The Robustness Evaluation of the Pipeline Network Under Targeted Disturbances
The following analyzes the robustness of natural gas pipeline network in the face of terrorist disturbances. When the pipeline network is disturbanceed by a terrorist disturbance, it is equivalent to a targeted disturbance on the pipeline network model. The core of a targeted disturbance lies in purpose. In this case, it is equivalent to any side that is ‘targeted disturbance’ will completely withdraw from the network. In the targeted disturbance mode, this paper only considers the situation of completely exiting the network.
Figure 14 and Figure 15 are graphs showing the changes of the pipeline network robustness evaluation index as the degree of network damage increases. In the targeted disturbance mode, the pipeline network does not show a threshold phenomenon. When the number of deleted edges of the network is less than 3, the efficiency ratio of the pipeline network drops sharply, and the maximum subgraph ratio has an obvious step. As the number of deleted edges continues to increase, the pipeline network efficiency ratio has shown a relatively stable rate of decline. When the number of deleted edges reaches half of the total number of connected edges in the network, the pipeline network efficiency ratio is close to 0.2. As the number of deleted connections increases, the scale of the network changes step by step, but when the number of deleted nodes reaches 15, the maximum subgraph order of the network obviously changes, and the network at this time has been divided into multiple subgraphs.
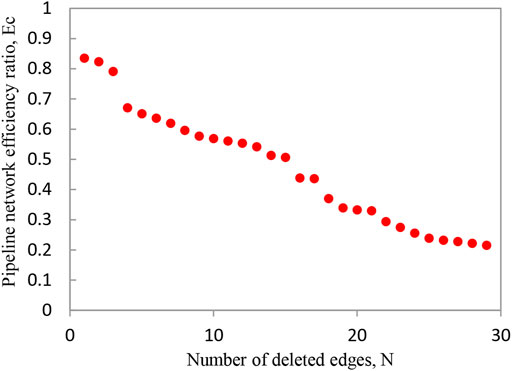
FIGURE 14. The diagram of pipeline network efficiency ratio.
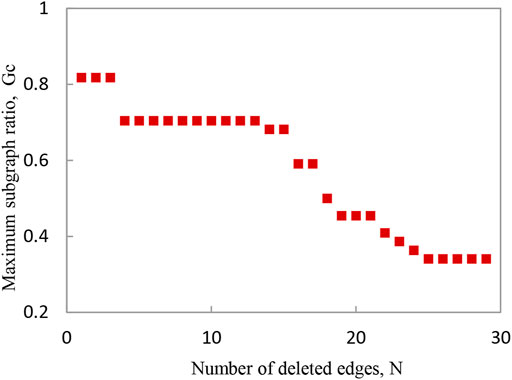
FIGURE 15. The diagram of pipeline network maximum subgraph ratio.
Analysis of Robustness Evaluation Results of Natural Gas Pipeline Network
First, compare and analyze the robustness of the pipeline network when faced with pipeline accidents caused by natural disasters and the robustness of the pipeline network when faced with component failures, as shown in Figure 16.
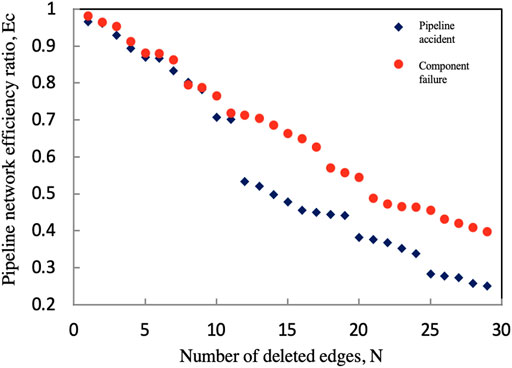
FIGURE 16. The network robustness diagram under the random disturbance caused by different reasons.
Pipeline accidents or component failures caused by natural disasters in the pipeline network are equivalent to random disturbances on the pipeline network. When the number of disturbanceed nodes is less than 7, the gas supply capacity of the pipeline network is less affected, indicating that the pipeline network has a threshold phenomenon under random disturbances, and the pipeline network has better robustness. When the number of disturbanceed nodes is between 7 and 10, the robustness of the pipeline network is similar. When the number of disturbanceed nodes is greater than 10, the impact on the pipeline network is significantly different. The impact of pipeline accidents caused by natural disasters on the pipeline network has undergone a step change, and the rate of decline in the efficiency of the pipeline network has gradually increased. When the number of disturbanceed nodes reaches half of the total number of nodes, the efficiency of the pipeline network has lost about 80%. The impact of component failure on the pipeline network is relatively stable, and the rate of decrease in the efficiency of the pipeline network is gradually reduced. When the number of disturbanceed nodes reaches half of the total number of nodes, the efficiency of the pipeline network loses about 60%.
There are similarities and differences between the robustness evaluation results of natural gas pipeline network facing pipeline accidents caused by natural disasters and the robustness evaluation results of natural gas pipeline network facing component failures. The same point is that the pipeline network can show strong robustness. The difference is that when the number of disturbanceed nodes is greater than a certain value, the impact of pipeline accidents caused by natural disasters on the gas supply capacity of the pipeline network will gradually expand, while component failures have a gentler impact on the gas supply capacity of the pipeline network. Therefore, on the whole, the robustness of the pipeline network when faced with pipeline accidents caused by natural disasters is weaker than that of the pipeline network when faced with component failures.
Secondly, the robust performance of the pipeline network facing random disturbances and the robust performance of the pipeline network facing targeted disturbances are compared and analyzed, as shown in Figure 17.
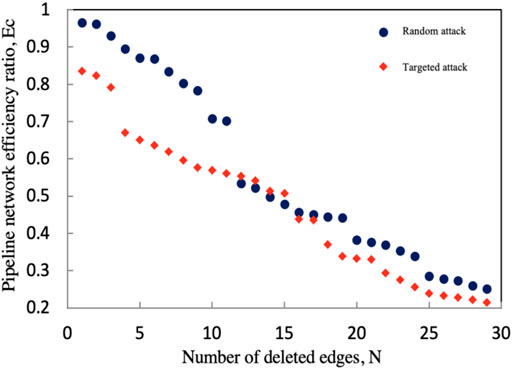
FIGURE 17. The network robustness diagram under the random disturbance and the targeted disturbance.
The pipeline network reacts differently to random disturbances and targeted disturbances. When the pipeline network faces a targeted disturbance, there is no threshold effect. When the number of disturbanceed nodes is less than 3, the gas supply capacity of the pipeline network drops quickly. When the number of disturbanceed nodes is greater than 3, the gas supply capacity of the pipeline network has a “cliff-breaking” drop, losing about 10% of its capacity. As the number of disturbance nodes continues to increase, the gas supply capacity of the pipeline network continues to decline. Compared with the response of the pipeline network to a targeted disturbance, the pipeline network has a threshold effect when facing a random disturbance and is more robust. When the number of deleted nodes is less than 10, the gas supply capacity of the pipeline network decreases slowly, and 70% of the original gas supply capacity can still be maintained. Therefore, the robust performance of the pipeline network facing random disturbances is stronger than the robust performance of the pipeline network facing targeted disturbances.
Conclusion
As the scale of the pipeline network continues to expand, natural gas pipeline network gradually shows the characteristics of a complex network. At present, researches aimed at ensuring the safe and reliable operation of natural gas pipeline network has become a research hotspot, but very few studies have considered the complexity of natural gas pipeline network and its possible impacts. In order to understand the complexity of natural gas pipeline network and its behaviors when facing structural changes, this paper studies the robustness of complex natural gas pipeline network based on complex network theory.
Based on the complex network theory and combined with the operating characteristics of natural gas pipeline network, this paper proposes a method for evaluating the robustness of natural gas pipeline network. The method includes a method for identifying key components of natural gas pipeline network, through which key components in the pipeline network can be identified, so as to strengthen the understanding of the vulnerability of the pipeline network and take effective measures to prevent accidents before they occur.
Based on the above method, this paper evaluates the robustness of natural gas pipeline network. The evaluation results show that natural gas pipeline network can show strong robustness when facing random disturbances represented by pipeline accidents or component failures caused by natural disasters, and when facing targeted disturbances represented by terrorist disturbances, the performance of natural gas pipeline network is vulnerable. Natural gas pipeline network behaves differently when facing different random disturbances. The pipeline network performs more robust when facing random disturbances represented by component failures than when facing random disturbances represented by pipeline accidents caused by natural disasters.
In this study, the hydraulic and thermal conditions of natural gas pipeline network were not considered, and only a preliminary exploration of the robustness of natural gas pipeline network was done. In order to make researches on the robustness of natural gas pipeline network better serve the engineering, it is indispensable to study the combination of hydraulic and thermal analysis of the pipeline network.
Data Availability Statement
The original contributions presented in the study are included in the article/supplementary material, further inquiries can be directed to the corresponding author.
Author Contributions
The authors contributed to the paper in the following capacities: methods and materials, HS, JZ; results, XL; discussion, XL and NY.
Funding
This work is supported by the National Natural Science Foundation of China (grant number 51904316), and the research fund provided by China University of Petroleum, Beijing (grant numbers 2462018YJRC038, 2462020YXZZ045).
Conflict of Interest
Author NY is employed by the Natural Gas Marketing Company, PetroChina Co. Ltd.
The remaining authors declare that the research was conducted in the absence of any commercial or financial relationships that could be construed as a potential conflict of interest.
Publisher’s Note
All claims expressed in this article are solely those of the authors and do not necessarily represent those of their affiliated organizations, or those of the publisher, the editors and the reviewers. Any product that may be evaluated in this article, or claim that may be made by its manufacturer, is not guaranteed or endorsed by the publisher.
References
Albert, R., Albert, I., and Nakarado, G. L. (2004). Structural vulnerability of the North American power grid. Phys. Rev. E 69, 1–4. doi:10.1103/PhysRevE.69.025103
Almoghathawi, Y., Barker, K., and Albert, L. A. (2019). Resilience-driven restoration model for interdependent infrastructure networks. Reliability Eng. Syst. Saf. 185, 12–23. doi:10.1016/j.ress.2018.12.006
Ayala H., L. F., and Leong, C. Y. (2013). A robust linear-pressure analog for the analysis of natural gas transportation networks. J. Nat. Gas Sci. Eng. 14, 174–184. doi:10.1016/j.jngse.2013.06.008
Beyza, J., Garcia-Paricio, E., and Yusta, J. M. (2019). Ranking critical assets in interdependent energy transmission networks. Electric Power Syst. Res. 172, 242–252. doi:10.1016/j.epsr.2019.03.014
Beyza, J., Ruiz-Paredes, H. F., Garcia-Paricio, E., and Yusta, J. M. (2020). Assessing the criticality of interdependent power and gas systems using complex networks and load flow techniques. Physica A: Stat. Mech. its Appl. 540, 123169. doi:10.1016/j.physa.2019.123169
Carvalho, R., Buzna, L., Bono, F., Masera, M., Arrowsmith, D. K., and Helbing, D. (2014). Resilience of natural gas networks during conflicts, crises and disruptions. PLoS One 9, e90265. doi:10.1371/journal.pone.0090265
Cavalieri, F. (2020). Seismic risk assessment of natural gas networks with steady-state flow computation. Int. J. Crit. Infrastructure Prot. 28, 100339. doi:10.1016/j.ijcip.2020.100339
Chen, W., Lou, X., and Guo, C. (2019). A Robust Formulation Model for Multi-Period Failure Restoration Problems in Integrated Energy Systems. Energies 12, 1–23. doi:10.3390/en12193673
Chi, L., Su, H., Zio, E., Zhang, J., Li, X., Zhang, L., et al. (2020). Integrated Deterministic and Probabilistic Safety Analysis of Integrated Energy Systems with bi-directional conversion. Energy 212, 118685. doi:10.1016/j.energy.2020.118685
Crucitti, P., Latora, V., and Marchiori, M. (2004). A topological analysis of the Italian electric power grid. Physica A: Stat. Mech. its Appl. 338, 92–97. doi:10.1016/j.physa.2004.02.029
He, C., Dai, C., Wu, L., and Liu, T. (2018). Robust network hardening strategy for enhancing resilience of integrated electricity and natural gas distribution systems against natural disasters. IEEE Trans. Power Syst. 33, 5787–5798. doi:10.1109/TPWRS.2018.2820383
Hu, J., Khan, F., and Zhang, L. (2021). Dynamic resilience assessment of the Marine LNG offloading system. Reliability Eng. Syst. Saf. 208, 107368. doi:10.1016/j.ress.2020.107368
Liu, K., Biegler, L. T., Zhang, B., and Chen, Q. (2020). Dynamic optimization of natural gas pipeline networks with demand and composition uncertainty. Chem. Eng. Sci. 215, 115449. doi:10.1016/j.ces.2019.115449
Loktionov, V. I. (2018). Energy Resilience Assessment in the Period of Transition to Sustainable Energy. Int. Multi-conference Ind. Eng. Mod. Technol. Fareastcon, 2018. doi:10.1109/FarEastCon.2018.8602622
Lustenberger, P., Schumacher, F., Spada, M., Burgherr, P., and Stojadinovic, B. (2019). Assessing the performance of the European natural gas network for selected supply disruption scenarios using open-source information. Energies 12, 1–30. doi:10.3390/en12244685
Munikoti, S., Lai, K., and Natarajan, B. (2021). Robustness assessment of Hetero-functional graph theory based model of interdependent urban utility networks. Reliability Eng. Syst. Saf. 212, 107627. doi:10.1016/j.ress.2021.107627
Ramos, E. S., and Batista, L. S. (2020). Natural gas pipeline network expansion under load-evolution uncertainty based on multi-criteria analysis. Appl. Soft Comput. 96, 106697. doi:10.1016/j.asoc.2020.106697
Rădulescu, R., and Nedelcu, C. (2017). Finding optimal route in the Romanian natural gas network. Proc. Int. Conf. Bus. Excell. 11, 131–137. doi:10.1515/picbe-2017-0014
Sacco, T., Compare, M., Zio, E., and Sansavini, G. (2019). Portfolio decision analysis for risk-based maintenance of gas networks. J. Loss Prev. Process Industries 60, 269–281. doi:10.1016/j.jlp.2019.04.002
Su, H., Zio, E., Zhang, J., Chi, L., Li, X., and Zhang, Z. (2019). A systematic data-driven Demand Side Management method for smart natural gas supply systems. Energ. Convers. Manag. 185, 368–383. doi:10.1016/j.enconman.2019.01.114
Su, H., Zio, E., Zhang, J., and Li, X. (2018). A flow-based method for identifying critical pipelines in complex natural gas supply systems. Saf. Reliab. - Safe Soc. A Chang. World - Proc. 28th Int. Eur. Saf. Reliab. Conf. ESREL, 2051–2057. –2058. doi:10.1201/9781351174664-258
Su, M., Zhang, M., Lu, W., Chang, X., Chen, B., Liu, G., et al. (2017). ENA-based evaluation of energy supply security: Comparison between the Chinese crude oil and natural gas supply systems. Renew. Sust. Energ. Rev. 72, 888–899. doi:10.1016/j.rser.2017.01.131
Wang, C., Wei, W., Wang, J., Liu, F., Qiu, F., Correa-Posada, C. M., et al. (2017). Robust Defense Strategy for Gas-Electric Systems Against Malicious Attacks. IEEE Trans. Power Syst. 32, 2953–2965. doi:10.1109/TPWRS.2016.2628877
Keywords: natural gas pipeline network, robustness evaluation, topological structure analysis, operation risk, random disturbances
Citation: Li X, Su H, Zhang J and Yang N (2021) A Robustness Evaluation Method of Natural Gas Pipeline Network Based on Topological Structure Analysis. Front. Energy Res. 9:730999. doi: 10.3389/fenrg.2021.730999
Received: 25 June 2021; Accepted: 14 September 2021;
Published: 30 September 2021.
Edited by:
Haoran Zhang, The University of Tokyo, JapanReviewed by:
Wuchang Wang, China University of Petroleum (East China), ChinaWei Wang, City University of Hong Kong, Hong Kong, SAR China
Copyright © 2021 Li, Su, Zhang and Yang. This is an open-access article distributed under the terms of the Creative Commons Attribution License (CC BY). The use, distribution or reproduction in other forums is permitted, provided the original author(s) and the copyright owner(s) are credited and that the original publication in this journal is cited, in accordance with accepted academic practice. No use, distribution or reproduction is permitted which does not comply with these terms.
*Correspondence: Huai Su, c3VodWFpQGN1cC5lZHUuY24=