 Tianyu Li
 Shengyu Tao
 Kun He1,3
 Binglei Xie
- 1School of Information Science and Technology, Fudan University, Shanghai, China
- 2School of Architecture, Harbin Institute of Technology Shenzhen, Shenzhen, China
- 3Shanghai Engineering Research Centre for Artificial Intelligence and Integrated Energy System, Shanghai, China
- 4Institute for Six-Sector Economy, Fudan University, Shanghai, China
- 5State Grid Zhejiang Electric Power Co., Ltd, Hangzhou, China
V2G (Vehicle to Grid) technology can adjust the grid load through the unified control of the charging and discharging of electric vehicles (EVs), and achieve peak shaving and valley filling to smooth load fluctuations. Aiming at the random and uncertain problem of EV users travel and behavior decision-making, this paper proposes a V2G multi-objective dispatching strategy based on user behavior. First, a V2G behavior model was established based on user behavior questionnaire surveys, and the effective effect of EV load was simulated through Monte Carlo simulation. Then, combined with the regional daily load curve and peak-valley time-of-use electricity prices, with the goal of stabilizing grid load fluctuations and increasing the benefits of EV users, a multi-objective optimal dispatching model for EV clusters charging and discharging is established. Finally, Considering the needs of EV users and the operation constraints of the microgrid, the genetic algorithm is used to obtain the Pareto optimal solution. The results show that when dispatching with the maximum benefit of users, the peak-to-valley ratio of the grid side can be reduced by 2.99%, and the variance can be reduced by 9.52%. The optimization strategy can use peak and valley time-of-use electricity prices to guide the intelligent charging and discharging of EVs while meeting user needs, so as to achieve the optimal multi-objective benefit of V2G participation in power response.
Introduction
Electric vehicles (EVs) have the dual attributes of transportation and energy storage, with great potential and value in the application of energy Internet. According to the US National Household Travel Survey, EVs are idle 96% of the time (Kempton and Tomić, 2005; Yonghua et al., 2012). On the one hand, EVs can be used as distributed energy storage on the user side of the power system after they are connected to the grid on a large scale, helping to connect distributed renewable energy power generation and regulating the power load of the grid under low inertia and high intermittency circumstances (Xiong et al., 2020a). On the other hand, EVs can be used as distributed power sources to provide power in the opposite direction to the grid, play the role of peak shaving and valley filling as auxiliary services, i.e., frequency modulation and backup energy storage. Vehicle-to-Grid (V2G) technology embraces the two aforementioned purposes as one:a technology that enables energy to be pushed back to the power grid from the battery of EVs (Soares et al., 2016; Wei and Li, 2017; Xing et al., 2021; Xue et al., 2021; Zeng et al., 2021). According to the report “Research on the Potential and Economics of Electric Vehicle Energy Storage Technology” issued by the National Development and Reform Commission’s Energy Research Institute, China’s electric vehicle ownership will exceed 80 million in 2030, and the theoretical energy storage potential of V2G will exceed 5000 GWh (Jian, 2020). The application and development of V2G technology has huge potential.
V2G adjusts the available capacity when the grid load reaches the peak or valley. Through the large-scale charging and discharging behavior to perform peak shaving and valley filling, the grid load will be uniformed and further stabilized, which is of great importance to the modern power systems (Xiong et al., 2020b). However, as an EV cluster is an integration of multiple transportation units, its charge and discharge control are affected by factors such as user behavior, remaining battery capacity, and access time. Electric vehicle load has a high degree of randomness and volatility in time and space. Multi-factor variables such as driving rules, user preferences, and access duration have brought great challenges to the orderly adjustment of V2G. Meanwhile, there are still many technical and policy issues in the application and promotion of V2G technology. When participating in V2G, it is first necessary to meet its travel needs, and secondly, regarding the impact of V2G on battery consumption as an economic consideration. An electric vehicle cluster is composed of multiple individual users. How to balance the grid-side regulation needs and the personal needs of electric vehicle users is a difficult problem to be solved.
Up to date, researches on the driving behavior of EVs and V2G regulation of grid load have been widely conducted (Li et al., 2020; Zhou et al., 2020; Leonori et al., 2021; Sangob and Sirisumrannukul, 2021). The MIT Energy Research Institute team established a Trip Energy model by tracking EV energy consumption data to analyze the impact of EV expansion caused by the improvement of charging facilities (Wei et al., 2021). Literature (Wu et al., 2018) introduced multi-agent integrated modeling based on experimental economics, and established a travel willingness model for EV users. Literature (Salehpour and Tafreshi, 2020) introduces a stochastic model for uncertainty handling in the interaction between a smart micro grid and EVss. To further describe the driving behaviors, researches on the statistical data upon National Household Vehicle Survey (NHTS) by considering EVs as equilibrium energy storage aggregator (Qian et al., 2011; Toquica et al., 2020). In terms of the V2G optimal dispatching, literature (Wu et al., 2018; Toquica et al., 2020) proposed an orderly charging control strategy for EVs guided by time-of-use electricity prices. Under the premise of considering user satisfaction, this strategy effectively smoothed the grid peak-valley difference, but did not study the probabilistic distribution of EV discharging to the grid. Literature (Dong et al., 2021) directly regulates the access of EVs to the grid from the perspective of the grid side to construct an economic dispatch model of the power system, with the satisfaction of the load-side car owners unconsidered, adversely promoting the enthusiasm of the V2G participation. Literature (Mahmud et al., 2018) uses the cross-entropy algorithm to solve the constructed load fluctuation model, which remains a single-objective optimization problem, ignoring the economic benefits of EV users and the load peak-valley difference after adjustment.
The above analysis indicates that most of the current research on the evaluation of the effect of V2G participation only considers traffic travel statistics and the response of the power grid separately, and it is difficult to accurately reflect the interaction between the EVs users and the power grid. Existing research has not comprehensively investigated multiple factors such as EVs user behaviors, preferences, and charging/discharging methods. V2G research based on EV user behavior and comprehensive consideration of grid-side load demand, user-side travel preferences and economic demand is rarely reported.
In order to solve the problem of the lack of accurate description of user behavior, this paper primarily collects EV driving data by conducting questionnaire surveys and searching for historical data. The impact of cluster charging/discharging on grid load is consequently analyzed. The EV charging/discharging behavior is simulated by Monte Caro method, and the influence of V2G on the original load curve under different scenarios is studied. The optimization model is established with the goal of minimizing the grid load variance and maximizing the charging/discharging revenues of EV users. Meanwhile, dispatching constraints are carried out according to the travel characteristics of EV users, and users are guided to discharge during peak periods of grid load and charge during valley periods. Finally, V2G under the microgrid in Shanghai is used as a case for verification. The genetic algorithm is used to obtain the Pareto optimal solution, and the optimization strategy of the electric vehicle cluster charging and discharging control is obtained. The behaviorally realistic model proposed for analyzing the effect of V2G participation essentially coordinates the user willingness and friendly operation of the power grid as a novel inspiration for future EV based energy storage systems. The structure of this paper is shown in Figure 1.
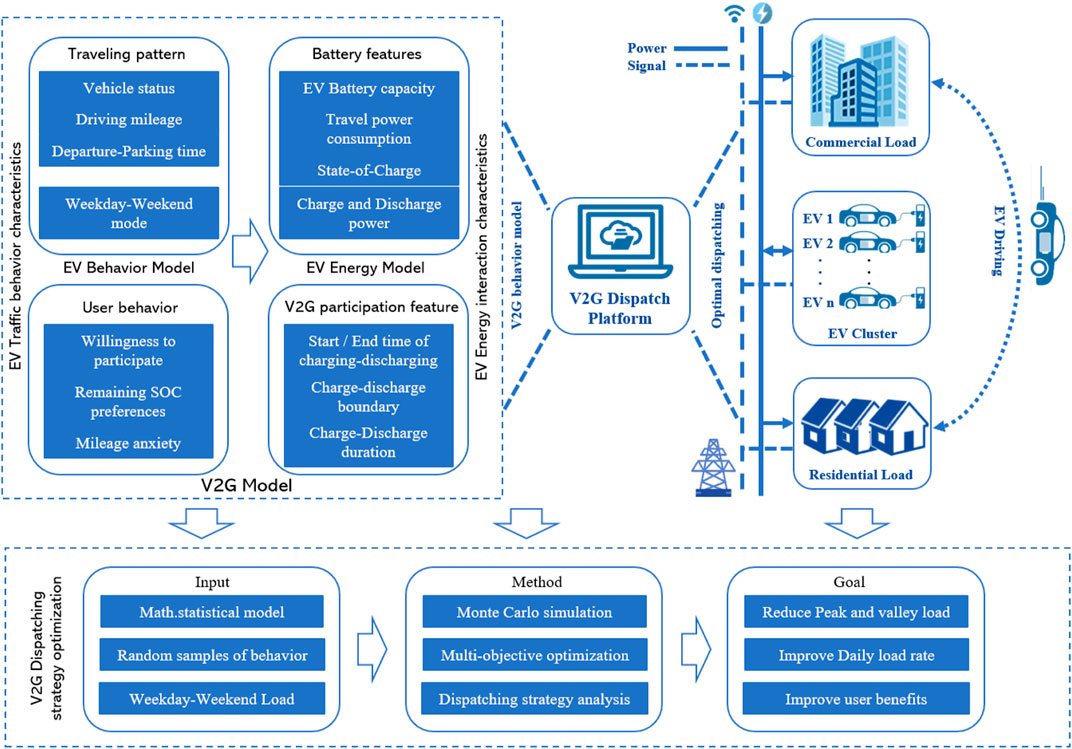
FIGURE 1. Research structure of V2G dispatching strategy based on behaviour model.
Figure 1 shows the research content and structure, including the V2G modeling solution based on user behavior and the V2G cluster scheduling platform under the regional microgrid An EV cluster refers to all EVs connected to the grid in a certain area as a whole. The dispatching platform summarizes the power status, power constraints and other information of all EVs through the monitoring system, and coordinates the load status dispatch of the regional microgrid. While considering the individual differences of users, the unified charge/discharge control of the EVs connected to the grid is carried out, and the power regulation tasks are consequentially allocated to the EVs. Meanwhile, the platform judges the charging/discharging behavior based on the feedback signal, so that the EV energy storage coordinately participates in the energy dispatching.
The research steps of this paper are: behavior investigation-simulation modeling-case verification. Introduction Section includes background and research background and literature review. Electric Vehicle Load Analysis Based on User Behavior Section establishes a V2G model that considers the behavior and energy characteristics of EVs through user investigation and data analysis. The V2G model includes behavior model and energy model, which reflect influencing factors such as user behavior, user preferences, and charging and discharging characteristics. Finally, in Vehicle to Grid Multi-objective Optimal Dispatching Considering Demand Response Section, Monte Carlo simulation and multi-objective evolutionary algorithm are used to optimize the V2G dispatching strategy.
Electric Vehicle Load Analysis Based on User Behavior
User Behavior Survey
The user behavior model of EVs mainly needs to consider factors such as daily driving mileage, initial departure time, driving-parking duration, mileage anxiety boundary and expected SOC. The parameter variable demand table is shown in Table 1.
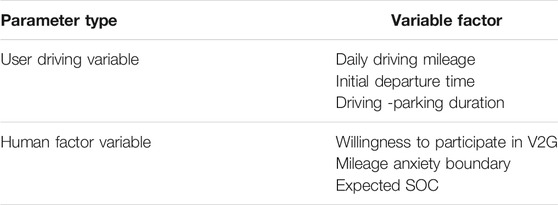
TABLE 1. Behaviour Model Variable factor.
At the same time, consider that EV users will face more specific scenarios, such as the travel time under different modes of weekday and weekend, V2G participation in decision-making under the psychological influence of mileage anxiety, and consideration of uncertain charging/discharging boundaries and so on, these factors will affect the characteristics of the user behavior (Dong et al., 2021). Therefore, uncertain descriptions of different user groups in different scenarios will have certain difficulties. For example, the estimation of charging time depends on the user’s mileage anxiety. Existing statistical information doesn’t provide data for users to participate in decision-making in the face of V2G, and it is impossible to know user preferences (Wolinetz et al., 2018).
In order to solve these problems, it is necessary to introduce preference survey in questionnaire design and data mining. The questionnaire survey method is also a research method based on experimental psychology (Wu et al., 2018). In order to study the willingness of EVs to participate in V2G, a questionnaire-based survey method was used to overcome the limitations of statistical methods (Geske and Schumann, 2018). At the same time, through the evaluation of psychological factors, the decision-making tendency of users is judged, and a behavior model reflecting the willingness of EV users to participate in grid operation is established. The establishment method of EV Behavior Model is shown in Figure 2.
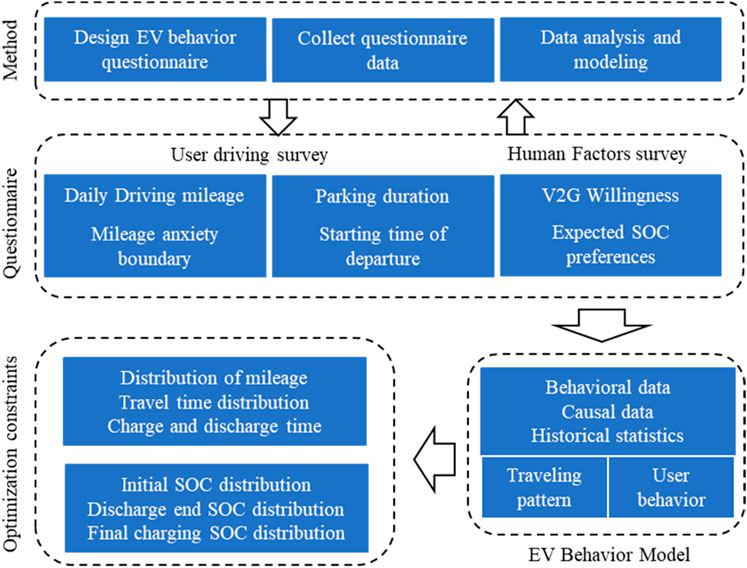
FIGURE 2. EV Behaviour Model based on questionnaire survey.
The questionnaire will mainly investigate the parameter variables required for model and simulation, including two parts: User Driving Variable and Human Factor Variable. Set the usage scenarios as weekday (home-company-home) and weekend (home-shopping mall-scenic area-home). The content of the questionnaire is shown in Table 2.
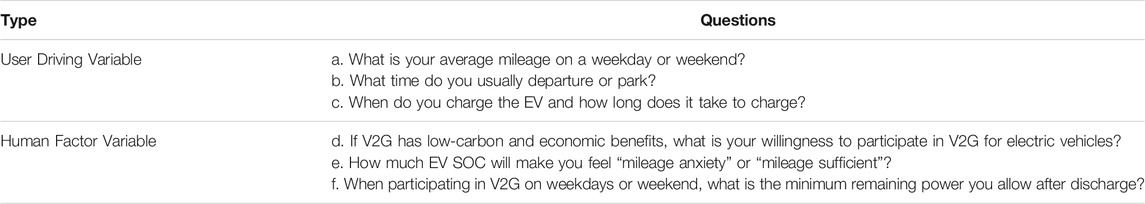
TABLE 2. EV user behaviour questionnaire.
Survey Results and Behavioral Models
A total of 380 questionnaires were distributed this time, including 320 valid questionnaires. The ratio of men to women in the questionnaire is close to 1:1, 52% are from Beijing, Shanghai, Shenzhen and other first-tier cities, and more than 94% have a university degree or above, which meets the needs of this survey on EVs. The quality of the survey is of reference value.
The survey mainly focuses on four parts: daily mileage, SOC psychological threshold, departure time and parking time, and expected SOC. Combined with NHTS traffic statistics, we can get the user behavior pattern model and the EV access probability model.
1) Daily mileage
Figure 3 shows the distribution of weekday and weekend mileage. The average weekday mileage is 35km, and the weekend average mileage is 126 km.
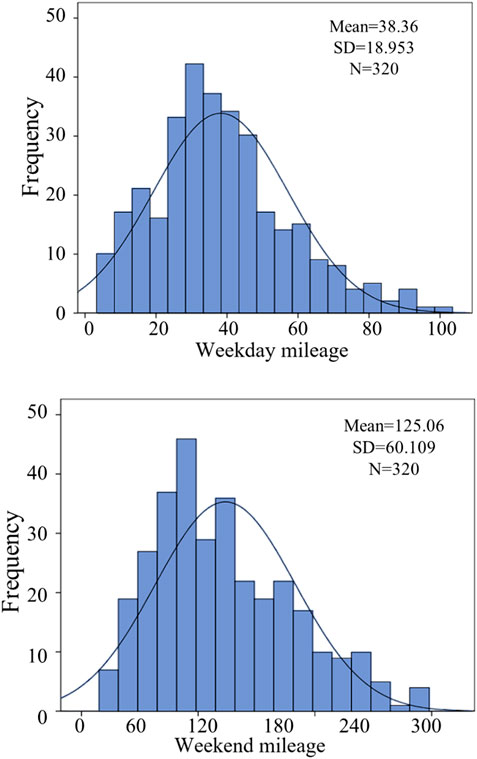
FIGURE 3. Distribution of mileage during weekday-weekend.
Compared with NHTS statistics, the survey data is relatively insufficient. It can be known that 14% of household vehicles in a single day are not used, 43.5% of them have a daily mileage of less than 30 km, 83.7% of them have a daily mileage of less than 100 km (Wei and Li, 2017). The daily mileage can be approximated to a lognormal distribution using the maximum likelihood estimation method. The probability density function of weekday-weekend mileage distribution is as follows:
The daily mileage model can estimate the parameters and η of the driving distribution of a single user based on the sample mean M and sample variance S.
In the weekday mode, the mean
After obtaining the probability distribution of the daily mileage, according to the assumption of power consumption and the assumption that the battery is full at the departure time, the probability distribution of the initial battery SOC of the EVs at the end of the trip can be further obtained (Lu et al., 2020).
2) SOC psychological threshold
In view of the different psychological factors of users facing different SOC levels, the questionnaire investigated the two variables of “mileage anxiety” and “mileage sufficient”, and obtained the charging and discharging choices that users tend to make at a certain SOC. It can be seen from Figure 4 that when the average SOC < 31.14%, the user will feel “mileage anxiety” and choose to look for charging; when the average SOC > 72.87%, the user will feel “mileage sufficient” and willing to participate in V2G. When the SOC is around 50%, it is in the critical stage of charging/discharging psychology, and SOC = 50% can be used as the critical judgment value for V2G participation, that is, when EV SOC >=50%, the discharge behavior can be selected.
3) Departure time and parking time
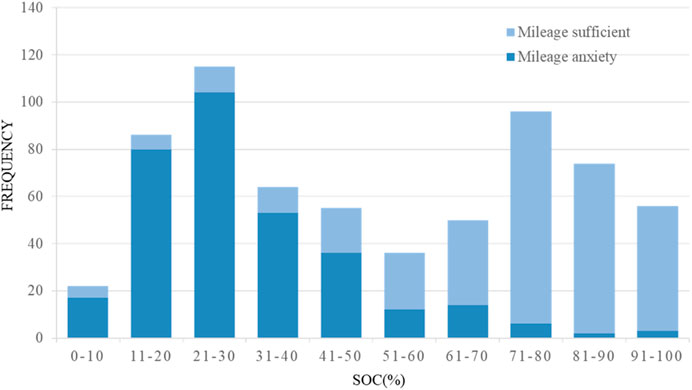
FIGURE 4. Psychological threshold of “mileage anxiety” or “mileage sufficient”.
According to the survey of departure time and parking time, it can be known that 22:00–6:00, 10:00–18:00 are EV stay periods, and 6:00–9:00 and 18:00–21:00 are EV travel periods, the distribution of departure time and parking time is shown in Figure 5.
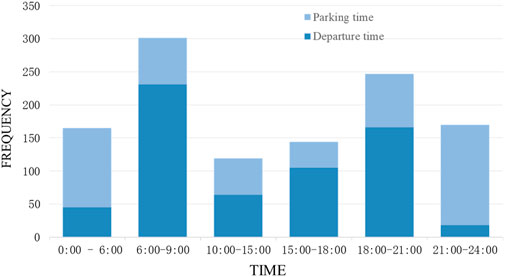
FIGURE 5. Distribution of departure time and parking time.
According to the literature (Ahmadi et al., 2020), the initial charging and discharging moments all follow a normal distribution, and the potential charging/discharging time period of users is consistent with the survey results. The specific option will be based on the user’s behavior decision. The probability density function at the beginning of charging - discharging is as follows:
With μt1 = 2; σt1 = 0.5
With μt2 = 12; σt2 = 0.5.
4) Expected SOC
At present, users’ willingness to participate in V2G cannot be obtained. Most of the previous studies have adopted the method of directly assuming the preset boundary, which is not completely consistent with the real situation. Therefore, this paper conducted a questionnaire survey on the lack of willingness to discharge boundaries and obtained the expected SOC distribution.
Analyzing the expected SOC, it can be concluded that the distribution law is shown in Figure 6. After inspection, it obeys the normal distribution. Among them, the weekday travel trajectory is simple and has a large discharge margin, which obeys the normal distribution near 47%; the weekend obeys the normal distribution near 52%. The probability density function of Expected SOC is as follows.
With μe1 = 47.2; σe1 = 1.65
With μe2 = 52.0; σe2 = 1.61.
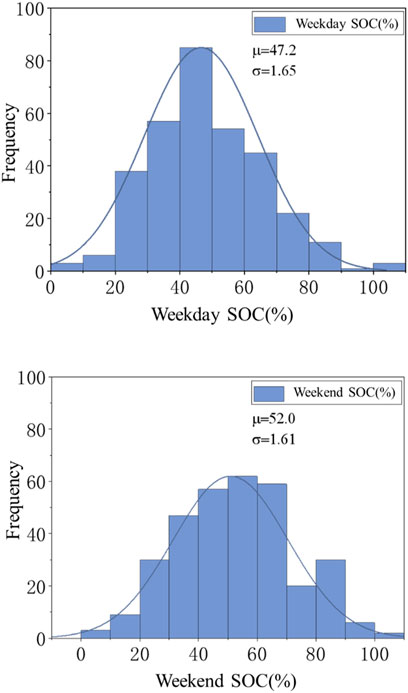
FIGURE 6. Remaining SOC distribution after discharge.
Electric Vehicle Charging and Discharging Model
1) EV travel characteristics
The travel characteristics of EVs mainly include travel mileage, travel time, charging and discharging time, etc. This paper mainly according to the electric vehicle travel law, set 6:00 in the morning as the travel time, 17:00 in the afternoon as the return time, driving distance is equal. The random array of mileage is obtained from the statistical data. According to the data of national household travel survey (NHTS) (González-Garrido et al., 2019), the daily driving distance of EVs meets the lognormal distribution. Then the probability density function of daily driving distance is taken as follows.
Where: μm = 4.2; σm = 0.75.
After obtaining the probability distribution of daily mileage, according to the assumption of power consumption R
2) EV cluster load
The load curve of cluster EVs in the region can be obtained by accumulating the charging and discharging behaviors of all EVs. The time interval was set as 1 hour, and the load curve of 1 day was observed. The total power of charging and discharging at time t can be expressed by the following formula:
Where:
3) State of charge (SOC)
The state of charge (SOC) of EV refers to the current state of residual power of its power battery. The SOC of electric vehicle is an important parameter to evaluate the V2G load capacity of electric vehicle. It can have starting or ending power to calculate the real-time residual power of battery. The real-time SOC change of electric vehicle battery can be expressed as follows:
Where:
Where: EV state coefficient is determined by the time, considering the EV user’s daily driving law, morning: residential commercial area, afternoon: commercial residential area;
Vehicle to Grid Load Analysis Based on Monte Carlo
Monte Carlo Simulation
This paper uses the V2G Model and Monte Carlo method to simulate grid operation under the charging and discharging of EVs with V2G in Shanghai. Assuming that the charging and discharging time and power of each EV are not affected by other EVs. Based on the Monte Carlo sampling method, according to the random probability distribution of each electric vehicle’s driving conditions, battery characteristics, and expected SOC preferences (González-Garrido et al., 2019; Lu et al., 2020). Generate the corresponding random number to get the daily load curve of a single electric vehicle, and add up the electric vehicle load curve to get the total load curve, the Monte Carlo simulation flow chart is shown in Figure 7.
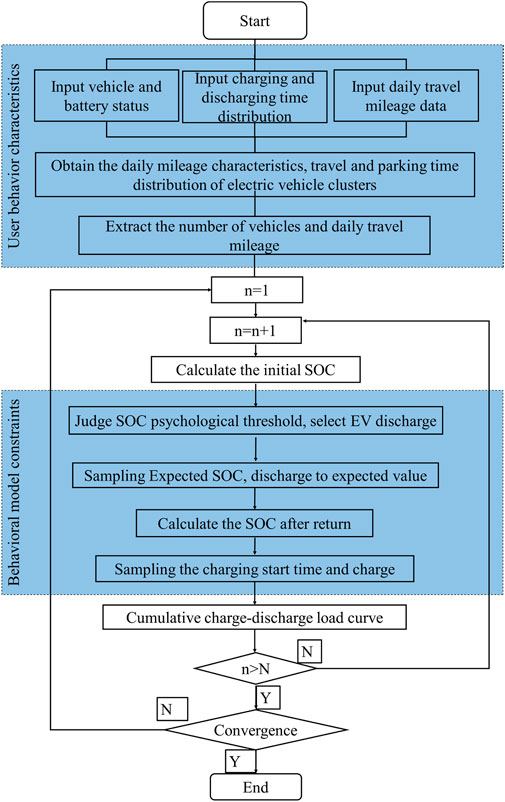
FIGURE 7. Monte Carlo simulation flow chart.
Case Analysis
Taking Shanghai EV load regulation as an example, the scale of EVs in Shanghai in 2020 will be 300,000. The influence of regional load curve charging behavior on load is analyzed: the influence of different V2G scales and conditions on the grid load is compared. According to the EV driving data statistics and user behavior questionnaire survey, the peak load time distribution during the day coincides with the vehicle travel time. Therefore, if orderly controlled charging behavior is not adopted, large-scale disorderly charging will bring more pressure to the grid load. Further expanding the peak-to-valley load difference is not conducive to the economic and stable operation of the power grid. However, if the residence time of the EV is effectively used, the cluster V2G control mode is adopted to uniformly regulate the charging and discharging behavior of the connected EV. Set the EV to charge in an orderly manner during the low load at night after returning home, and during the daytime peak period, make full use of the energy of the EV battery and reverse discharge the expected SOC to the grid under the premise of meeting subsequent travel and user preferences, which support peak load operation and realize the purpose of peak shaving and valley filling.
The EV will be equipped with a 60 kWh battery, which consumes 15 kWh per hundred kilometers. Set the parameter R to be the participation rate of electric vehicle V2G, and take the participation rate R to be 0, 0.3, and 0.7, respectively. The remaining parameters are determined by the research results in Table 3.
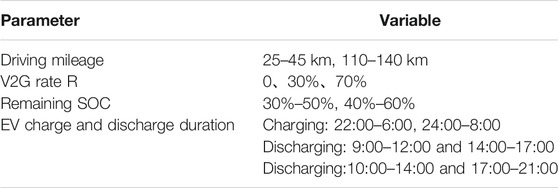
TABLE 3. V2G simulation parameters and variables.
Simulation Results
According to Monte Carlo simulation of the cluster charging and discharging behavior of 300,000 EVs, EVs in the region are connected to the V2G platform, which can perform unified charging and discharging control of the connected vehicles, and adjust the peak and valley load of the Shanghai regional power grid. The control strategy will be determined according to the actual state information of the vehicle. The user travels at 8:00 and goes home at 17:00. The charging and discharging can be carried out when not driving. The depth of discharge is obtained from the expected SOC distribution investigated in the previous section. By superimposing the charge and discharge power of all vehicles, the total V2G load can be calculated, and finally the comparison of the grid load curves before and after EV participation is obtained. In addition, setting V2G participation rates of different scales can achieve the effect of load regulation by EVs of different scales.
For the different modes of workdays and weekends, the load regulation after the participation of V2G is simulated, and the optimization curve effect is as Figure 8, Figure 9 shows.
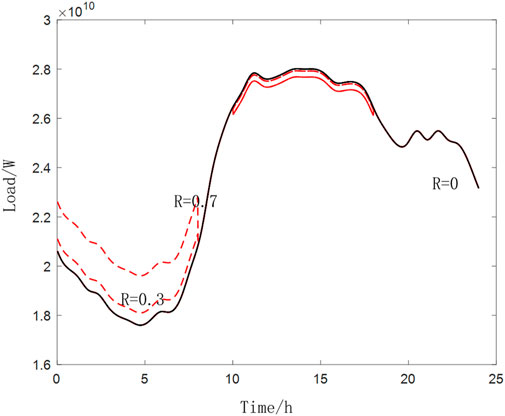
FIGURE 8. Load curve of different V2G participation rates in workday mode.
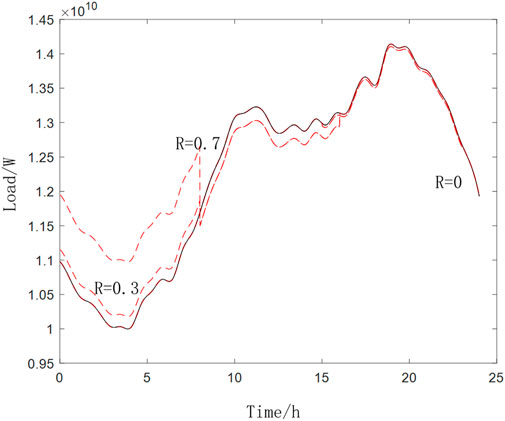
FIGURE 9. Load curves of different V2G participation rates in holiday mode.
It can be seen from Figure 8 that in the working day mode, when the V2G participation rate R = 70%, the peak load during the day is 27685.73 MW, which is a decrease of 326.34MW, and the valley load at night is 19607.23 MW, which is an increase of 2007.41 MW, and the peak and valley load throughout the day The difference has been changed from 37.17 to 29.18%, a decrease of 7.99%, and the daily load rate increased by 3.02–87.63%
It can be seen from Figure 9 that in the weekend mode, when the V2G participation rate R = 70%, the peak load during the day is 14140.67 MW, the valley load at night is 10,974.57MW, an increase of 975.79 MW, and the peak-to-valley load difference changes from 29.29 to 29.29%. 22.39%, a decrease of 6.9%, and a daily load rate of 88.75%, an increase of 1.83% compared to before the regulation.
The results show that in the load regulation, in the working day mode, the peak-to-valley load difference can be reduced by up to 7.99%, and the daily load utilization rate can be increased by 3.02%. When the V2G participation rate increased from 30 to 70%, the increase of 40% participation rate reduced the peak-to-valley load difference by 6 and 5.4%, and the daily load utilization rate also increased by 2.27 and 1.27%, respectively.
From the above simulation results, it can be seen that after V2G regulation, the grid load at night is more evenly distributed under the adjustment of the cluster charging, and the EV cluster during the day peak period reduces the pressure on the grid through discharge, which can stabilize the load fluctuation effect. Therefore, it can be stated when the charging and discharging of electric vehicle clusters are under unified control and management, it can effectively smooth the daytime load peaks and valleys of the power grid.
Vehicle to Grid Multi-objective Optimal Dispatching Considering Demand Response
Multi-Objective Optimization Model
Multi-Objective Function
1) Objective 1: Minimum load variance
The objective of grid side optimization mainly considers the fluctuation of daily load curve. Load mean square deviation can be used to characterize the fluctuation of grid load. The smaller the mean square deviation is, the more stable the load change is. One day is divided into 24 time periods, and the charge and discharge power of each electric vehicle in each period is the control variable. When EVs participate in peak load reduction and valley filling, they should focus on discharging at peak load and charging at low load to reduce peak valley difference. The objective function is to minimize the variance of daily load curve:
Where:
2) Objective 2: Maximum revenue for EV users
The user side optimization target mainly considers the economy of EV users. Considering the loss cost of V2G to battery attenuation, users can obtain profits by charging at low price and discharging at high price (González-Garrido et al., 2019; Wei et al., 2021). The overall objective is determined by the profits of all users. The objective function of maximizing the profits of single day users participating in V2G response is as follows:
Where:
At the same time, considering the cost loss caused by the attenuation of the battery capacity, the damage cost rb needs to be taken into consideration. The battery capacity Eev is 60 kW, k is the number of cycles that can be used when the battery decays to 80% of its life (3,000 times), and the influence coefficient ξ = 0.8. Therefore, from the formula rb = M/ξk, the loss cost rb = 0.62 yuan/kWh.
Constraint Conditions
1) Load fluctuation constraints of power grid
Considering that the fluctuation of power system is controlled by various indicators, excessive load fluctuation in a short time will affect the system frequency, which is not conducive to the stability of the system. When the sampling point of
Where:
2) EV charging and discharging power constraint
Where:
3) SOC constraint
Where:
4) V2G termination constraints
In this paper, the user travel demand is specially restricted, so that the electric vehicle can meet the user’s return demand after participating in V2G discharge. Then the discharge state
Where:
Genetic Algorithm Optimization
This paper presents a multi-objective optimization method for EVs to participate in V2G with the consideration of user demand response, so as to minimize the load variance and maximize the user profits. Usually, this kind of multi-objective optimization problem is to make multiple objective functions tend to be optimal under a set of constraints (Geske and Schumann, 2018; Wolinetz et al., 2018).
Where: n is the number of objective functions; Q and J are the number of equality constraints and inequality constraints respectively.
When the multi-objective genetic optimization algorithm is used to solve the charging and discharging power of EVs in an 1 hour period (i.e., the day time is split as 24 points for each EV to charge/discharge), the charging and discharging power of each EV in each period is taken as the position coordinate, and the dimension is 24*n (n is the number of EVs):
The mutation and crossover manipulation are implemented by using built-in function mutationadaptfeasible and crossoverintermediate in MATLAB (2021a, MATHWORKS, MA, USA), respectively. The population size, evolutionary generation, constraint tolerance and objective function tolerance is 200, 1,000,
Analysis of Vehicle to Grid Multi-Object Dispatching Cases
This paper takes the power load of a city and the participation of EVs as an example, and then the optimization model is simulated and solved by MATLAB platform. Considering the random uncertainty of EV user characteristics, this paper calculates the value according to five typical characteristics of EV driving mileage, including daily short distance and medium distance travel of 30–180 km. Case parameters are shown in Table 4.

TABLE 4. case parameters.
According to the electricity price of the Shanghai power grid, the EV charging and discharging electricity price in this simulation can be set,:The Peak time (8:00–12:00, 18:00–21:00) price is 1.074 yuan/kWh, the Valley time (23:00–6:00) price is 0.316 yuan/kWh, and the Normal time (6:00–8:00, 12:00–18:00, 21:00–13:00) price is 0.671 yuan/kWh. Meanwhile, Considering the random uncertainty of EV user characteristics, this paper selects five typical travel distance types as the research objects, including daily short distance and long-distance travel of 30–180 km, sets the number of EV participating in V2G as 500, and the mileage and quantity parameters are shown in Table 5.
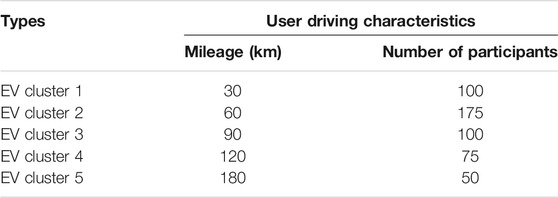
TABLE 5. Typical value of EV mileage.
Through the simulation calculation of the multi-objective genetic optimization algorithm, the optimization result Pareto distribution is shown in Figure 10. Pareto distribution represents the coordination of the two objective functions of grid load variance and electric vehicle user income. It can be seen that the distribution is uniform and stable, which verifies the feasibility of Pareto optimization to solve the multi-objective problem (Lu et al., 2020).
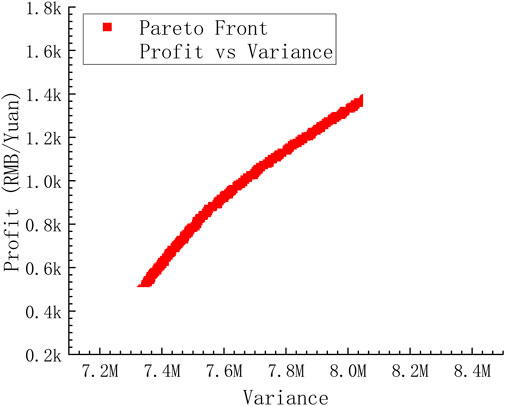
FIGURE 10. Pareto Front-Profit vs Variance.
The optimization results are closer to the actual situation, because the charging and discharging options of EVs can correspond to the time-of-use electricity price. When the grid load peaks, the price of electricity will increase, charging will decrease and discharge will increase, and revenue will increase. When the grid load is low, the price of electricity will decrease, charging will increase and discharge will decrease, and profit will decrease.
It can be seen from the Pareto Front distribution curve that the minimum variance of the grid load and the maximum revenue of electric vehicle users are difficult to achieve the optimal at the same time, and the revenue will decrease when the variance decreases. However, the distribution of the optimal solution set is relatively concentrated and the range of change is small, which can explain the multi-objective optimization problem and achieve consistency in overall regulating. There is a positive correlation between the level of time-of-use electricity price and load peaks and valleys. In the process of peak shaving and valley filling, the variance is reduced and the income is maximized.
Therefore, it can be explained that after considering the needs of both the grid side and the user side, the Pareto solution set is obtained by the genetic algorithm to form a multi-objective optimal charging and discharging regulating strategy for EVs.
The optimized result graph and table are as follows. Table 6 and Figure 11 show the changes of grid load after EV participation. It can be seen that when V2G participates in power grid load regulation, 1) daytime peak load decreases by 0.7 MW; nighttime valley load increases by 0.2 MW; 2) whole day peak valley load difference changes from 34.24 to 31.25%, reducing by 2.99%; 3) daily load rate increases by 1.49%; 4) while user income can reach 1630-yuan, power grid load variance decreases by 9.52%.
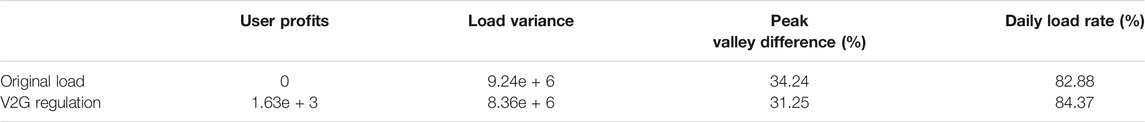
TABLE 6. Comparison of power grid load changes with V2G participation.
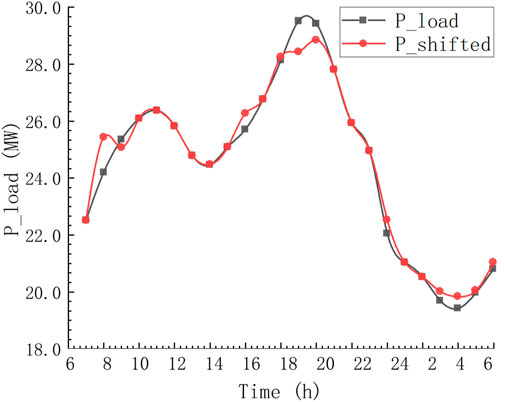
FIGURE 11. Comparison of power grid load changes with V2G participation.
Comparison of Vehicle to Grid Response Under Different Electricity Price Modes
In the user-side load regulation of the power system, electricity price response is an important form of demand response. Research has shown that the use of time-of-use electricity prices for off-peak power consumption can effectively reduce the burden on the grid and greatly save costs for each EV user. Due to the difference in electricity prices, the charging and discharging preferences of vehicle users are also different, so it is necessary to consider the impact of electricity price fluctuations on the optimization results (Clairand et al., 2020; Li et al., 2020). Therefore, in order to facilitate the formation of a more complete electricity price policy theory, sensitivity analysis of peak and valley electricity price fluctuations is needed.
Time-of-use price (time-of-use price) refers to the establishment of three electricity price modes at different times of peak, normal, and valley to the load conditions of the power grid, so as to guide users’ charging-discharging behavior and reduce the load on the grid. The time-of-use electricity price model is shown in Figure 12. Mode 0 is the current Time-of-use electricity price in Shanghai. The Peak time price is 1.074 yuan/kWh, the Valley time price is 0.316 yuan/kWh, and the Normal time price is 0.671 yuan/kWh. This section compares the current tiered electricity prices in Shanghai with the 30% (Mode 1) and 60% (Mode 2) increase in V2G subsidized electricity prices, which is used as the charging or discharging price for EV users.
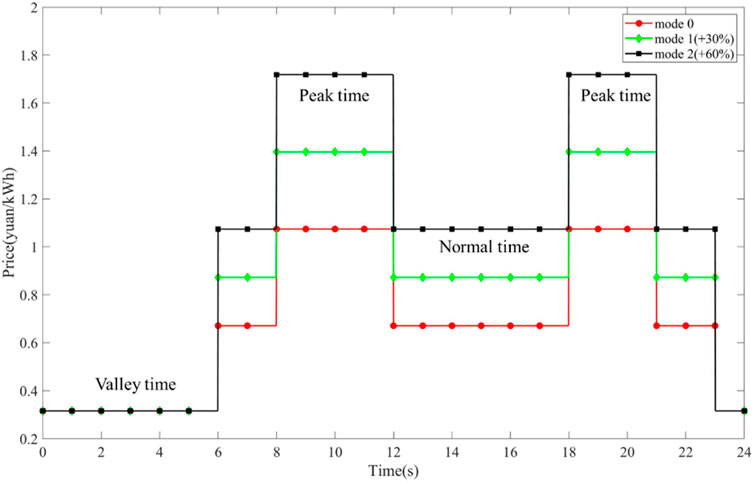
FIGURE 12. The time-of-use electricity price model.
After simulation verification, the following results can be obtained. Figure 13 shows the charge and discharge power distribution of EV users under different electricity price modes. It can be seen from the optimization solution that the correlation between electricity price and V2G participation is not significant, but in the multi-objective game that solves the minimum variance of grid load and the maximum user economic benefit, the time-of-use electricity price guides users’ charging and discharging behaviors, realizing charging during the low load period at night, and discharge during the peak load period during the day. The optimal strategy for charging during the trough period.
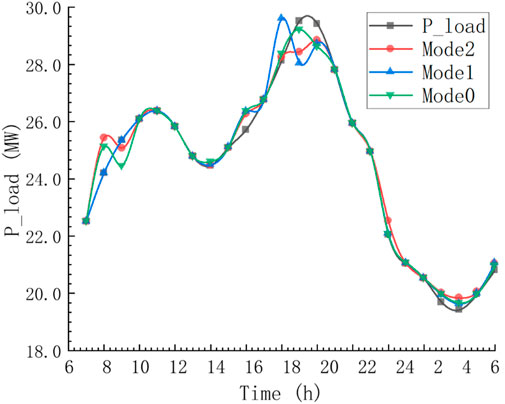
FIGURE 13. Grid load changes in response to different electricity price modes.
The economic sensitivity of EV users is different, so under a variety of electricity price modes, there will be different charging and discharging decisions. Figure 14 shows the optimization results of electric vehicle user income and load variance under different electricity price modes. The figure shows the changes in user income and load variance in response to different electricity price modes. With the increase in V2G subsidized electricity prices, user income has increased significantly, from 800 yuan under the original electricity price model response to 1,630 yuan under the 60% subsidy. An increase of 50.92%. At the same time, the load variance does not decrease linearly when the electricity price increases. Compared with the response to Mode0, the variance increases by 0.82% when the electricity price is Mode1, while the variance is reduced by 1.76% when the electricity price is Mode2.
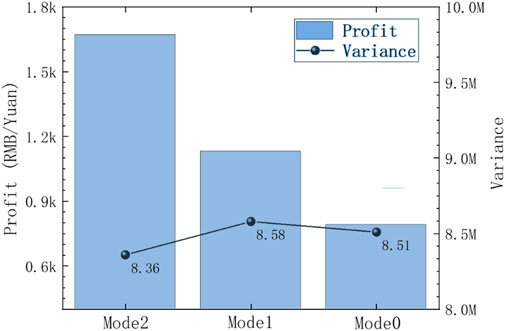
FIGURE 14. User revenue vs load variance under different electricity price models.
The analysis shows that with the increase in the price of the time-of-use electricity, the peak and valley electricity prices, the user’s income will increase. Compared with the V2G response under the existing tiered electricity price model in Shanghai, it shows a positive correlation trend. However, the variance of the grid load is not the same as the income. A slight increase will increase the variance of the grid load, and after the electricity price is raised again, the variance can be reduced. Therefore, it can be shown that the charging and discharging behaviours of electric vehicle users are affected by the fluctuation of electricity prices, and their economic benefits can be maximized during peak load periods and charging during trough periods. At the same time, it can reduce the variance of grid load through demand response and improve the goal of stable grid operation.
Conclusion
In conclusion, this paper studies the V2G mode based on the user behavior characteristic by Monte Carlo simulation, the influence of the charging and discharging process of EVs on the load characteristics of the power grid is simulated and analyzed, finally the V2G cluster dispatching strategy considering the demand response of the grid side and the user side is obtained through optimization calculation.Conclusion
The optimization of V2G dispatching strategy can get the following results: When the V2G participation rate increases by 40%, the peak-to-valley load difference will be reduced by 6% respectively, and the daily load utilization will increase by 2.27%. After adding the time-of-use electricity price incentive method, this strategy can stabilize grid load fluctuations and increase the profit of EV users. It achieves the regulating effect of reducing the peak-to-valley load difference of the whole-day grid by 2.99%, increasing the daily load rate by 1.49%, and reducing the variance of the grid load by 9.52%. The goal of peak-shaving and valley-filling under the balance between the power grid and the needs of users on both sides is completed.
It can be seen that V2G participation in grid load dispatching will be possible to effectively reduce the daily peak-to-valley difference and increase the grid daily load rate while suppressing load fluctuations, which will significantly stabilize the grid daily load curve. At the same time, through the multi-objective optimization algorithm, the simulation analysis of EV charging and discharging participating in the grid load dispatching is carried out. Finally, the optimal dispatch strategy can be obtained, which can increase the income of electric vehicle users while stabilizing the fluctuation of the grid load.
In this paper, in order to carry out quantitative comparative analysis, some assumptions are used to make EV user data more random and improve the authenticity of the model. The following papers will enrich the model data and improve the optimization algorithm to get higher quality results.
Data Availability Statement
The raw data supporting the conclusion of this article will be made available by the authors, without undue reservation.
Author Contributions
Conceptualization and methodology, TL; software: ST and KH; modeling: TL, BY, and BX; validation: ML; writing—original draft preparation: TL, KH, and ST; writing—review and editing, TL and ST; supervision: YS; project administration: YS
Funding
This research was funded by the National Key Research and Development Program of China (Grant No. 2019YFB2103200 and No. 2018YFB1500904).
Conflict of Interest
ML was employed by the company State Grid Zhejiang Electric Power Co., Ltd.
The remaining authors declare that the research was conducted in the. absence of any commercial or financial relationships that could be. construed as a potential conflict of interest.
Publisher’s Note
All claims expressed in this article are solely those of the authors and do not necessarily represent those of their affiliated organizations, or those of the publisher, the editors and the reviewers. Any product that may be evaluated in this article, or claim that may be made by its manufacturer, is not guaranteed or endorsed by the publisher.
References
Ahmadi, S., Arabani, H. P., Haghighi, D. A., Guerrero, J. M., Ashgevari, Y., and Akbarimajd, A. (2020). Optimal Use of Vehicle-To-Grid Technology to Modify the Load Profile of the Distribution System. J. Energ. Storage 31, 101627. doi:10.1016/j.est.2020.101627
Clairand, J. M., Rodríguez-García, J., and Álvarez-Bel, C. (2020). Assessment of Technical and Economic Impacts of EV User Behavior on EV Aggregator Smart Charging. J. Mod. Power Syst. Cle 8 (2), 356–366. doi:10.35833/MPCE.2018.000840
Dong, L., Wang, C., Li, M., Sun, K., Chen, T., and Sun, Y. (2021). User Decision-Based Analysis of Urban Electric Vehicle Loads. CSEE J. Power Energ. Syst. 7 (1), 190–200. doi:10.17775/CSEEJPES.2020.00850
Geske, J., and Schumann, D. (2018). Willing to Participate in Vehicle-To-Grid (V2G)? Why Not!. Energy Policy 120, 392–401. doi:10.1016/j.enpol.2018.05.004
González-Garrido, A., Thingvad, A., Gaztañaga, H., and Marinelli, M. (2019). Full-scale Electric Vehicles Penetration in the Danish Island of Bornholm-Optimal Scheduling and Battery Degradation under Driving Constraints. J. Energ. Storage 23, 381–391. doi:10.1016/j.est.2019.03.025
Jian, L. (2020). An Analysis on the Application Potential and Position of Electric Vehicle Energy Storage. J. Glob. Energ. Interconnection 000 (001), 44–50. doi:10.19705/j.cnki.issn2096-5125.2020.01.005
Kempton, W., and Tomić, J. (2005). Vehicle-to-Grid Power Implementation: From Stabilizing the Grid to Supporting Large-Scale Renewable Energy. J. Power Sourc. 144 (1), 280–294. doi:10.1016/j.jpowsour.2004.12.022
Leonori, S., Rizzoni, G., Frattale Mascioli, F. M., and Rizzi, A. (2021). Intelligent Energy Flow Management of a Nanogrid Fast Charging Station Equipped with Second Life Batteries. Int. J. Elec Power 127, 106602. doi:10.1016/j.ijepes.2020.106602
Li, X., Tan, Y., Liu, X., Liao, Q., and Wang, Z. (2020). A Cost-Benefit Analysis of V2G Electric Vehicles Supporting Peak Shaving in Shanghai. Electr. Pow Syst. Res. 179, 106058. doi:10.1016/j.est.2020.101627
Lu, Z., Zhang, Q., Yuan, Y., and Tong, W. (2020). Optimal Driving Range for Battery Electric Vehicles Based on Modeling Users' Driving and Charging Behavior. J. Adv. Transportation 2020 (3), 1–10. doi:10.1155/2020/8813137
Mahmud, K., Jahangir Hossain, M., and Town, G. E. (2018). Peak-Load Reduction by Coordinated Response of Photovoltaics, Battery Storage, and Electric Vehicles. Ieee Access 6, 29353–29365. doi:10.1109/ACCESS.2018.2837144
Qian, K., Zhou, C., Allan, M., and Yuan, Y. (2011). Modeling of Load Demand Due to EV Battery Charging in Distribution Systems. IEEE Trans. Power Syst. 26 (2), 802–810. doi:10.1109/tpwrs.2010.2057456
Salehpour, M. J., and Tafreshi, S. M. M. (2020). Contract-Based Utilization of Plug-In Electric Vehicle Batteries for Day-Ahead Optimal Operation of a Smart Micro-Grid. J. Energ. Storage 27, 101157. doi:10.1016/j.est.2019.101157
Sangob, S., and Sirisumrannukul, S. (2021). Optimal Sequential Distribution Planning for Low-Voltage Network with Electric Vehicle Loads. Front. Energ. Res. 9, 407. doi:10.3389/fenrg.2021.673165
Soares, J., Fotouhi Ghazvini, M. A., Vale, Z., and de Moura Oliveira, P. B. (2016). A Multi-Objective Model for the Day-Ahead Energy Resource Scheduling of a Smart Grid with High Penetration of Sensitive Loads. Appl. Energ. 162, 1074–1088. doi:10.1016/j.apenergy.2015.10.181
Toquica, D., De Oliveira-De Jesus, P. M., and Cadena, A. I. (2020). Power Market Equilibrium Considering an EV Storage Aggregator Exposed to Marginal Prices - A Bilevel Optimization Approach. J. Energ. Storage 28, 101267. doi:10.1016/j.est.2020.101267
Xiao, H., Wei, P., and Li, K. (2017). Multi-Objective Optimization Scheduling Method for Active Distribution Network with Large Scale Electric Vehicles. Trans. China Electrotechnical Soc. 32 (S2), 179–189. doi:10.19595/j.cnki.1000-6753.tces.L70199
Wei, W., Ramakrishnan, S., Needell, Z. A., and Trancik, J. E. (2021). Personal Vehicle Electrification and Charging Solutions for High-Energy Days. Nat. Energ. 6 (1), 105–114. doi:10.1038/s41560-020-00752-y
Wolinetz, M., Axsen, J., Peters, J., and Crawford, C. (2018). Simulating the Value of Electric-Vehicle-Grid Integration Using a Behaviourally Realistic Model. Nat. Energ. 3 (2), 132–139. doi:10.1038/s41560-017-0077-9
Wu, J., Xue, Y., Xie, D., Li, K., Wen, F., Zhao, J., et al. (2018). Multi-agent Modeling and Analysis of EV Users' Travel Willingness Based on an Integrated Causal/statistical/behavioral Model. J. Mod. Power Syst. Clean. Energ. 6 (6), 1255–1263. doi:10.1007/s40565-018-0408-2
Xing, Q., Cheng, M., Liu, S., Xiang, Q., Xie, H., and Chen, T. (2021). Multi-Objective Optimization and Dispatch of Distributed Energy Resources for Renewable Power Utilization Considering Time-Of-Use Tariff. Front. Energ. Res. 9, 68. doi:10.3389/fenrg.2021.647199
Xiong, L., Liu, X., Zhang, D., and Liu, Y. (2020). Rapid Power Compensation Based Frequency Response Strategy for Low Inertia Power Systems. Ieee J. Em Sel Top. 9, 4500–4513. doi:10.1109/JESTPE.2020.3032063
Xiong, L., Liu, X., Liu, Y., and Zhuo, F. (2020). Modeling and Stability Issues of Voltage-Source Converter Dominated Power Systems: A Review. CSEE J. Power Energ. Syst. 9, 1–18. doi:10.17775/CSEEJPES.2020.03590
Xue, P., Xiang, Y., Gou, J., Xu, W., Sun, W., Jiang, Z., et al. (2021). Impact of Large-Scale Mobile Electric Vehicle Charging in Smart Grids: A Reliability Perspective. Front. Energ. Res. 9, 241. doi:10.3389/fenrg.2021.688034
Zechun, H., Yonghua, S., Zhiwei, X., Zhuowei, L., Kaijiao, Z., and Long, J. (2012). Impacts and Utilization of Electric Vehicles Integration into Power Systems. Proc. CSEE 32 (4), 1–10. doi:10.13334/j.0258-8013.pcsee.2012.04.006
Zeng, B., Sun, B., Mu, H., Wang, Y., Wei, X., and Wang, L. (2021). Comprehensive Benefit/Cost Analysis of Utilizing PEV Parking Lots as Virtual Energy Storage for the Energy Supply Sustainability of Future Distribution Systems. Front. Energ. Res. 9, 203. doi:10.3389/fenrg.2021.686890
Keywords: V2G, user behavior, Monte Carlo simulation, grid load dispatching, multi-objective optimization
Citation: Li T, Tao S, He K, Lu M, Xie B, Yang B and Sun Y (2021) V2G Multi-Objective Dispatching Optimization Strategy Based on User Behavior Model. Front. Energy Res. 9:739527. doi: 10.3389/fenrg.2021.739527
Received: 11 July 2021; Accepted: 13 August 2021;
Published: 13 September 2021.
Edited by:
Liansong Xiong, Nanjing Institute of Technology (NJIT), ChinaReviewed by:
Xiong Wu, Xi’an Jiaotong University, ChinaStefano Leonori, Sapienza University of Rome, Italy
Copyright © 2021 Li, Tao, He, Lu, Xie, Yang and Sun. This is an open-access article distributed under the terms of the Creative Commons Attribution License (CC BY). The use, distribution or reproduction in other forums is permitted, provided the original author(s) and the copyright owner(s) are credited and that the original publication in this journal is cited, in accordance with accepted academic practice. No use, distribution or reproduction is permitted which does not comply with these terms.
*Correspondence: Yaojie Sun, eWpzdW5AZnVkYW4uZWR1LmNu