 Hongxia Wang
  Bo Wang 1*
 Fuqi Ma
 - 1School of Electrical Engineering and Automation, Wuhan University, Wuhan, China
- 2School of Computer and Artificial Intelligence, Wuhan Textile University, Wuhan, China
- 3New Energy (Photovoltaic) Industry Research Center, Qinghai University, Xining, China
Polluted insulators seriously threaten the safe and stable operation of power grids, which attaches great significance to insulator contamination perception. Among the present methods, the non-contact approaches based on infrared images have gradually been widely used, as they are much more safe and are of low cost. However, the thermal effect of insulators is largely affected by meteorological conditions, which makes the infrared image-based methods less accurate. To solve the above problem, we take infrared image and meteorological parameters including humidity and temperature as input, and propose a feature fusion model to perceive insulator contamination in different weather conditions. Firstly, different feature extraction networks are used to perform feature extraction on the two types of data; secondly, the two features are concatenated to fuse together; thirdly, further feature extraction is performed and contamination is classified according to the pollution severity. Case studies show that the proposed method can better explore the relationship between humidity, temperature and pollution level of the insulators, thus can better separate the contamination grades and outperform the conventional infrared image based methods.
1 Introduction
Functioning as electrical insulation and mechanical support, outdoor insulators play an important role in power systems (He et al., 2006). However, with the increasing pollution caused by gas emissions from factories and cars, bad weather like fog-haze, rain and snow conditions, the insulators are contaminated more severe and are more easily and frequently to flashover (Fofana et al., 2020; 3, 2020; Dong et al., 2014; Liu et al., 2020), which can seriously endanger the safe and stable operation of power grids, and even cause huge economic losses. Therefore, it is necessary to perceive the pollution level of insulators and take measures in time.
There are mainly two kinds of contamination perception methods for insulators: contact methods and non-contact methods (Jin et al., 2017). The contact ones include leakage current (Banik et al., 2016; Wang et al., 2019; Salem et al., 2020), surface conductivity (Wang et al., 2017; Zhong et al., 2018), ESDD (Equivalent Salt Deposit Density) (Cao et al., 2019) and so on. Generally speaking, the above approaches have clear physical meaning and are relatively accurate. However, they often require online monitoring equipments with large quantity and high prices, what’s more, some of the equipments need to be implemented in power off situation. Based on the acoustic, discharge and heat phenomenon of polluted insulators in some cases, non-contact methods including infrared images (Zhao et al., 2017), ultraviolet images (Zhao et al., 2017) and (Liu et al., 2021) photothermal radiometry are increasingly applied to insulator contamination perception, because of their advantages of safety and immunity to electromagnetic interference.
Among those non-contact approaches, the infrared image-based ones are mostly used because of their low costs. From the perspective of the elements they consider, these methods can be divided into two kinds: 1) those based on infrared images only; 2) those based on infrared images and meteorological parameters.
For contaminated insulators, the leakage current on their surfaces will increase under wet conditions, and the more severe the contamination, the greater the leakage current, which can be detected through infrared images. As a result, there are many methods perceiving insulator pollution based on infrared images. In Zhao et al. (2017), the authors analyze insulator contamination through the combination of infrared images shot in different angles—to deal with the limitations caused by angle diversification. In addition, to cope with the limitation of manually-designed features, they use Deep Convolutional Neural Networks (DCNNs) to automatically extract features. Jiang and Xia (2010) study the influence of contamination on deteriorated insulators, and conclude that the infrared image based methods are capable of detecting polluted deteriorated insulators in high-voltage. However, these methods lack the consideration of meteorological parameters, which can influence the temperature distribution of the contaminated insulators, to be specific, the same polluted insulator may behave differently in infrared images under different humidity.
The temperature distribution of infrared images depends on both contamination level and meteorological parameters, thus the methods consider both these two factors can be more generalized and accurate. Based on the color features extracted from infrared images and relative humidity, He et al. (2019) accomplish contamination level detection using Radial Basis Function Neural Network (RBFNN); For a contaminated insulator, its infrared images can give contamination information when it in wet conditions, while the visible images are valid to detect contamination level when it in dry conditions. Therefore, Jin et al. (2018) fuse the infrared and visible images to cope with the impact of humidity on non-contact methods. However, the above two kinds are both based on manually designed features, whose perception accuracy are highly dependent on expert experience.
In this study, taking both infrared image and meteorological conditions into consideration, we propose an end-to-end feature fusion method to detect pollution level of insulators in an automatic and accurate way, the contributions are as follows:
1. Considering the differences of infrared images under different weather conditions, the insulator pollution perception problem is mapped to a probability problem of pollution degree, infrared image and meteorological conditions. And the way to solve this problem is to calculate the conditional probability of each pollution severity under the corresponding inputs.
2. The insulator contamination perception methods based on infrared images largely depend on the meteorological conditions, to cope with this problem, we take both infrared image and meteorological parameters as input, and propose a feature fusion method to fuse these two types of data, from which the relationship between contamination grades, temperature and humidity is explored, and the contamination perception in different environmental conditions improves a lot.
3. Instead of manually designing features for inputs, the feature fusion method proposed can automatically extract features for the two kinds of data, which is more accurate and can be trained and tested in an end-to-end way.
The rest of this paper is organized as follows: Section II gives the basic principles of infrared image based contamination perception methods, based on this, the influences of meteorological parameters on infrared images are analyzed; Section III proposes the feature fusion method, which includes the feature extraction part, the feature fusion part and the contamination classification part; Section IV describes the data preparation, the model training and model testing process; Section V verifies the effectiveness of the proposed method from evaluation results and model comparison; and Section VI concludes this paper.
2 Basic Theory
Infrared images manifest infrared energy radiated from objects with temperature higher than absolute zero. Because of the abnormal temperature distribution caused by anomaly or faults of the objects, events can be detected through infrared image analysis, which has been widely used in biomedicine (Vainer, 2019), transportation control (Wang et al., 2020a), quality inspection (Tumas and Serackis, 2017), power systems (Wang et al., 2020b) and other fields.
For contaminated insulators in power systems, their pollution degrees can be detected through infrared images. To be specific, the infrared effect of a contaminated insulator is associated with the heat produced by leakage current on its surface, which is affected by the pollution on its surface and meteorological parameters, such as temperature and humidity. For example, even the same contaminated insulator can show different temperature distribution under different meteorological circumstances, which indicates the necessity to consider both thermal effect on infrared image and meteorological circumstance when analyzing the contamination degree of insulators. The factors affecting infrared effect are analyzed as follows:
2.1 Contamination Grade
In a humid atmosphere, the contamination grades of insulators are positively correlated with the heat they produce: The pollution on a polluted insulator absorbs moisture in the atmosphere, which causes a decrease in the surface resistance, and an increase in its conductivity. Therefore, the leakage current through the surface is significantly increased and thus causes thermal effect that can be detected by infrared images. In addition, when under a certain humidity condition, the higher the contamination grade, the larger the decrease of the surface resistance, and the larger the leakage current. While for a clean insulator without contamination, the leakage current is always small and there are no obvious heating phenomenon even with very high humidity.
2.2 Humidity
A certain degree of humidity is necessary for contaminated insulators to produce leakage current: When the humidity is relatively small, both contaminated insulators and clean insulators produce small or even no leakage current, thus there are no clear differences between their corresponding infrared images; When subjected to a wet condition with relatively high humidity, however, the surfaces of the polluted insulators will become conductive, and the thermal effect caused by the leakage current will be reflected on the infrared images, while for the clean insulators, the increase in humidity does not affect their thermal effect. What’s more, for the same contaminated insulator, it can present differently when in different wet condition, to be more specific, the higher the humidity value, the more heat it produces and the higher the temperature in infrared image.
2.3 Temperature
The environmental temperature affects both the leakage current and the infrared image: 1) The leakage current can be influenced in two ways: on the one hand, the change of the environmental temperature often yields change of the environmental humidity, which will indirectly affect the leakage current produced; on the other hand, it affects the evaporation rate of the contamination layer, and may affect the pollution grade of the insulators in the end. 2) The temperature distribution of infrared images can be affected by environmental temperature (Zou et al., 2014), which in turn can influence the contamination perception accuracy.
In short, there is a complicated nonlinear relationship between leakage current and pollution level, temperature and humidity. When using infrared images to perceive contamination grade, environmental humidity and temperature are necessary to be considered.
3 Contamination Grade Perception Based on Feature Fusion Method
We model the pollution degree perception problem of insulators as a conditional probability function based on temperature, humidity and infrared image characteristics. In this paper, we divide the contamination degree into five classes according to the pollution severity, then under the interaction of humidity, temperature and the contamination on the insulator surface, the probability of the contaminated insulator belonging to each category can be characterized as
where c represents the contamination class, h, t represents humidity and temperature, respectively, and in is infrared image shoot under this environmental circumstance.
Based on Eq. 1, we convert the contamination perception problem into a conditional probability problem, and propose a feature fusion method to tackle this. In the following parts of this chapter, we firstly give the overall framework of the proposed method, and then illustrate the details of feature extraction, feature fusion and contamination perception.
3.1 Overall Framework
Figure 1 depicts the overall feature fusion framework consisting of four parts: 1) the input part, which includes two kinds of parameters—infrared image and meteorological parameters including humidity and temperature. What’s more, the input data aligns in time, which means that they are collected at the same time; 2) the feature extraction part, where the two kinds of data are fed into different feature extraction networks—the meteorological parameters are extracted by an artificial neural network (ANN), and the infrared image is extracted by a convolutional neural network (CNN)—because of the differences in data format and physical meaning; 3) the data fusion part, where the two kinds of features are concatenated and fed into two fully connected layers to extract features further; 4) the output part, where and the contamination grade is outputted.
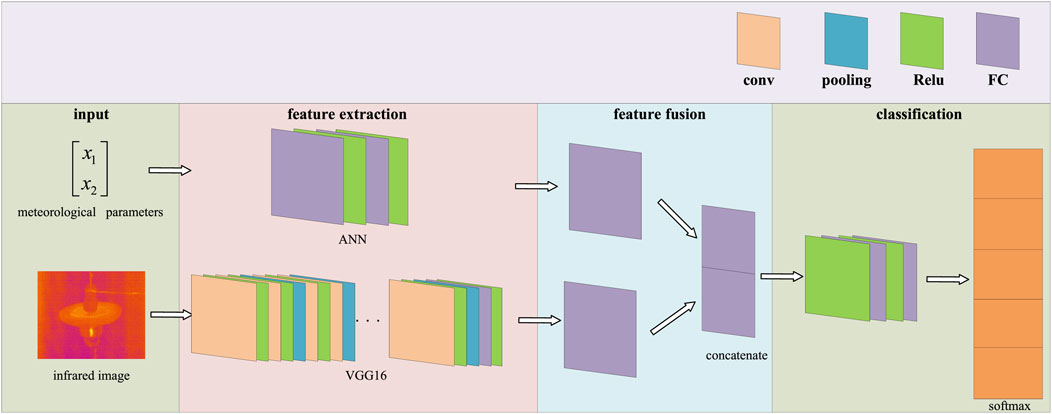
FIGURE 1. The feature fusion based insulator contamination perception network.
3.2 Meteorological Parameters Feature Extraction Network
Artificial Neural Network (ANN) is a highly nonlinear dynamic system with a directed graph as its topological structure. It learns features and processes information by adjusting the interconnection relationship between internal neurons, so it is of strong self-learning, self-adaptation and high fault tolerance (Kamesh and Rani, 2017; Hu et al., 2018; Bhatt and Gandhi, 2019; Shen et al., 2021).
For a polluted insulator, humidity and temperature can influence its infrared effect on infrared image, at the same time, the two meteorological parameters also interact and influence each other. Therefore, we take humidity and temperature parameters as a whole, and feed them into an ANN to extract the interaction between the two parameters, and learn the features with regard to the contamination grade. The reason we choose ANN to extract features of meteorological parameters is that the input is relatively simple—with only two parameters, in this way, we suppose that a rather simple network is enough to extract the information needed. Besides, ANN has been widely used in many scenes with meteorological parameters as parts of the inputs (Matsumoto et al., 1993; Bhatt and Gandhi, 2019; Madhiarasan, 2020), and the satisfactory results has provided intuitions to our problem.
The proposed feature extraction network is as shown in Figure 2, which consists of 2 1 × 10 fully connected layers and 1 1 × 5 fully connected layer (FC); and Relu is used to activate the fully connected layers. After the feature extraction, we get a 1 × 5 sized feature. What needs to be pointed out is that, we test the analysis results under different number of hidden layers and the neurons in each layer, and the structure of the proposed one can get relatively better performance when it used to fuse the two kinds of data.
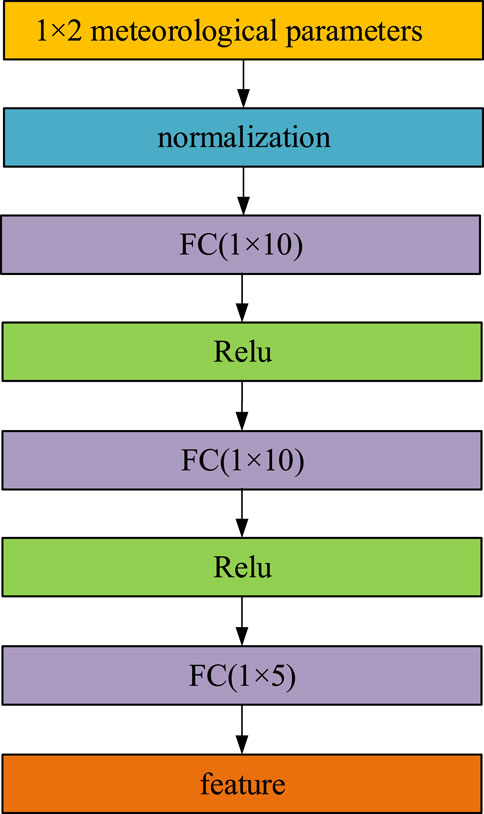
FIGURE 2. Feature extraction of meteorological parameters.
Before feeding into the ANN, we use Eq. 2 to normalize the two parameters, to solve the problem caused by their different scales.
where xi represents the i − th parameter, i = 1, 2; xin is the n − th parameter of xi, which corresponds to the infrared image at the n − th sampling moment;
3.3 Infrared Image Feature Extraction Network
One of the most popular image classification approaches today involves the convolutional neural network (CNN), which has been widely used in classification (Simonyan and Zisserman, 2014; He et al., 2016), object detection (Ren et al., 2017), segmentation (Long et al., 2015) and so on. Unlike traditional hand-crafted features, CNN unifies the feature learning and classification parts, and automatically and jointly solves the two problems together, which in turn greatly improves the accuracy of image classification (Hatami et al., 2017).
As is shown in Figure 3, in this paper, we take part of VGG-16 as feature extraction network of infrared images, for it is one of the classical classification networks with good results, and meets the contamination classification goal of this paper. In Figure 3, conv (64 × 3 × 3) × 2 represents the same 2 convolutional layers, and each of them has 64 filters sized 3 × 3, and the same to conv (128 × 3 × 3) × 2, conv (256 × 3 × 3) × 3 and so on. maxpooling (2 × 2) is the max pooling layer sized 2 × 2. It can be seen that the convolutional layers are all sized 3 × 3, and the pooling layers are all sized 2 × 2. In addition, all the convolutional layers are activated by Relu.
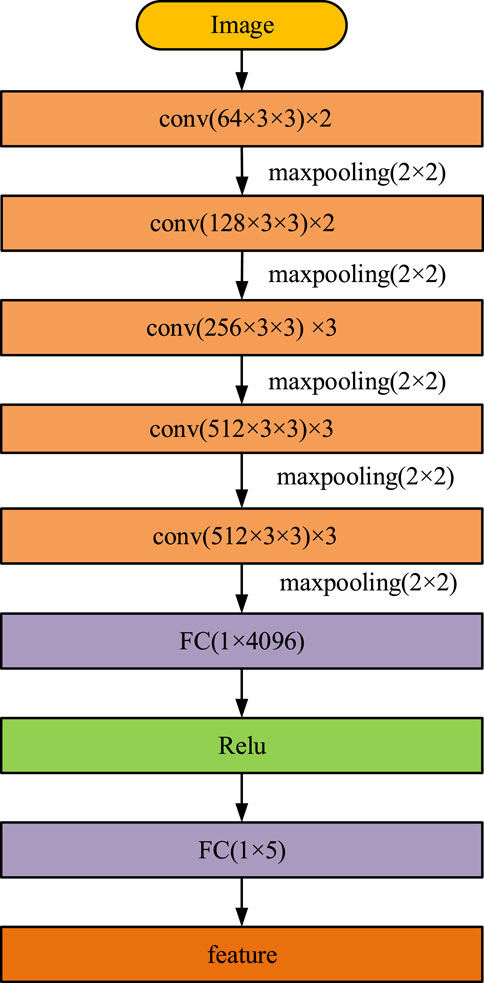
FIGURE 3. Feature extraction of infrared image.
We normalize the infrared images to 224 × 224 × 3 before feeding them into the feature extraction network. During the feature extraction process, the width and height of a image are reduced to half of the original each time it passes through a pooling layer, and the channel size doubles every time it goes through the convolutional layer blocks (the network between two neighboring maxpooling represents a block). After the final maxpooling layer, we get a 7 × 7 × 512 sized feature, then it is fed into two fully connected layers activated by Relu function, to further feature extracted. Finally, a feature sized 1 × 5 is outputted.
3.4 Feature Fusion and Classification Network
As is shown in Figure 4, we fuse the two kinds of features by concatenating them. And after that, we get a 1 × 10 sized feature. To make the fusion effectively, it requires at least one nonlinear stage to successfully capture feature from the fused feature (Srivastava and Salakhutdinov, 2014; Ramachandram and Taylor, 2017). Therefore, we use two fully connected layers activated by Relu to further analyze the fused feature. Here, to avoid overfitting of the network, we set the dropout ratio of the FC layer followed by the concatenation layer to be 0.5.
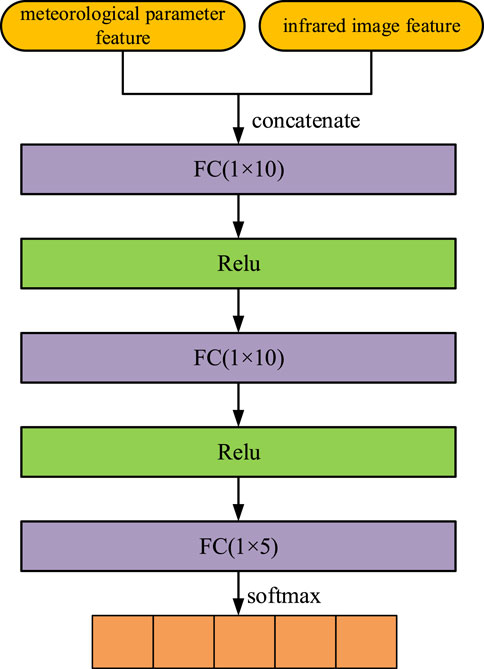
FIGURE 4. Feature fusion and classification.
To classify the contamination, we divide the polluted insulators into five grades, and use softmax to calculate the probability that the input belonging to each class, as is shown in Eq. 3.
where
4 Experimental Setups
As is shown in Figure 5, the implementation of the proposed method includes three parts: data acquisition and labeling, training phase and testing phase.
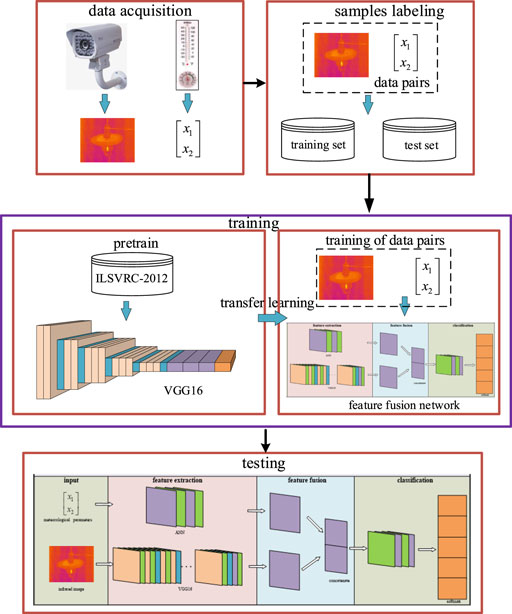
FIGURE 5. Implementation of the proposed method.
4.1 Data Acquisition and Labeling
To collect polluted insulator image samples in different weather conditions, we use a mixture of NaCl and kaolin to contaminate the XP-70 insulators, and then, in a fog chamber, we shot infrared images in different humidity and temperature, where the relative humidity ranges from 60 to 100% in step of 5% each; and the temperature ranges from 0°C to 40°C in step of 5°C each. As is illustrated in 2.2, a ceratin value of humidity is a must for the polluted insulators to generate leakage current and radiate to show thermal effect. Therefore, we don’t collect infrared images with the humidity less than 60%, as in that circumstance, the insufficient humidity will cause almost no leakage current generated by the contaminated insulators, and the contamination degree can’t be perceived by the infrared images.
We use the equivalent salt deposit density (ESDD) (mg/cm2) to discriminate the insulator contamination severity. According to Chinese national standard ‘GB/T 5582–1993’, the contamination can be classified into 5 grades according to the pollution content, as is shown in Table 1. In addition, we divide the data into a training and testing set according to 5 : 1, which are used to train the network and evaluate the performance of the proposed method, respectively.
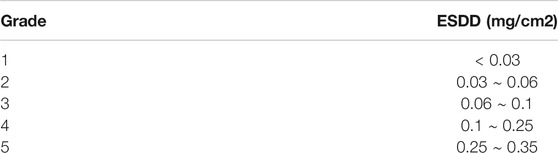
TABLE 1. Contamination classification.
4.2 Training Phase
During the training phase, we employ transfer learning to make the network converge faster and solve the problem of relatively small samples, which consists of two stages: In the first stage, we pretrain VGG-16 network based on the ILSVRC-2012 dataset, which contains more than 1 million training samples, and then the parameters of the network are saved. In the second stage, based on the shared parameters of the pretrained VGG-16, we retrain the feature fusion network taking both infrared and meteorological parameters pairs as input. The idea here is that, there are some similarities for the image classification problems, for example, they all have to extract some profile information based on the point and line characteristics, thus they can share some of the parameters for the same network regarding to different classification goals. Besides, the network has been trained to some extent and the loss function has arrived to a relatively small value, which leads to a relatively small modification compared with training from a completely new network. During the training process, we take the same training strategies as that in VGG-16 (Simonyan and Zisserman, 2014), and aim to make the loss function small enough, as is shown in Eq. 4.
where L represents the loss; pi is the probability from softmax,
4.3 Testing Phase
After training process, the structure and parameters of the proposed network is frozen in the test stage. In this phase, we take testing set as input, and perceive the contamination grades of the polluted insulators, the evaluation indicators are as follows:
As is shown in Eq. 5–8 — four indicators—including p (precision), R (recall), AP (average precision), and AR (average recall)— are used to evaluate the proposed approach.
The explanation of the parameters above are as follows:
TP (True Positive): the number of the positive samples predicted as positive; FP (False Positive): the number of the negative samples predicted as positive; TN (True Negative): the number of negative samples predicted as negative; FN (False Negative): the number of positive samples predicted as negative.
m represents the class number, which equals to 5 in this paper.
5 Case Studies
To validate the effectiveness of the proposed method, two insulator contamination perception methods are compared: 1) VGG-16; 2) feature fusion method proposed in this paper. For the two networks, we take the same training set to train them, and use the same test set to evaluate them. The only difference is that only infrared images are fed into VGG-16, while the data pairs (infrared image and meteorological parameters) are taken as input for the feature fusion network.
5.1 Evaluation Results
Table 2 tells the average results of the two methods, Figure 6 and Figure 7 illustrate the performance between five classes, from which we can see that, the fusion method proposed in this paper effectively improves the precision and recall (increases by 7.97 and 12.46% respectively), in addition, it has better results between different contamination classes.
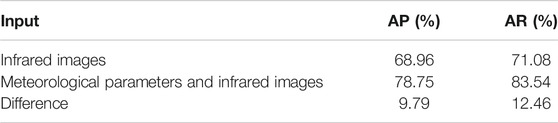
TABLE 2. Evaluation comparison between the two methods.
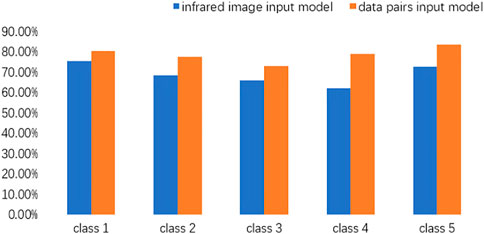
FIGURE 6. Precision comparison between classes.
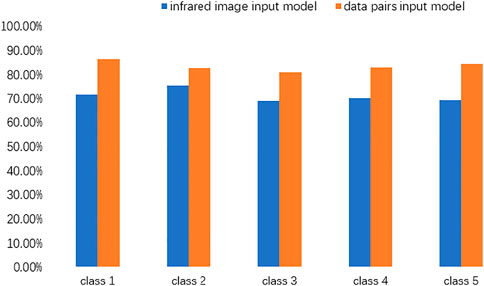
FIGURE 7. Recall comparison between classes.
To further analyze the necessity of considering meteorological parameters in insulator pollution perception, we divide humidity into four classes—60 ∼ 70%, 70 ∼ 80%, 80 ∼ 90%, 90 ∼ 100%—and compare the AP of the two methods, as is shown in Figure 8. And we also divide the temperature into four ranges—0 ∼ 10°C, 11 ∼ 20°C, 21 ∼ 30°C, 31 ∼ 40°C—and compare the AP of the two methods, as is shown in Figure 9.
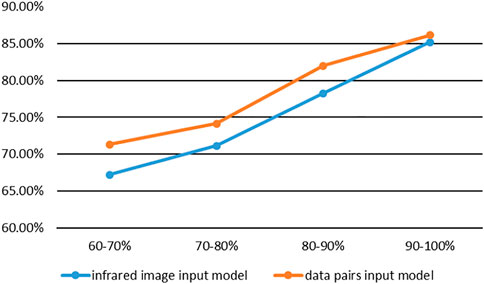
FIGURE 8. Comparison between different humidity classes.
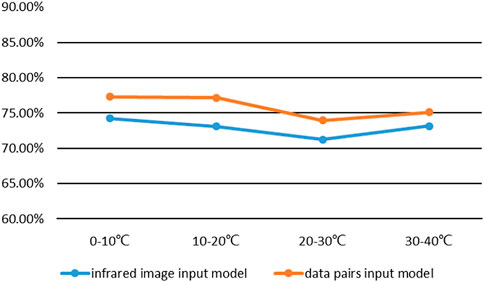
FIGURE 9. Comparison between different temperature classes.
From Figure 8, we get two conclusions: 1) both two methods perform better in high humidity. However, the data pairs input model is more balanced in each humidity range, while the infrared image input model is more dependent on humidity—the variance of AP of the former is 0.47%, while is 0.63% of the latter; 2) the method proposed in this paper outperforms the single-input method in all humidity levels.
From Figure 9, both two methods have relatively balanced performances in each temperature range, while the method proposed in this paper outperforms the single-input method in all the temperature classes.
The above phenomenons can be explained as follows: 1) Both humidity and temperature affect the leakage current of the contaminated insulators, thus further influence the infrared image and the classification perception. When the infrared image alone is used as input, the model cannot explore the relationship between humidity, temperature and the pollution level of the insulator, so it has relatively low precision; While for the fusion method proposed in this paper, it takes humidity, temperature and infrared image as input, which can better explore the relationship between weather conditions and thermal radiation, so it can better judge the contamination level. 2) The temperature does not affect the performance between different contamination classes, as the two methods perform similar in the four temperature ranges within their own (the precision change for the two methods are within 5%). Still, it is still one of the key factors influencing the classification performance, as our method outperforms the single-input method in every temperature level, which may be explained by the influence of the temperature to the humidity.
5.2 Model Comparison
5.2.1 Class Separability Analysis
To reveal the ability of the proposed model to distinguish different levels of pollution, latent discriminant analysis (LDA) (Hussein Mouzannar and Awad, 2018) is performed on testing set to examine the separability of the two methods (the feature fusion model and VGG-16). We extract the features before softmax, and plot the distribution of the data after performing LDA, which reduces the dimensionality of the data to 2. As is shown in Figure 10, compared with VGG-16, the feature fusion method is more capable of distinguishing different levels of pollution, which is the reason of better classification ability.
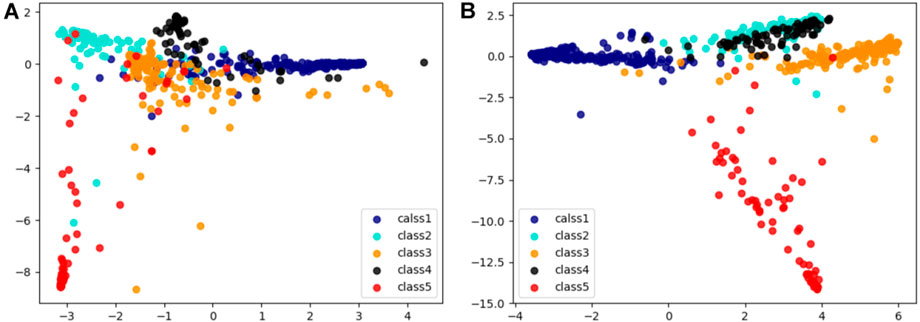
FIGURE 10. Results of LDA feature reduction (A) is result of VGG-16 (B) is result of feature fusion model proposed in this paper.
5.2.2 Model Complexity Comparison
Compared with VGG-16, the feature fusion method is less complicated: Although it has more parameters in the meteorological parameters feature extraction part, the fused feature extraction part of the proposed network has much less parameters than VGG-16 — As the former has two 1 × 10 FC layers, while the latter has two 1 × 4096 FC layers.
6 Conclusion
The accuracy of infrared image based insulator contamination methods largely depend on weather conditions. In this paper, we take the constructed meteorological parameters and the unstructured infrared image as input, and propose a feature fusion model to classify insulator contamination in different meteorological conditions.
The two types of data are different in data form and physical meaning, which makes it difficult to fuse them. In this way, we extract the features of the two types of data, and represent them with the same data form, then two features are fused and further analyzed to classify the contamination. To be specific, the ANN and VGG-16 are used to extract features of meteorological parameters and infrared image, respectively. Then two features are fused by concatenation and further feature extracted by two nonlinear layers (Relu activated fully connected layers). In the end, the contamination level perception is performed by softmax, from which we get the probability of the input belonging to each contamination grade.
Compared with the infrared image input model, the method proposed in this paper can better separate the contamination classification, and perform better in different meteorological conditions. Besides, it has less parameters and is less complicated.
The model in this paper only test samples under the condition of humidity greater than 60%, while for those in the case of humidity less than 60%, there may be no obvious differences between the infrared images of each pollution level. In the future, we will focus on finding more features to make the method more applicable to different meteorological conditions.
Data Availability Statement
The original contributions presented in the study are included in the article/supplementary material, further inquiries can be directed to the corresponding author.
Author Contributions
HW: methodology, data collection, simulation, data analysis, writing original draft, recording image; BW: methodology, recording image data, draft review and editing; ML: methodology, draft review and editing; PL: data collection, simulation; HM: writing review and editing; FM: writing review and editing.
Funding
This paper is supported by the State Grid Headquarters Technology Project (Grant No. 5400-202119145A-0-0-00).
Conflict of Interest
The authors declare that the research was conducted in the absence of any commercial or financial relationships that could be construed as a potential conflict of interest.
Publisher’s Note
All claims expressed in this article are solely those of the authors and do not necessarily represent those of their affiliated organizations, or those of the publisher, the editors and the reviewers. Any product that may be evaluated in this article, or claim that may be made by its manufacturer, is not guaranteed or endorsed by the publisher.
References
Author Anonymous, (2020). Ieee Draft Guide on the Selection of Transmission and Distribution Insulators with Respect to Cold Weather Conditions. IEEE P1820/D12, 1–62.
Banik, A., Dalai, S., and Chatterjee, B. (2016). Autocorrelation Aided Rough Set Based Contamination Level Prediction of High Voltage Insulator at Different Environmental Condition. IEEE Trans. Dielect. Electr. Insul. 23, 2883–2891. doi:10.1109/tdei.2016.7736849
Bhatt, G. A., and Gandhi, P. R. (2019). “Statistical and Ann Based Prediction of Wind Power with Uncertainty,” in 2019 3rd International Conference on Trends in Electronics and Informatics (ICOEI), Tirunelveli, India, April, 2019, 622–627. doi:10.1109/icoei.2019.8862551
Cao, B., Wang, L., and Yin, F. (2019). A Low-Cost Evaluation and Correction Method for the Soluble Salt Components of the Insulator Contamination Layer. IEEE Sensors J. 19, 5266–5273. doi:10.1109/jsen.2019.2902192
Dong, B., Jiang, X., Zhang, Z., Hu, J., Hu, Q., and Shu, L. (2014). Effect of Environment Factors on Ac Flashover Performance of 3 Units of Polluted Insulator Strings under Natural Fog Condition. IEEE Trans. Dielect. Electr. Insul. 21, 1926–1932. doi:10.1109/tdei.2014.004214
Fofana, I., N’cho, J. S., Betie, A., Hounton, E., Meghnefi, F., and Yapi, K. M. L. (2020). Lessons to Learn from post-installation Pollution Levels Assessment of Some Distribution Insulators. Energies 13, 4064. doi:10.3390/en13164064
Hatami, N., Gavet, Y., and Debayle, J. (2017). “Classification of Time-Series Images Using Deep Convolutional Neural networksCoRR abs/1710.00886, ” Tenth International Conference on Machine Vision (ICMV 2017), Vienna, Austria (SPIE).
He, H., Luo, D., Lee, W.-J., Zhang, Z., Cao, Y., and Lu, T. (2019). A Contactless Insulator Contamination Levels Detecting Method Based on Infrared Images Features and Rbfnn. IEEE Trans. Ind. Applicat. 55, 2455–2463. doi:10.1109/tia.2018.2889835
He, K., Zhang, X., Ren, S., and Sun, J. (2016). “Deep Residual Learning for Image Recognition,” in 2016 IEEE Conference on Computer Vision and Pattern Recognition (CVPR, Las Vegas, Nevada, USA), June, 2016, 770–778. doi:10.1109/CVPR.2016.90
He Wei, Wei., Yang Fan, Yang., Wang Jingang, Jingang., Yang Hao, Hao., Minyou, C., and Yao Degui, Degui. (2006). Inverse Application of Charge Simulation Method in Detecting Faulty Ceramic Insulators and Processing Influence from tower. IEEE Trans. Magn. 42, 723–726. doi:10.1109/tmag.2006.871393
Hu, Z., He, T., Zeng, Y., Luo, X., Wang, J., Huang, S., et al. (2018). Fast Image Recognition of Transmission tower Based on Big Data. Prot. Control. Mod. Power Syst. 3, 149–158. doi:10.1186/s41601-018-0088-y
Hussein Mouzannar, Y. R., and Awad, M. (2018). “Damage Identification in Social media Posts Using Multimodal Deep Learning,” in ISCRAM 2018 Conference Proceedings—15th International Conference on Information Systems for Crisis Response and Management, Rochester NY, USA, May, 2018, 529–543.
Jiang, X., and Xia, Q. (2010). “Influence of Contamination on Deteriorated Insulators Detection with Infrared Imaging Method,” in 2010 International Conference on High Voltage Engineering and Application, New Orleans, USA, October,2010, 457–460. doi:10.1109/ichve.2010.5640729
Jin, L., Ai, J., Tian, Z., and Zhang, Y. (2017). Detection of Polluted Insulators Using the Information Fusion of Multispectral Images. IEEE Trans. Dielect. Electr. Insul. 24, 3530–3538. doi:10.1109/tdei.2017.006516
Jin, L., Tian, Z., Ai, J., Zhang, Y., and Gao, K. (2018). Condition Evaluation of the Contaminated Insulators by Visible Light Images Assisted with Infrared Information. IEEE Trans. Instrum. Meas. 67, 1349–1358. doi:10.1109/tim.2018.2794938
Kamesh, R., and Rani, K. Y. (2017). Novel Formulation of Adaptive Mpc as Ekf Using Ann Model: Multiproduct Semibatch Polymerization Reactor Case Study. IEEE Trans. Neural Netw. Learn. Syst. 28, 3061–3073. doi:10.1109/tnnls.2016.2614878
Liu, L., Mei, H., Guo, C., Tu, Y., and Wang, L. (2021). Pixel-level Classification of Pollution Severity on Insulators Using Photothermal Radiometry and Multiclass Semisupervised Support Vector Machine. IEEE Trans. Ind. Inf. 17, 441–449. doi:10.1109/tii.2020.2984642
Liu, Y., Zong, Y., Zong, H., Gao, S., and Du, B. X. (2020). Contamination Deposition and Discharge Characteristics of Outdoor Insulators in Fog-Haze Conditions. Int. J. Electr. Power Energ. Syst. 121, 106176. doi:10.1016/j.ijepes.2020.106176
Long, J., Shelhamer, E., and Darrell, T. (2015). “Fully Convolutional Networks for Semantic Segmentation,” in 2015 IEEE Conference on Computer Vision and Pattern Recognition (CVPR), Boston, USA, June, 2015, 3431–3440. doi:10.1109/cvpr.2015.7298965
Madhiarasan, M. (2020). Accurate Prediction of Different Forecast Horizons Wind Speed Using a Recursive Radial Basis Function Neural Network. Prot. Control. Mod. Power Syst. 5, 230–238. doi:10.1186/s41601-020-00166-8
Matsumoto, T., Kitamura, S., Ueki, Y., and Matsui, T. (1993). “Short-term Load Forecasting by Artificial Neural Networks Using Individual and Collective Data of Preceding Years,” in [1993] Proceedings of the Second International Forum on Applications of Neural Networks to Power Systems, Yokohama, Japan, April, 1993, 245–250.
Ramachandram, D., and Taylor, G. W. (2017). Deep Multimodal Learning: A Survey on Recent Advances and Trends. IEEE Signal. Process. Mag. 34, 96–108. doi:10.1109/MSP.2017.2738401
Ren, S., He, K., Girshick, R., and Sun, J. (2017). Faster R-Cnn: Towards Real-Time Object Detection with Region Proposal Networks. IEEE Trans. Pattern Anal. Mach. Intell. 39, 1137–1149. doi:10.1109/tpami.2016.2577031
Salem, A. A., Abd-Rahman, R., Al-Gailani, S. A., Kamarudin, M. S., Ahmad, H., and Salam, Z. (2020). The Leakage Current Components as a Diagnostic Tool to Estimate Contamination Level on High Voltage Insulators. IEEE Access 8, 92514–92528. doi:10.1109/access.2020.2993630
Shen, X., Ouyang, T., Yang, N., and Zhuang, J. (2021). Sample-based Neural Approximation Approach for Probabilistic Constrained Programs. IEEE Trans. Neural Netw. Learn. Syst., 1–8. doi:10.1109/tnnls.2021.3102323
Simonyan, K., and Zisserman, A. (2014). Very Deep Convolutional Networks for Large-Scale Image Recognition. CoRR abs/1409, 1556.
Srivastava, N., and Salakhutdinov, R. (2014). Multimodal Learning with Deep Boltzmann Machines. J. Machine Learn. Res. 15, 2949–2980.
Tumas, P., and Serackis, A. (2017). “Effective Background Subtraction Algorithm for Food Inspection Using a Low-Cost Near Infrared Camera,” in 2017 Open Conference of Electrical, Electronic and Information Sciences (eStream), Vilnius, Lithuania, April, 2017, 1–4. doi:10.1109/estream.2017.7950322
Vainer, B. G. (2019). “Novel Measurement Methods in Biomedicine,” in 2019 12th International Conference on Measurement, Smolenice, Slovakia, May, 2019. doi:10.23919/measurement47340.2019.8779955115–118
Wang, B., Benli, E., Motai, Y., Dong, L., and Xu, W. (2020a). Robust Detection of Infrared Maritime Targets for Autonomous Navigation. IEEE Trans. Intell. Veh. 5, 635–648. doi:10.1109/tiv.2020.2991955
Wang, B., Dong, M., Ren, M., Wu, Z., Guo, C., Zhuang, T., et al. (2020b). Automatic Fault Diagnosis of Infrared Insulator Images Based on Image Instance Segmentation and Temperature Analysis. IEEE Trans. Instrum. Meas. 69, 5345–5355. doi:10.1109/tim.2020.2965635
Wang, J., Xi, Y., Fang, C., Cai, L., Wang, J., and Fan, Y. (2019). Leakage Current Response Mechanism of Insulator String with Ambient Humidity on Days without Rain. IEEE Access 7, 55229–55236. doi:10.1109/access.2019.2910660
Wang, L., Cao, B., Mei, H., Zhao, C., and Guan, Z. (2017). Effects of Natural Contamination Components on the Surface Conductivity under Saturated Moisture. IEEE Trans. Dielect. Electr. Insul. 24, 2945–2951. doi:10.1109/tdei.2017.006558
Zhao, W., Liu, W., Hu, Y., An, Y., and Li, Y. (2017). “Extraction Method of Insulator Discharge Area in Ultraviolet Image and its Application,” in 2017 4th International Conference on Systems and Informatics (ICSAI), Hangzhou, China, November, 2017, 857–961. doi:10.1109/icsai.2017.8248405
Zhao, Z., Fan, X., Qi, Y., and Zhai, Y. (2017). “Multi-angle Insulator Recognition Method in Infrared Image Based on Parallel Deep Convolutional Neural Networks,” in Computer Vision. Editors J. Yang, Q. Hu, M.-M. Cheng, L. Wang, Q. Liu, X. Baiet al. (Singapore: Springer Singapore), 303–314. doi:10.1007/978-981-10-7305-2_27
Zhong, R., Liu, C., and He, W. (2018). “Design and Verification of Contamination Insulator Conductivity Detecting System,” in 2018 International Conference on Power System Technology (POWERCON), Guangdong, China, November, 2018, 3136–3141. doi:10.1109/powercon.2018.8602095
Keywords: insulator, contamination perception, feature fusion, infrared image, meteorological parameters
Citation: Wang H, Wang B, Li M, Luo P, Ma H and Ma F (2021) Insulator Contamination Perception Based on Feature Fusion of Infrared Image and Meteorological Parameters. Front. Energy Res. 9:746378. doi: 10.3389/fenrg.2021.746378
Received: 23 July 2021; Accepted: 23 August 2021;
Published: 08 September 2021.
Edited by:
Xun Shen, Tokyo University of Agriculture and Technology, JapanCopyright © 2021 Wang , Wang , Li , Luo, Ma and Ma . This is an open-access article distributed under the terms of the Creative Commons Attribution License (CC BY). The use, distribution or reproduction in other forums is permitted, provided the original author(s) and the copyright owner(s) are credited and that the original publication in this journal is cited, in accordance with accepted academic practice. No use, distribution or reproduction is permitted which does not comply with these terms.
*Correspondence: Bo Wang , d2h3ZHdiQHdodS5lZHUuY24=