 Fuqi Ma
 Bo Wang1*
 Min Li
 Hengrui Ma
- 1School of Electrical and Automation, Wuhan University, Wuhan, China
- 2School of Computer and Artificial Intelligence, Wuhan Textile University, Wuhan, China
- 3State Grid Shaanxi Electric Power Company, State Grid Xi’an Power Supply Company, Xi’an, China
- 4Guangdong Power Grid Corp, Huizhou Power Supply Bureau Co., Ltd., Huizhou, China
- 5Tus-Institute for Renewable Energy, Qinghai University, Xining, China
Insulator is an important equipment of power transmission line. Insulator icing can seriously affect the stable operation of power transmission line. So insulator icing condition monitoring has great significance of the safety and stability of power system. Therefore, this paper proposes a lightweight intelligent recognition method of insulator icing thickness for front-end ice monitoring device. In this method, the residual network (ResNet) and feature pyramid network (FPN) are fused to construct a multi-scale feature extraction network framework, so that the shallow features and deep features are fused to reduce the information loss and improve the target detection accuracy. Then, the full convolution neural network (FCN) is used to classify and regress the iced insulator, so as to realize the high-precision identification of icing thickness. Finally, the proposed method is compressed by model quantization to reduce the size and parameters of the model for adapting the icing monitoring terminal with limited computing resources, and the performance of the method is verified and compared with other classical method on the edge intelligent chip.
Introduction
The importance of safe and stable operation of power grid to the development of the national economy is self-evident. With the deepening of power grid interconnection and the gradual implementation of power market, the operation environment of power grid is more complex, which puts forward higher requirements for the stability and reliability of power grid (Ruszczak and Tomaszewski, 2015; Liu et al., 2020; Wang et al., 2020). Due to the vast territory, diverse climate, complex terrain and other factors, power grids in China are often damaged by various natural disasters, resulting in large-scale power outages. As an important equipment of transmission lines and substations, insulators have the functions of electrical insulation and mechanical fixation (Liu et al., 2017; Yang et al., 2019). Due to ice and snow condition, the external insulation performance of insulators will be significantly reduced. Severe icing may lead to the distortion of insulator potential distribution, flashover of insulator, line trip and outage, which brings great challenges to the safe and stable operation of power grid. In 2008, the south of China suffered extremely serious ice disaster, which led to a large area of ice flashover of insulators in many transmission lines and substations, resulting in a series of serious accidents such as tripping and equipment damage (Tiannan and Dongxiao, 2016; Wang et al., 2021). Since then, although the degree of icing disaster is less than that in 2008, the destructive impact of ice disaster weather on insulators and even power grid has always existed. Therefore, it is urgent to carry out insulator icing perception research to guide the production, operation and maintenance, find and eliminate hidden dangers in time, so as to improve the safety and stability of the power grid operation (Wei and Caifei, 2019; Li et al., 2021).
At present, monitoring and restraining methods are mainly used for insulator icing control and management (Jiang et al., 2014; Li et al., 2019). The monitoring method can realize online monitoring of insulator icing state by installing sensors and cameras on electrical equipment, or find hidden dangers in key line inspection by manual inspection. Based on the monitoring results, various ice melting technologies have been adopted to eliminate the icing of insulators, mainly including mechanical de icing, laser de icing and manual de icing (Zhang et al., 2020a). The research on insulator icing monitoring and recognition mainly focuses on cloud centric computing mode, including environmental parameter monitoring (Junhua et al., 2018; Xingliang et al., 2018; Zhu et al., 2020) and image monitoring (Yan et al., 2013; Jingjing et al., 2017; Shen and Raksincharoensak, 2021a). The method based on environmental parameters is mainly fonded on experimental analysis, and the change of insulator icing thickness is often obtained through the change of environmental parameters and physical analysis. The limitation of insulator icing thickness calculate method based on environmental parameter monitoring is that all kinds of sensors installed on transmission lines will be affected by bad weather and complex electromagnetic interference, which may lead to large errors in icing monitoring results. In the image monitoring method, the video monitoring terminal installed on the transmission line tower to collect the insulator icing image regularly, and transmit the icing image to the monitoring center. Then use the rich computing resources and advanced images processing methods of the monitoring center to calculate the insulator icing thickness (Dongxiao et al., 2017; Yongsai et al., 2017). For the collected insulator icing image, the traditional image processing methods are mainly used for icing perception, such as image segmentation or edge detection to realize icing thickness level recognition (Yanpeng et al., 2017; Qiangliang et al., 2018). The processing mode and effect of traditional image methods are seriously affected by the quality and location of icing images. Different types of icing images usually need to be determined manually to select the best processing method, which shows the problems of insufficient generalization ability and low efficiency.
With the development of Graphics Processing Unit (GPU) and artificial intelligence (AI) technology, image processing method based on deep learning (Shen et al., 2020a; Shen et al., 2021a) is gradually applied to insulator icing monitoring (Zhuangli et al., 2018; Shen and Raksincharoensak, 2021b; Nan et al., 2018). Wang et al. (Gang et al., 2018) proposed a method of insulator icing thickness identification based on convolution neural network. Using the abundant computing resources of cloud computing center, a complex convolution neural network recognition model is established to identify the ice thickness level, which has strong generalization ability. Yang et al. (2021a); Yang et al. (2021b) first study SCUC problems and proposed an expanded sequence-to-sequence (E-Seq2Seq) based data-driven SCUC expert system for dynamic multiple-sequence mapping samples, it can accommodate the mapping samples of SCUC, and consider the various input factors that affect SCUC decision-making, possessing strong generality, high solution accuracy, and efficiency over traditional methods. However, the cloud computing model can not guarantee the reliable transmission, real-time analysis and recognition of insulator icing monitoring image in bad weather. But with the development of power Internet of things and the transformation of energy digitization (Shen et al., 2017; Haoyong et al., 2019), millions of power edge intelligent devices such as power sensors, state sensors and intelligent video monitoring system are connected to the power Internet of things, resulting in massive heterogeneous data (Zhang and Luo, 2018; Shen et al., 2020b; Nie et al., 2020; Ying et al., 2020). The traditional centralized data processing mode centered on cloud computing shows the problem of insufficient real-time, especially for the ice monitoring system with poor transmission conditions, the edge intelligent technology with edge computing as the core has been widely concerned. Therefore, the research on the intelligent identification method of front-end edge intelligent icing monitoring equipment has become the inevitable development trend of online icing monitoring (Chen et al., 2019; Zhou et al., 2019).
Ma et al. (2021) utilized the edge computing mode to identify icing thickness of transmission line in front-end monitoring equipment. Considering that the established ice thickness identification model is too complex to be suitable for the front-end ice monitoring device with limited computational resources, they use network channel pruning method for model lightweight compression. However, network channel pruning method requires a lot of manpower and computing power. In order to improve the engineering applicability of the edge intelligent icing thickness identification, this paper proposes a model quantization method for lightweight compression of icing thickness identification model, so as to realize the front-end localized identification of icing thickness in the icing monitoring device. And the ResNet network and FPN network are used to constructs a multi-scale feature extraction and fusion network framework to improve the detection accuracy of insulators. The main contributions of this paper are summarized as follows.
1) A edge intelligent perception method for power grid icing condition based on multi-scale feature fusion target detection and model quantization is proposed, so as to implement the front-end localization intelligent identification of insulator icing thickness.
2) The residual network ResNet and feature pyramid network (FPN) are fused to construct a multi-scale feature extraction network framework, so that the shallow features and deep features are fused to reduce the information loss and improve the target detection accuracy.
3) The proposed method is compressed by model quantization, so as to reduce the size and parameters of the model to adapt to the icing monitoring terminal with limited computing resources.
The rest of the paper is organized as follows: Section II introduces the lightweight intelligent recognition method of icing thickness proposed in this paper for icing monitoring terminal, which is based on residual network ResNet, feature pyramid network (FPN), full convolutional network (FCN) and model quantification. In Section IV, the experiment results are presented to verify the proposed method, followed by conclusions.
Proposed Method
Considering that the actual transmission line icing usually faces various bad weather conditions, and different transmission line terrain and environment will lead to a variety of scene changes, such as strong wind, heavy rain and other scenes, the icing images collected by the actual icing monitoring system show the characteristics of complex background, low resolution and polymorphism. So the icing thickness identification model established in this paper is a combination of ResNet (Zhang et al., 2020b), FPN (Feature pyramid networks) (Zhao et al., 2019) and FCN (Full convolutional network) (Long et al., 2015). The residual network ResNet and feature pyramid network (FPN) are fused to construct a multi-scale feature extraction network framework to extract more icing image information. And full convolution network is used for insulator icing grading and position regression. The proposed method solves the multi-scale problem in target detection to a certain extent, and improves the detection accuracy of targets with different sizes. Especially, the shallow image features are introduced into the FPN network, which improves the detection sensitivity of small targets such as a small proportion of insulators. FCN network adopts the anchor frame generation mechanism to generate candidate regions with fixed size ratio and quantity, which is similar to YOLOv3 model. In this way, the speed of insulator icing detection is improved.
System Architecture
The network structure of ice thickness identification method proposed in this paper is mainly composed of feature extraction network, feature pyramid network (FPN network) and classification regression network (FCN sub network). In order to improve the recognition speed of insulator icing, its feature extraction network uses the ResNet-34 network with fewer layers than Faster RCNN to extract feature maps with different resolutions from the input image. Its target classification regression network uses the same candidate box generation mechanism as YOLOv3, the system architecture of our method is shown in Figure 1.
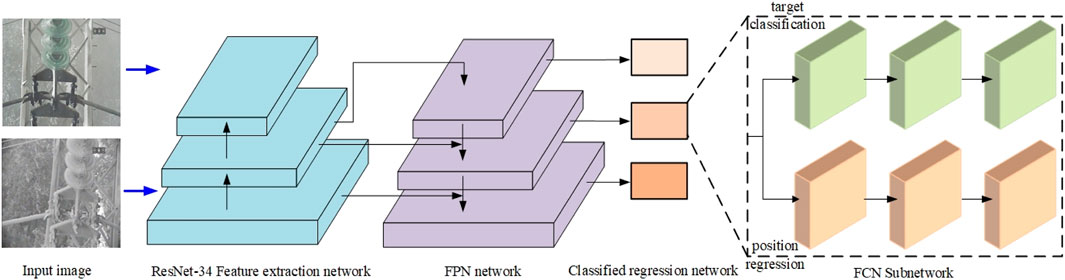
FIGURE 1. Framework of insulator icing thickness identification method.
For the input insulator icing image, the high-level and low-level feature maps of the image are obtained under different resolutions by using the resnet-34 feature extraction network firstly. Then, the FPN network is used to connect the high-level and low-level features horizontally for feature fusion, and candidate boxes are generated on feature maps with different scales. Finally, the position information and icing thickness level information of the predicted insulator target frame are output by the classification regression sub network of FCN. The detailed process of intelligent recognition of insulator icing thickness as shown in Figure 2.
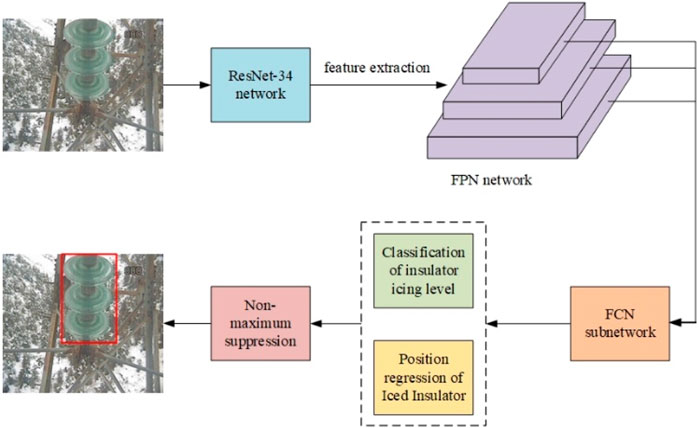
FIGURE 2. Specific process of intelligent recognition of insulator icing thickness.
Multi-Scale Feature Extraction of Icing Image
The structure of multi-scale feature extraction network based on residual network ResNet-34 in this paper is shown in Table 1. When he sliding step of convolution kernel is set to 2, the feature map will shrink gradually in the form of two times. With the deepening of feature extraction network, the semantic information of insulator icing image is gradually enhanced (Shen et al., 2021b), but the location information is gradually blurred.
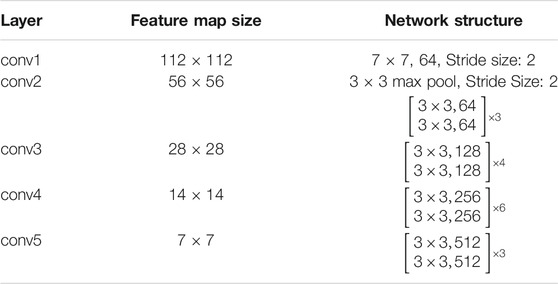
TABLE 1. Feature extraction network architecture of ResNet-34.
The feedforward calculation of ResNet-34 network is the bottom-up feature extraction process corresponding to the feature pyramid, which uses the feature activation of the last residual structure in each stage as the output. In this paper, the output of these residual modules is expressed as follows:
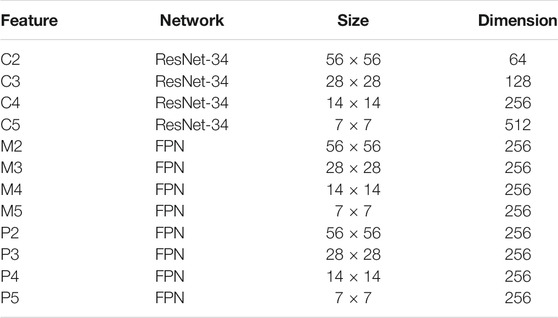
TABLE 2. The size and dimension of each feature in feature pyramid network.
Multi Scale Feature Fusion
The semantic information of high-level feature map obtained by residual feature extraction network ResNet-34 is generally strong, but the location information is fuzzy. The location information of low-level feature map is generally clear, but the semantic information is weak. Moreover, the top-down hierarchical structure of FPN network with horizontal connection helps to fuse the high-level strong semantic features of ResNet-34 network output with the low-level clear location features, so that the features of different scales have strong semantic information. The detailed structure of multi-scale feature fusion network is shown in Figure 3.
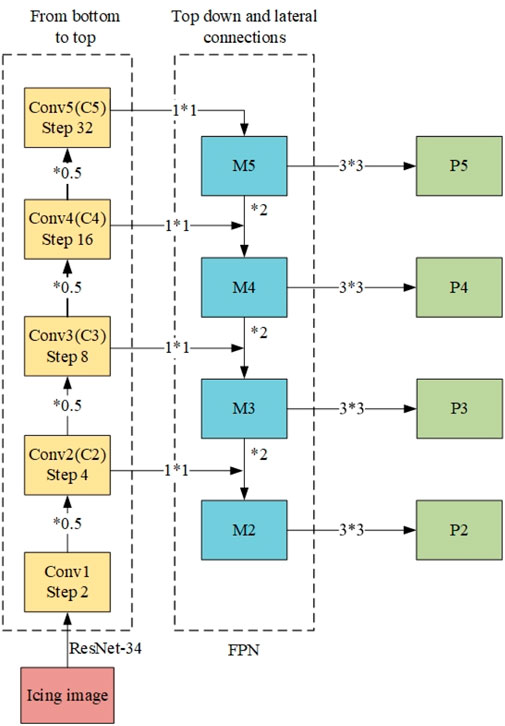
FIGURE 3. Detailed structure of multiscale feature fusion network.
As shown in Figure 3, the output C5 of ResNet-34 changes to feature map M5 with 7
Classification of Icing Thickness and Location Regression
The target classification network of ice thickness recognition model is divided into two sub networks: target classification sub network and prediction box position regression sub network. The network structure of class sub network and box sub network used in feature map at different stages is related to the size of feature map, as shown in Figure 4.
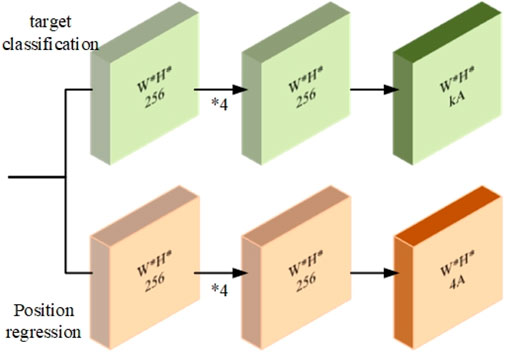
FIGURE 4. FCN network structure diagram.
In Figure 4, the sizes of W and H are the same as those feature maps (P2, P3, P4, P5) output by FPN. K represents the total number of categories to be predicted, and A represents the number of candidate boxes or anchors. In this paper, the idea of object classification regression of YOLOv3 is used to divide each feature map output by FPN into grids corresponding to the length and width of the feature map. For example, the feature map P5 with 7 × 7 size is divided into 7 × 7 grids. Then, three groups candidate frames are established from each grid center, the length width ratio of each group of candidate boxes is 1:1, 1:2 and 2:1 respectively. The ratio of the three groups of candidate boxes is 20:21/3:22/3. So the feature map P5 will be divided into 7 × 7×9 = 441 candidate boxes, as shown in Figure 5 (in the figure, only one group candidate boxes are drawn in the center of the grid, and two groups with different proportions are not presented).
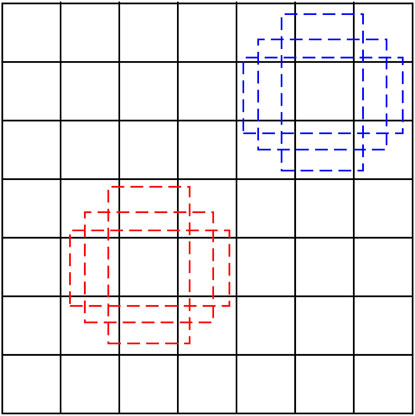
FIGURE 5. Schematic diagram of grid and candidate box of feature map P5.
Class sub network uses 4-time 256 channel convolution and 1-time num_priors×num_classes convolution for feature extraction, num_priors refers to the number of candidate boxes owned by the feature layer. num_classes refers to how many kinds of targets are detected by the network. 4-times of 256 channel convolution and 1-time num_priors×4 convolution are used in box sub network. Where, four refers to the adjustment of the coordinates of the upper left corner and the lower right corner of the candidate box. Class sub network and box sub network can be used to modify the target category and location information of the initial candidate box. Finally, the confidence scores of candidate frames are sorted and the Non-maximum value is suppressed. The candidate frames with low scores are removed, and the candidate frames with more overlaps are combined to realize the classification of insulator icing level and position coordinate regression.
Model Compression Method Based on Quantization
The implementation of Quantization Compression for the model needs to convert the common operations (such as convolution, matrix multiplication, activation function, pooling, splicing, etc.) into the equivalent operation of the faster 8-bit integer (int8) version, and then add quantization and inverse quantization operations before and after the convolution operation. Quantization operation is convert input from high-precision floating-point operation (generally 32-bit floating-point or 16 bit floating-point) to low precision integer operation (generally 8-bit integer), while the inverse quantization operation is to transfer output from low-precision operation to high-precision operation. Taking the Relu activation function as an example, the relu operation before quantization is shown in Figure 6, and the relu operation after network quantization is shown in Figure 7.

FIGURE 6. Relu operation before quantization.
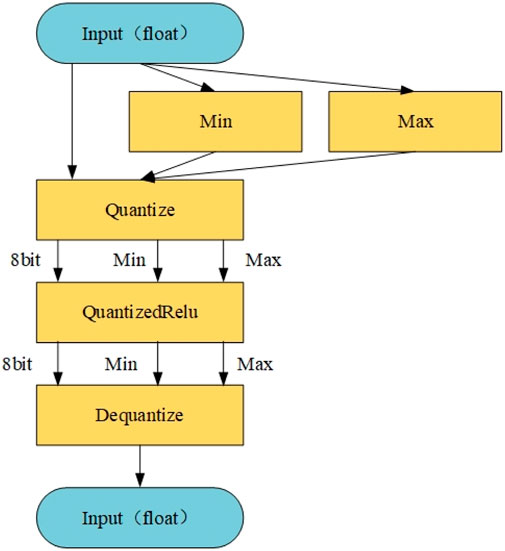
FIGURE 7. Relu operation after quantization.
For the quantization operation of converting floating numbers into 8-bit integers (0–255) in Figure 7, the core to find out the minimum value (Min) and maximum value (Max) of input data, and then the quantization value q of each input data can be obtained by using the following formula.
On the contrary, the inverse quantization value x can also be obtained by using the following formula.
The quantization error after quantization is R.
Using the quantitative operation technology of neural network can reduce the memory occupation, the amount of calculation and the power consumption of the ice thickness identification model, which is not only conducive to the deployment of the established ice thickness identification model to the intelligent embedded system, but also can improve the operation efficiency of proposed model.
Structure Composition of Edge Intelligent Icing Monitoring Device
In order to realize the front-end localization identification of icing thickness, this paper designs an edge intelligent icing monitoring device based on edge artificial intelligent (AI) chip. The device mainly includes six parts: data acquisition module, calculation control module, wireless communication module, storage module, power management module and I/O communication interface. The specific structural diagram of the device is shown in Figure 8, and the physical structure diagram of icing monitoring is shown in Figure 9. The icing monitoring with AI chip can be deployed to the transmission line tower for online monitoring of insulator icing thickness.
1) Data acquisition module. It is used to connect camera and other monitoring equipment or video monitoring system for data acquisition and coding processing of insulator icing image. Due to the slow change of insulator icing thickness, the device collects an icing image every 15 min.
2) Calculation control module. Huawei atlas 200 chip is used as the intelligent processing chip in the edge ice monitoring device, which can analyze and calculate the collected structured data such as insulator icing image and video, identify the icing thickness level of insulator, and control and coordinate the operation of each module.
3) Wireless communication module. Communication modes include 4G and WiFi, which can upload the identification results of insulator icing thickness to the cloud or server, so as to assist in transmission line maintenance and management.
4) Storage module. This module is used to store the operation system of the device, lightweight model of insulator thickness grade identification and other supporting software and algorithms.
5) Power management module. The icing monitoring device is powered by external photovoltaic panel and battery. Dual charging solar controller is used in icing monitoring device for power charging management and control.
6) I/O communication interface. Provide communication interface between modules.
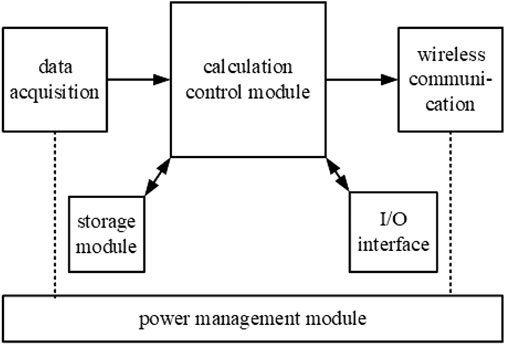
FIGURE 8. Structure of the icing monitoring device.
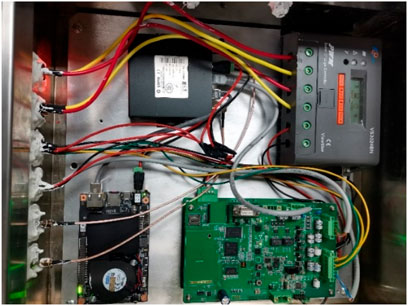
FIGURE 9. Physical structure diagram of icing monitoring device.
Experiment Results
This section introduces the experimental details and compares the performance of the proposed method for icing thickness recognition with other methods. In order to verify the performance of the lightweight icing intelligent recognition method proposed in this paper, under the same experimental conditions, classical single-stage method YOLOv3 and classical two stage method Faster RCNN are selected and quantized as the control group, and the detection accuracy and recognition speed are compared on the same experiment set. For the three methods, compare the performance of the methods on the server side firstly, and then compare the performance on the edge side through the model compression method. The model with suffix -FP32 indicates that the model uses 32-bit floating-point full precision, It is experitmented on the server side. The model with suffix -int8 indicates that the 8-bit integer precision is used after quantization and compression of the model, and it is experitmented on the edge intelligent ice monitoring device.
Construction of Image Sample Library for Insulator Icing Monitoring
The sample library constructed in this paper contains more than 4,000 insulator icing monitoring image. This paper divides the icing level based on icing and snow conditions of insulators and transmission lines, combined with the actual inspection experience and application requirements. The icing thickness of insulators is divided into five icing levels, including level_ 1, level_ 2, level_ 3, level_ four and level_ 5 (Ma et al., 2021). Each icing level represents a different insulator icing thickness range, as shown in Table 3.
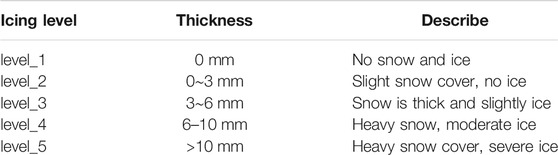
TABLE 3. Classification of insulator icing thickness.
Experiment Environment and Parameter Setting
In order to ensure that the performance indexes before and after model compression are compared under the same computing power as much as possible, the main configuration of the server side is 8-core CPU, 32 GB memory and an NVIDIA Tesla P4 graphics card with 8 GB video memory, its power consumption is 70W. Huawei atlas 200 DK chip is used as the intelligent processing chip in the edge ice monitoring device, which is shown in Figure 10. The experimental environment is deep learning framework Caffe under Ubantu system, and the power consumption is edge intelligence chip is 20 W. The 8-bit integer peak computing power of Tesla P4 graphics card and Atlas 200 DK chip is 22tops (trillion operations/s). To ensure the performance of the model under the same training and test conditions, the three methods use the same training set (including the verification set) in the cloud training. The number of iterations is 100, and the learning strategy is to automatically adjust the learning rate according to the verification accuracy, and the same test images in the insulator icing picture library are used for test comparison.
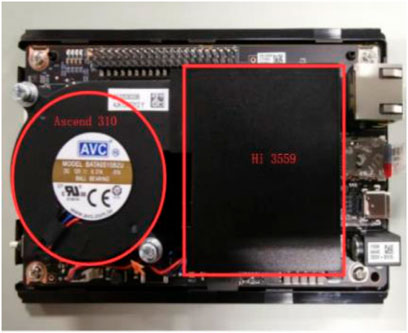
FIGURE 10. The diagram of edge intelligent analysis module.
To ensure the sample balance of the test set, 135 images of each icing level are randomly selected from the insulator icing image library to form the test set. The number of images in the training set and the test set was 2,700 and 675, respectively, and the ratio is 8:2. The image distribution of training set on icing level of various insulator is shown in Figure 11, it can be seen that there is no sample imbalance in all kinds of icing levels of insulators in the images of training set and test set.
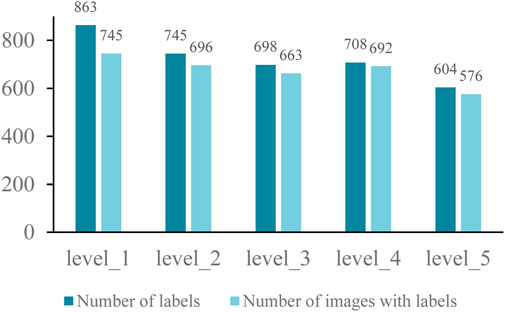
FIGURE 11. Label and image distribution of various insulator icing levels in the training set.
Comparative Analysis of Icing Identification Accuracy
This paper compares the models of Faster RCNN, YOLOv3 and our icing identification method before and after quantification compression, also compares them with the same test images. Firstly, the average precision (AP) is used to measure the performance of these methods. Average precision is achieved by averaging the precision at different recall points, which is generally calculated by the 11 point method. By setting a set of thresholds containing 11 recall points [0, 01, 0.2, 0.3, 0.4, 0.5, 0.6, 0.7, 0.8, 0.9, 1]. Each recall point corresponds to a maximum Precision. The average of these precision is the AP, and which can be obtained by the following equation.
Taking insulator icing level_1 as an example, the maximum accuracy and average precision of different recall thresholds are given, as shown in Table 4.
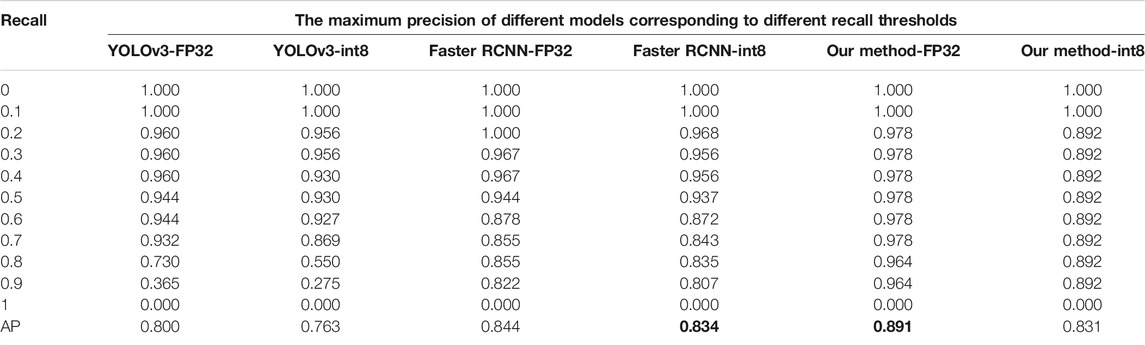
TABLE 4. The detection accuracy of different method for insulator icing level_1 before and after compression.
From Table 4, it can be seen that the Faster RCNN of the two-stage method has higher identification accuracy for icing thickness, which indicates that the RPN network of Faster RCNN model of can improve the detection accuracy. However, the detection accuracy of YOLOv3 based on integrated convolutional neural network is lower than that based on RPN, as there is no mechanism to generate target candidate domain. Besides, the accuracy of the proposed method is higher than that of the Faster RCNN model, which shows that the FPN network used in the proposed method is helpful to improve the accuracy of ice thickness identification. In addition, after the model compression, the Average precision (AP) of Faster RCNN, YOLOv3 and the method proposed in this paper presents a downward trend, which indicates that the identification accuracy for ice thickness will be reduced by the quantization compression.
Threfore, compared with the typical target detection methods, the multi-scale target detection method proposed in this paper has higher ice thickness identification accuracy for insulator icing level_1 under the server environment. But the accuracy of our method by model quantification is slightly lower than that of Faster RCNN under the edge intelligent equipment environment. In order to further measure the performance of those methods, we compare the model size, mean average precision (mAP). calculation speed and other indicators of those methods.
Average Precision Comparison and Performance Analysis
After calculating the average precision (AP) of YOLOv3, Fast RCNN and our method before and after compression for each insulator icing level, the mean average precision (mAP) of each method can be calculated, as shown in Table 5. The mean average precision (mAP) reflects the comprehensive detection accuracy performance of the target detection method for the insulators detection with different icing levels. It can be seen from Table 5 that the mAP of our method is the highest on both the server side and the edge side. It shows that the comprehensive performance of the proposed method before and after quantization compression is better than that of YOLOv3 and Fast RCNN method.
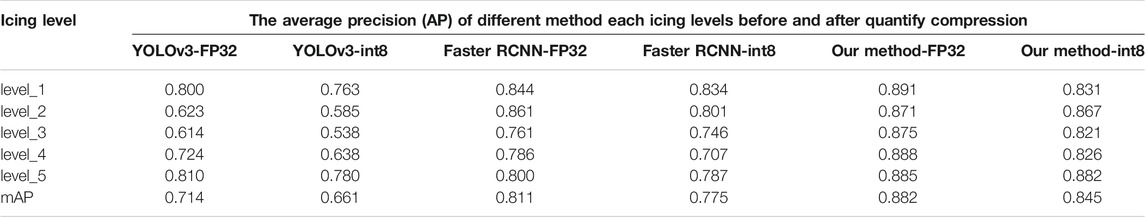
TABLE 5. The mean accuracy of different method before and after quantify compression.
In addition, for the icing online monitoring device with poor transmission conditions, it requires not only higher comprehensive detection accuracy performance, but also faster detection speed, whichs meet the real-time and reliability requirements of power grid condition monitoring. Therefore, this paper compares the changes of mAP, detection speed and model size of the three models before and after quantization compression, as shown in Tab 6.
It can be seen from Table 6, after quantization compression, the size and mAP of YOLOv3, Faster RCNN and our method are reduced, and the recognition speed of Faster RCNN model and our method also shows a downward trend, while the recognition speed of YOLOv3 is greatly improved. Besides, the sigle-stage method has the lowest mAP index for the method before and after the quantization compression. The mAP of our method combining the advantages of the single-stage method and the two-stage method is the highest, and the mAP of the Fast RCNN of the two-stage method is the middle. In addition, for the detection speed indicators before and after the quantization compression, the single-stage method YOLOv3 recognition speed is the fastest, the two-stage method Faster RCNN recognition speed is the slowest, and the ice recognition method proposed in this paper speed combining the advantages of the two methods is in the middle. At the same time, after the compression conversion and deployment to the edge, the recognition speed of YOLOv3 has been improved, while the speed of Faster RCNN to recognize a single image has reached 1 s, which can not meet the real-time requirements of power scene. Based on the above analysis, YOLOv3, Faster RCNN and our method all maintain a high mAP after quantitative compression. Although our method is slower than the single order Yolo V3 method, our method has the highest recognition accuracy in edge icing monitoring device. The speed of our method in the edge sideis up to 170 ms/pic, which can meet the actual needs of icing on-line monitoring. For the scene of insulator icing edge recognition in this paper, our method considering both detection accuracy and recognition speed can better meet the practical application requirements.
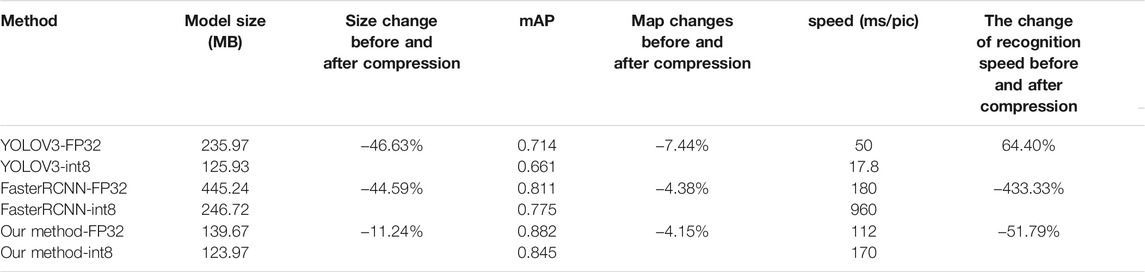
TABLE 6. Performance comparison of model before and after quantization compression.
Conclusion
To implement the front-end high-precision identification of insulator icing thickness, a lightweight icing thickness identification method based on multi-scale feature fusion and model quantization is proposed in this paper, and the advantages of the proposed method are verified by experiments. Compared with other traditional image processing methods, our method can realize front-end intelligent recognition of icing thickness without manual adjustment and setting, which can avoid the long-distance transmission of icing image and show stronger generalization ability and higher efficiency for thickness monitoring. The specific conclusions are as follows.
1) Through multi-scale feature fusion of shallow and deep features of icing image, the accuracy of ice thickness identification can be effectively improved.
2) The quantification of the model will reduce the accuracy of the icing identification method. Under the condition of the same computational power, the mAP of our method proposed in this paper and classical target detection methods is only about 4–7% lower.
3) Compared to the classical methods YOLOv3 and Faster RCNN, the proposed method has higher recognition accuracy before and after model quantization compression.
However, due to the limitation that the icing image can only reflect two-dimensional information, our method can not realize the three-dimensional measurement of icing thickness. To impelment the comprehensive perception of insulator icing thickness, the ice thickness identification method based on multi-source data fusion, including image, mechanical sensor, space distance sensor and so on will be the focus of the next research.
Data Availability Statement
The datasets presented in this article are not readily available because the requirements of the foundations. Requests to access the datasets should be directed to FM,d2h1bWZxQHdodS5lZHUuY24=.
Author Contributions
FM Drafting the manuscript, experimental analysis BW: Review and Supervision ML: Methodology and Formal analysis XD: Conceptualization and Revised YM: Data Curation and Resources YZ: Software HM: Resources.
Funding
This work was supported in part by the Guizhou Province Science and technology plan project (Gan ke he zhi cheng G.20202039).
Conflict of Interest
Authors YM and YZ were employed by State Grid Shaanxi Electric Power Company, State Grid Xi’an Power Supply Company and Guangdong Power Grid Corp, Huizhou Power Supply Bureau Co., Ltd.
The remaining authors declare that the research was conducted in the absence of any commercial or financial relationships that could be construed as a potential conflict of interest.
Publisher’s Note
All claims expressed in this article are solely those of the authors and do not necessarily represent those of their affiliated organizations, or those of the publisher, the editors and the reviewers. Any product that may be evaluated in this article, or claim that may be made by its manufacturer, is not guaranteed or endorsed by the publisher.
References
Chen, S., Wen, H., Wu, J., Lei, W., Hou, W., Liu, W., et al. (2019). Internet of Things Based Smart Grids Supported by Intelligent Edge Computing. IEEE Access 7, 74089–74102. doi:10.1109/ACCESS.2019.2920488
Dongxiao, N., Haichao, W., and Hanyu, C., (2017). The General Regression Neural Network Based on the Fruit Fly Optimization Algorithm and the Data Inconsistency Rate for Transmission Line Icing Prediction”. Energies 10 (12), 1–20. doi:10.3390/en10122066
Gang, L., Bo, W., Hui, P., Siyuan, C., Biwu, P., and Yong, S., (2018). Identification of Icing Thickness of Transmission Line Based on Strongly Generalized Convolutional Neural Network”. Proc. CSEE 38 (11), 3393–3401. doi:10.13334/j.0258-8013.pcsee.171057
Haoyong, C., Xiaojuan, W., and Zhihao, L., (2019). Distributed Sensing and Cooperative Estimation/detection of Ubiquitous Power Internet of Things. Prot. Control. Mod. Power Syst. 4, 2151–2158. doi:10.1186/s41601-019-0128-2
Jiang, X., Xiang, Z., Zhang, Z., Hu, J., Hu, Q., and Shu, L. (2014). Predictive Model for Equivalent Ice Thickness Load on Overhead Transmission Lines Based on Measured Insulator String Deviations. IEEE Trans. Power Deliv. 29 (4), 1659–1665. doi:10.1109/TPWRD.2014.2305980
Jingjing, W., Junhua, W., and Jianwei, S. (2017). Image Recognition of Icing Thickness on Power Transmission Lines Based on a Least Squares Hough Transform”. Energies 10 (415), 1–15. doi:10.3390/en10040415
Junhua, W., Shiqi, L., and Jianwei, S. (2018). Study on Dual Pre-warning of Transmission Line Icing Based on Improved Residual MGM-Markov Theory”. IEEJ Trans. Electr. Electron. Eng. 13 (4), 561–569. doi:10.1002/tee.22601
Li, H., Chen, Y., Zhang, G., Li, J., Zhang, N., Du, B., et al. (2019). Transmission Line Ice Coating Prediction Model Based on EEMD Feature Extraction. IEEE Access 7, 40695–40706. doi:10.1109/ACCESS.2019.2907635
Li, Z., Jiang, W., Abu-Siada, A., Li, Z., Xu, Y., and Liu, S. (2021). Research on a Composite Voltage and Current Measurement Device for HVDC Networks. IEEE Trans. Ind. Electron. 68 (9), 8930–8941. doi:10.1109/tie.2020.3013772
Liu, Y., Pei, S., Fu, W., Zhang, K., Ji, X., and Yin, Z. (2017). The Discrimination Method as Applied to a Deteriorated Porcelain Insulator Used in Transmission Lines on the Basis of a Convolution Neural Network. IEEE Trans. Dielect. Electr. Insul. 24 (6), 3559–3566. doi:10.1109/TDEI.2017.006840
Liu, Y., Yang, N., Dong, B., Wu, L., Yan, J., Shen, X., et al. (2020). Multi-Lateral Participants Decision-Making: A Distribution System Planning Approach with Incomplete Information Game. IEEE Access 8, 88933–88950. doi:10.1109/access.2020.2991181
Long, J., Shelhamer, E., and Darrell, T. (2015). “Fully Convolutional Networks for Semantic Segmentation[C],” in IEEE Conference on Computer Vision and Pattern Recognition (CVPR), Boston, MA, June 7–12, 2015, 3431–3440. doi:10.1109/CVPR.2015.7298965
Ma, F., Wang, B., and Dong, X., (2021). Receptive Field Vision Edge Intelligent Recognition for Ice Thickness Identification of Transmission Line. Power Syst. Technol. 45 (06), 2161–2169. 10.13335j.1000-3673.pst.2019.2382
Nan, Y., Di, Y., Zheng, Z., Jiazhan, C., Daojun, C., and Xiaoming, W. (2018). Research on Modelling and Solution of Stochastic SCUC under AC Power Flow Constraints. IET Generation, Transm. Distribution 12 (15), 3618–3625. doi:10.1049/iet-gtd.2017.1845
Nie, Z., Zhang, J., and Fu, H. (2020). Key Technologies and Application Scenario Design for Making Distribution Transformer Terminal Unit Being a Containerized Edge Node [J]. Automation Electric Power Syst. 44 (3), 154–161. doi:10.7500/AEPS20190524005
Qiangliang, G., Jin, X., and Xiaoguang, H. (2018). New Keypoint Matching Method Using Local Convolutional Features for Power Transmission Line Icing Monitoring”. Sensors 18 (698), 1–15. doi:10.3390/s18030698
Ruszczak, B., and Tomaszewski, M. (2015). Extreme Value Analysis of Wet Snow Loads on Power Lines. IEEE Trans. Power Syst. 30 (1), 457–462. doi:10.1109/tpwrs.2014.2321008
Shen, X., Ouyang, T., and Li, Y. (2021a). Chanyut Khajorntraidet, “Mixture Density Networks-Based Knock Simulator”. IEEE/ASME Trans. Mechatronics, Early Access. doi:10.1109/TMECH.2021.3059775
Shen, X., Ouyang, T., Yang, N., and Zhuang, J. (2021b). Sample-based Neural Approximation Approach for Probabilistic Constrained Programs. IEEE Trans. Neural Netw. Learn. Syst., 1–8. doi:10.1109/TNNLS.2021.3102323
Shen, X., and Raksincharoensak, P. (2021a). Pedestrian-Aware Statistical Risk Assessment. IEEE Trans. Intell. Transport. Syst., 1–9. doi:10.1109/TITS.2021.3074522
Shen, X., and Raksincharoensak, P. (2021b). Statistical Models of Near-Accident Event and Pedestrian Behavior at Non-signalized Intersections. J. Appl. Stat. Early Access, 1–21. doi:10.1080/02664763.2021.1962263
Shen, X., Zhang, X., Ouyang, T., Li, Y., and Raksincharoensak, P. (2020). Cooperative Comfortable-Driving at Signalized Intersections for Connected and Automated Vehicles. IEEE Robot. Autom. Lett. 5 (4), 6247–6254. doi:10.1109/LRA.2020.3014010
Shen, X., Zhang, Y., Sata, K., and Shen, T. (2020). Gaussian Mixture Model Clustering-Based Knock Threshold Learning in Automotive Engines. Ieee/asme Trans. Mechatron. 25 (6), 2981–2991. doi:10.1109/TMECH.2020.3000732
Shen, X., Zhang, Y., Shen, T., and Khajorntraidet, C. (2017). Spark advance Self-Optimization with Knock Probability Threshold for Lean-Burn Operation Mode of SI Engine. Energy 122, 1–10. doi:10.1016/j.energy.2017.01.065
Tiannan, M., and Dongxiao, N. (2016). Icing Forecasting of High Voltage Trans- mission Line Using Weighted Least Square Support Vector Machine with Fireworks Algorithm for Feature Selection”. Applied Sci. Basel 6 (12), 1–19. doi:10.3390/app6120438
Wang, B., Ma, F., Ge, L., Ma, H., Wang, H., and Mohamed, M. A. (2021). Icing-EdgeNet: A Pruning Lightweight Edge Intelligent Method of Discriminative Driving Channel for Ice Thickness of Transmission Lines. IEEE Trans. Instrum. Meas. 70, 1–12. Art no. 2501412. doi:10.1109/TIM.2020.3018831
Wang, Y., Zhao, W., and Zhang, J. (2020). Inheritance and Expansion Analysis of Research Topics between Energy Internet and Smart Grid. Automation Electric Power Syst. 44 (4), 1–7. doi:10.7500/AEPS20190710007
Wei, S., and Caifei, W. (2019). Staged Icing Forecasting of Power Transmission Lines Based on Icing Cycle and Improved Extreme Learning Machine”. J. Clean. Prod. 208, 1384–1392. doi:10.1016/j.jclepro.2018.10.197
Xingliang, J., Xingbo, H., and Yuyao, H. (2018). Model for Ice Wet Growth on Composite Insulator and its Experimental Validation”. IET Generation Transmission Distribution 12 (3), 556–563. doi:10.1049/iet-gtd.2017.0227
Yan, B., Chen, K., Guo, Y., Liang, M., and Yuan, Q. (2013). Numerical Simulation Study on Jump Height of Iced Transmission Lines after Ice Shedding. IEEE Trans. Power Deliv. 28 (1), 216–225. doi:10.1109/TPWRD.2012.2219324
Yang, N., Huang, Y., Hou, D., Liu, S., Ye, D., Dong, B., et al. (2019). Adaptive Nonparametric Kernel Density Estimation Approach for Joint Probability Density Function Modeling of Multiple Wind Farms. Energies 12, 1356. doi:10.3390/en12071356
Yang, N., Liu, S., Deng, Y., and Xing, C. (2021). An Improved Robust SCUC Approach Considering Multiple Uncertainty and Correlation. IEEJ Trans. Elec Electron. Eng. 16, 21–34. doi:10.1002/tee.23265
Yang, N., Yang, C., Wu, L., Shen, X., Jia, J., Li, Z., et al. (2021). Intelligent Data-Driven Decision-Making Method for Dynamic Multi-Sequence: An E-Seq2Seq Based SCUC Expert System. IEEE Trans. Ind. Inf., 1. doi:10.1109/TII.2021.3107406
Yanpeng, H., Xiaolan, J., and Lin, Y. (2017). Evaluation of Natural Icing Condition for In-Service Insulators Based on Image Segmentation. High Voltage Eng. 43 (1), 285–292. doi:10.13336/j.1003-6520.hve.20161227037
Ying, J., Cai, Y., and Liu, M. (2020). Adaptive Access Method of Low Voltage Intelligent Terminal for Distribution Internet of Things”. Automation Electric Power Syst. 44 (2), 22–27. doi:10.7500/AEPS20190827004
Yongsai, Z., Guangyuan, W., and Hong, Y. (2017). “Research on the Application of the Edge Detection Method for the UAVs Icing Monitoring of Transmis- Sion Lines”,” in IEEE International Conference on Mechatronics and Automation (ICMA), Takamatsu, August 6–9, 2017, 1110–1114. doi:10.1109/ICMA.2017.8015972
Zhang, L., and Luo, Y. (2018). Combined Heat and Power Scheduling: Utilizing Building-Level thermal Inertia for Short-Term thermal Energy Storage in District Heat System. IEEJ Trans. Elec Electron. Eng. 13 (6), 804–814. doi:10.1002/tee.22633
Zhang, M., Pang, K., Gao, C., and Xin, M. (2020). Multi-Scale Aerial Target Detection Based on Densely Connected Inception ResNet. IEEE Access 8, 84867–84878. doi:10.1109/access.2020.2992647
Zhang, Y., Huang, X., Jia, J., Zhu, Y., Zhao, L., and Zhang, X. (2020). Detection and Condition Assessment of Icicle Bridging for Suspension Glass Insulator by Image Analysis. IEEE Trans. Instrum. Meas. 69 (10), 7458–7471. doi:10.1109/TIM.2020.2984965
Zhao, Y., Han, R., and Rao, Y. (2019). “A New Feature Pyramid Network for Object Detection,” in International Conference on Virtual Reality and Intelligent Systems (ICVRIS), Jishou, September 14–15, 2019IEEE, 428–431. doi:10.1109/ICVRIS.2019.00110
Zhou, Z., Chen, X., Li, E., Zeng, L., Luo, K., and Zhang, J. (2019). Edge Intelligence: Paving the Last Mile of Artificial Intelligence with Edge Computing. Proc. IEEE 107 (8), 1738–1762. doi:10.1109/JPROC.2019.2918951
Zhu, B., Ding, F., and Vilathgamuwa, D. M. (2020). Coat Circuits for DC-DC Converters to Improve Voltage Conversion Ratio. IEEE Trans. Power Electron. 35 (4), 3679–3687. doi:10.1109/tpel.2019.2934726
Keywords: intelligent perception, transmission line, icing monitoring, power depth vision, edge computing, model quantification, power grid safety
Citation: Ma F, Wang B, Li M, Dong X, Mao Y, Zhou Y and Ma H (2021) Edge Intelligent Perception Method for Power Grid Icing Condition Based on Multi-Scale Feature Fusion Target Detection and Model Quantization. Front. Energy Res. 9:754335. doi: 10.3389/fenrg.2021.754335
Received: 06 August 2021; Accepted: 15 September 2021;
Published: 04 October 2021.
Edited by:
Xun Shen, Tokyo University of Agriculture and Technology, JapanReviewed by:
Yuanchao Hu, Shandong University of Technology, ChinaNan Yang, China Three Gorges University, China
Copyright © 2021 Ma, Wang, Li, Dong, Mao, Zhou and Ma. This is an open-access article distributed under the terms of the Creative Commons Attribution License (CC BY). The use, distribution or reproduction in other forums is permitted, provided the original author(s) and the copyright owner(s) are credited and that the original publication in this journal is cited, in accordance with accepted academic practice. No use, distribution or reproduction is permitted which does not comply with these terms.
*Correspondence: Bo Wang, d2h3ZHdiQHdodS5lZHUuY24=