 Xiaohui Duan
 Fangpin Tang2
 Jian Chen
 Wenyong Duan
- 1School of Electrical Engineering, Yancheng Institute of Technology, Yancheng, China
- 2College of Hydraulic Engineering, Yangzhou University, Yangzhou, China
- 3Jiangsu Surveying and Design Institution of Water Resources Co., Ltd., Yangzhou, China
The hydraulic excitation characteristics of axial flow pump unit are studied through theoretical analysis, numerical simulation and field test in this paper. The correlation between impeller hydraulic and radial vibration displacement of impeller centroid is obtained through theoretical analysis. Through the 1-way fluid-solid-interaction (FSI) numerical simulation, the distributions of water pressure and displacement on the impeller surface are obtained, and the time-domain and frequency-domain characteristics of transient hydraulic and radial displacement are revealed. Through the field test, the external characteristics of axial flow pump unit and the time-frequency characteristics of the pressure pulsation at the measuring points beside the inlet of the impeller are obtained. The comparisons between simulation results and experimental results show that the former is accurate and reliable.
1 Introduction
With the construction of the whole line of the South-to-North Water Transfer Project in China and the renewal of national pumping stations, the number of large-scale axial-flow pumping stations is gradually increasing, and its safe operation has also attracted attention from all aspects. From the operation of pump stations built at home and abroad, vibration problems often affect the safe operation of pumping stations. Hydraulic excitation is one of the main reasons for the vibration of axial-flow pump unit, especially the rotor system of the unit. Transient hydraulic excitation of axial flow pump refers to the vibration characteristics of axial flow pump components under complex unsteady flow actions, such as cavitation, rotating stall, dynamic and static interference, inlet and outlet reflux and so on. Therefore, the research on the hydraulic excitation characteristics of axial flow pump includes two aspects: the research on the internal flow field of pump device and the vibration response of the pump unit.
At present, there are many achievements in the research of the internal flow field of axial flow pump. Firstly, the velocity distributions at the inlet and outlet of the rotor are studied, and the unsteady numerical simulation is carried out to understand the complex internal flow structure in the rotor (Cao et al., 2013). The influence of rotor-stator axial clearance on tonal noise produced by axial fan used in automotive cooling system is studied (Canepa et al., 2015). The existence of impeller tip clearance amplifies the pressure fluctuation in the impeller area from the hub to the shroud (Feng et al., 2016). The steady and unsteady internal flow fields of large vertical axial flow pump are studied, and the mechanism of low-frequency pressure fluctuation in pump unit under stall condition is revealed (Kan et al., 2018). The effects of sweep angle, blade pitch angle and hub inlet angle on the hydraulic characteristics of submersible axial flow pump were studied by using three-dimensional Reynolds averaged Navier Stokes Equation (Kim et al., 2019). The hydrodynamic characteristics of axial flow pump with inconsistent blade angle are studied. The results show that the pressure pulsation caused by blade angle deviation is mainly low-frequency pulsation (Shi et al., 2021). The above research shows that the change of internal flow field in axial flow pump is closely related to inlet and outlet velocity, tip clearance and blade angle. The stress distribution in the impeller are calculated. The results show that the equivalent stress in the blade hub firstly increases and then decreases from the leading edge to the trailing edge (Pei et al., 2016). The study on the stability of the pump station unit in reverse generation shows that the stress is mainly concentrated at the root of the pressure side and suction side of the blade, and the maximum equal stress appears at the suction side of the blade (Zhou et al., 2021). The above literature reveals the distribution law of water acting force on blades. The three-dimensional unsteady numerical simulation of complex turbulent flow field in axial flow pump is carried out. The results show that the dominant frequency is in good agreement with the blade passing frequency (Shuai et al., 2014). Simulation of the flow rate of three pumps with different number of blades shows that the blade passing frequency and its harmonics dominate the pressure fluctuation spectrum (Kang et al., 2015). The above two literatures show that the blade passing frequency is the main frequency component of fluid exciting force in the impeller. Based on the numerical simulation method, the internal flow pulsation characteristics of the new S-type axial extension pump device are studied. It is calculated that the radial force vector diagrams under different working conditions show petal shape, which further reveals the characteristics of the fluid exciting force in the impeller of the axial flow pump (Yang, 2013).
The research on the vibration response of axial flow pump unit mainly consists of the following results. The transient characteristics of axial flow pump during start-up are studied experimentally and numerically (Fu et al., 2020). The numerical study of vibration characteristics reveals the time and frequency laws of fluid pressure pulsation and structural vibration at the same position in a vertical axial flow pump (Zhang et al., 2019). The impeller fluid structure coupling solution strategy is used to solve the severe vibration of reversible axial flow pump. It shows that the total deformation increases and the equivalent stress first increases and then decreases (Meng et al., 2018). By comparison, it is found that the pressure pulsation at the inlet of the impeller is the main reason for the hydraulic induced vibration of the pump device (Duan et al., 2019). The above research shows that the vibration of axial flow pump unit is closely related to the change of internal flow field. The full-scale structural vibration and noise caused by fluid in an axial flow pump are simulated by hybrid numerical method. The results are consistent with the 28 spectral characteristics of unsteady pressure fluctuation, indicating that there is a correlation between fluid exciting force and vibration spectrum (Chen et al., 2016). According to the vibration signal monitoring, the cavitation performance of axial flow pump is obtained (Shervani-Tabar et al., 2018). The effects of the number of guide vanes on the pressure fluctuation and structural vibration acoustics caused by unsteady flow are studied by hybrid numerical method. The results show that the blade passing frequency is the dominant frequency of pump vibration acceleration (Li et al., 2018). A flexural torsional coupling rotor bearing system with rub impact under electromagnetic excitation of hydro generator unit is established. The system reveals that the dynamic characteristics of the system will change significantly when the composite eccentricity is considered (Zhang et al., 2021). The mechanical response of the selected rotor system model to pressure fluctuation is simulated, and the model accuracy of the system under turbulence effect is improved (Silva et al., 2021). The small difference between vibration test results and fluid-solid-interaction (FSI) analysis results is confirmed, and the applicability and reliability of FSI analysis method are verified (Lee et al., 2021). The research results on the vibration response of axial flow pump unit reveal the correlation between the unit vibration and internal flow field, and the analysis method is advanced, but no clear conclusions about hydraulic excitation characteristics of axial-flow pump unit have been drawn.
As an important graph of rotor vibration signal, the impeller’s centroid trajectory (the trajectory of its geometric center when the rotating shaft rotates) can intuitively understand the motion characteristics of the system. For the rotor system with faults, the centroid trajectory diagram contains a large amount of fault vibration information, which is an important basis for judging the rotor operating state and fault symptoms. Because the impeller is the part in the rotor system of axial-flow pump unit, which is in direct contact with water, and the clearance distance at the top of the blade is very small, the axis trajectory of the impeller is also an important criterion to judge whether the rotor system is stable or not. The axis trajectory of a normally operating rotor system usually presents an elliptical shape with little difference between the long and short axes. The characteristics of the centroid trajectory when mechanical faults occur in the rotor system is summarized. It is found that the axis trajectory will appear “8” or “crescent” shaped when various misaligned faults occur in the rotor system (Li and Li, 2014). The characteristics of centroid trajectory in mechanical faults such as rub impact, asymmetric support and crack are studied. It is found that the smaller the rub impact gap is, the thicker the elliptical pattern is and the more harmonic components are; the closer the crack is to the measured axis, the more serious the axis trajectory distortion is; the more serious the asymmetric support fault is; the more obvious the period doubling phenomenon in the centroid trajectory is (Han et al., 2010). The hydraulic excitation characteristics of centrifugal pump model device are studied by using the combination of experimental measurement and FSI numerical simulation. It is found that under the action of hydraulic excitation, the elliptical track of centrifugal pump impeller axis becomes a distorted ellipse containing high-frequency harmonics, which reveals the hydraulic excitation mechanism of centrifugal pump (Shi et al., 2017). This paper will refer to the method of this paper. Firstly, through theoretical analysis, the relationship between the hydraulic pressure on the impeller and the axial vibration displacement of the blade wheel is obtained and the vertical axial flow pump unit with the box culvert channel is taken as an example. Then, the hydrodynamic pressure on the impeller and the axial vibration displacement of the impeller are calculated through the 1-way FSI numerical simulation to verify the rationality of the theoretical analysis. Finally, the accuracy of the numerical simulation is verified by comparing the field test results of the pump station with the numerical simulation results.
2 Theoretical Analysis
2.1 Mathematical Model of Hydraulic Excitation
The hydraulic excitation of rotor system of axial flow pump unit satisfies the general Equation of rotor dynamics. According to Lagrange’s theorem, the hydraulic excitation Equation is as follows
where M, C, and K represent the mass coefficient, damping coefficient and stiffness coefficient respectively, and the
ai, bi in Eq. (2) and Eq. (3) represent the amplitude of each frequency component of displacement and force. n is the number of frequency components. fi is the frequency. φi represents the phase. αi and bi can be expressed by Eq. 4 and Eq. 5. Eq. (5).
It is clear from Eq. (2) and Eq. (3) that the frequencies of force and displacement correspond one by one, but their phases and amplitudes are different. The phase angle αi and force amplitude bi are consistent with M, C, K and fi. If C = 0, X(t), and F(t) are in the same phase, and if C → ∞, the phase difference between X(t) and F(t) is π/2.
2.2 Rotor-Stator Interaction
The axial flow pump studied in this paper has three blades and five guide vanes. The expanded section of blade and guide vane at 0.5 times radius is shown as Figure 1A. Rotor-Stator Interaction refers to the interaction between the flow field in the flow channel between adjacent guide vanes and the flow field in the flow channel between adjacent blades. The flow field after interference will produce periodic force on the blades. It is clear from Figure 1A that the phase difference between adjacent guide vanes is 2π/5, while it is 2π/3 between adjacent blades. Assuming that blade 2 and guide vane 4 are aligned at the initial time, the phase difference between blade 3 and guide vane 1 is 2π/15, which is the same as the phase difference between blade 1 and guide vane 2. This is shown in Figure 1B. The case shown in Figure 2B is extended to the case of any number (for example the number is 1) of guide vanes and three blades, the phase difference between the blade and the nearest guide vane is
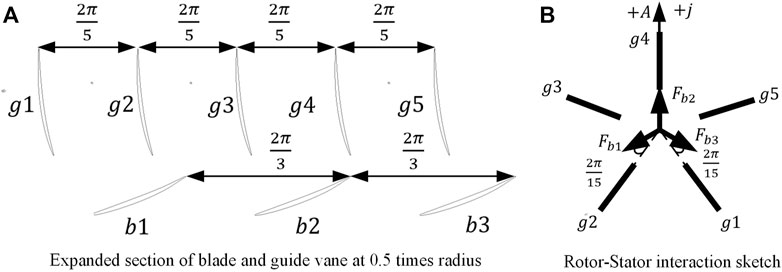
FIGURE 1. Schematic diagram of rotor-stator expanded section and interaction sketch.
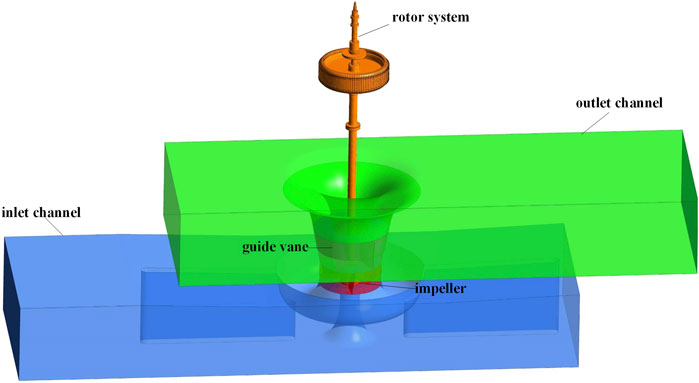
FIGURE 2. Structural composition of vertical axial flow pump unit with tank channel.
3 Numerical Simulation
The hydraulic excitation Eq. 1 mentioned in the theoretical analysis is a second-order partial differential Equation. In addition, the force of water on the impeller F (t) in the Equation needs to be obtained by solving the fluid control Equation (a partial differential Equation), so it is difficult to obtain the axis trajectory under hydraulic excitation by analytical method. In this paper, the 1-way FSI analysis method based on Workbench software is used to realize the numerical simulation of hydraulic excitation. That is, in each calculation time step, firstly the numerical calculation of the internal flow field control Equation of the axial flow pump device is completed, then the calculation results to the FSI interface in the impeller is transferred, and the numerical calculation of the structural control Equation of the rotor system is completed. On the FSI interface, the variables such as stress, displacement, heat flow and temperature of fluid and structure are equal or conserved. The fluid control Equation is the Equations combining RANS Equation and SST k-ω model. The fluid force on the interface of FSI was obtained by CFX solver based on finite volume method (using the fully implicit multigrid coupling method to solve the momentum Equation and continuity Equation). The turbulence model uses SST k-ω model because it uses mixing functions to gradually transition from the standard k-ω model near the wall to the high Reynolds number k-ɛ model outside the boundary layer. This paper mainly studies the characteristics of water force on the surface of flow passage components, so the turbulence model is more suitable. The residual type in the convergence criterion adopts RMS, the residual target is set to 1e−8, and the maximum number of cycles in each iteration step is set to 10. The structural control Equation is Eq. 1, which is solved by ANSYS solver based on the finite element method (the implicit iterative method combining Newmark time integration and HHT algorithm) to obtain the displacement distribution at any point of the rotor system, including radial displacement of impeller’s centroid. The data transfer on the FSI interface and the coordination of the two solvers are accomplished through the ANSYS Multifield Coupling solver. The time step of fluid calculation and structure calculation is equal to each other.
3.1 Axial Flow Pump Unit Model
The axial flow pump unit studied in this paper consists of four parts, which are inlet channel, outlet channel, guide vane and rotor system. The impeller is contained in rotor system. The structural composition of vertical axial flow pump unit is shown in Figure 2. This 3D model can be imported into the Workbench platform to complete the FSI simulation between the water in the channel and rotor system.
The length, width and height of the inlet channel are 31.0155, 9.66 and 4.4045 m respectively, while they are 28.704, 9.66, and 4.4045 m respectively of the outlet channel. The diameter of the impeller is 3.45M, and it is 3.4155 m of the guide vane inlet, and outlet diameter is 4.416 m.The rated speed is 100RPM. The design lift is 1.22 m and the design flow is 33,459.25 L/s.
The time step information required for unsteady simulation has a great impact on the calculation results. The time step setting should meet the Whittaker-Shannon sampling theorem, so as to avoid mixing phenomenon at the concerned frequency. It is not difficult to deduce that total time and time steps satisfy the Eq. 7, as shown below.
where, Δt is calculation time step rotation angle of each step; Δφ is water pump speed; n is sampling frequency; T is total sampling time; C is rotation number of water pump; Δf is sampling frequency resolution.
The rated speed of the axial flow pump studied in this paper is 100RPM, so the rotation frequency is 1.67 Hz. The axial flow pump has 3 blades and 5 guide vanes, so theoretically, each blade will be interfered by a static guide vane with 5 times rotating frequency, and the water quality point between the blade and guide vane will be interfered by 15 times rotating frequency. Therefore, the highest frequency concerned is set as 15 times of the rotating frequency, which is 25 Hz. Therefore, according to Whittaker-Shannon sampling theorem, in order to avoid mixing phenomenon at the concerned frequency, the sampling frequency should be 5 to 10 times of the highest frequency. From the Eq. 7, the corresponding rotation angle of each step is 3°, and the time step or time step is 0.005 s. In order to obtain stable numerical simulation results, the total time is set as 6 rotation cycles, that is, C = 6 and the total time is 3.6 s. The stability of the calculated results can be obtained from the time domain analysis by taking the last four rotation periods as time-frequency domain analysis.
3.2 Grid Division and Independence Test
The quality of the grid will affect the stability of the calculation, and the size and quantity of the grid will lead to great deviation of calculation results. Therefore, the information and independence test of grid is very important. The axial flow pump unit is composed of fluid domain and structure domain. The three-dimensional water model of the inlet and outlet channels in the fluid domain is meshed in ANSYS ICEM software. The three-dimensional water area model of impeller and guide vane and its grid division are completed in TurboGrid software. The hexahedral structured grid is uniformly adopted for the calculation grid, so as to improve the computing efficiency and ensure the calculation accuracy. The renderings of water area grid division of model pump device is shown in the Figure 3, with the grid quality exceeding 0.37.
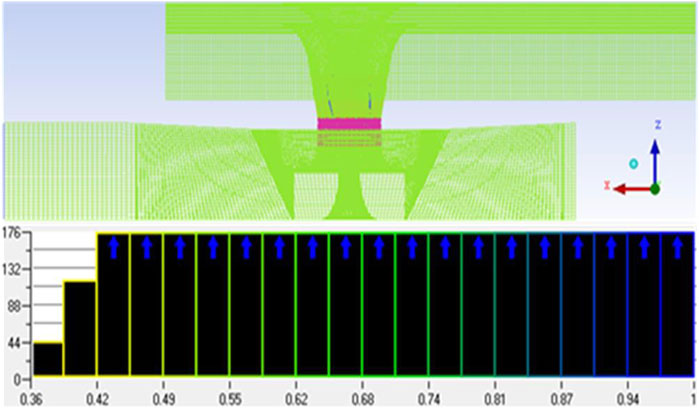
FIGURE 3. Fluid domain mesh quality.
The statistics of grid number and node number are shown in Table 1. Before numerical calculation, it is necessary to verify whether the number of grids has an impact on the calculation results. The proof of grid independence of this model is given in the literature (Shi et al., 2017). It is pointed out that when the number of grids exceeds 2,500,000, the calculation results are basically unchanged with the increase of the number of grids, so the number of grids in this model meets the requirement of independence. The grid division of rotor system structure domain is completed through the mesh function of ANSYS mechanical software, and the unstructured grid is adopted. The rotor system grid is shown in the Figure 4.

TABLE 1. Fluid domain mesh nodes and number of meshes.
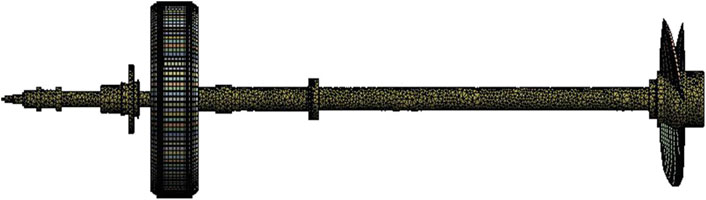
FIGURE 4. Mesh of rotor system.
The grid test of rotor system is completed by increasing grid size from 0.04 to 0.2 m at an interval of 0.02 m. The radial static displacement of the impeller under the action of the steady flow field of the impeller axis under each grid size is shown in Figure 5.
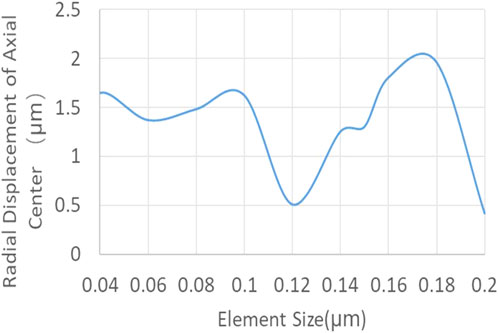
FIGURE 5. Grid test of rotor system.
It can be seen from Figure 5 that, the grid size varies greatly in the range of 0.1–0.2 m, and it is stable in the range of 0.04–0.1 m, whose variation displacements do not exceed 0.5 μm. If the grid size is less than 0.04 m, the calculation time and memory consumption increase exponentially. After comprehensive consideration, the element size of the rotor system is selected as 0.1 m, which is consistent with the fluid grid size, so as to facilitate the data transmission at the interface of fluid-structure coupling. The total grid number of the rotor system is 73,251.
3.3 Numerical Simulation Platform
The flow chart of FSI simulation on the Workbench platform is shown in Figure 6. The flow chart contains four modules, namely, A, B, C and D. Module A is responsible for steady-state flow field calculation, while module D is responsible for unsteady flow field calculation. The water model contained in inlet channel, impeller, guide and outlet channel is input into modules A and D. The steady and unsteady forces of the flow passage parts are solved respectively by solving RANS Equation and combining with turbulence model. The 3D model of rotor system is input into module B and C. The calculation results of module A are loaded on the blades and hub surfaces of the impeller in module B. Then the static displacement distribution of the rotor system under the action of steady-state flow field is calculated by solving Eq. 1, where F(t) is a constant calculated by model A, while M and C are both equal to zero. The calculation results of module D are gradually loaded on the blades and hub surfaces of the impeller in module C, and then the transient vibration of the rotor system is calculated by solving Eq. 1. The boundary conditions of rotor model in modules B and C are set separately, as shown in Figure 7. It can be seen from Figure 7 that the boundary conditions of the two are basically the same. The only difference is that the loading force of module C is unstable, while that of module B is stable.
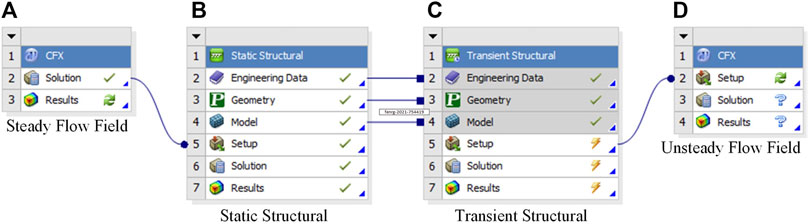
FIGURE 6. Flow chart of fluid structure coupling calculation.
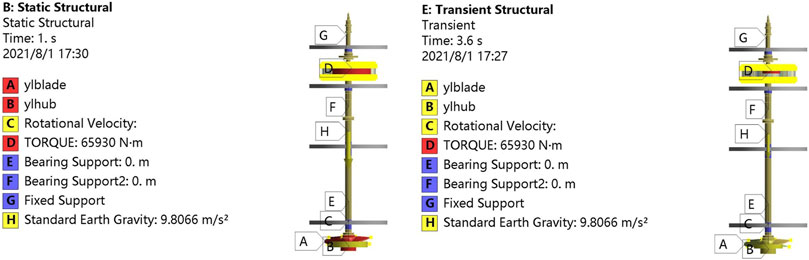
FIGURE 7. Boundary conditions of rotor model.
3.4 Analysis of Simulation Results
3.4.1 Static Response of Impeller Under Steady Flow Field
The simulation results of modules A and B are shown in Figure 8. It can be seen from Figure 8 that the maximum value of constant water pressure acting on the impeller is concentrated at the blade inlet, followed by the area close to the rim on the pressure surface. There is a negative pressure area on the suction surface. The maximum deformation occurs in the blade, which is consistent with the pressure distribution, followed by the hub axial and the motor rotor.
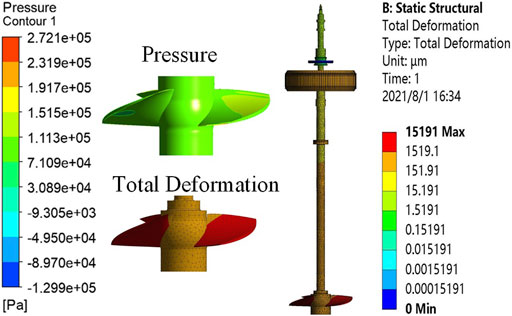
FIGURE 8. Steady force of impeller and static displacement of rotor system.
3.4.2 Verification of Rotor-Stator Interaction
The time and frequency domain diagram of unsteady flow field force on three blades, which are calculated by module D are shown in Figure 9. It can be seen from the figure that the time domain waveform of the force on three blades has no obvious periodicity, but the periodicity of the synthetic force on three blades is obvious. It can be seen from the frequency domain diagram of force that the force spectrum of the three blades are completely consistent. The main frequency is twice of shaft frequency, which can be recorded as f1, and the secondary domain frequency contains f3, f4, f5. However, the spectrum of the resultant force of the three blades only contains f3, f6, f9, which is consistent with the conclusion of Eq. 6.
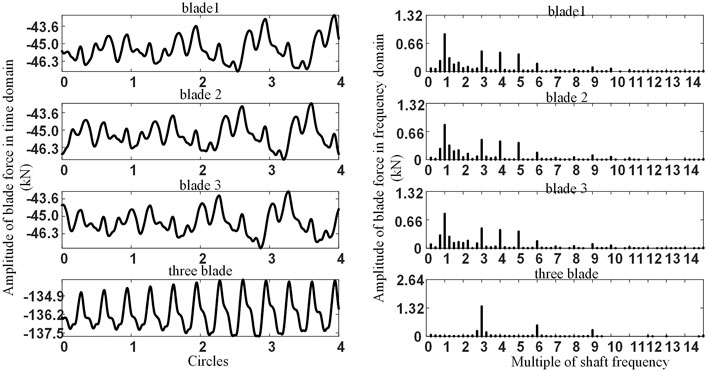
FIGURE 9. Time and frequency domain diagram of the force on three blades.
3.4.3 Time-Frequency Domain Analysis of Impeller Force and Radial Centroid Trajectory
The radial force and radial centroid trajectory of the impeller are shown as Figure 10. It can be seen from Figure 10 that the radial force of the blade and the hub are basically the same, but their shapes are different, and the rotational symmetry of the radial force on blades is more obvious. The radial centroid trajectory shows obvious triangular characteristics. According to the analysis of the numerical simulation results of the water receiving force of the impeller, the characteristics of the water receiving force of the blade are caused by the dynamic and static interference between the blade, the inlet channel and the guide vane. The hub is of rotational symmetry geometric characteristics, and the water bearing force is evenly distributed at most of the overflow wall. However, the water bearing force distribution at the junction of blade and hub is the same as that of blade, which is the main reason why the radial forces of blade and hub are basically the same. The radial centroid trajectory shows obvious triangular characteristics, indicating that the three times conversion frequency component accounts for the main proportion in the radial synthetic displacement frequency component. The time and frequency domain diagrams of the impeller radial force and radial centroid displacement are shown in Figure 11. It can be seen from Figure 11 that the dominant frequencies of radial force and radial centroid displacement of impeller are both f1, and other frequency components can be ignored. The amplitude and phase of f1 are different from radial force to axial displacement, which is consistent with the conclusion of Eqs 2 and 3. The force spectrums of blade in X and Y direction are basically the same, which is the same as the force spectrums of hub and displacement spectrums of axis center point, indicating that the radial force and displacement are balanced.
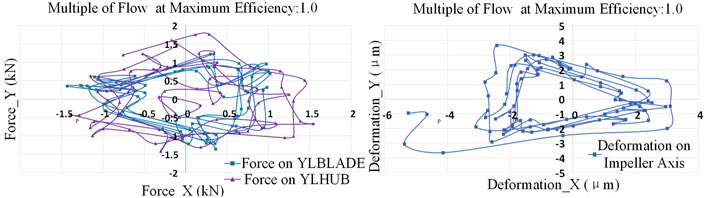
FIGURE 10. Radial force and radial centroid trajectory of impeller.
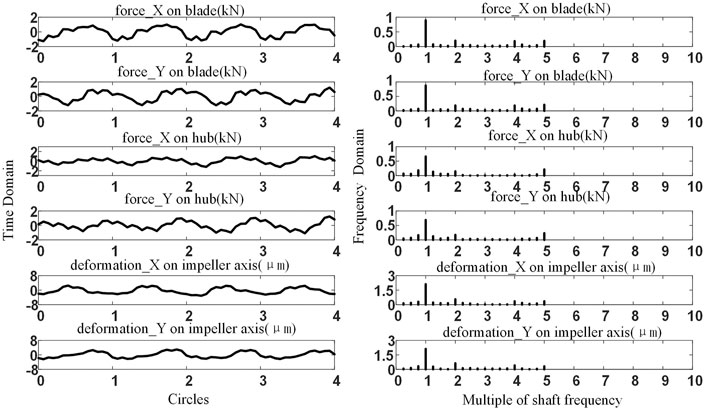
FIGURE 11. Time and frequency domain diagram of the impeller radial force and axial displacement.
According to the time domain response in Figure 11, it can be found that there is an obvious periodicity of the radial force on the axial flow pump blade in the last four rotation cycles of the total calculation time, indicating that the numerical calculation results are convergent. In order to further verify the accuracy of numerical simulation, the field test is carried out, and the numerical simulation and field test results of the external characteristics of the axial flow pump unit and the pressure pulse action of the measuring point at the inlet of the impeller are compared, as described below.
4 Comparison Between Field Test and Numerical Simulation
4.1 Test Platform
The axial-flow pump unit introduced in this paper has been applied in a pump station project of a water conservancy project and has completed the trial operation. In the field test, the pressure pulsation signals of two measuring points at the impeller inlet are detected by Keller pressure pulsation sensor 23SY and transmitted to TN-8000 data collector. The head of the pump unit is obtained by measuring the water level difference between the inside and outside of the pump station, and the flow is measured by the Doppler tester. The shaft power is calculated by the voltage, current and power factor data collected by the sensor, and the efficiency is calculated by head, flow and shaft power.
The flow, head, torque, speed and other sensors in the field test instrument have been verified by the nationally recognized measurement and calibration department in China, and the calibration time is within the validity period. The uncertainty of the test system can be reflected by the total uncertainty of efficiency test, and the calculation formula is as follows
where Eη is the total uncertainty of efficiency test;
where EQ is system uncertainty of flow measurement, and the full range of its calibration result is ±0.18%; EH is system uncertainty of static head measurement, and the full range of its calibration results is ±0.015%. The dynamic head can be ignored because of the large cross-sectional area of the pressure measuring section between the inlet and outlet water channel and small flow velocity. Therefore, EH is the system error of device head measurement. EH is the system uncertainty of torque measurement, and the uncertainties of torque and speed sensor are ±0.24%; EH is system uncertainty of speed measurement. When the sampling period of the measurement system is 2 s and the speed is not less than 1000 RPM, the uncertainty is ±0.05%. From the Eq. 9, the system uncertainty is ±0.2612%. Under the working condition near the stable design head, the uncertainty of performance test is estimated according to the dispersion degree of efficiency measurement. The calculation formula is as Equation (10)
where
4.2 Comparison of External Characteristics
The comparison of external characteristics between test and simulation is shown in Figure 12. It can be seen from Figure 12 that the test values of head and efficiency match well with the simulation values in the range from small flow to design flow. In the large flow area, the maximum head difference between test value and simulation value is 0.4 m, and the maximum efficiency difference is 28%.
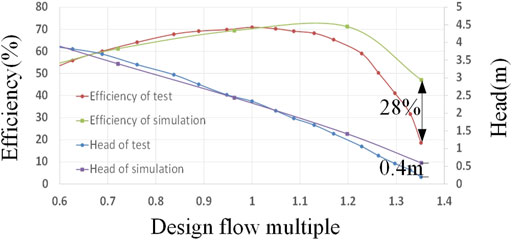
FIGURE 12. Comparison of pressure fluctuation.
There is a certain difference in the head and efficiency curves in Figure 12, but the values with large differences are concentrated in the large flow area, and the matching degree between the small flow area and the design flow area is high. According to the efficiency calculation formula, the efficiency difference between numerical simulation and field measurement is mainly due to the large head value obtained by numerical simulation at large flow. The axial flow pump unit model used in the numerical simulation is greatly simplified compared with the actual unit, such as the roughness of the surface of the flow passage parts, the installation process of the unit and the structural composition of the unit, which leads to the small hydraulic loss in the numerical simulation, so the calculated head is too large. However, under large flow, the impeller is more fully affected by the fluid, so the difference of external characteristics does not affect the characteristics of radial centroid trajectory caused by hydraulic excitation under large flow. This paper mainly studies the variation law of hydraulic excitation radial centroid trajectory under the flow condition corresponding to the maximum efficiency (i.e. 1.2 times the design flow). The error of numerical simulation is relatively small, and the comparisons between experimental measurement and numerical simulation results of pressure pulsation at the measuring points beside the impeller inlet under this flow will further prove the reliability of numerical simulation.
4.3 Comparison of Pressure Fluctuation
The time-frequency domain diagram of numerical simulation of pressure fluctuation at the measuring points beside impeller inlet obtained through simulation and test are shown in Figures 13,14, respectively. By comparing Figures 13, 14, it is clear that the pressure at the two measurement points are almost the same, but the amplitude is different. The dominant frequency of both is f3 (blade passing frequency) with an amplitude of about 3.5 kPa in simulation, while its amplitude is almost 2.0 kPa in field test. The comparison results of simulation and test on the aspect of external characteristics and pressure fluctuation show that the numerical simulation can accurately reflect the actual operation of axial flow pump unit.
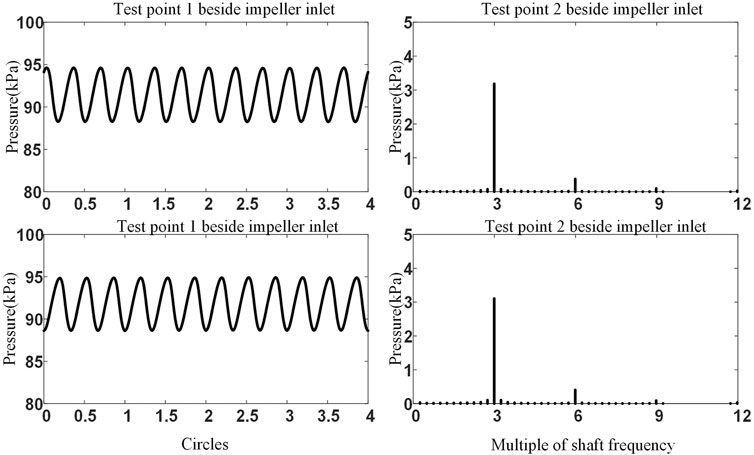
FIGURE 13. Time frequency domain diagram of pressure by simulation.
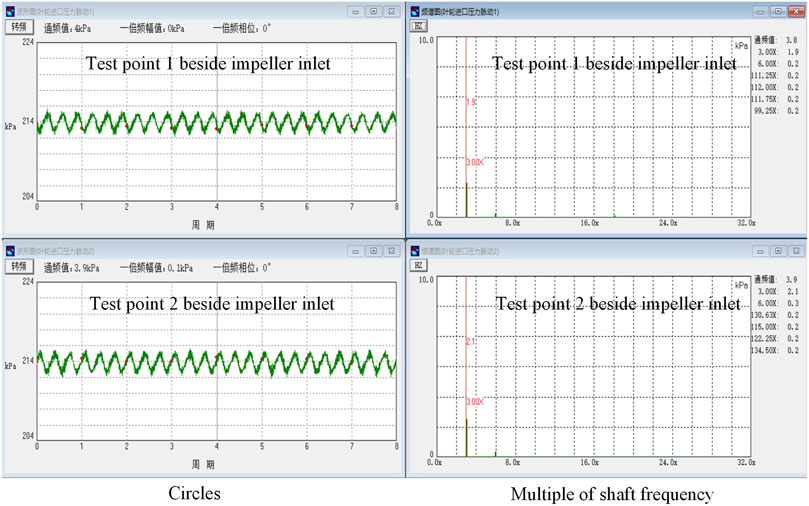
FIGURE 14. Time frequency domain diagram of pressure by test.
5 Conclusion
In this paper, the hydraulic excitation characteristics of axial flow pump unit are studied through theoretical analysis, numerical simulation and field test. Through theoretical analysis, it is found that the frequency of the axial displacement corresponds to the force acting on the impeller, but the amplitude and phase, which are related to the mass coefficient, damping coefficient, stiffness coefficient and frequency, are different from the displacement to the force. The force on a single blade includes the rotor-stator interaction frequency component between the blade and the guide vane. However, in the resultant force of the three blades, there is only blade passing frequency and its harmonics. Through numerical simulation, it is found that the pressure distribution of the impeller corresponds to the vibration deformation distribution, and the motor rotor and shaft also deform under the hydraulic action of the impeller. The frequency component of the force on the blades is the same as that of transient centroid trajectory displacement, which is consistent with the conclusions of theoretical analysis. The external characteristics of the axial flow pump unit obtained from the field test and the pressure pulsation value at the measuring point beside the impeller inlet are basically consistent with the numerical simulation results, which shows that the numerical simulation results are accurate and reliable.
Data Availability Statement
The original contributions presented in the study are included in the article/Supplementary Material, further inquiries can be directed to the corresponding author.
Author Contributions
XD completes the conception and writing of the whole manuscript. FT provides all the parameters of axial flow pump in the manuscript and gives guidance to the research method. HX completes the numerical simulation. JC provides guidance for numerical simulation analysis methods. QL helps to determine the overall framework of the manuscript. WD provides help for the theoretical analysis in the manuscript. RZ provides help for the field tests in the manuscript.
Funding
This research was supported by the Natural Science Foundation of the Jiangsu Higher Education Institutions of China (Grant NO. 19KJB470036) and National Natural Science Foundation of China under Grant NO. 62003292.
Conflict of Interest
RZ was employed by the company Jiangsu Surveying and Design Institution of Water Resources Co., Ltd.
The remaining authors declare that the research was conducted in the absence of any commercial or financial relationships that could be construed as a potential conflict of interest.
Publisher’s Note
All claims expressed in this article are solely those of the authors and do not necessarily represent those of their affiliated organizations, or those of the publisher, the editors and the reviewers. Any product that may be evaluated in this article, or claim that may be made by its manufacturer, is not guaranteed or endorsed by the publisher.
References
Canepa, E., Cattanei, A., and Mazzocut Zecchin, F. (2015). Effect of the Rotor-Stator gap Variation on the Tonal Noise Generated by Axial-Flow Fans. Appl. Acoust. 94, 29–38. doi:10.1016/j.apacoust.2015.01.015
Cao, L., Watanabe, S., Imanishi, T., Yoshimura, H., and Furukawa, A. (2013). Experimental Analysis of Flow Structure in Contra-rotating Axial Flow Pump Designed with Different Rotational Speed Concept. J. Therm. Sci. 22, 345–351. doi:10.1007/s11630-013-0634-x
Chen, E., Ma, Z., Zhao, G., Li, G., Yang, A., and Nan, G. (2016). Numerical Investigation on Vibration and Noise Induced by Unsteady Flow in an Axial-Flow Pump. J. Mech. Sci. Technol. 30, 5397–5404. doi:10.1007/s12206-016-1107-4
Duan, X., Tang, F., Duan, W., Zhou, W., and Shi, L. (2019). Experimental Investigation on the Correlation of Pressure Pulsation and Vibration of Axial Flow Pump. Adv. Mech. Eng. 11, 1687814019889473. doi:10.1177/1687814019889473
Feng, J., Luo, X., Guo, P., and Wu, G. (2016). Influence of Tip Clearance on Pressure Fluctuations in an Axial Flow Pump. J. Mech. Sci. Technol. 30, 1603–1610. doi:10.1007/s12206-016-0315-2
Fu, S., Zheng, Y., Kan, K., Chen, H., Han, X., Liang, X., et al. (2020). Numerical Simulation and Experimental Study of Transient Characteristics in an Axial Flow Pump during Start-Up. Renew. Energ. 146, 1879–1887. doi:10.1016/j.renene.2019.07.123
Han, Q., Yu, T., Wang, D., and Qu, T. (2010). Nonlinear Vibration Analysis and Diagnosis Method of Faulty Rotor System. Beijing: Science Press.
Kan, K., Zheng, Y., Chen, Y., Xie, Z., Yang, G., and Yang, C. (2018). Numerical Study on the Internal Flow Characteristics of an Axial-Flow Pump under Stall Conditions. J. Mech. Sci. Technol. 32, 4683–4695. doi:10.1007/s12206-018-0916-z
Kang, C., Yu, X., Gong, W., Li, C., and Huang, Q. (2015). Influence of Stator Vane Number on Performance of the Axial-Flow Pump. J. Mech. Sci. Technol. 29, 2025–2034. doi:10.1007/s12206-015-0423-4
Kim, Y.-S., Kim, K.-Y., and Heo, M.-W. (2019). Effects of Geometric Parameters on Hydraulic Performance of a Submersible Axial Flow Pump with Swept Impeller. kfma 22, 19–27. doi:10.5293/kfma.2019.22.3.019
Lee, B.-R., Yun, T.-J., Oh, W.-B., Lee, C.-W., Kim, H. H., Jeong, Y. J., et al. (2021). A Study of the Vibration of an Axial Flow Pump through Fsi Analysis Method. J. Korean Soc. Manufacturing Process Eng. 20, 107–112.
Li, G., Chen, E., Yang, A., Xie, Z., and Zhao, G. (2018). Effect of Guide Vanes on Flow and Vibroacoustic in an Axial-Flow Pump. Math. Probl. Eng. 2018, 1–11. doi:10.1155/2018/3095890
Li, M., and Li, Z. (2014). Nonlinear Vibration of Rotor-Bearing System under Holonomic Constraints. Beijing: Science Press.
Meng, F., Yuan, S., and Li, Y. (2018). Fluid–structure Coupling Analysis of Impeller in Unstable Region for a Reversible Axial-Flow Pump Device. Adv. Mech. Eng. 10, 1687814017751762. doi:10.1177/1687814017751762
Pei, J., Meng, F., Li, Y., Yuan, S., and Chen, J. (2016). Fluid–structure Coupling Analysis of Deformation and Stress in Impeller of an Axial-Flow Pump with Two-Way Passage. Adv. Mech. Eng. 8, 1687814016646266. doi:10.1177/1687814016646266
Shervani-Tabar, M. T., Ettefagh, M. M., Lotfan, S., and Safarzadeh, H. (2018). Cavitation Intensity Monitoring in an Axial Flow Pump Based on Vibration Signals Using Multi-Class Support Vector Machine. Proc. Inst. Mech. Eng. C: J. Mech. Eng. Sci. 232, 3013–3026. doi:10.1177/0954406217729416
Shi, L., Tang, F., Xie, R., and Zhang, W. (2017). Numerical and Experimental Investigation of Tank-type Axial-Flow Pump Device. Adv. Mech. Eng. 9, 1687814017695681. doi:10.1177/1687814017695681
Shi, L., Zhu, J., Yuan, Y., Tang, F., Huang, P., Zhang, W., et al. (2021). Numer. simulation Exp. effects blade angle deviation hydraulic characteristics Press. pulsation axial-flow pumpShock Vibration 2021. doi:10.1155/2021/6673002
Shuai, Z.-J., Li, W.-Y., Zhang, X.-Y., Jiang, C.-X., and Li, F.-C. (2014). Numerical Study on the Characteristics of Pressure Fluctuations in an Axial-Flow Water Pump. Adv. Mech. Eng. 6, 565061. doi:10.1155/2014/565061
Silva, A., Zarzo, A., Muñoz Guijosa, J. M., and Luengo, D. (2021). Improvement of the Accuracy of Nonlinear Rotordynamic Models by Means of the Use of Non-white Fluid-Induced Signal Noise. Mech. Syst. Signal Process. 149, 107308. doi:10.1016/j.ymssp.2020.107308
Standard, C. W. C. (2007). Sl 140-2006: Water Pump Model and Device Model Acceptance Test Procedure.
Yang, F. (2013). Research on Hydraulic Performance and Multi-Objective Optimization Design of Low-Lift Pump System.
Zhang, J., Zhang, L., Ma, Z., Wang, X., Wu, Q., and Fan, Z. (2021). Coupled Bending-Torsional Vibration Analysis for Rotor-Bearing System with Rub-Impact of Hydraulic Generating Set under Both Dynamic and Static Eccentric Electromagnetic Excitation. Chaos, Solitons & Fractals 147, 110960. doi:10.1016/j.chaos.2021.110960
Zhang, L., Wang, S., Yin, G., and Guan, C. (2019). Fluid–structure Interaction Analysis of Fluid Pressure Pulsation and Structural Vibration Features in a Vertical Axial Pump. Adv. Mech. Eng. 11, 1687814019828585. doi:10.1177/1687814019828585
Keywords: hydraulic excitation, axial flow pump, pressure, force, displacement
Citation: Duan X, Tang F, Xu H, Chen J, Lu Q, Duan W and Zhang R (2021) Analysis of Centroid Trajectory Characteristics of Axial-Flow Pump Impeller Under Hydraulic Excitation. Front. Energy Res. 9:754419. doi: 10.3389/fenrg.2021.754419
Received: 10 August 2021; Accepted: 07 October 2021;
Published: 26 October 2021.
Edited by:
Enhua Wang, Beijing Institute of Technology, ChinaReviewed by:
Desheng Zhang, Jiangsu University, ChinaPoppy O’Neill, Institut National des Sciences Appliquées de Lyon (INSA Lyon), France
Babak Aghel, Kermanshah University of Technology, Iran
Copyright © 2021 Duan, Tang, Xu, Chen, Lu, Duan and Zhang. This is an open-access article distributed under the terms of the Creative Commons Attribution License (CC BY). The use, distribution or reproduction in other forums is permitted, provided the original author(s) and the copyright owner(s) are credited and that the original publication in this journal is cited, in accordance with accepted academic practice. No use, distribution or reproduction is permitted which does not comply with these terms.
*Correspondence: Xiaohui Duan, MTM4NTEwNjE1MDBAMTM5LmNvbQ==