 Carlos Omar Trejo-Pech
 James A. Larson
 Burton C. English
 T. Edward Yu
- Agricultural and Resource Economics Department, University of Tennessee, Knoxville, TN, United States
The international aviation industry has the goal to gradually reduce carbon emissions mainly by using sustainable aviation fuel (SAF). However, currently SAF cannot be produced at competitive prices relative to petroleum-based jet fuel. Pennycress is a crop whose oilseed could be used as a relatively low-cost feedstock to produce SAF, potentially benefiting farmers and the environment. This stochastic techno-economic analysis (TEA) studies an enterprise buying pennycress oilseed from farmers, extracting the bio-oil and selling it to a biorefinery that converts bio-oil into SAF. Maximum buying prices (MBP)—prices that yield a zero net present value—the crushing enterprise could pay farmers for pennycress oilseed are estimated. To conduct the analysis, discount rates are estimated based on financial data of biofuel firms, thus providing a realistic benchmark to evaluate profitability and feedstock buying prices. Estimated risk-adjusted discount rates vary between 12 and 17%, above rates typically used in similar valuations. Estimated stochastic MBP range between 10.18 and 11.73 ¢ pound−1, which is below the price at which farmers are willing to plant pennycress, according to recent research. By considering the crushing facility’s inherent cash flow structure and risk, the distributions of stochastic modified internal rate of return suggest the crushing enterprise could be economically attractive at a 14% discount rate, our most likely estimate. However, between 11 and 17% times the cash flow model is simulated, the firm falls under financial distress. Overall, the findings suggest potential barriers for deployment of a SAF supply chain without governmental incentives or related policies.
Highlights
o This study estimates discount rates to apply in biofuel valuations based on actual financial data from publicly traded US biofuel firms.
o Most likely, lower bound, and upper bound discount rates are estimated at 14, 12, and 17%, respectively.
o The study also estimates maximum buying prices a prospective crushing enterprise could pay farmers for pennycress oilseed feedstock
o Stochastic maximum buying prices range between 10.18 and 11.73 ¢ pound−1, which is below the price at which farmers are willing to plant pennycress, according to recent research
o By considering the crushing facility’s inherent cash flow structure and risk, the distributions of stochastic modified internal rate of return suggest the crushing enterprise could be economically attractive at a 14% discount rate. However, between 11 and 17% the times the cash flow model is simulated, the firm falls under financial distress.
o Challenges for the establishment of a crushing facility, and in consequence deployment of the SAF supply chain in Southern US, are discussed in this article.
1 Introduction
The international aviation industry is motivated to reduce their greenhouse gas footprint over the next few decades. Policies such as the United Nations International Civil Aviation Organization’s Carbon Offsetting and Reduction Scheme for International Aviation are mandating reductions in carbon emissions for commercial aviation (ICAO, 2021). Taking 2005 as the baseline, the industry is expected to reduce 50% of carbon emissions by 2050 (Hileman et al., 2013; Khanal and Shah, 2021; Tanzil et al., 2021). Factors such as improved fuel consumption and infrastructure are important, but the use of biomass derived, or sustainable aviation fuel (SAF) is projected to be the most important factor driving carbon reduction in aviation (Wang et al., 2019; Khanal and Shah, 2021). SAF is a substitute or complementary product for fossil jet fuels, produced from a variety of feedstocks including waste organics, agricultural residues, and crops cultivated for human food consumption (Air BP, 2021; Eswaran et al., 2021; SkyNRG, 2021). Currently available SAF production technologies in the US have been evaluated. Tanzil et al. (2021) found that hydroprocessed esters and fatty acids (HEFA) is the most competitive current technology for SAF production compared to five lignocellulose-based technologies evaluated. While SAF production volume in the US is still limited, several biorefineries are producing it at demonstration, pilot, and commercial scale (Trejo-Pech et al., 2019; Khanal and Shah, 2021; Tanzil et al., 2021). One of the current challenges is to produce SAF at prices competitive with fossil-based jet fuel. SAF cost of production is estimated around three times higher than conventional jet fuel cost (Khanal and Shah, 2021), particularly high when crops that are demanded in food markets are used as feedstock to produce SAF. Promising conversion technologies and the use of dedicated energy crops—low production cost crops grown for energy production purposes mainly and not for food—as feedstock are likely to reduce the SAF vs. fossil jet fuel price gap and accelerate SAF adoption. This study analyzes Pennycress (Thlaspi arvense L.), an emerging dedicated energy crop whose oilseed has the potential to be a relatively low-cost feedstock to produce SAF.
Pennycress has the potential to provide both economic benefits to farmers and ecosystem benefits. Planting pennycress does not require additional land because it could be incorporated as a winter cover crop in corn-soybean rotations. Typically, pennycress would be grown during the fall-to-spring after harvesting corn in year one, and it would be harvested in year two before cultivating soybean. This production system would result in three, rather than two, cash crops in 2 years, economically benefiting farmers.1 The use of pennycress as a cover crop potentially reduces land nutrients losses, suppresses weed, reduces soil erosion, and provides collateral ecosystem benefits such as producing spring early-season nectar and pollen for beneficial insects (Eberle et al., 2015; Thomas et al., 2017; Marks et al., 2021). Marks et al. (2021) highlight the importance of incorporating pennycress in farmland remaining fallow during the fall noting that in US Midwest corn-soybean rotations are planted on around 175 million acres but winter cover crops are incorporated in less than 5% of those lands because traditional cover crops are not highly profitable and the environmental benefits are not obvious to farmers. Regarding the potential of pennycress as a bioenergy crop, oilseed from pennycress has the chemical and physical properties to be converted into SAF meeting the quality specifications by the United States American Society for Testing and Materials (Moser et al., 2009; Fan et al., 2013; Moser et al., 2015). Furthermore, pennycress’ oil yield, from oilseed to reactor-ready feedstock, has been estimated to be comparable to other oilseeds such as canola and camelina (Mousavi-Avval and Shah, 2020). However, deploying a pennycress oilseed to SAF supply chain presents some challenges such as high oil yield variability (Mousavi-Avval and Shah, 2020), moderate to low willingness of farmers to plant pennycress (Zhou et al., 2021), and appropriate farmers-biorefinery agreements to incentivize oilseed production for SAF (McCollum et al., 2021). Despite these challenges, pennycress is a very promising feedstock for the establishment of a SAF supply chain potentially yielding economic benefits and ecosystem services and this is the reason we selected this crop to conduct a techno-economic analysis (TEA).
Recently published TEA studying the economic viability of SAF focusing on promising feedstocks other than pennycress include Eswaran et al. (2021), Kubic et al. (2021), and McCollum et al. (2021). Eswaran et al. (2021) estimated the minimum selling price (MSP) of SAF produced with carinata oil, soybean oil, yellow grease, and brown grease at $1.32, $1.50, $1.19, and $1.00 L−1 respectively; all these prices above the average price of petroleum-based jet fuel from 2008 to 2018, at $0.60 L−1. Similarly, Kubic et al. (2021) estimated that the MSP of SAF produced with paper from municipal solid waste is lower than SAF produced with corn stover, but still not competitive with petroleum-based jet fuel. They estimated paper to SAF process with enzymatic hydrolysis’ MSP at $1.05 L−1 compared to a $0.54 L−1 petroleum-based jet fuel target price. McCollum et al. (2021) TEA inquiries how contractual conditions between farmers and biorefineries, in 11 states in western US, may impact farmers’ willingness to supply canola, another promising feedstock, for sustainable SAF production. They find that the likelihood of a biorefinery obtaining sufficient supply of canola is most feasible in Kansas and North Dakota, but across all states, canola prices need to considerably increase from typical levels—which may not be realistic in some cases—to induce enough supply. Their findings suggest that biorefineries may need to consider compensating farmers for a share of the variable cost of production to ensure sufficient oilseed feedstock supply (e.g., offer favorable contract prices above what market prices may suggest). The aforementioned articles and previous research highlight the relevance of feedstocks in general for SAF production, either in terms of 1) the high portion of feedstock cost relative to total cost of SAF production, 2) the high sensitivity of SAF MSP to feedstock cost, or 3) the barriers of obtaining enough feedstock supply at competitive prices to deploy a viable SAF supply chain.
TEA specific to pennycress for SAF production include Trejo-Pech et al. (2019), Stevens and Taheripour (2020), Mousavi-Avval and Shah (2020), and Mousavi-Avval and Shah (2021). Trejo-Pech et al. (2019) evaluate enterprise budgets for prospective farmers and processors converting pennycress oilseed to bio-oil and meal cake (e.g., crushers), and identify potential locations for crushing and biorefineries facilities supplying SAF to Nashville, Tennessee international airport. Their analysis compares MSP for pennycress oilseed at the farm level and maximum buying price (MBP) at the crushing facility to make both enterprises economically viable. Stevens and Taheripour (2020) analyze a prospective SAF biorefinery located in US Midwest. Stevens and Taheripour (2020) use crushing facility parameters from Trejo-Pech et al. (2019) to estimate the crushing facility’s MSP in comparison with MBP the biorefinery could offer. In other words, while Trejo-Pech et al. (2019) focuses the analysis on the interconnection between farmers and processors, Stevens and Taheripour (2020) analyze the price relationship between processors and biorefineries. Stevens and Taheripour (2020) also provide scenarios that may make pennycress SAF production economically viable. Mousavi-Avval and Shah (2020) focus their TEA on the production, harvest, and post-harvest logistics of pennycress supplying a SAF biorefinery, providing anticipated production resources needed for one prospective biorefinery at commercial scale located in Ohio. Mousavi-Avval and Shah (2021) extend Mousavi-Avval and Shah (2020) considering pennycress oilseed handling and conditioning, oil extraction and hydroprocessing SAF conversion, estimating SAF’s MSP at $1.20 L−1 in Ohio, a price comparable to other promising oilseeds but still below the price of petroleum-based jet fuel.
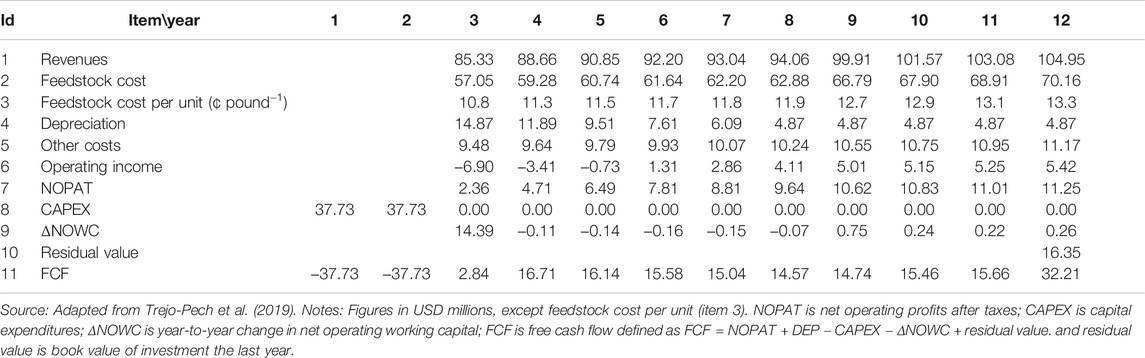
Our study builds on the crushing facility model of Trejo-Pech et al. (2019) by incorporating risk components in the analysis, as explained next. In Trejo-Pech et al. (2019) pennycress supply chain model, farmers produce pennycress oilseed as a winter crop incorporated into corn-pennycress-soybean rotation at an estimated cost of 8.0 ¢ pound−1 at the crushing facility plant gate. The crushing facility purchases pennycress oilseed and converts it to bio-oil and pennycress meal cake providing capital investors an assumed 12.5% expected rate of return over investment if the crushing facility pays farmers 10.8 ¢ pound−1 for oilseed the year operations start and sells reactor-ready feedstock at soybean forecast prices by the USDA and meal cake at distillers’ dried grain with solubles historical prices (partial cash flow projections are provided in the Appendix, with the 10.8 ¢ pound−1 cost of feedstock shown in line 3). Buying oilseed above 10.8 ¢ pound−1, the MBP, would yield on average returns on investment below the crushing facility capital investors’ expectation and would discourage reactor-ready feedstock supply. Three crushing facilities are projected to supply bio-oil to one Aviation Sustainability Center’s HEFA hypothetical biorefinery as designed by Tanzil et al. (2021), which would in turn supply SAF to the Nashville International Airport. Further analysis of the MBP of pennycress oilseed is relevant particularly because pennycress is currently not planted for commercial purposes and the actual cost of production at deployment time may differ from current budgets. To illustrate this, Mousavi-Avval and Shah (2020) estimated that MSP of field pennycress in Ohio varies from 8.5 to 11.5 ¢ pound−1; at the high-end of this budget, prospective investors may not invest in the pennycress crushing enterprise. In addition, the analysis in Trejo-Pech et al. (2019) is based on deterministic parameters and an assumed discount rate. In this study the work in Trejo-Pech et al. (2019) is extended by incorporating two relevant risk components into the analysis: 1) estimating the discount rate to value the crushing facility investment (i.e., estimating a rate of return based on investors’ expectations instead of assuming a 12.5% discount rate), and 2) performing stochastic simulation of selected sensitive parameters affecting expected profitability of the crushing facility. Our study focuses on the crushing facility and considers field pennycress oilseed production cost and HEFA biorefinery demand as exogenous to the crushing enterprise. Our analysis provides additional insights regarding potential MBPs for oilseed pennycress and permits to compare these values with recent survey data on willingness to plant pennycress in Southern US. In addition, this is the first study that estimates the discount rate based on actual financial data from established biofuel firms.
According to finance theory, the discount rate is a hurdle rate for investment decisions, meaning that it provides a clear-cut decision rule: entrepreneurs would not establish the abovementioned crushing facility if they had to pay farmers more than 10.8 ¢ pound−1 for oilseed because their expected annual return would be lower than 12.5% given assumed projected output prices. However, in practice, the discount rate is used more as a reference for investment decision making than as a rigid hurdle for investment. This is because the estimation of a discount rate involves several inputs that require projections based on historical values and rely on models intended to capture capital investors’ expectations according to the degree of risk borne. Thus, the first objective of this paper is to determine the impacts of risk-adjusted discount rates on the financial performance—particularly through MBP of field pennycress—of the prospective crushing facility featured in Trejo-Pech et al. (2019). For this objective, methods used by financial practitioners (Graham and Harvey, 2001; Jacobs and Shivdasani, 2012; Brotherson et al., 2013; Graham and Harvey, 2018) and financial data from companies operating in bioenergy-related industries are employed.
It is common practice in bioenergy TEA studies to not disclose assumptions and/or frameworks applied to estimate the discount rates used in valuations.2 Yet, the importance of the discount rate in prospective bioenergy investment has been suggested in previous research. For instance, Lamers et al. (2015) argue that biorefineries are highly risky investments due to variability of feed stock supply and show that the minimum selling price of fuel produced is highly sensitive to the discount rate employed in biorefinery valuations. The framework employed in this paper to estimate the discount rate allows for a more insightful sensitivity analysis than analysis conducted on an assumed point-estimate discount rate value. Moreover, the discount rates estimated in this paper could be used in other TEAs evaluating prospective bio-energy investment, given that estimations are done for a variety of biofuel companies.
The second objective of this study is to evaluate the effects of stochastic cash flows on the financial performance of the crushing facility. Like with to the first objective, we focus the analysis on breakeven or MBPs. Trejo-Pech et al. (2019) analysis relies on deterministic production and price parameters and on one-way sensitivity analysis, whereas in this study selected parameters at which the crushing facility’s financial performance metrics are highly sensitive to, vary stochastically. Pennycress bio-oil prices, pennycress meal prices, and feedstock to bio-oil conversion rate are modeled with stochastic distribution dynamics applied in previous bioenergy studies (Petter and Tyner, 2014; Zhao et al., 2015; Zhao et al., 2016). Outcomes of the stochastic analysis include distributions of crushing facility’s expected return on investment given alternative estimated discount rates, potential maximum oilseed buying prices for the crushing facility to financially breakeven, and stochastic sensitivity analysis of selected variables. Overall, our analysis combining estimated discount rates and stochastic simulation provide a more robust assessment of profitability and risk for a prospective crushing facility within a potential SAF supply chain.
2 Background and Literature Review
2.1 Discounted Cash Flow, the Weighted Average Cost of Capital, and Hurdle Rates
The finance literature seems to concur that most US firms employ a discounted cash flow (DCF) framework when evaluating potential long-term investments. Jagannathan et al. (2016) report that over 90% of surveyed chief financial officers selected a DCF-related financial metric—net present value, adjusted present value, internal rate of return or profitability index—as one of their top two metrics used for investment evaluation. Another study report that between 80 and 90% of surveyed members of the Association for Financial Professionals employ DCF to analyze prospective investment (Jacobs and Shivdasani, 2012). Earlier studies also show that most financial managers rely on DCF as the analytical tool to support their investment decisions (Baker et al., 2010). Unsurprisingly, DCF is widely applied in bioenergy TEAs as well (Campbell et al., 2018).
DCF-related metrics compare investment and projected free cash flow (FCF) values, both expressed in present value terms. To account not only for inflation but also for capital investors’ expected returns, projected FCFs are discounted by a risk-adjusted opportunity cost of capital. Most of the abovementioned survey-based studies report that financial managers use the firm’s estimated weighted average cost of capital (WACC) as a reference or baseline to define the discount rate used for investment evaluations. The WACC considers the mix of capital debt (
Further, most surveyed managers indicate they apply the capital asset pricing model (CAPM), by Sharpe (1964), to estimate equity holders’ expected rate of return,
where
Estimating a risk-adjusted discount rate presents a couple of challenges. First, no consensus exists among financial practitioners regarding the specific proxies or inputs to use when estimating WACC and CAPM. Second, practitioners appear to apply a discount rate that is higher than their estimated WACC. In other words, even though some financial managers estimate the firm’s WACC, they use it as a reference and systematically chose a higher hurdle rate to evaluate prospective investments (Jagannathan et al., 2016; Graham and Harvey, 2018). Particular to the energy industry, the anomalous use of high discount rates in the evaluation of energy efficient projects has also been raised in previous research (Howarth and Sanstad, 1995; Thompson, 1997). This is puzzling behavior by financial practitioners because, as Eqs 1, 2 show, WACC captures the cost of each capital or financing component according to its risk level and corresponding expected return. This may also be problematic for firm decision making since managers may forgo economically attractive positive net present value (NPV) projects by choosing artificially high discount rates. Challenges of estimating the WACC through CAPM for the prospective pennycress crushing facility are explained in the methods section of this paper.
To recap, a framework including DCF financial metrics that considers WACC and CAPM is well known and applied by financial practitioners. In this study we estimate WACC through CAPM and propose discount rates to use when valuing biofuel investments. As an example, we apply these discount rates to the prospective crushing facility presented in Trejo-Pech et al. (2019), a firm purchasing pennycress oilseed and converting it to bio-oil and pennycress meal cake.
2.2 Stochastic Simulation
Most biofuel TEA studies are conducted with deterministic models. While deterministic TEAs are usually analyzed by providing an array of relevant scenarios on which selected variables are changed while the rest of variables in the model are kept constant, stochastic models have the potential to better capture and model risk inherent on historical data. This is because instead of using only point-estimates for relevant variables, stochastic models simulate potential values drawn from a series of historical data, according to a statistical distribution and iterate the model thousands of times to provide expected values or values at other percentile of the distribution.
Stochastic simulation becomes particularly important in models relying on highly uncertain variables. As an example, deployment of the pennycress-based SAF supply chain of interest in this study assumes that pennycress bio-oil will be sold at soybean oil prices given the similarities between the oils extracted from these two crops (Moser et al., 2009; Fan et al., 2013) and because a market for pennycress bio-oil is not developed yet. Figure 1 shows that while soybean oil prices have been relatively stable lately, they have been highly volatile from a mid-term and long-term perspective. In this study, this uncertainty is incorporated into the analysis by projecting stochastic bio-oil prices (and other variables) to the crushing facility DCF model supplying bio-oil to the SAF supply chain. The stochastic simulation approach taken in this study is similar to other biofuel stochastic TEAs including Jeong et al. (2020), Lan et al. (2020), McGarvey and Tyner (2018), Yao et al. (2017), and Zhao et al. (2015).
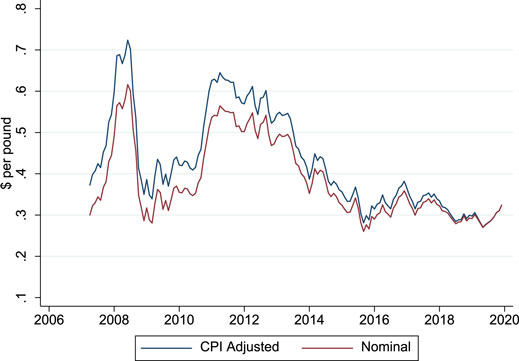
FIGURE 1. Soybean oil prices, April 2007 to December 2019. Note: Figure 1 provides nominal and consumer price index (CPI) adjusted prices expressed as of the end of 2019.
3 Methods
Coupling the estimation of WACC with CAPM is most suitable for publicly traded companies. CAPM was conceived for publicly traded firms because it requires firm’s market stock prices as inputs to estimate the firm’s beta risk factor. However, private firms such as the prospective crushing facility analyzed in this study can use estimated WACC of comparable publicly traded firms as a proxy for their own WACC. Brotherson et al. (2013) for instance, document that 68% of surveyed financial managers directly or indirectly benchmark and adjust their estimated market betas (and by extension their WACC given the connection between Eqs 1, 2) with betas of comparable firms, companies operating in the same industry. In this study, we estimate the WACC of publicly traded biofuel firms from 2010 to 2020 and use aggregated WACC estimations as a reference to estimate discount rates for the biofuel industry.
Three discount rate values are estimated and incorporated in the analysis: a most likely, a lower bound, and an upper discount rate. To understand how these discount rates affect profitability and risk of a firm converting pennycress oilseed to bio-oil for the production of SAF, we make the 12-year FCF (Appendix) projected in Trejo-Pech et al. (2019)3 stochastic,
3.1 Financial Data and Parameters for the Deterministic Analysis
3.1.1 Firms in the Sample
Companies producing SAF include Alt Air Paramount (acquired by World Energy), Neste Oyj, Gevo Inc., Virent Inc., and Velocys PLC. (Trejo-Pech et al., 2019; Khanal and Shah, 2021; Tanzil et al., 2021). Gevo Inc. is chosen as one of the companies to include in the sample of firms to analyze in this study because, unlike the other aforementioned firms, Gevo is a publicly traded company listed in a US stock exchange market. To identify additional firms for the sample, a list of firms considered Gevo Inc.’s peers in the Standard and Poor’s Net Advantage: Capital IQ database, Peer Analysis submodule is used (Standard and Poor’s, 2021).
As of June 2021, Standard and Poor’s listed 11 firms comparable to Gevo Inc. From this list, we selected firms meeting the following specifications: 1) the firms operated in business segments closely related to the SAF supply chain, 2) the firms had equities traded in a US stock exchange, and 3) the firms had financial accounting and stock prices data available in the two finance databases used in this study to obtain inputs for the WACC and CAPM estimations. Eight firms fulfilled the requirements. The sample includes REX American Resource Corporation (equity ticker REX), Valero Energy Corporation (VLO), Nov Inc. (NOV), Aemetis Inc. (AMTX), Alto Ingredients Inc. (ALTO), Green Plains Inc. (GPRE), Gevo Inc. (GEVO), and Renewable Energy Group (REGI). We estimated the WACC through CAPM for these biofuel firms each quarter from 2010 to 2020.
3.1.2 Financial Databases
Financial data are obtained from databases maintained by Wharton Research Data Services (WRDS, 2021). WRDS is a paid subscription-based finance data provider primarily for researchers. In particular, individual firm financial statement data are obtained from Compustat North America Fundamental Quarterly (Compustat) and Financial Ratios Firm Level by WRDS (Financial Ratios). Firms’ betas are estimated in Beta Suite by WRDS (Beta Suite).
3.1.3 WACC and CAPM
Using Eq. 1, WACC for individual firms is calculated every quarter given that publicly traded firms report their financial statement to the US Securities and Exchange Commission each quarter. Total debt,
Firms’ systematic risk measures, betas, are estimated using the software Beta Suite by WRDS. Beta Suite estimates the following rolling regression and provides firm beta parameters:
where
Betas estimates,
For firms/quarters for which no betas could be estimated with Equation (3) due to lack of data, we estimated betas using the following relationship (Asquith 1993; Schill 2017):
where
Financial analysts and managers use market premia varying between 5 and 8% annual returns (Brotherson et al., 2013). In this study, the mid-point in previous studies,
3.1.4 Discount Rates
The WACC estimations are used as a reference to determine hurdle or discount rates for the biofuel industry. The corporate finance literature reports that even though managers estimate their firms’ WACC (through CAPM), they use a higher discount rate—relative to their calculated WACC—as the discount rate for DCF analysis and investment decisions. Graham and Harvey (2018) report that firms add 400 basis points to their estimated WACC when setting their discount rates for valuation analysis purposes; i.e., discount rate = WACC + 0.04. We follow this approach, adding 4 percent points to each of the following: 1) the median of our estimated WACC values across biofuel firms (considered the most likely discount rate for the biofuel industry), 2) the first quartile WACC (lower bound), and 3) the third quartile WACC (upper bound).
3.2 Stochastic Discounted Cash Flow Model
Uncertainty is incorporated into the DCF analysis by performing stochastic simulation. Free cash flows (i.e., deterministic FCF in the Appendix) are made stochastic,
Simulated crushing output prices are drawn from a sample of market prices for soybean oil and DDGS obtained from AMS USDA (2019). The sample has monthly prices from April 2007 (the oldest obtainable price series for both products in this database) to December 2019 (the year the crushing facility analyzed by Trejo-Pech et al. (2019) was assumed to start selling pennycress biofuel and meal). The simulations also assume a correlation coefficient = 0.623 for pennycress bio-oil and pennycress meal prices, which is the correlation observed in the price series during the 2007–2019 period. The feedstock to bio-oil conversion rate simulations use a most likely value parameter of 0.329, with the minimum equal to 0.315, and the maximum equal to 0.340, according to reported pennycress oilseed to bio-oil conversion rates in the literature (Evangelista et al., 2012; Fan et al., 2013; Altendorf et al., 2019; Chopra et al., 2019; Metro Ag Energy, 2019).
Simulations, conducted in @RISK®, resulted in stochastic FCF estimates using the deterministic crush facility developed in Trejo-Pech et al. (2019) (Appendix 1). The
Three sets of results are discussed: stochastic breakeven prices or MBPs, distributions of
Second, using our most likely discount rate estimate and its corresponding stochastic expected breakeven price value, we discuss the probabilities of
4 Results and Discussion
4.1 The Weighted Average Cost of Capital and Discount Rates for Biofuel Firms
Summary statistics of the weighted average cost of capital, WACC, and WACC-related variables for the eight biofuel firms in the sample are provided in Table 1. With the exception of beta and number of observations in the sample (n), results in Table 1 are presented in annual basis. Variables in Table 1 were computed every quarter from 2010 to 2020.
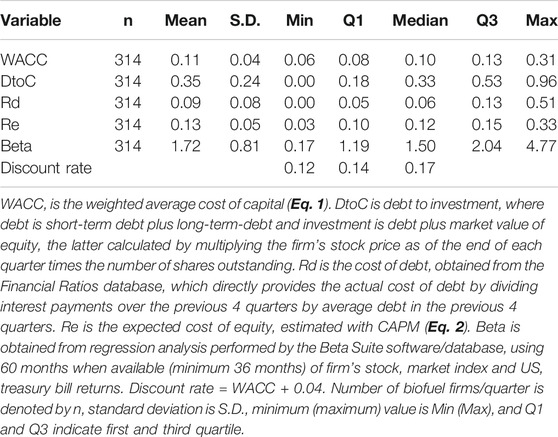
TABLE 1. Descriptive statistics of WACC and its relevant components for eight biofuel firms from 2010 to 2020.
Estimated WACC of 314 biofuel firm/quarters is on average 11% annually, with a median value of 10%, a 25th percentile or first quartile (Q1) value of 8%, and third quartile (Q3) value of 13%. As explained below, the median, Q1, and Q3 values are used as references for the determining financial viability analysis of the pennycress crushing facility. Firms in the sample have a debt to capital ratio, DtoC, of 35% (average) and 33% (median), indicating that about one third of the capital in these firms is financed with debt and two thirds with equity.7 Interest rates,
Table 1 also provides beta, the firm’s systematic risk factor. Biofuel firms in the sample have beta values of 1.72 (mean) and 1.50 (median), indicating that these companies are riskier than the “average” firm in the market.8 This is consistent with the fact that biofuel firms operate in a highly uncertain environment in which the financial impact of using some technologies is yet to be proven successful (Lamers et al., 2015).
The estimates in Table 1 are relatively stable across bio-oil firms and over time. Table 2 provides descriptive statistics of WACC and beta for each firm in the sample, and Figure 2 plots WACC and betas over time. AMTX and GEVO have higher WACCs compared to the rest of firms in the sample, consistent with AMTX having the highest leverage level across firms and GEVO perceived by investors as highly risky given the firm’s beta (Table 2). However, average WACC for these firms (15 and 18% respectively) are within the range of WACC used in biofuel TEA studies (Tanzil et al., 2021). Figure 2 shows the majority of estimated WACC values are clustered around 7 and 15% and the majority betas are between 1.00 and 2.50. A few higher WACC and betas seem to concentrate within the 2014–2017 period.
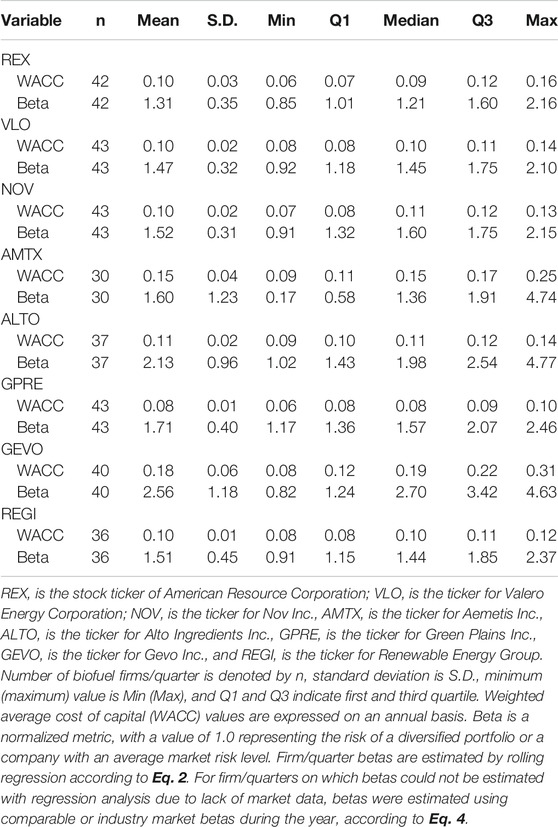
TABLE 2. Statistics of WACC and beta across firms in the sample from 2010 to 2020.
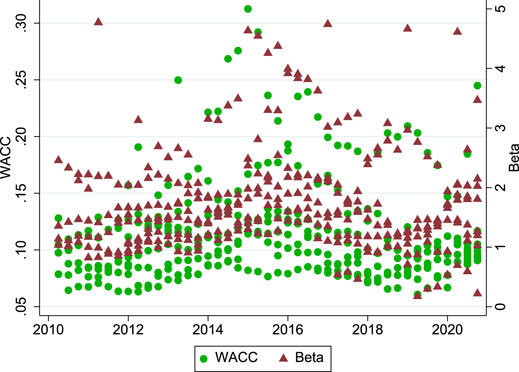
FIGURE 2. Estimated WACC and beta values per quarter from 2010 to 2020. Note: Figure 2 provides WACC and beta estimations for each biofuel firm in the sample. Biofuel firms in the sample are indicated in Table 2.
The last row of Table 1 contains estimated discount rates for the biofuel industry, which are the hurdle rates to use for the analysis of the prospective crushing facility in the SAF supply chain. As explained in the methods section of this paper, these discount rates are calculated by adding 4 percent points (Graham and Harvey, 2018) to our estimated most likely, lower bound, and upper bound WACC values. The discount rates are 14, 12, and 17% respectively. These rates are higher than discount rates used in similar pennycress valuations. For instance, Stevens and Taheripour (2020) and Mousavi-Avval and Shah (2021) assume 10%. Given that the higher the risk and discount rate of any prospective enterprise, the lower is the MBP the firm could pay farmers, this finding implies that previous studies overestimate input MBP, holding other factors constant.
4.2 Stochastic DCF Model
Simulation is incorporated into the analysis by assuming that pennycress bio-oil price, pennycress meal cake price, and pennycress oilseed to bio-oil conversion rate vary stochastically according to a PERT distribution draw from historical prices and conversion rates from previous research. Applying the Distribution Fitting | Fit Manager module in @RISK®, the PERT distribution was consistently ranked among the top distributions (15 or more distributions depending on the stochastic variable) best fitting the data in this study, according to the Akaike information criterium.
4.2.1 Stochastic Breakeven Prices
Discount rates for the crushing enterprise directly affect oilseed buying prices. We determine the maximum price the crushing facility could pay farmers for each pound of oilseed pennycress feedstock and financially breakeven; i.e.,
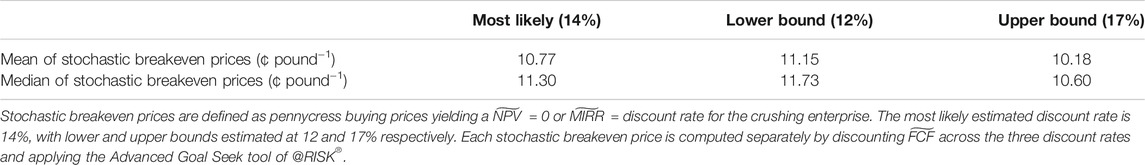
TABLE 3. Stochastic oilseed breakeven prices or MBPs a prospective crushing facility could pay farmers for pennycress feedstock across estimated discount rates.
A crushing facility with a 14% discount rate, the most likely discount rate, will breakeven if farmers are paid on average 10.77 ¢ pound−1 (mean of simulated prices) or 11.30 ¢ pound−1 (median of simulated prices) of pennycress feedstock during the first year of operation. If the crushing facility is less risky than the ‘average’ firm in this industry and has a 12% discount rate, the breakeven price would be 11.15 ¢ pound−1 (mean) or 11.73 ¢ pound−1 (median). In contrast, a highly risky crushing facility with a 17% discount rate has an oilseed breakeven price of 10.18 ¢ pound−1 (mean) or 10.60 ¢ pound−1 (median). The higher the risk and discount rate of the prospective enterprise, the lower is the MBP the firm could pay farmers, and in consequence, the less likely is that farmers will supply feedstock to the prospective SAF supply chain. The next section analyzes the distribution of profitability for the prospective crushing enterprise.
4.2.2 Profitability and Risk for the Most Likely Breakeven Price
Figure 3 provides the distribution of
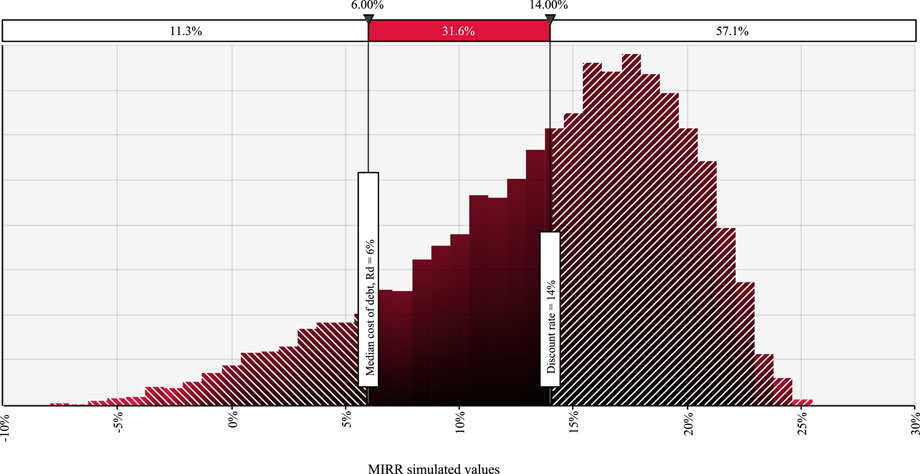
FIGURE 3. Simulations of MIRR (%) for the pennycress crushing facility (10,000 iterations) using a 14% discount rate, and assuming pennycress feedstock bought at 10.77 ¢ pound−1, which is the average stochastic breakeven price.
Furthermore, as shown in Figure 3, a
The distributions of
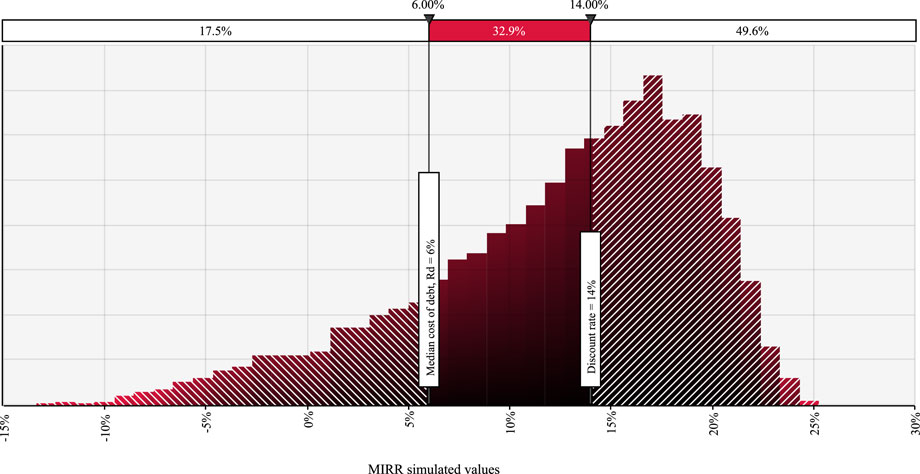
FIGURE 4. Simulations of MIRR (%) for the pennycress crushing facility (10,000 iterations) using a 14% discount rate, and assuming pennycress feedstock bought at 11.30 ¢ pound−1, which is the median stochastic breakeven price.
4.2.3 Stochastic Sensitivity
Table 4 provides statistics of
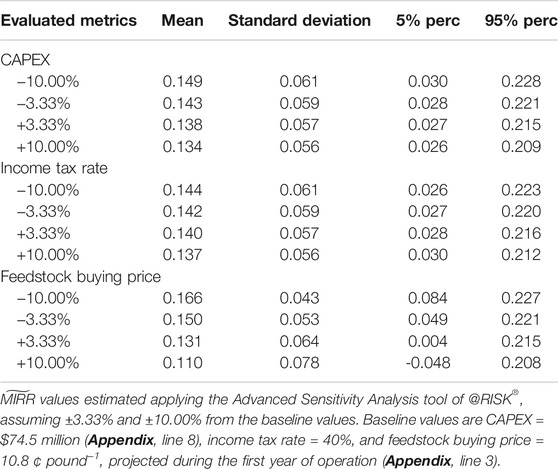
TABLE 4. Stochastic sensitivity analysis of
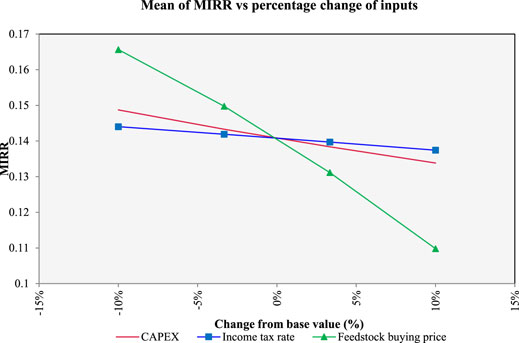
FIGURE 5. Stochastic sensitivity graph. Notes: Mean of MIRR (vertical axis) vs percentage change of selected inputs (CAPEX, income tax rate, and feedstock buying price) at 14% discount rate, the most likely estimated discount rate. Simulations performed with the Advanced Sensitivity Analysis tool of @RISK®.
4.2.4 Implications
Overall, the distributions of
Furthermore, the estimated MBPs in this study may not be sufficient to incentivize farmers to supply pennycress oilseed for SAF production. Zhou et al. (2021) recently surveyed farmers in seven Mid-South US states, finding that farmers ranked “profitability of growing pennycress crops compared with other farming alternatives” and “concern about the market for pennycress as an energy crop” as their top barriers to growing pennycress. In contrast, surveyed farmers reported “additional source of income” as the most important potential benefit of growing pennycress. The potential barriers perceived by farmers shows that the oilseed price crushing facilities could offer farmers is a key determinant of deployment of a SAF supply chain. Zhou et al. (2021) found that among the 58% of farmers who responded indicated interest in growing pennycress. Interested farmers would be willing to plant this crop if the price were set at 12.70 ¢ pound−1, which is higher than the range of estimated MBPs, or breakeven prices, in this study; 10.18 to 11.73 ¢ pound−1. In addition, 88% of farmers interested in planting pennycress would do so under production contracts, given the high risk they perceive for the uncertain market for oilseed to be converted to SAF. This represents another challenge for the prospective crushing facility and deployment of a SAF supply chain. Zhou et al. (2021) findings suggest that efforts to promote pennycress familiarity among farmers, reaching larger farms and more educated farmers, would increase farmers willingness to plant pennycress. Some of these efforts would represent additional costs for stakeholders in this supply chain though. This implication of our findings is similar to McCollum et al. (2021), who analyze canola as a potential SAF feedstock in western US, finding that canola prices need to considerably increase from typical levels to induce enough supply, and suggesting biorefineries to consider compensating farmers for a share of the variable cost of production to ensure sufficient oilseed feedstock supply. Thus, future studies on potential contractual agreements between group of farmers producing feedstock and processors and/or biorefineries are worthwhile. Also, studies analyzing risks borne by enterprises in a prospective SAF supply chain (e.g., farmers, processors, and biorefineries) may also help to accelerate SAF production. The latter would ultimately help to estimate with more precision input and output prices and expected profit margins for SAF stakeholders. Finally, as shown by the sensitivity analysis in this study, profitability for the prospective crushing facility is most sensitive to pennycress buying price, which reinforces the importance of this TEA focused on pennycress feedstock.
This study does not address the potential impact of government incentives such as Renewable Identification Numbers and other subsidies such as tax credits and loan guarantees since it is assumed that these benefits accrue to the biorefinery. As indicated above, a better understanding of the risk borne by SAF enterprises may provide insights on policies distributing those incentives across supply chain players. Previous research has highlighted the major role played by these incentives on SAF production, but also recognized that the precise nature of the impact on aviation fuel pathways is complex (Eswaran et al., 2021). Thus, those incentives are left outside the scope of this analysis. Related policies that may help SAF deployment are: governmental financing for establishing the market for the by-products of pennycress-based SAF (Mousavi-Avval and Shah, 2020) and tax incentives at the farmer level for production of oilseed feedstock for SAF conversion (McCollum et al., 2021). These recommended policies are in consistency with our findings in this study, as discussed above.
5 Conclusion
This stochastic TEA studies the profitability and risk of a pennycress oilseed crushing enterprise buying pennycress oilseed from farmers, extracting the bio-oil (and producing meal cake as a byproduct) and selling bio-oil to a biorefinery that will convert bio-oil into SAF. A crushing enterprise could play an important role on deployment of a SAF supply chain due to its direct contact with farmers growing field pennycress, the feedstock for SAF. Feedstock availability at attractive prices represents the first hurdle for the implementation of this potential supply chain.
Given the relevance of the crushing enterprise within the supply chain, a previous study that projected long-term cash flows for a prospective crushing facility was further analyzed. The deterministic model was converted into a stochastic one by simulating pennycress bio-oil prices, pennycress meal cake prices, and oilseed to bio-oil conversion rates according to a PERT distribution drawing values from a series of historical prices of soybean oil and DDGS as proxies for bio-products prices and conversion rate parameters from previous research. This made the projected cash flows of the crushing facility stochastic.
In addition, we estimated risk-adjusted discount rates appropriate for biofuel investment valuations using financial and market data of a group of biofuel firms publicly trading their stocks in US stock exchange markets. Most likely, lower bound, and upper bound risk-adjusted discount rates were estimated at 14, 12, and 17% respectively. We discounted the stochastic projected cash flows using the risk-adjusted rates and provided an array of outcomes on the profitability and risk of the crushing facility. The primary analysis focus was on stochastic breakeven prices or MBPs the crushing facility could pay farmers for pennycress oilseed; that is, prices that would produce a zero net present value for the crushing enterprise, which would in turn allow the firm to pay both debt capital and equity capital funders their expected rate of return. Breakeven prices ranged between 10.18 and 11.73 ¢ pound−1, depending on the most likely, lower bound and upper bound discount rates. Given the overall results in this study, profitability and risk factors of the crush facility that represent a challenge for the establishment of the crushing facility and in consequence deployment of the SAF supply chain in Southern US were discussed.
Overall, this study finds that while pennycress is a promising feedstock for SAF production providing economic benefits to farmers and ecosystem services, there are still barriers for a viable supply chain deployment. This study focuses on the financial challenges for the prospective processor given the inherent risk in the crushing enterprise and farmers’ willingness to plant pennycress given potential prices reported in related research. Previous research also shows that SAF production with pennycress is economically competitive compared to other promising feedstocks, but MSP of biofuel—without considering incentives—is still above the price of petroleum-based jet fuel.
Data Availability Statement
The data analyzed in this study is subject to the following licenses/restrictions: Financial data were obtained mainly from Wharton Research Data Services (WRDS). Particular WRDS databases used are specified in the article. WRDS is accessed thorough library subscription only, and authors are not allowed to post or distribute their data. Other sources of data such as the main discounted cash flow model are included in the article (Appendix). Requests to access these datasets should be directed to https://wrds-www.wharton.upenn.edu/.
Author Contributions
Conceptualization (CT-P, JL, BE, EY), methodology (CT-P), validation (CT-P, JL, BE, EY), writing—original draft preparation (CT-P), writing—review and editing draft preparation (CT-P, JL, BE, EY), funding acquisition (BE, JL, EY, CT-P).
Funding
This work was funded in part by the US Federal Aviation Administration (FAA) Office of Environment and Energy as a part of ASCENT Project 1 under FAA Award Number: 13-C-AJFE-UTENN Amendment No. 15. Funding also was provided by USDA through Hatch Project TN000484 and Hatch Multi-State project 1020537. Any opinions, findings, conclusions, or recommendations expressed in this material are those of the authors and do not necessarily reflect the views of the USDA, FAA or other ASCENT sponsor organizations.
Conflict of Interest
The authors declare that the research was conducted in the absence of any commercial or financial relationships that could be construed as a potential conflict of interest.
Publisher’s Note
All claims expressed in this article are solely those of the authors and do not necessarily represent those of their affiliated organizations, or those of the publisher, the editors and the reviewers. Any product that may be evaluated in this article, or claim that may be made by its manufacturer, is not guaranteed or endorsed by the publisher.
Abbreviations
∼, Indicates a stochastic variable; CAPEX, Capital expenditures; CAPM, Capital asset pricing model; DCF, Discounted cash flow; DDGS, Distillers’ dried grain with solubles; FCF, Free cash flow; HEFA, Hydroprocessed esters and fatty acids; MBP, Maximum buying price; MIRR, Modified internal rate of return; MSP, Minimum selling price; NPV, Net present value; PERT, Program evaluation and review technique; TEA, Techno-economic analysis; USDA, United States Department of Agriculture; WACC, Weighted average cost of capital.
Footnotes
1Given the relatively low level of inputs required to produce pennycress under the corn-pennycress-soybean rotation, growing pennycress is likely to produce marginal profits to farmers (Markel et al., 2018; Mousavi-Avval and Shah, 2020). Prospective farmers adopting pennycress have reported risks and challenges though (Mousavi-Avval and Shah, 2020; Zhou et al., 2021).
2While most TEA studies provide detailed operating cost budgets, the discount rate at which projected cash flows are discounted is generally assumed to be exogenous to the firm or project under evaluation and no details on the assumptions for its estimation are provided
3The crushing facility, in the Appendix, was assumed to sell pennycress bio-oil at soybean oil equivalent prices according to USDA projections. Pennycress meal cake is assumed to be sold at projected prices of distillers’ dried grain with solubles, according to USDA projections as well. In this study, those variables are stochastic
4When this ratio was unavailable in the Financial Ratios database, we calculated it using data from COMPUSTAT. We divided interest expenses during a quarter by average assets and multiplied it by four to have the ratio expressed in annual terms and make this figure comparable to the values in Financial Ratios
5Treasury rates are available at: https://www.treasury.gov/resource-center/data-chart-center/interest-rates/pages/textview.aspx?data=longtermrate. The long-term composite rate is the average rates of US Treasury securities maturing in ten or more years, consistent with the investment horizon of the crushing enterprise (Appendix).
6While the model uses 12-year projected FCF, the construction of the facility takes place the first 2 years, and production is assumed during 10 years (Appendix).
7Following “best practices” reported in the literature, we used the market value of equity, instead of the book value of equity, for all the estimations in this paper (Flannery and Rangan, 2006; Trejo-Pech et al., 2015). Untabulated results indicate that the debt to capital ratio (using book value of equity) for firms in the sample has a 54% mean and 44% median
8The beta of a diversified portfolio equals 1.0, with a beta value higher than 1.0 indicating higher risk and vice versa
References
Air BP (2021). What Is Sustainable Aviation Fuel (SAF) and Why Is it Important? | News and Views. Air Bp. Available at: https://www.bp.com/en/global/air-bp/news-and-views/views/what-is-sustainable-aviation-fuel-saf-and-why-is-it-important.html (Accessed October 24, 2021).
Altendorf, K., Isbell, T., Wyse, D. L., and Anderson, J. A. (2019). Significant Variation for Seed Oil Content, Fatty Acid Profile, and Seed Weight in Natural Populations of Field Pennycress (Thlaspi Arvense L.). Ind. Crops Prod. 129, 261–268. doi:10.1016/j.indcrop.2018.11.054
AMS USDA (2019). Feedstuff Corn Distillers Dried Grain Prices. Available at: https://www.marketnews.usda.gov/mnp/ls-report-config?category=Feedstuff. (Accessed July 20, 2021).
Asquith, P. (1993). Leveraged Betas and the Cost of Equity. Boston, MA: Harvard Business School Publishing 9-288–036, 1–11.
Baker, H. K., Singleton, J. C., and Veit, E. T. (2010). “Capital Budgeting,” in Survey Research in Corporate Finance (Oxford, UK: Oxford University Press), 64–138. doi:10.1093/acprof:oso/9780195340372.003.0003
Bann, S. J. (2017). A Stochastic Techno-Economic Comparison of Alternative Jet Fuel Production Pathways. Thesis. Boston (MA): Massachusetts Institute of Technology.
Blume, M. E., and Friend, I. (1973). A New Look at the Capital Asset Pricing Model. J. Finance 28 (1), 19–34. doi:10.1111/j.1540-6261.1973.tb01342.x
Brotherson, T., Eades, K., Harris, R., and Higgins, R. (2013). Best Practices’ in Estimating the Cost of Capital: An Update. J. Appl. Finance 23 (1), 1–19.
Campbell, R. M., Anderson, N. M., Daugaard, D. E., and Naughton, H. T. (2018). Financial Viability of Biofuel and Biochar Production from Forest Biomass in the Face of Market Price Volatility and Uncertainty. Appl. Energ. 230, 330–343. doi:10.1016/j.apenergy.2018.08.085
Chopra, R., Folstad, N., Lyons, J., Ulmasov, T., Gallaher, C., Sullivan, L., et al. (2019). The Adaptable Use of Brassica NIRS Calibration Equations to Identify Pennycress Variants to Facilitate the Rapid Domestication of a New Winter Oilseed Crop. Ind. Crops Prod. 128, 55–61. doi:10.1016/j.indcrop.2018.10.079
Eberle, C. A., Thom, M. D., Nemec, K. T., Forcella, F., Lundgren, J. G., Gesch, R. W., et al. (2015). Using Pennycress, Camelina, and Canola Cash Cover Crops to Provision Pollinators. Ind. Crops Prod. 75, 20–25. doi:10.1016/j.indcrop.2015.06.026
Eswaran, S., Subramaniam, S., Geleynse, S., Brandt, K., Wolcott, M., and Zhang, X. (2021). Techno-Economic Analysis of Catalytic Hydrothermolysis Pathway for Jet Fuel Production. Renew. Sustain. Energ. Rev. 151, 111516. doi:10.1016/j.rser.2021.111516
Evangelista, R. L., Isbell, T. A., and Cermak, S. C. (2012). Extraction of Pennycress (Thlaspi Arvense L.) Seed Oil by Full Pressing. Ind. Crops Prod. 37 (1), 76–81. doi:10.1016/j.indcrop.2011.12.003
Fama, E. F., and French., K. R. (1993). Common Risk Factors in the Returns on Stocks and Bonds. J. Financial Econ. 33 (1), 3–56. doi:10.1016/0304-405X(93)90023-5
Fan, J., Shonnard, D. R., Kalnes, T. N., Johnsen, P. B., and Rao, S. (2013). A Life Cycle Assessment of Pennycress (Thlaspi Arvense L.) -Derived Jet Fuel and Diesel. Biomass and Bioenergy 55, 87–100. doi:10.1016/j.biombioe.2012.12.040
Flannery, M. J., and Rangan, K. P. (2006). Partial Adjustment toward Target Capital Structures. J. Financial Econ. 79 (3), 469–506. doi:10.1016/j.jfineco.2005.03.004
Graham, J. R., and Harvey, C. R. (2018). The Equity Risk Premium in 2018. SSRN J.. Rochester, NY: Social Science Research Network. doi:10.2139/ssrn.3151162
Graham, J. R., and Harvey, C. R. (2001). The Theory and Practice of Corporate Finance: Evidence from the Field. J. Financial Econ. 60 (2), 187–243. doi:10.1016/S0304-405X(01)00044-7
Hileman, J. I., De la Rosa Blanco, E., Bonnefoy, P. A., and Carter, N. A. (2013). The Carbon Dioxide Challenge Facing Aviation. Prog. Aerospace Sci. 63, 84–95. doi:10.1016/j.paerosci.2013.07.003
Howarth, R. B., and Sanstad, A. H. (1995). Discount Rates and Energy Efficiency. Contemp. Econ. Pol. 13 (3), 101–109. doi:10.1111/j.1465-7287.1995.tb00726.x
ICAO (2021). Carbon Offsetting and Reduction Scheme for International Aviation (CORSIA). ICAO Environment. Available at: https://www.icao.int/environmental-protection/CORSIA/Pages/default.aspx (Accessed September 3, 2021).
Jacobs, M., and Shivdasani, A. (2012). Do You Know Your Cost of Capital? Harv. Business Rev., 119–124.
Jagannathan, R., Matsa, D. A., Meier, I., and Tarhan, V. (2016). Why Do Firms Use High Discount Rates? J. Financial Econ. 120 (3), 445–463. doi:10.1016/j.jfineco.2016.01.012
Jeong, D., Tyner, W. E., Meilan, R., Brown, T. R., and Doering, O. C. (2020). Stochastic Techno-Economic Analysis of Electricity Produced from Poplar Plantations in Indiana. Renew. Energ. 149, 189–197. doi:10.1016/j.renene.2019.11.061
Khanal, A., and Shah, A. (2021). Oilseeds to Biodiesel and Renewable Jet Fuel: An Overview of Feedstock Production, Logistics, and Conversion. Biofuels, Bioprod. Bioref. 15 (3), 913–930. doi:10.1002/BBB.2198
Kubic, W. L., Moore, C. M., Semelsberger, T. A., and Sutton, A. D. (2021). Recycled Paper as a Source of Renewable Jet Fuel in the United States. Front. Energ. Res. 9, 627. doi:10.3389/fenrg.2021.728682
Lamers, P., Tan, E. C. D., Searcy, E. M., Scarlata, C. J., Cafferty, K. G., and Jacobson, J. J. (2015). Strategic Supply System Design - a Holistic Evaluation of Operational and Production Cost for a Biorefinery Supply Chain. Biofuels, Bioprod. Bioref. 9 (6), 648–660. doi:10.1002/bbb.1575
Lan, K., Park, S., Kelley, S. S., English, B. C., Yu, T. H. E., Larson, J., et al. (2020). Impacts of Uncertain Feedstock Quality on the Economic Feasibility of Fast Pyrolysis Biorefineries with Blended Feedstocks and Decentralized Preprocessing Sites in the Southeastern United States. GCB Bioenergy 12 (11), 1014–1029. doi:10.1111/gcbb.12752
Markel, E., English, B., Hellwinckel, C., and Menard, J. (2018). Potential for Pennycress to Support a Renewable Jet Fuel Industry. SciEnvironm 1 (1), 95–102.
Marks, M. D., Chopra, R., and Sedbrook, J. C. (2021). Technologies Enabling Rapid Crop Improvements for Sustainable Agriculture: Example Pennycress (Thlaspi Arvense L.). Emerging Top. Life Sci. 5 (2), 325–335. doi:10.1042/ETLS20200330
McCollum, C. J., Ramsey, S. M., Bergtold, J. S., and Andrango, G. (2021). Estimating the Supply of Oilseed Acreage for Sustainable Aviation Fuel Production: Taking Account of Farmers' Willingness to Adopt. Energ Sustain. Soc. 11 (1), 33. doi:10.1186/s13705-021-00308-2
McGarvey, E., and Tyner, W. E. (2018). A Stochastic Techno-Economic Analysis of the Catalytic Hydrothermolysis Aviation Biofuel Technology. Biofuels, Bioprod. Bioref. 12 (3), 474–484. doi:10.1002/bbb.1863
Metro Ag Energy (2019). Planting PENNYCRESS as a Cover Crop Benefits Farmers. Available at: https://www.metroagenergy.com/farmers-planting-field-pennycress. (Accessed January 9, 2019).
Moser, B. R., Evangelista, R. L., and Isbell, T. A. (2015). Preparation and Fuel Properties of Field Pennycress (Thlaspi Arvense) Seed Oil Ethyl Esters and Blends with Ultralow-Sulfur Diesel Fuel. Energy Fuels 30, 473–479. ACS Publications. Available at: https://pubs.acs.org/doi/pdf/10.1021/acs.energyfuels.5b02591 (Accessed October 21, 2021). doi:10.1021/acs.energyfuels.5b02591
Moser, B. R., Knothe, G., Vaughn, S. F., and Isbell, T. A. (2009). Production and Evaluation of Biodiesel from Field Pennycress (Thlaspi arvenseL.) Oil†. Energy Fuels 23 (8), 4149–4155. doi:10.1021/ef900337g
Mousavi-Avval, S. H., and Shah, A. (2021). Techno-Economic Analysis of Hydroprocessed Renewable Jet Fuel Production from Pennycress Oilseed. Renew. Sustain. Energ. Rev. 149, 111340. doi:10.1016/j.rser.2021.111340
Mousavi-Avval, S. H., and Shah, A. (2020). Techno-Economic Analysis of Pennycress Production, Harvest and Post-Harvest Logistics for Renewable Jet Fuel. Renew. Sustain. Energ. Rev. 123, 109764. doi:10.1016/j.rser.2020.109764
Palisade (2018). @Risk: Risk Analysis and Simulation Add-In for Microsoft Excel. Ithaca, NY: Palisade Corporation. Available at: https://www.palisade.com/risk/. (Accessed August 20, 2021).
Petter, R., and Tyner, W. E. (2014). Technoeconomic and Policy Analysis for Corn Stover Biofuels. ISRN Econ. 2014, 1–13. doi:10.1155/2014/515898
Schill, M. J. (2017). Business Valuation: Standard Approaches and Applications. Charlottesville, VA: Darden Business Publishing, University of Virginia UV6586, 1–14. Rev. Nov. 20. doi:10.1108/case.darden.2016.000021
Sharpe, W. F. (1964). Capital Asset Prices: A Theory of Market Equilibrium under Conditions of Risk. J. Finance 19, 425–442. doi:10.2307/2977928
SkyNRG (2021). Sustainable Aviation Fuel (SAF). SkyNRG. Available at: https://skynrg.com/sustainable-aviation-fuel/saf/ (Accessed October 24, 2021).
Standard and Poor’s (2021). Standard and Poor’s Net Advantage. Standard and Poor’s Capital IQ. S&P Global Market Intelligence. Available at: www.capitaliq.com (Accessed May 10, 2021).
Stevens, J. H., and Taheripour, F. (2020). A Stochastic Techno-Economic Analysis of Aviation Biofuel Production from Pennycress Seed Oil. West Lafayette, IN: Agricultural and Applied Economics Association. 304524.
Tanzil, A. H., Brandt, K., Wolcott, M., Zhang, X., and Garcia-Perez, M. (2021). Strategic Assessment of Sustainable Aviation Fuel Production Technologies: Yield Improvement and Cost Reduction Opportunities. Biomass and Bioenergy 145, 105942. doi:10.1016/j.biombioe.2020.105942
Tao, L., Milbrandt, A., Zhang, Y., and Wang, W.-C. (2017). Techno-Economic and Resource Analysis of Hydroprocessed Renewable Jet Fuel. Biotechnol. Biofuels 10 (1), 261. doi:10.1186/s13068-017-0945-3
Thomas, J. B., Hampton, M. E., Dorn, K. M., David Marks, M., and Carter, C. J. (2017). The Pennycress (Thlaspi Arvense L.) Nectary: Structural and Transcriptomic Characterization. BMC Plant Biol. 17 (1), 201. doi:10.1186/s12870-017-1146-8
Thompson, P. B. (1997). Evaluating Energy Efficiency Investments: Accounting for Risk in the Discounting Process. Energy Policy 25 (12), 989–996. doi:10.1016/S0301-4215(97)00125-0
Trejo Pech, C. O., Noguera, M., and White, S. (2015). Financial Ratios Used by Equity Analysts in Mexico and Stock Returns. Contaduría y Administración 60 (3), 578–592. doi:10.1016/j.cya.2015.02.001
Trejo-Pech, C. O., Larson, J. A., English, B. C., and Yu, T. E. (2019). Cost and Profitability Analysis of a Prospective Pennycress to Sustainable Aviation Fuel Supply Chain in Southern USA. Energies 12 (16), 3055. doi:10.3390/en12163055
Tyner, W., and Brandt, K. (2019). Techno-Economic Analysis in ASCENT Projects. NA: The Aviation Sustainability Center.
Wang, M., Dewil, R., Maniatis, K., Wheeldon, J., Tan, T., Baeyens, J., et al. (2019). Biomass-Derived Aviation Fuels: Challenges and Perspective. Prog. Energ. Combustion Sci. 74, 31–49. doi:10.1016/j.pecs.2019.04.004
WRDS (2021). Wharton Research Data Services (WRDS). The Global Standard for Business Research. Wharton Research Data Services. CRSP Module. Available at: https://wrds-www.wharton.upenn.edu/ (Accessed May 2, 2021).
Yao, G., Staples, M. D., Malina, R., and Tyner, W. E. (2017). Stochastic Techno-Economic Analysis of Alcohol-To-Jet Fuel Production. Biotechnol. Biofuels 10 (1), 18. doi:10.1186/s13068-017-0702-7
Zhao, X., Brown, T. R., and Tyner, W. E. (2015). Stochastic Techno-Economic Evaluation of Cellulosic Biofuel Pathways. Bioresour. Technol. 198, 755–763. doi:10.1016/j.biortech.2015.09.056
Zhao, X., Yao, G., and Tyner, W. E. (2016). Quantifying Breakeven Price Distributions in Stochastic Techno-Economic Analysis. Appl. Energ. 183, 318–326. doi:10.1016/j.apenergy.2016.08.184
Zhou, X. V., Jensen, K. L., Larson, J. A., and English, B. C. (2021). Farmer Interest in and Willingness to Grow Pennycress as an Energy Feedstock. Energies 14 (8), 2066. doi:10.3390/en14082066
Appendix
Forecast free cash flows yielding NPV = 0 and MIRR = 12.5% with pennycress feedstock buying price = 10.8 ¢ pound−1 during the first year of operation
Keywords: sustainable aviation fuel supply, profitability and risk, investment hurdle rates, stochastic tecno-economic analysis, pennycress supply chain, biofuel discount rates
Citation: Trejo-Pech CO, Larson JA, English BC and Yu TE (2021) Biofuel Discount Rates and Stochastic Techno-Economic Analysis for a Prospective Pennycress (Thlaspi arvense L.) Sustainable Aviation Fuel Supply Chain. Front. Energy Res. 9:770479. doi: 10.3389/fenrg.2021.770479
Received: 03 September 2021; Accepted: 22 November 2021;
Published: 10 December 2021.
Edited by:
William Goldner, United States Department of Agriculture (USDA), United StatesReviewed by:
Obulisamy Parthiba Karthikeyan, University of Houston, United StatesPau Loke Show, University of Nottingham Malaysia Campus, Malaysia
Copyright © 2021 Trejo-Pech, Larson, English and Yu. This is an open-access article distributed under the terms of the Creative Commons Attribution License (CC BY). The use, distribution or reproduction in other forums is permitted, provided the original author(s) and the copyright owner(s) are credited and that the original publication in this journal is cited, in accordance with accepted academic practice. No use, distribution or reproduction is permitted which does not comply with these terms.
*Correspondence: Carlos Omar Trejo-Pech, Y3RyZWpvcGVAdXRrLmVkdQ==