 Xue Wang
 Lu Li*
 Fusen Zhao
- College of Business, Shanghai University of Finance and Economics, Shanghai, China
Global warming caused by carbon emissions is a central concern across the world. Given the immense contribution of Northeast China to total carbon dioxide emissions, this study explores the driving forces of carbon emissions in that region from the perspective of investment-related factors, applying a logarithmic mean Divisia index (LMDI) model. We assess the driving forces on carbon emissions using a temporal LMDI model and explore interregional differences using a spatial LMDI model. The main findings are as follows. First, the trajectory of investment evolution is consistent with the mitigation of carbon emissions, which indicates that investment-related factors have a significant impact on carbon emissions. Second, the region’s carbon emissions are mainly generated by industry in Inner Mongolia and Liaoning, which suggests that the industry structure in Inner Mongolia should be adjusted to improve its coal-based energy consumption. In Liaoning, in contrast, the investment efficiency effect is a major driving force, which suggests that the regional investment structure should be adjusted to generate a more significant and orderly momentum. Lastly, although the impact of industry structure on carbon emission mitigation has significantly increased over time in Northeast China, local policy needs to be updated regularly. In line with these findings, several potential suggestions are offered for the formulation of practical and appropriate guidelines by the regional government.
Introduction
The IPCC Sixth Assessment Report has pointed out that substantial and sustained reductions in carbon dioxide (CO2) and other greenhouse gas emissions will limit climate change. There is international dedication to improving the atmospheric environment, with more and more attention being paid to the threat from irreversible changes in the climate system. This issue is a central concern for China, which has made great efforts to handle its continuously increasing carbon emissions. Analysis of daily data published in Global Energy Review shows that countries in total lockdown are experiencing an average decline of 25% in energy demand per week, whereas countries in partial lockdown are seeing an average decline of 18%.1 Although countries worldwide have been making a considerable effort to reduce their energy consumption, carbon emissions have shown only a slight decline. Global CO2 emissions from fuel combustion reached a historical high of 33.5 Gt in 2018, driven by robust growth in population and economic activity. They showed a slight decline (<1%) in 2019, mainly due to the power sector in advanced economies and milder weather conditions across continents.2 China, in particular, has promised to reduce CO2 emissions per unit of GDP by 40% to 45% compared with 2005 levels by 2020 (Wang and Yang, 2015; Liu et al., 2019). As the country’s oldest and most extensive industrial base, Northeast China has contributed greatly to national economic development and has triggered energy consumption and carbon emissions. The four northeastern provinces are energy-oriented regions with abundant energy-based natural resources, such as coal and crude oil. Analysis of the dominant driving forces of carbon emissions is crucial for solving the problem effectively. Accordingly, here we explore how comprehensive and profound exploitation of influential characters can lead to more appropriate regulation for reducing CO2 emissions.
For the purposes of studying regional factors in carbon emissions using a geographically weighted regression model, Northeast China contains four regions: Inner Mongolia, Liaoning, Jilin, and Heilongjiang (Xu et al., 2017). The northeastern region was honored as “the Industrial Cradle” in the initial phase of China’s development; it contributed significantly to China’s heavy equipment manufacture industry, and it remains prominent in industrial and scientific research. For example, machine tools produced in Liaoning province account for 11% of the national total, and automobiles produced in Jilin province account for 11.5%. Thermal power and hydropower equipment in Heilongjiang province accounts for 33% and 50% of the national market, respectively, and power transmission and transformation equipment in the northeastern area accounts for 40% of the national total, reflecting its essential role in guaranteeing national economic security. Most importantly, there are rich mineral resources in the northeastern region, with coal and oil resources the most abundant. The reserves of coal in Northeast China are approximately 72.3 billion tons, of which 60% are in the east of Inner Mongolia, 27% in Heilongjiang, and 13% in Liaoning and Jilin.3 Northeast China also has the largest oil resources reservoir, accounting for approximately half of the national reserves. The three largest oilfields (Daqing, Liaohe, and Jilin) have made an outstanding contribution to China’s economic development. Daqing oilfield, located in Daqing City, Heilongjiang province, is the largest in China, with an annual output of 40–50 million tons. Liaohe oilfield, located in Liaoning and Inner Mongolia, produces 10 million tons of crude oil and 900 million cubic meters of natural gas annually. Jilin oilfield, located in Jilin, has reached annual output of 6.5 million tons of crude oil and a processing capacity of 700,000 tons. In general, although some studies have carried out decomposition analysis of the four northeastern regions, there has been almost no focus on the investment perspective in the regional breakdown.
This study therefore explores the driving forces of carbon emissions in Northeast China from the perspective of investment, including energy structure (ES), energy intensity (EI), industrial structure, investment efficiency (IE), investment activity (IA), and population scale (PS). We use an extended Kaya identity with temporal and spatial logarithmic mean Divisia index (LMDI) measurement to probe the evolution of regional CO2 emissions and investigate discrepancies between areas. This study makes the following main contributions to the literature. First, it investigates the influential factors in four resource-rich areas and examines the critical driving forces for carbon emissions in the context of regional discrepancies, providing a point of reference for the policy committee and informing regional regulations. Second, we adopt a practical perspective, emphasizing that the investment trend is closely correlated with the direction of economic output and is indirectly related to energy consumption, as demonstrated by China’s actual conditions. We are the first to attempt to decompose the carbon emissions in the northeastern regions in terms of investment. Our results provide novel insights into the reasons for carbon emission changes and suggest innovative solutions that policy committees can use to decrease total emissions. Finally, this study ranks the performance of a range of effect factors in the four regions, which is crucial for formulating differentiated measures of energy conservation and emission reduction. The results of this empirical study will therefore be valuable for local agents seeking to renew existing policy in light of investment-related suggestions.
The rest of this study is organized as follows. Literature Review reviews the literature, and Methods and Data introduces the methodology and data sources. In Results and Discussion, we describe the decomposition results and analyze the potential measurement of carbon emission changes. The conclusions and policy implications are given in Results of Driving Forces in Carbon Emissions.
Literature Review
Global warming triggered by CO2 emissions affects crop production (Rehman et al., 2020), forestry production, livestock production, energy usage, population growth, temperature, and rainfall (Rehman et al., 2021a). This is the reason research has focused on analyzing decomposition of carbon emissions, and various trends have been identified. Some studies have focused on global deterioration and decoupling trends. The results show no clear decoupling state in most developing countries and confirm that EI has a significant effect worldwide (Wang and Su, 2020). Other studies on a variety of countries, including Thailand, Pakistan, Lithuania, Turkey, the United States, and Bangladesh (Dalton et al., 2008; Akbostancı et al., 2011; Baležentis et al., 2011; Chontanawat et al., 2020; Yasmeen et al., 2020; Murshed et al., 2021), have identified a rising trend and have made suggestions for government energy conservation and carbon emission reduction policies.
The current literature on the roles of crucial drivers of CO2 emissions in China can be divided into two categories. Many scholars have adopted a national scope analysis perspective (Meng et al., 2018; Shan et al., 2018; Sun et al., 2019; Chen C. et al., 2019), including several studies that emphasize analysis of manufacturing (Shi et al., 2019; Hang et al., 2019), showing that EI is the dominant factor responsible for the intersectoral discrepancies in CO2 emissions among the 28 subsectors of manufacturing. Sun et al. (2021a) considered how the institutions of neighboring countries influence domestic energy efficiency, as well as the effects of technological innovation (Sun et al., 2021b; Khan et al., 2021). A few studies from the economic perspective have analyzed the decomposition of carbon emissions (Chen C. et al., 2019; Dai and Gao, 2016; Chishti et al., 2021; Rehman et al., 2021b). Some studies have also carried out regional analysis of carbon emissions (including research on the decomposition of carbon emissions in Beijing-Tianjin-Heibei (Wang and Yang, 2015), Guangdong (Xie et al., 2020), Suzhou and Anhui (Zhang and Fang, 2013), Shanghai (Zhu and Zhang, 2011), and Xinjiang (Gu and Gong, 2012), concluding that secondary industry dominates carbon emissions.
Investment trends are highly relevant to economic output and have an indirect impact on carbon emissions. As a result, investment-related factors have become a dominant decomposition factor of CO2 emissions, and we find studies that investigate the relationship between foreign direct investment (FDI), economic growth, and CO2 emissions (Sbia et al., 2014; Kivyiro and Arminen, 2014; Hussain and Rehman, 2021). Their results indicate that FDI increases carbon emissions in some countries but reduces them in others. Some studies have focused on investment in innovation. Zhang et al. (2018) investigated the relationship between public–private partnership investment in energy and CO2 emissions by considering the role of technological innovations in China. Research has also shown that investment in the energy industry may influence economic performance (Álvarez-Herránz et al., 2017; Ahmad et al., 2020; Ahmad et al., 2021), in some cases with a focus on investment in low-carbon energy (Lee, 2013; Mo et al., 2016).
A number of other factors that have been explored as critical factors contributing to carbon emissions are primary inhibitors of the increase in carbon intensity. For example, the EI effect reflects changes in the ratio of industrial energy consumption to the value-added economy (which generates low efficiency in emission changes when its value is high), making it a primary inhibitor of increases in carbon intensity (Diakoulaki and Mandaraka, 2007; Chen J. et al., 2019; Hang et al., 2019; Chishti et al., 2021). As ES adjustment is essential for low-carbon development in the future, and because energy is the primary carbon emission source, the ES needs to be adjusted to favor clean energy (Zhang and Da, 2015; Zhao et al., 2015; Wei et al., 2019; Zhu et al., 2021). In that connection, Rehman et al. (2021c) investigated the interaction of CO2 emissions with industrialization, energy imports, carbon intensity, economic progress, and gross capital formation. It appears that changes in energy demand are partially determined by the population, and some studies have taken the population effect as the main factor stimulating the increase in CO2 emissions (Wei et al., 2019; Wang and Wang, 2020). Wei et al. (2019) noted, however, that although the population size effect has shown a fluctuating trajectory, the cumulative changes in carbon emissions have continued to increase.
We summarize the relevant literature in terms of research object, research technique, and major influence factors in the Supplementary Material.
Methods and Data
The Decomposition Model
Carbon Emission Estimation
We use the calculation method of carbon emissions estimation from the 2006 IPCC Guidelines proposed for National Greenhouse Gas Inventories,4 as given in the following formula:
where
Kaya Identity
Decomposition analysis has been used widely in energy and carbon emissions research to identify the factors that are influential over time. Two popular decomposition techniques were proposed by Ang (2005) and Ang et al. (2016): index decomposition analysis and spatial decomposition analysis (SDA), which is the measurement we apply in the present study. The CO2 emissions are decomposed into seven components: the ES effect, the EI effect, the industry structure (IS) effect, the IE effect, the IA effect, and the PS effect. Carbon emissions are expressed as in the following equation:
where
The Temporal LMDI Model
We calculate the mitigation of carbon emissions for region i between the base year 0 and target year t using the following formula:
The effect characters in the equation above can be calculated using the following formula:
where
Spatial LMDI Model
Our study of discrepancies in CO2 emissions between regions is based on SDA. We calculate the carbon emissions in region
The effect characters in the equation above can be calculated using the following formula:
where
Data Collection and Processing
Analysis of the driving forces for CO2 emissions depends on the data available. Our data cover the four northeastern regions for the period 2002–2017. The calculation of carbon emissions consisted of two stages. First, the direct emissions in relation to fossil fuel combustion were estimated with reference to the 2006 IPCC Greenhouse Gas Emissions Inventory Guide. The CO2 emission coefficient of energy was proposed by the China Sustainable Energy and Carbon Emissions Scenario Analysis Comprehensive Report released by the Energy Research Institute, National Development and Reform Commission of China. The data for energy and the energy conversion coefficient were obtained from the China Energy Statistical Yearbook (2003–2018). The total energy consumption was weighted by million tons of standard coal equivalent (Mtce). Second, the carbon emissions generated indirectly from electricity and heat were calculated using the equation in Supplementary Material, and the related data were obtained from the China Power Statistics Yearbook (2003–2018).
The EI effect and IS calculations were based on economic output in terms of GDP. The added value of the industry indicator was obtained from the China Economic and Social Development Statistical Bulletin (2003–2018). The investment data used to compute the IE and IA effects were taken from the China Statistical Yearbook (2003–2018), and we adopted its indicator for investment in fixed assets of state-owned units in the energy industry by region. Population data were obtained from the National Bureau of Statistics.5
Results and Discussion
Trends in Main Factors
Before we carried out the decomposition analysis, it was necessary to understand the historical trends in carbon emission and energy consumption for the four northeastern regions. Figure 1 shows that the trends of the changes in CO2 emissions and energy consumption in the four northeastern areas were similar. Liaoning and Inner Mongolia had greater CO2 emissions and energy consumption than the other two areas. From 2002 to 2017, Inner Mongolia increased its CO2 emissions by 213% and its energy consumption by 250%. In Liaoning, CO2 emissions increased by 77% and energy consumption by 131%. As Figure 1 shows, the increase was not steady over the whole period. There was a significant increase between 2002 and 2011 (except for 2007), and a partial recovery following the decline between 2011 and 2017. The trends in Liaoning and Jilin were consistent with the trend in Inner Mongolia, although there was a steady growth in energy-related CO2 emissions as a proportion of the annual growth rate in Jilin from 2002 to 2017. It is worth noting that the growth in these three regions exhibited an inverted U-shape tendency; this is because the Chinese State Council issued the Notice on the Issuance of the Work Plan for controlling greenhouse gas emissions during the First Five-Year Plan period.
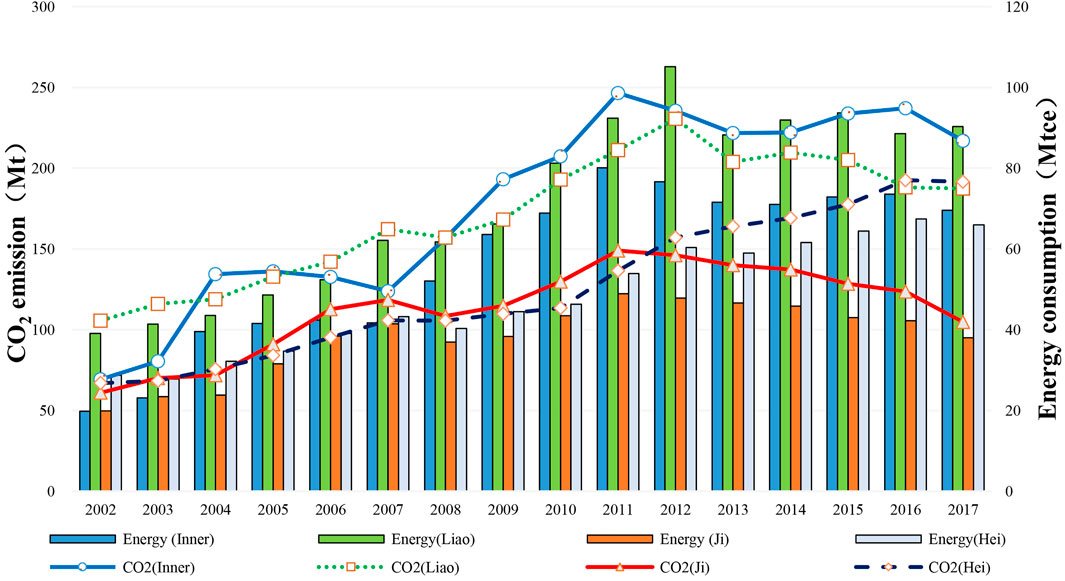
FIGURE 1. Evolution of energy consumption and CO2 emissions in the four northeastern regions.
Figure 2 compares CO2 emissions and investment in fixed assets in the energy industry. The two objects evolved in similar ways in all four northeastern regions, which shows that investment in fixed assets in the energy industry is a crucial effect for CO2 emissions. This is the basis of the decomposition analysis of CO2 emissions. The investment data show that Inner Mongolia had the most significant investment of the four regions. Moreover, the trend for investment in fixed assets in the energy industry remained steady from 2002 to 2010, with the largest amount of investment in 2014 (122.40 billion RMB). Investment in the four regions increased by 2,474% in Inner Mongolia, 325% in Liaoning, 821% in Jilin, and 832% in Heilongjiang from 2002 to 2017 and accounted for 4.75 billion, 10.82 billion, 4.27 billion, and 6.82 billion RMB, respectively, in the base year 2002. From our analysis of carbon emissions and investment, we conclude that the rapid growth of investment contributed to rapid economic growth and expansion of production capacity. It also increased energy consumption and carbon emissions.
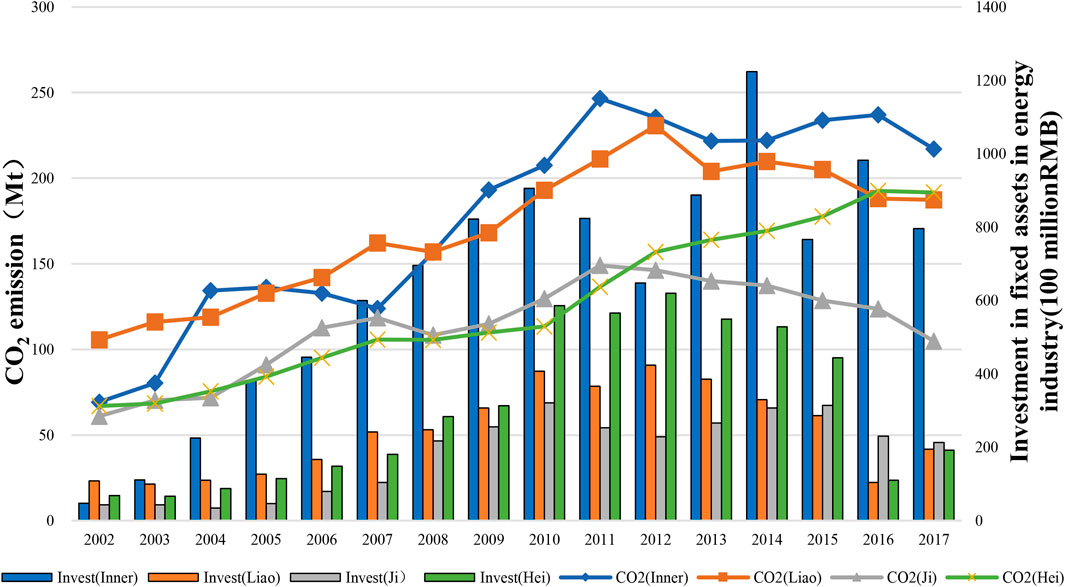
FIGURE 2. Evolution of investment in fixed assets in the energy industry and CO2 emissions in the four northeastern regions.
Energy consumption came mainly from agriculture, industry, construction, transport, retail trade, residential consumption, and others, and carbon emissions were relevant to the five sectors. Figure 3 shows the share of the carbon emissions from different sectors in the four northeastern regions from 2002 to 2017. The carbon emissions in the industry sector accounted for approximately 63.0% in Inner Mongolia, 53.9% in Liaoning, 56.1% in Jilin, and 46.9% in Heilongjiang, making it the largest of the regional CO2 emitters for the five sectors. The results confirm that industrialization is an essential factor in energy consumption and CO2 emissions; Northeast China is China’s old industrial base, and it laid the foundation for the industrialization of the country as a whole.
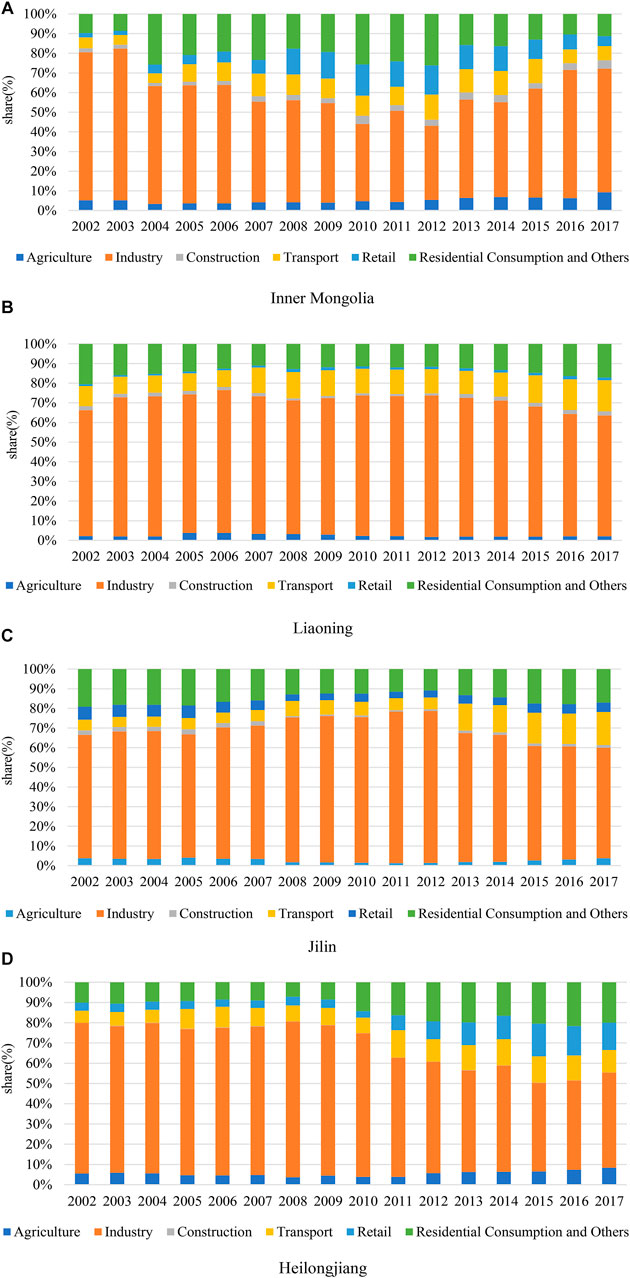
FIGURE 3. Share of CO2 emissions from the different sectors in (A) (Inner Mongolia), (B) (Liaoning), (C) (Jilin) and (D) (Heilongjiang).
However, industry’s share of the carbon emissions declined from 2010, as the four regions began to adjust their industrial structure in response to the national policy of optimizing the ES. Residential consumption and other sectors had the second-largest shares in regional CO2 emissions, accounting for as much as one-fifth of the total. The transport sector was the third largest regional CO2 emitter, and its share fluctuated slightly between 2000 and 2017 (4.7%–12.7% for Inner Mongolia, 8.3%–15.8% for Liaoning, 5.1%–16.7% for Jilin, and 5.8%–12.9% for Heilongjiang). The share in carbon emissions of the agriculture and retail trade sectors was higher in Inner Mongolia and Heilongjiang than in the other two northeastern regions because of geographical factors that favor the development of those sectors. Our analysis thus indicates that there was variation over time in the proportion of the five elements accounted for by each region.
Results of Driving Forces in Carbon Emissions
Temporal Decomposition Results
The influential factors on the changes in CO2 emissions for the four northeastern regions throughout the period are shown in Figures 4–6. It is convenient to track the effects of all the components at 5-year intervals, consistent with China’s Five-Year Plans.
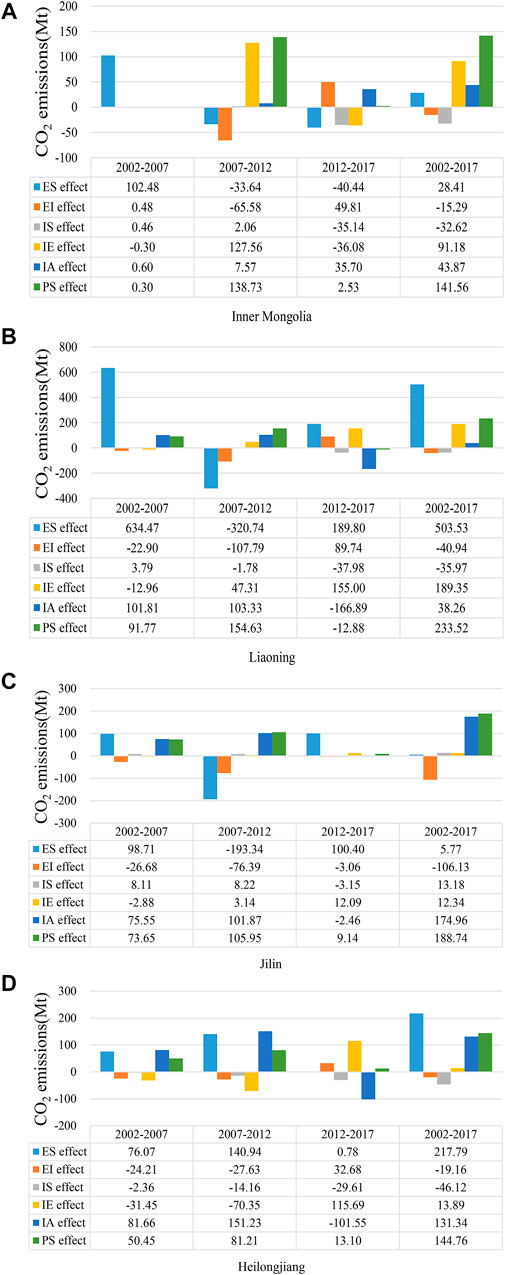
FIGURE 4. Temporal decomposition of CO2 emission changes in (A) (Inner Mongolia), (B) (Liaoning), (C) (Jilin) and (D) (Heilongjiang).
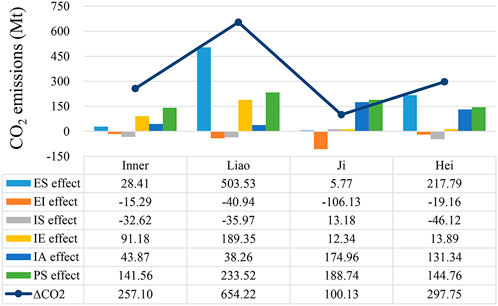
FIGURE 5. Temporal decomposition of CO2 emission changes in the four northeastern regions, 2002–2017.
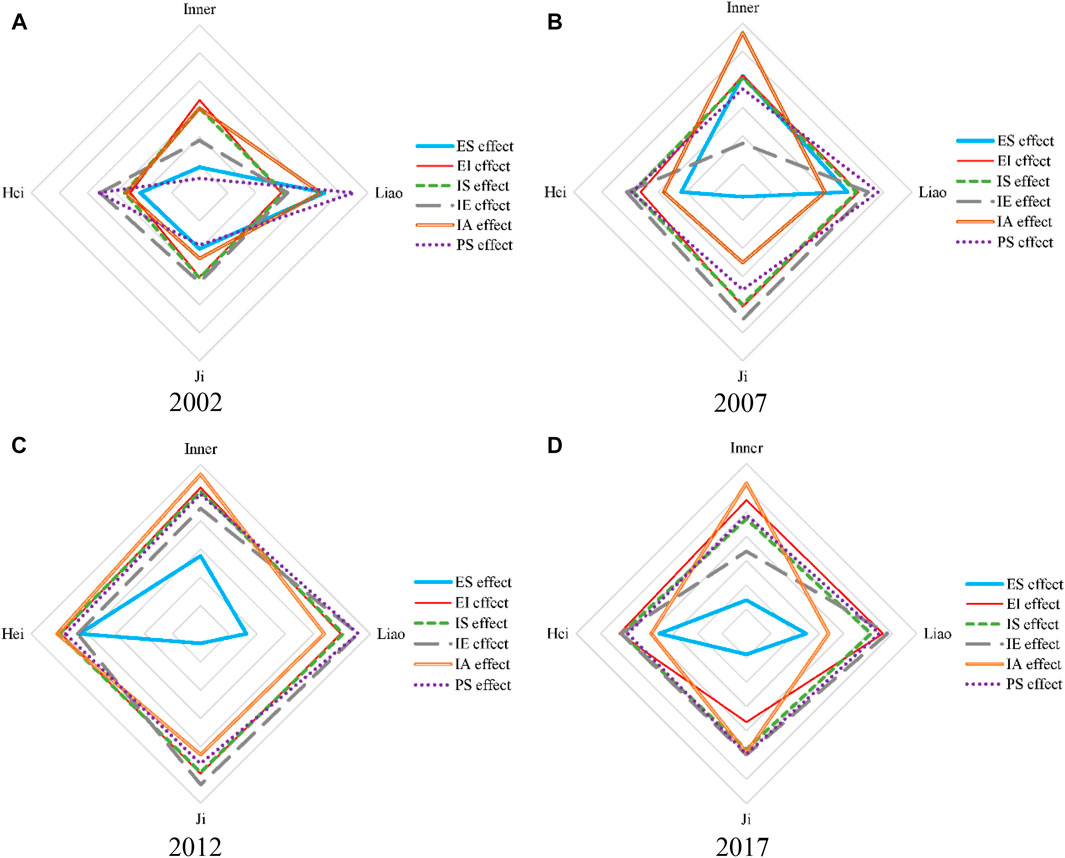
FIGURE 6. Spatial decomposition results for the four northeastern regions in (A) 2002, (B) 2007, (C) 2012, and (D) 2017.
The decomposition effect of CO2 emissions in the four regions from 2002 to 2017 is shown in Figure 4. Notably, the results show that the evolution of carbon emissions was influenced by the ES effect, the EI effect, the IS effect, the IE effect, and the IA effect.
ES effect: The ES effect made a substantial contribution to the increase in carbon emissions, most significantly in Liaoning. The cumulative contribution of the ES effect reached 503.53 Mt and accounted for approximately 76.97% of the total changes in carbon emissions from 2002 to 2017. The cumulative contribution of this effect reached 28.41 Mt in Inner Mongolia, 5.77 Mt in Jilin, and 217.79 Mt in Heilongjiang, accounting for 24.59%, 5.77%, and 73.14%, respectively. These results show that the ES effect positively influenced levels of CO2 emissions from 2002 to 2007 for the four northeastern regions, mainly because of the importance of coal, washing coal, gasoline, and diesel in their energy consumption, followed by the policy of revitalizing the old industrial base. However, this effect drove a decline in energy-related CO2 emissions in 2007–2012 in Inner Mongolia, Liaoning, and Jilin, when the cumulative contributions reached −33.64 −320.74, and −193.44 Mt and accounted for −88.59%, 114.68%, and 123.58%, respectively. In addition, in 2008, the government adopted a series of measures to economize on energy and reduce emissions for the Beijing Olympic Games (Wang and Yang, 2015). As Inner Mongolia, Liaoning, and Jilin are located relatively close to Beijing, this is likely to have helped to adjust their regional industrial structure and optimize their ES.
EI effect: It is clear that EI was a dominant driving force in reducing carbon emissions from 2002 to 2017. The cumulative contribution of the EI effect reached −15.29 Mt in Inner Mongolia, −40.94 Mt in Liaoning, −106.13 Mt in Jilin, and −19.16 Mt in Heilongjiang, accounting for −13.23%, −6.25%, −105.99%, and −6.43%, respectively. It should be noted that EI denotes energy consumption per output and therefore relates to both energy-saving and energy efficiency measures. Energy saving involves reducing demand by adopting more efficient technologies in energy application, while energy efficiency involves improvements in production technology (Budzianowski, 2012). Local policies also played a role in the EI effect, such as the phasing-out and retirement of small-scale thermal power units and the elimination of backward production capacity (Lin and Du, 2014; Yang and Lin, 2016). This positively impacted carbon emissions in three of the regions, but not in Jilin, which played a negative and insignificant role from 2012 to 2017, with total contributions of 49.81, 89.74, and 32.68 Mt. Overall, the EI effect on the level of carbon emissions in Jilin was −3.06 Mt. This indicates that energy consumption increased from 2012 in the other three regions because these areas are energy-oriented cities where the local government had prioritized improving the economy. As a result, EI played an important role in the relationship between regional economic development and carbon emissions.
IS effect: IS was another crucial factor in the mitigation of CO2 emissions. From 2002 to 2017, the contributions of the IS effect to cumulative carbon emissions decreased considerably in Inner Mongolia, Liaoning, and Heilongjiang, which accounted for −32.62, −35.97, and −46.12 Mt of carbon emissions, respectively, and changed CO2 emissions by −28.23%, −5.49%, and −15.49%. The negative influence can be attributed mainly to the industry sector, which accounted for a substantial share of the growth of CO2 emissions (as shown in Figure 2 and in the results of other studies) (Wang and Yang, 2015; Shi et al., 2019). Notably, in Jilin, the IS effect on CO2 emissions amounted to 13.18 Mt. However, the industry sector played a critical role in the mitigation of carbon emissions, with transportation in second place, showing a significantly improving trend and exerting a positive influence on CO2 emissions. As a result, the IS effect resulted in an increase of 13.16%. Moreover, the IS effect had a noticeable impact on the decline in the cumulative carbon emissions of all four northeastern regions from 2012 to 2017, as shown in the trend in alternation between the industry sector and other sectors. The analysis above indicates that industrial restructuring has a vital role to play in the management of energy consumption and carbon emissions. The government should therefore pay more attention to policy formulation in relation to IS.
Investment Efficiency effect: The investment efficiency (IE) effect was the main factor contributing to the increase in cumulative CO2 emissions. Over the entire period of 2002–2017, this reached 91.18 Mt in Inner Mongolia, 189.35 Mt in Liaoning, 12.34 Mt in Jilin, and 13.89 Mt in Heilongjiang, accounting for 78.91%, 28.94%, 12.32%, and 4.66%, respectively. From the analysis above, we know that the IE effect had a substantial influence on the growth of carbon emissions in Inner Mongolia. In addition, this effect had an immense impact on rising CO2 emissions (127.56 Mt) in 2007–2012, a period in which heavy industry’s share of local investment share increased, leading to rapid economic growth and rising CO2 emissions. However, from 2002 to 2007, the IE effect drove down CO2 emissions by −0.30 Mt in Inner Mongolia, −12.96 Mt in Liaoning, −2.88 Mt in Jilin, and −31.45 Mt in Heilongjiang. This was due to growing awareness of the importance of environmental protection in the northeastern regions and to investment starting to target green energy–related industry. IE refers to regional output per investment. When local government prioritizes rapid economic growth by investing in production scale, an increase in carbon emissions will result. In contrast, the IE effect plays a role in the decline in carbon emissions through investment in environmental technology and energy conservation–related industries.
IA effect: The IA effect was clearly a dominant driving force in changing CO2 emissions. The IA effect increased carbon emissions by 43.87 Mt, accounting for 37.97% of the total emissions in Inner Mongolia during the period under study (2002–2017). In addition, there was an upward trend in the positive impact of IA on carbon emissions, which in Inner Mongolia reached 0.60 Mt in 2002–2007, 7.57 Mt in 2007–2012, and 35.7 Mt in 2012–2017. During the recovery from the Asian financial crisis, the local government adopted measures that increased investment in infrastructure construction, leading to rising energy consumption and to investment per capita having a positive effect on total carbon emissions. In Liaoning, Jilin, and Heilongjiang, the IA effect positively influenced total carbon emissions, accounting for 38.26, 174.96, and 131.34 Mt from 2002 to 2017. Surprisingly, it also had a positive effect in other periods, except for 2012–2017, when the IA effect played a dominant role in reducing carbon emissions to 166.89, −2.46, and −101.55 Mt, accounting for −72.66%, −2.37%, and −564.41%, respectively.
Population Scale effect: The Population Scale (PS) effect is another factor that significantly increased CO2 emissions, accounting for 141.56 Mt in Inner Mongolia, 233.52 Mt in Liaoning, 188.74 Mt in Jilin, and 144.76 Mt in Heilongjiang, especially between 2002 and 2017. Over the period 2007–2012, all the northeastern regions increased their CO2 emissions significantly, and the “universal two-child policy” was implemented in 2016 to boost the population by encouraging couples to have more than one child. As the population statistics show, from 2007 to 2012, Inner Mongolia and Liaoning saw a more significant increase in population than the other two regions, with annual averages of 0.51% and 0.45%, respectively. It should be noted that in Liaoning, thanks to a falling marriage rate and population mitigation measures, the PS effect helped to reduce CO2 emissions by −12.88 Mt in 2012–2017, a period when total emissions were increasing in the other three regions.
From our comparison of the decomposition factors in the four northeastern regions in 2002–2017, we see that the most substantial total changes in carbon emissions were in Liaoning (reaching 654.22 Mt), followed by Heilongjiang, Inner Mongolia, and Jilin (reaching 297.75, 115.54, and 100.13 Mt, respectively). As the bar chart shows, the ES, IE, and IA effects combined to produce a positive effect on CO2 emissions in all four areas, with total reductions in carbon emissions from the EI effect of 15.29, −40.94, −106.13, and −19.16 Mt. In Liaoning, the ES effect led to the most extensive advancement in total carbon emissions (by 76.91%, 503.53 Mt), followed by the IE effect (189.35 Mt), with the IA effect in third place (38.26 Mt). Nevertheless, the EI and IS effects accounted for reductions in gross emissions of −40.94 and −35.97 Mt, respectively, indicating that the policy of improving the EI and adjusting the ES was effective. The influencing factors in Inner Mongolia and Heilongjiang were similar to those in Liaoning. However, in Jilin, all the effect factors were associated with an increase in carbon emissions, except for the EI effect, which reached −106.13 Mt.
Spatial Decomposition Results
The present objective is to analyze the discrepancies in the mitigation of carbon emissions between provinces and their averages in 2002, 2007, 2012, and 2017, which were decomposed into the five effect factors shown in Figure 5. The influencing factors generated different insights in the spatial decomposition than in the temporal decomposition analysis. For example, a positive value for the IE effect indicates that regional output per investment of a province was higher than the regional average; a positive value for the EI effect indicates that the energy utilization of a province was less efficient than the regional average. Figure 6 shows that the IA effect was a leading driving force in the northeastern regions, which indicates that all four regions need to put more effort into adjusting their IA. The EI and IS effects followed a similar trajectory, which suggests that they had a similar impact on the carbon emission changes in the four areas.
In 2002, the ES and IA effects performed best in Liaoning, with changes in carbon emissions of 73.16 and 65.66 Mt, respectively; thus, the ES and IA effects in Liaoning were higher than the regional average. Inner Mongolia was the best case for the ES effect in terms of decreasing carbon emissions, accounting for −104.33 Mt, which indicates that the emission change in Inner Mongolia was lower than the regional average. The EI effect in Inner Mongolia was the highest and had an effect on total emissions reaching 15.76 Mt, which reflects lower energy efficiency in that area, leading to higher carbon emissions than the regional average. In Jilin, the IS effect was stronger than in the other three northeastern regions, accounting for 1.97 Mt. In Heilongjiang, the IE effect was relatively high, reaching 27.70 Mt. However, the PS effect was uneven in terms of changing the carbon emissions in 2002 compared with the other years under study, and the PS effect played a role in increasing total emissions, accounting for 125.16 Mt in Liaoning.
In 2007, Inner Mongolia had the highest ES, EI, IS, and IA effects of the four regions, reaching 13.33, 14.47, 5.32, and 165.73 Mt, respectively. Inner Mongolia was the poorest performer in terms of the IE effect, accounting for −226.98 Mt and indicating an industry efficiency in decreasing the total CO2 emissions that was higher than the average. Liaoning was the second-highest performer of the five driving forces, at −28.45 Mt for ES, 10.47 Mt for EI, 3.07 Mt for IS, 44.78 Mt for EI, and −108.89 Mt for IA. These results show that all the driving forces had a significant impact. In 2012, the differences between regions in the EI, IS, EI, and IA effect factors were not conspicuous, as Figure 6 shows. We conclude that the ES effect played a crucial role in reducing carbon emissions for the four regions shown, reaching −224.19, −338.56, −446.14, and −70.53 Mt.
In 2017, the IA effect was a prominent driving force in emission change in Inner Mongolia, reaching 59.39 Mt, which indicates IE higher than the average. Although this effect was weakest in Liaoning (−80.93 Mt), unit investment per person nevertheless caused a decline of 80.93 Mt carbon emissions compared with the regional level. In 2017, the ES effect on emission change were similar to those in 2012, leading to emission reduction in the four regions (−181.18, −127.18, 207.15, and −70.98 Mt). The IS effect in Inner Mongolia shifted from being the best performer in 2012 to being the poorest in 2017, whereas in Heilongjiang it shifted in the opposite direction. As Figure 6 shows, the ES effect trajectory varied significantly across the period under study, indicating that the ES efficiency in the four regions varied over time.
Performance Ranking
Following the SDA, we investigated the regional performance and the potential evolution of carbon emissions by ranking the effects in the four regions in 2002, 2007, 2012, and 2017. Supplementary Table S1 gives the ranking of the five driving forces (the ES, EI, IS, EI, and IA effects) in the four areas, thereby showing the ranking of the potential changes of carbon emissions by effect factors. For example, the IE effect in Heilongjiang ranked highest in 2002, indicating a significant potential of emission mitigation induced by the IE effect compared with the other three regions. However, the EI effect in Heilongjiang ranked low, denoting only a small potential for emission changes. This finding can be explained in terms of a local preference for EI over energy conservation.
Inner Mongolia was ranked lowest in 2002 in terms of the ES effect but had moved to first place by 2007, which indicates that its ES had evolved and that local government needs to pay more attention to optimizing it. In 2007, Liaoning was the second-best performer for all five driving forces, which reflects the local government’s implementation at this time of a series of policies and measures to influence carbon emissions. All the driving forces had a significant effect.
Supplementary Table S1 shows that Jilin has immense potential to change its emissions in terms of the IE effect. The local government could decrease the total emissions by adjusting the investment structure to increase IE. Heilongjiang came last in terms of the EI effect, which implies that it has significant potential for changing its carbon emissions through management of EI. The analysis above is consistent with Ang et al. (2015), who noted that the top-ranked regions have enormous potential for energy conservation and emission mitigation if adequate measures are taken.
Conclusion and Policy Implications
Conclusion
The northeastern region in China has had a dominant impact on energy-related CO2 emissions at the national level in recent decades. We therefore used temporal and spatial LMDI models to examine the driving forces in the four northeastern regions from 2002 to 2017, carrying out a comprehensive and in-depth analysis of carbon emissions from the perspective of investment-related factors. The following main conclusions can be drawn.
Of the four regions, the main carbon emitters and consumers of energy were Inner Mongolia and Liaoning. Energy consumption in Inner Mongolia increased significantly from 19.84 to 69.58 Mtce over the study period (2002–2017). In line with this, CO2 emissions rose from 69.24 to 216.96 Mt, an increase of 213%. Although emissions in 2017 were higher than in the base year (2002), the most significant carbon emission levels (reaching 246.49 Mt in Liaoning) and the most significant energy consumption increase (from 39.06 to 90.34 Mtce) were found in 2011. CO2 emissions rose from 105.63 to 187.30 Mt, an increase of 77%, peaking in 2011 at 230.62 Mt. From our analysis of the share of the carbon emissions from different sectors in 2002–2017, we can conclude that industry was the main emitter. This confirms that industrialization is the critical factor in energy consumption and CO2 emissions, reflecting Northeast China’s role as an old industrial base that laid the foundations for the industrialization of the country as a whole. More surprisingly, we found that the trajectory of the evolution of investment was similar to the mitigation of carbon emissions, which indicates that investment is a major driving force in changing total emissions.
Our analysis shows that the leading causes of the mitigation in total emissions during the study period were ES and IE. In 2002–2017, the ES effect played a crucial role in changing carbon emissions by 91.18 Mt in Inner Mongolia. The IE effect was a major driving force in Liaoning, accounting for 503.53 Mt, and in Heilongjiang, accounting for 217.79 Mt. However, IA had a more extensive influence on Jilin’s changing emissions, accounting for 174.96 Mt of carbon emissions. The differences in the effect factors between the regions that our analysis reveals can help local governments to develop region-specific policies for changing carbon emissions. The investment-related effect and policy implications are clear from the decomposition results presented above.
Another key finding associated with the EI effect concerns its significant impact on decreasing the total emissions in all regions from 2007 to 2012 (reaching −65.58 Mt in Inner Mongolia, −107.79 Mt in Liaoning, −76.39 Mt in Jilin, and −27.63 Mt in Heilongjiang). The EI effect in Inner Mongolia was the most significant factor for emissions, with an impact reaching 15.76 Mt in the base year (2002). The results show lower energy efficiency in Inner Mongolia (which was second highest in terms of EI), leading to carbon emissions higher than the regional average in the final year (2017). The results above show that the degree of effect changed over time.
The detailed analysis of the industry sector shows a substantial carbon emission concentration. In the four regions, the absolute value of the IS effect increased over the period, indicating that the impact of IS on carbon emission mitigation increased significantly over time. The contribution of the IS effect on the cumulative carbon emissions decreased considerably in Inner Mongolia (−32.62 Mt), Liaoning (−35.97 Mt), and Heilongjiang (−46.12 Mt), which can mainly be attributed to the industry sector (as shown in Figure 2). However, the share of carbon emissions from the transportation sector increased in recent years, and there was some variation between sectors in terms of their share of the total.
Policy Implications
The four northeastern areas under study are among the country’s major carbon emitters, and they should decrease their carbon emissions to improve the national environment. The results of our analysis enable us to provide a number of practical suggestions for appropriate regional policies.
First, IS is a primary driving force of carbon emission change, which means that adjusting the IS will improve the coal-based energy consumption structure. Because the development of local industry is based mainly on coal consumption, as the energy consumption data show, local governments should establish various energy consumption structures to diversify resource implementation. Accordingly, new energy technology can be boosted by taking active steps to use the superior resources of the four northeastern provinces. For example, tidal energy is abundant in the gulf area in Liaoning, and Heilongjiang is rich in solar and water energy. It would be appropriate to make the most of these local advantages.
Second, to reduce total emissions, local governments should pay more attention to the EI effect. They should actively introduce foreign advanced management experience and specialize in the technology of energy conservation and emission reduction, especially in terms of clean coal mining technology, nuclear power technology, and pollution control technology. It is important to encourage the introduction of these technologies to shorten considerably the cycle of energy production and consumption and to improve energy utilization efficiency through the adoption of advanced technologies. More effort should also be put into researching the most advanced and untapped energy development technologies, such as photovoltaic power generation, hydrogen energy, fuel cells, and other new energy technologies with positive development prospects.
Third, as the factors of IE and IA play a dominant role in changing CO2 emissions, governments should increase investment into the technology of energy conservation and emission reduction. Investment growth in Northeast China accelerated significantly, thanks to a series of policies from national central government promoting coordinated development of regional economies, with investment in 2017 up 423.61% compared with 2002. We therefore suggest that the government should adjust the regional investment structure to generate more significant and orderly momentum for promoting collaborative regional economies. Social development should use the market mechanism to target environmental protection, increasing investment and energy efficiency improvements and decreasing interest rates for private environmentally friendly investments.
Finally, our results have implications for the formulation of policy. Local policies need to be updated regularly to keep pace with variations over time in the economic environment, population, and other factors. We recommend the development of low-carbon urban transportation, which is also a crucial measure for reducing carbon emissions. We also suggest a multilevel approach to the vigorous development of environmentally friendly transportation methods, as this will enhance investment in research into new-energy vehicles and will improve the infrastructure for public transportation.
This study has two main limitations that should be noted. First, it covers a small number of industrial cities in China over a relatively short period. Future studies should include a greater number of locations and a longer evaluation period. Second, we only give a macrolevel analysis for China’s regional carbon emissions and further analyze the emissions from every industrial source. Future studies could consider the distinction between the two.
Author Contributions
XW, Ideas, Conceptualization, Methodology, Writing—Original Draft, Data Curation, Visualization. LL, Software, Resources, Writing—Review and Editing, Project administration, Supervision FZ, Validation, Formal analysis, Investigation, Writing—Review and Editing, Visualization.
Conflict of Interest
The authors declare that the research was conducted in the absence of any commercial or financial relationships that could be construed as a potential conflict of interest.
Publisher’s Note
All claims expressed in this article are solely those of the authors and do not necessarily represent those of their affiliated organizations, or those of the publisher, the editors and the reviewers. Any product that may be evaluated in this article, or claim that may be made by its manufacturer, is not guaranteed or endorsed by the publisher.
Footnotes
1Source: International Energy Agency (IEA). See https://www.iea.org/topics/covid-19.
2Source: https://www.iea.org/reports/co2-emissions-from-fuel-combustion-overview.
3https://news.bjx.com.cn/html/20160929/777000.shtml.
4IPCC. IPCC guidelines for national greenhouse gas inventories. Japan: IPCC, 2006.
5http://www.stats.gov.cn/tjsj/pcsj/.
References
Ahmad, M., Li, H., Anser, M. K., Rehman, A., Fareed, Z., Yan, Q., et al. (2021). Are the Intensity of Energy Use, Land Agglomeration, CO2 Emissions, and Economic Progress Dynamically Interlinked across Development Levels. Energ. Environ. 32 (4), 690–721. doi:10.1177/0958305X20949471
Ahmad, M., Zhao, Z.-Y., Irfan, M., Mukeshimana, M. C., Rehman, A., Jabeen, G., et al. (2020). Modeling Heterogeneous Dynamic Interactions Among Energy Investment, SO2 Emissions and Economic Performance in Regional China. Environ. Sci. Pollut. Res. 27 (3), 2730–2744. doi:10.1007/s11356-019-07044-3
Akbostancı, E., Tunç, G. İ., and Türüt-Aşık, S. (2011). CO2 Emissions of Turkish Manufacturing Industry: A Decomposition Analysis. Appl. Energ. 88 (6), 2273–2278. doi:10.1016/j.apenergy.2010.12.076
Álvarez-Herránz, A., Balsalobre, D., Cantos, J. M., and Shahbaz, M. (2017). Energy Innovations-GHG Emissions Nexus: Fresh Empirical Evidence from OECD Countries. Energy Policy 101, 90–100. doi:10.1016/j.enpol.2016.11.030
Ang, B. W., Su, B., and Wang, H. (2016). A Spatial-Temporal Decomposition Approach to Performance Assessment in Energy and Emissions. Energ. Econ. 60, 112–121. doi:10.1016/j.eneco.2016.08.024
Ang, B. W. (2005). The LMDI Approach to Decomposition Analysis: a Practical Guide. Energy Policy 33 (7), 867–871. doi:10.1016/j.enpol.2003.10.010
Ang, B. W., Xu, X. Y., and Su, B. (2015). Multi-country Comparisons of Energy Performance: the index Decomposition Analysis Approach. Energ. Econ. 47, 68–76. doi:10.1016/j.eneco.2014.10.011
Baležentis, A., Baležentis, T., and Streimikiene, D. (2011). The Energy Intensity in Lithuania during 1995-2009: A LMDI Approach. Energy Policy 39, 7322–7334. doi:10.1016/j.enpol.2011.08.055
Budzianowski, W. M. (2012). Target for National Carbon Intensity of Energy by 2050: A Case Study of Poland's Energy System. Energy 46 (1), 575–581. doi:10.1016/j.energy.2012.07.051
Chen, C., Zhao, T., Yuan, R., and Kong, Y. (2019b). A Spatial-Temporal Decomposition Analysis of China's Carbon Intensity from the Economic Perspective. J. Clean. Prod. 215, 557–569. doi:10.1016/j.jclepro.2019.01.073
Chen, J., Xu, C., Cui, L., Huang, S., and Song, M. (2019a). Driving Factors of CO2 Emissions and Inequality Characteristics in China: A Combined Decomposition Approach. Energ. Econ. 78, 589–597. doi:10.1016/j.eneco.2018.12.011
Chishti, M. Z., Ahmad, M., Rehman, A., and Khan, M. K. (2021). Mitigations Pathways towards Sustainable Development: Assessing the Influence of Fiscal and Monetary Policies on Carbon Emissions in BRICS Economies. J. Clean. Prod. 292, 126035. doi:10.1016/j.jclepro.2021.126035
Chontanawat, J., Wiboonchutikula, P., and Buddhivanich, A. (2020). An LMDI Decomposition Analysis of Carbon Emissions in the Thai Manufacturing Sector. Energ. Rep. 6, 705–710. doi:10.1016/j.egyr.2019.09.053
Dai, Y., and Gao, H. O. (2016). Energy Consumption in China's Logistics Industry: A Decomposition Analysis Using the LMDI Approach. Transportation Res. D: Transport Environ. 46, 69–80. doi:10.1016/j.trd.2016.03.003
Dalton, M., O'Neill, B., Prskawetz, A., Jiang, L., and Pitkin, J. (2008). Population Aging and Future Carbon Emissions in the United States. Energ. Econ. 30, 642–675. doi:10.1016/j.eneco.2006.07.002
Diakoulaki, D., and Mandaraka, M. (2007). Decomposition Analysis for Assessing the Progress in Decoupling Industrial Growth from CO2 Emissions in the EU Manufacturing Sector. Energ. Econ. 29, 636–664. doi:10.1016/j.eneco.2007.01.005
Gu, C., and Gong, X. (2012). Factors Decomposition and Empirical Study of Energy Consumption Carbon Emission in Xinjiang from 1999 to 2009. Areal Res. Dev. 31, 140–144.
Hang, Y., Wang, Q., Zhou, D., and Zhang, L. (2019). Factors Influencing the Progress in Decoupling Economic Growth from Carbon Dioxide Emissions in China's Manufacturing Industry. Resour. Conservation Recycling 146, 77–88. doi:10.1016/j.resconrec.2019.03.034
Hussain, I., and Rehman, A. (2021). Exploring the Dynamic Interaction of CO2 Emission on Population Growth, Foreign Investment, and Renewable Energy by Employing ARDL Bounds Testing Approach. Environ. Sci. Pollut. Res. 28, 39387–39397. doi:10.1007/s11356-021-13502-8
Khan, M. K., Babar, S. F., Oryani, B., Dagar, V., Rehman, A., Zakari, A., et al. (2021). Role of Financial Development, Environmental-Related Technologies, Research and Development, Energy Intensity, Natural Resource Depletion, and Temperature in Sustainable Environment in Canada. Environ. Sci. Pollut. Res. doi:10.1007/s11356-021-15421-0
Kivyiro, P., and Arminen, H. (2014). Carbon Dioxide Emissions, Energy Consumption, Economic Growth, and Foreign Direct Investment: Causality Analysis for Sub-saharan Africa. Energy 74, 595–606. doi:10.1016/j.energy.2014.07.025
Lee, J. W. (2013). The Contribution of Foreign Direct Investment to Clean Energy Use, Carbon Emissions and Economic Growth. Energy Policy 55, 483–489. doi:10.1016/j.enpol.2012.12.039
Liang, W., Gan, T., and Zhang, W. (2019). Dynamic Evolution of Characteristics and Decomposition of Factors Influencing Industrial Carbon Dioxide Emissions in China: 1991-2015. Struct. Change Econ. Dyn. 49, 93–106. doi:10.1016/j.strueco.2018.09.009
Lin, B., and Du, K. (2014). Decomposing Energy Intensity Change: A Combination of Index Decomposition Analysis and Production-Theoretical Decomposition Analysis. Appl. Energ. 129, 158–165. doi:10.1016/j.apenergy.2014.04.101
Liu, X., Duan, Z., Shan, Y., Duan, H., Wang, S., Song, J., et al. (2019). Low-carbon Developments in Northeast China: Evidence from Cities. Appl. Energ. 236, 1019–1033. doi:10.1016/j.apenergy.2018.12.060
Meng, Z., Wang, H., and Wang, B. (2018). Empirical Analysis of Carbon Emission Accounting and Influencing Factors of Energy Consumption in China. Ijerph 15, 2467–2475. doi:10.3390/ijerph15112467
Mo, J.-L., Agnolucci, P., Jiang, M.-R., and Fan, Y. (2016). The Impact of Chinese Carbon Emission Trading Scheme (ETS) on Low Carbon Energy (LCE) Investment. Energy Policy 89, 271–283. doi:10.1016/j.enpol.2015.12.002
Murshed, M., Ahmed, Z., Alam, M. S., MahmoodRehman, H. A., Rehman, A., and Dagar, V. (2021). Reinvigorating the Role of Clean Energy Transition for Achieving a Low-Carbon Economy: Evidence from Bangladesh. Environ. Sci. Pollut. Res. doi:10.1007/s11356-021-15352-w
Rehman, A., Ma, H., Ahmad, M., Irfan, M., Traore, O., and Chandio, A. A. (2021a). Towards Environmental Sustainability: Devolving the Influence of Carbon Dioxide Emission to Population Growth, Climate Change, Forestry, Livestock and Crops Production in Pakistan. Ecol. Indicators 125, 107460. doi:10.1016/j.ecolind.2021.107460
Rehman, A., Ma, H., Chishti, M. Z., Ozturk, I., Irfan, M., and Ahmad, M. (2021b). Asymmetric Investigation to Track the Effect of Urbanization, Energy Utilization, Fossil Fuel Energy and CO2 Emission on Economic Efficiency in China: Another Outlook. Environ. Sci. Pollut. Res. 28 (14), 17319–17330. doi:10.1007/s11356-020-12186-w
Rehman, A., Ma, H., and Ozturk, I. (2020). Decoupling the Climatic and Carbon Dioxide Emission Influence to Maize Crop Production in Pakistan. Air Qual. Atmos. Health 13 (6), 695–707. doi:10.1007/s11869-020-00825-7
Rehman, A., Ma, H., and Ozturk, I. (2021c). Do Industrialization, Energy Importations, and Economic Progress Influence Carbon Emission in Pakistan. Environ. Sci. Pollut. Res. 28, 45840–45852. doi:10.1007/s11356-021-13916-4
Sbia, R., Shahbaz, M., and Hamdi, H. (2014). A Contribution of Foreign Direct Investment, Clean Energy, Trade Openness, Carbon Emissions and Economic Growth to Energy Demand in UAE. Econ. Model. 36, 191–197. doi:10.1016/j.econmod.2013.09.047
Shan, Y., Guan, D., Zheng, H., Ou, J., Li, Y., Meng, J., et al. (2018). China CO2 Emission Accounts 1997-2015. Sci. Data 5, 170–201. doi:10.1038/sdata.2017.201
Shi, Y., Han, B., Zafar, M. W., and Wei, Z. (2019). Uncovering the Driving Forces of Carbon Dioxide Emissions in Chinese Manufacturing Industry: An Intersectoral Analysis. Environ. Sci. Pollut. Res. 26, 31434–31448. doi:10.1007/s11356-019-06303-7
Sun, H., Edziah, B. K., Kporsu, A. K., SarkodieS, S. A., and Taghizadeh-Hesary, F. (2021b). Energy Efficiency: the Role of Technological Innovation and Knowledge Spillover. Technol. Forecast. Soc. Change 167. doi:10.1016/j.techfore.2021.120659
Sun, H., Edziah, B. K., Sun, C., and Kporsu, A. K. (2021a). Institutional Quality and its Spatial Spillover Effects on Energy Efficiency. Socio-Economic Plann. Sci., 101023. doi:10.1016/j.seps.2021.101023
Sun, Y., Zou, X., Shi, X., and Zhang, P. (2019). The Economic Impact of Climate Risks in China: Evidence from 47-sector Panel Data, 2000-2014. Nat. Hazards 95, 289–308. doi:10.1007/s11069-018-3447-0
Wang, Q., and Su, M. (2020). Drivers of Decoupling Economic Growth from Carbon Emission - an Empirical Analysis of 192 Countries Using Decoupling Model and Decomposition Method. Environ. Impact Assess. Rev. 81, 106356–356. doi:10.1016/j.eiar.2019.106356
Wang, Q., and Wang, S. (2020). Preventing Carbon Emission Retaliatory Rebound post-COVID-19 Requires Expanding Free Trade and Improving Energy Efficiency. Sci. Total Environ. 746, 141158. doi:10.1016/j.scitotenv.2020.141158
Wang, Z., and Yang, L. (2015). Delinking Indicators on Regional Industry Development and Carbon Emissions: Beijing-Tianjin-Hebei Economic Band Case. Ecol. indicators 48, 41–48. doi:10.1016/j.ecolind.2014.07.035
Wei, Y., Zhu, X., Li, Y., Yao, T., and Tao, Y. (2019). Influential Factors of National and Regional CO2 Emission in China Based on Combined Model of DPSIR and PLS-SEM. J. Clean. Prod. 212, 698–712. doi:10.1016/j.jclepro.2018.11.155
Weimin, Z., Chishti, M. Z., Rehman, A., and Ahmad, M. (2021). A Pathway toward Future Sustainability: Assessing the Influence of Innovation Shocks on CO2 Emissions in Developing Economies. Environ. Dev. Sustain. doi:10.1007/s10668-021-01634-3
Xu, B., Xu, L., Xu, R., and Luo, L. (2017). Geographical Analysis of CO2 Emissions in China's Manufacturing Industry: A Geographically Weighted Regression Model. J. Clean. Prod. 166, 628–640. doi:10.1016/j.jclepro.2017.08.052
Yang, L., and Lin, B. (2016). Carbon Dioxide-Emission in China׳s Power Industry: Evidence and Policy Implications. Renew. Sustain. Energ. Rev. 60, 258–267. doi:10.1016/j.rser.2016.01.058
Yasmeen, H., Wang, Y., Zameer, H., and Solangi, Y. A. (2020). Decomposing Factors Affecting CO2 Emissions in Pakistan: Insights from LMDI Decomposition Approach. Environ. Sci. Pollut. Res. 27, 3113–3123. doi:10.1007/s11356-019-07187-3
Zeqiong, X., Xuenong, G., Wenhui, Y., Jundong, F., and Zongbin, J. (2020). Decomposition and Prediction of Direct Residential Carbon Emission Indicators in Guangdong Province of China. Ecol. Indicators 115, 106344–106357. doi:10.1016/j.ecolind.2020.106344
Zhang, Y.-J., and Da, Y.-B. (2015). The Decomposition of Energy-Related Carbon Emission and its Decoupling with Economic Growth in China. Renew. Sustain. Energ. Rev. 41, 1255–1266. doi:10.1016/j.rser.2014.09.021
Zhang, Y.-J., Sun, Y.-F., and Huang, J. (2018). Energy Efficiency, Carbon Emission Performance, and Technology Gaps: Evidence from CDM Project Investment. Energy Policy 115, 119–130. doi:10.1016/j.enpol.2017.12.056
Zhang, Y., and Fang, G. (2013). Research on Spatial-Temporal Characteristics and Affecting Factors Decomposition of Agricultural Carbon Emission in Suzhou City, Anhui Province, China. Amm 291-294, 1385–1388. doi:10.4028/www.scientific.net/amm.291-294.1385
Zhao, R., Huang, X., Liu, Y., Zhong, T., Ding, M., and Chuai, X. (2015). Carbon Emission of Regional Land Use and its Decomposition Analysis: Case Study of Nanjing City, China. Chin. Geogr. Sci. 25, 198–212. doi:10.1007/s11769-014-0714-1
Keywords: temporal LMDI, spatial LMDI, CO2 emissions, Northeast China, investment factors
Citation: Wang X, Li L and Zhao F (2021) Decomposition Analysis of CO2 Emissions in Northeast China: Insights From Investment Factors. Front. Energy Res. 9:777290. doi: 10.3389/fenrg.2021.777290
Received: 15 September 2021; Accepted: 19 November 2021;
Published: 23 December 2021.
Edited by:
Lazaric Nathalie, UMR7321 Groupe de Recherche en Droit, Economie et Gestion (GREDEG), FranceReviewed by:
Abdul Rehman, Henan Agricultural University, ChinaHuaping Sun, Jiangsu University, China
Copyright © 2021 Wang, Li and Zhao. This is an open-access article distributed under the terms of the Creative Commons Attribution License (CC BY). The use, distribution or reproduction in other forums is permitted, provided the original author(s) and the copyright owner(s) are credited and that the original publication in this journal is cited, in accordance with accepted academic practice. No use, distribution or reproduction is permitted which does not comply with these terms.
*Correspondence: Lu Li, MTg2MzIxNjIzMjJAMTYzLmNvbQ==; Fusen Zhao, emhhb2ZzMzMxMUAxNjMuY29t