 Shiyu Ji1
 Huaizhi Yang
- 1Huadong Engineering Corporation Limited, Power China, Hangzhou, China
- 2College of Electrical and Information Engineering, Hunan University, Changsha, China
To deal with the uncertainties of wind power and load residing in the power supply reliability model, an interval reliability evaluation method is proposed by combining the wind power generation and energy storage system (ESS). Firstly, the interval power supply reliability evaluation model, which belongs to an interval mixed integer program (IMIP), is established based on the interval variables. Secondly, the IMIP model is transformed into the deterministic optimization model under two extreme circumstances by utilizing the possibility degree theory of interval numbers. The maximum power supply probability, considering the wind power interval to meet the load demand interval, is sought by optimizing outputs of the ESS and generators, i.e., the upper boundary of the load shedding is the smallest. Finally, the states of wind turbines and generators are generated based on sequential Monte Carlo simulation, and the reliability of the hybrid energy generation system is evaluated by calculating the loss of load expectation, expected energy not supplied, and maximum power supply probability, which provides a basis for establishing interval optimal allocation model of energy storage. IEEE RTS-24 test system is utilized to verify the performance of the proposed method, and the model is solved by the CPLEX 12.7 solver. The simulation results demonstrate the effectiveness and applicability of the proposed method.
Introduction
With the increasing penetration rate of wind power generations, the power supply reliability is affected by wind farms connected to the grid. Meanwhile, reliability evaluation is also affected by load uncertainties (Kumar et al., 2020). As an important resource to deal with the wind and load uncertainties, the energy storage system (ESS) shows good performance in handling the randomness and volatility. Therefore, the reliability evaluation of a hybrid energy generation system should consider the calming effect of the ESS and uncertainties of wind power and load. The process of reliability evaluation in this article includes uncertainty modeling and reliability analysis considering ESS.
Commonly used methods for modeling uncertainties of wind power and load can be divided into probability density method and time series method. By introducing the equivalent capacity ratio, the probability density function describing the expected value of wind power output and the wind speed can be obtained by normal distribution (Xie and Billinton, 2011). Wind speed can also be expressed in time series, and it can be obtained by the Autoregressive–Moving Average (ARMA) method (Billinton and Wangdee, 2007). The wind power output time series can be obtained by the Copula function (Li et al., 2013). A hierarchical coordinated control strategy is developed to suppress fluctuations caused by the uncertainties of wind and solar outputs based on the model predictive control (MPC) framework (Zhang et al., 2021). A droop-based hierarchical wind farm optimal voltage control scheme based on MPC and the alternating direction method is proposed to reduce the voltage deviation (Huang et al., 2021). Taking into account the randomness of wind speed, a power supply reliability evaluation model based on sequential Monte Carlo simulation (SMCS) can be established (Wu and Ding, 2004). Considering the uncertainties of wind power and load, a reliability evaluation method of the power distribution network combining the probability distribution of distributed generation and load power is proposed (Wang et al., 2015). In the above method, the time series in the probability density function model is not considered and cannot effectively simulate the actual operation state of the system. Therefore, the time series model can have a better effect in SMCS.
At present, there are a lot of researches on the reliability evaluation considering ESS and wind power. The expected energy not supplied (EENS) and loss of load probability are utilized as reliability evaluation indices to investigate the influence of the rated capacity and rated power of the energy storage device on the power system (Kumar et al., 2020). In terms of the solution method, a reliability model based on the operating characteristics of the ESS and failure shutdown is proposed, and the SMCS is used to give a specific evaluation process (Parvini et al., 2018); The analytical method and Monte Carlo method are utilized at the same time for analysis (Bhuiyan and Yazdani, 2010), and the reliability evaluation method of wind power and ESS considering the failure of the generators is proposed. In order to coordinate the ESS, wind power generation, and power grid, an optimal operation strategy based on model prediction is proposed (Xu and Singh, 2012). The SMCS method considers the time series of the simulation and has applicability in the issue of reliability evaluation. Accordingly, the following work is discussed in this article.
In the following context, the hybrid energy generation system model considering ESS is presented in the Hybrid Energy Generation System Model Considering Energy Storage System section, followed by the interval reliability evaluation model in the Reliability Optimization Model of Power Supply Based on Interval Variables section, and according to the possibility degree theory of interval numbers, the interval mixed integer program (IMIP) model is transformed into the deterministic model in the Solution of the Power Supply Reliability Evaluation Model section. The simulation results of the proposed method are presented in the Simulation Results section. Conclusions and contributions of this article are given in the Conclusion section.
Hybrid Energy Generation System Model Considering Energy Storage System
The hybrid energy generation system model constructed in this article is shown in Figure 1. The transmission lines are assumed to be reliable; therefore, the safe and reliable operation of the system depends on whether all the power supplies can meet the load demand.
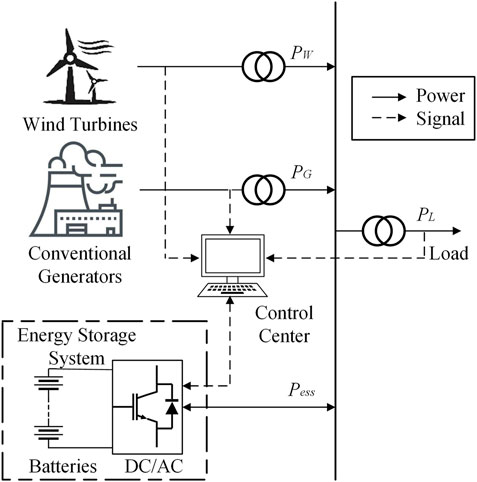
FIGURE 1. Hybrid energy generation system model considering ESS.
Conventional Generator Model
The conventional generator is a repairable component and has two main states: normal and outage. The two-state Markov model describes the state transfer between normal and outage of a repairable component by utilizing the failure rate
where,
where,
Wind Turbine Model
Based on the principle of aerodynamics, the output power of a wind turbine can be described as (Salgado Duarte et al., 2020):
where,
There are three states in the wind turbine operation including normal, outage, and derating. Due to the short duration of the derating state, this article only considers the state transfer between the normal and outage to further simplify the model (Ying et al., 2019).
Similarly, the wind turbine state and the output power can be obtained by Eq 1, 4, and Eq. 5, 6, respectively. Then, the output power of the entire wind farm can be calculated by the sum of all wind turbine outputs as follows:
where,
Energy Storage System Model and Operation Strategy
ESS has the bidirectional working characteristic. Therefore, ESS is regarded as a specific load or power supply, and
Reliability Optimization Model of Power Supply Based on Interval Variables
According to the generator models introduced above, we take the optimal load shedding interval as the objective function to establish the reliability optimization model of power supply based on interval variables. The objective function is defined as:
where,
The constraints in this case are given by:
Equation (9) is the constraint of power balance, where
Equations (11) and (12) limit the output power of the wind farm and conventional generators, where
Equation (14) ensures that ESS cannot be charged and discharged at the same time, where
Equation (15) is the state of charge (SOC) constraint of ESS, where
Solution of the Power Supply Reliability Evaluation Model
To solve the IMIP model, the possibility degree theory of interval numbers is used. The interval number can be described as
If
Since the interval number is a closed set composed of ordered real number pairs, the comparison of two interval numbers cannot take a single value according to the method of real numbers. Two comparison methods of interval numbers are applied: one is using the partial order relation of interval numbers, which can be used to qualitatively judge the priority of two intervals, and the other is utilizing the possibility degree of interval numbers (Kundu, 1997; Zhang et al., 1999), which can quantitatively analyze the specific degree of priority of one interval to another. Considering the accuracy of the analysis, the latter method is used in this article.
According to all possible relationships between
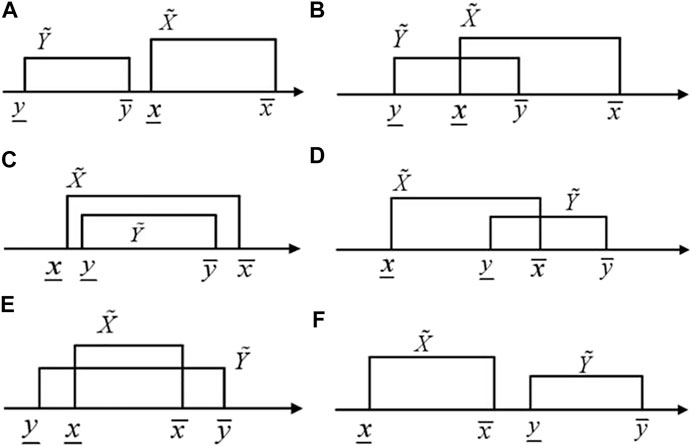
FIGURE 2. Types of position situation of interval numbers.
When using interval numbers to describe the uncertainty problem, the general form of the interval number optimization model can be expressed as:
where,
When using the interval theory to solve optimization problems, the uncertain mathematical model is usually converted into a deterministic model. For the minimum problem of interval optimization in Eq. (22), the possibility degree of interval numbers can be used to transform the model into a deterministic model:
where,
Similarly, we transform the aforementioned interval reliability model into a deterministic probability optimization model. The
Taking the performance interval
The maximum power supply probability
The detailed process of the reliability evaluation, considering the wind farm and ESS based on interval variables, is given in Figure 3.
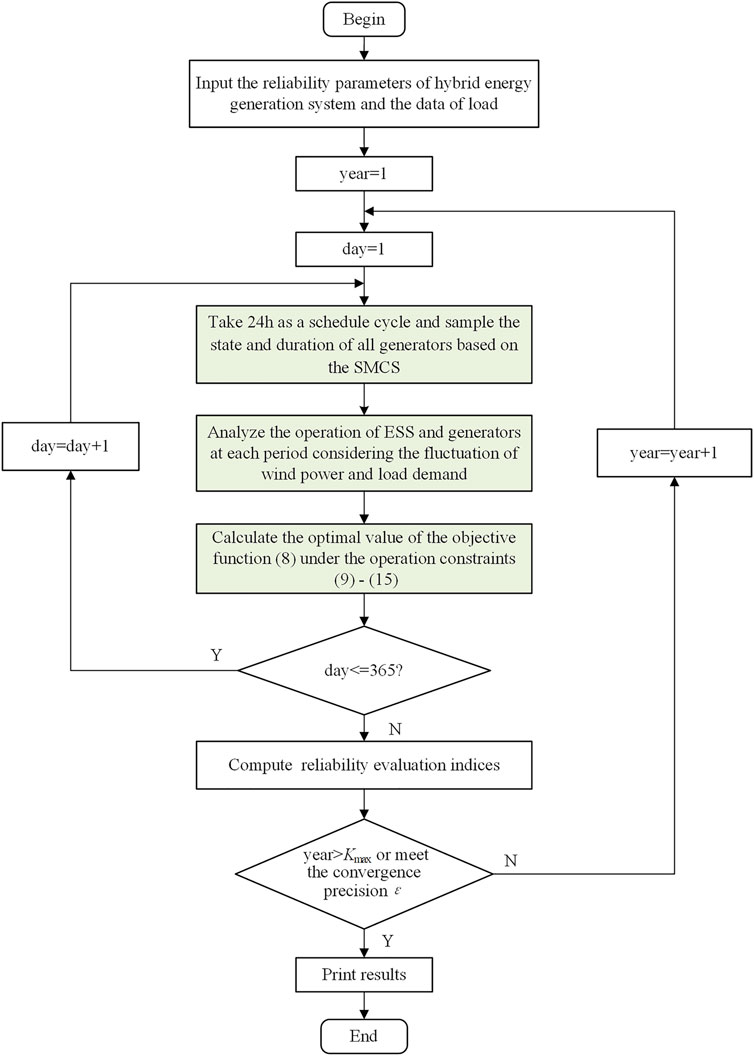
FIGURE 3. Process of reliability evaluation considering wind farm and ESS based on interval variables.
Simulation Results
To verify the reliability evaluation method, the modified IEEE RTS-24 system is tested and analyzed. This system (3405 MW) contains 32 conventional generators and 37 transmission lines. Two 150 MW wind farms are added to this system, and the capacity of a wind turbine is 1.5 MW. The forced outage rate is set as
Analysis of Energy Storage System on System Reliability
In order to significantly and appreciably analyze the impact of the ESS on the power supply reliability, an evaluation indicator is defined as:
where,
Here, two cases are employed to analyze the ESS on power supply reliability. The tolerances are assumed to be ± 10% and ± 5% in the wind power and load demand, respectively.
Case 1: the ESS is not taken into consideration.
Case 2: the ESS (200 MWh) is connected to the system.
The effect of the ESS on the power supply reliability is listed in Table 1.

TABLE 1. The effect of ESS on the power supply reliability.
From Table 1,
In order to analyze the influence of the rated capacity of the ESS on the power supply reliability, the rated capacity of the ESS is set from 200 MWh to 450 MWh in steps of 50 MWh. Tolerances of ±8% and ±10% are, respectively, assumed in wind power and load demand. The results changing with the rated capacity of the ESS are listed in Table 2.
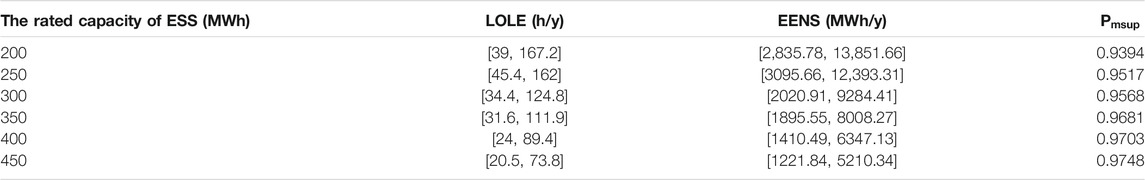
TABLE 2. Power supply reliability index under different rated capacity of ESS.
From Table 2, the upper and lower bounds of the LOLE and EENS gradually decrease, when the capacity of ESS connected to the system increases. As to the power supply side, the
Analysis of the Wind Power Uncertainty on System Reliability
In order to analyze the effect of the uncertainty of wind power on power supply reliability, two cases are tested:
Case 3: the uncertainty of wind power is ignored, and the outputs of wind turbines are forecast scenarios.
Case 4: considering the uncertainty of wind power, the change in output over time is listed in Table 3.
The rated capacity of the ESS in cases 3 and 4 are both 200 MWh, and a tolerance of 12% on the load demand is assumed in case 4. The power supply reliability indices considering the influence of the uncertainty of wind power are listed in Table 4.

TABLE 3. Wind power output ranges.

TABLE 4. Results of case 3 and case 4.
To analyze the power supply reliability evaluation results, a typical day in summer is selected to simulate, and uncertainties of wind power output and load are considered. The fluctuation curves of load and wind power in the typical summer day are shown in Figure 4A.
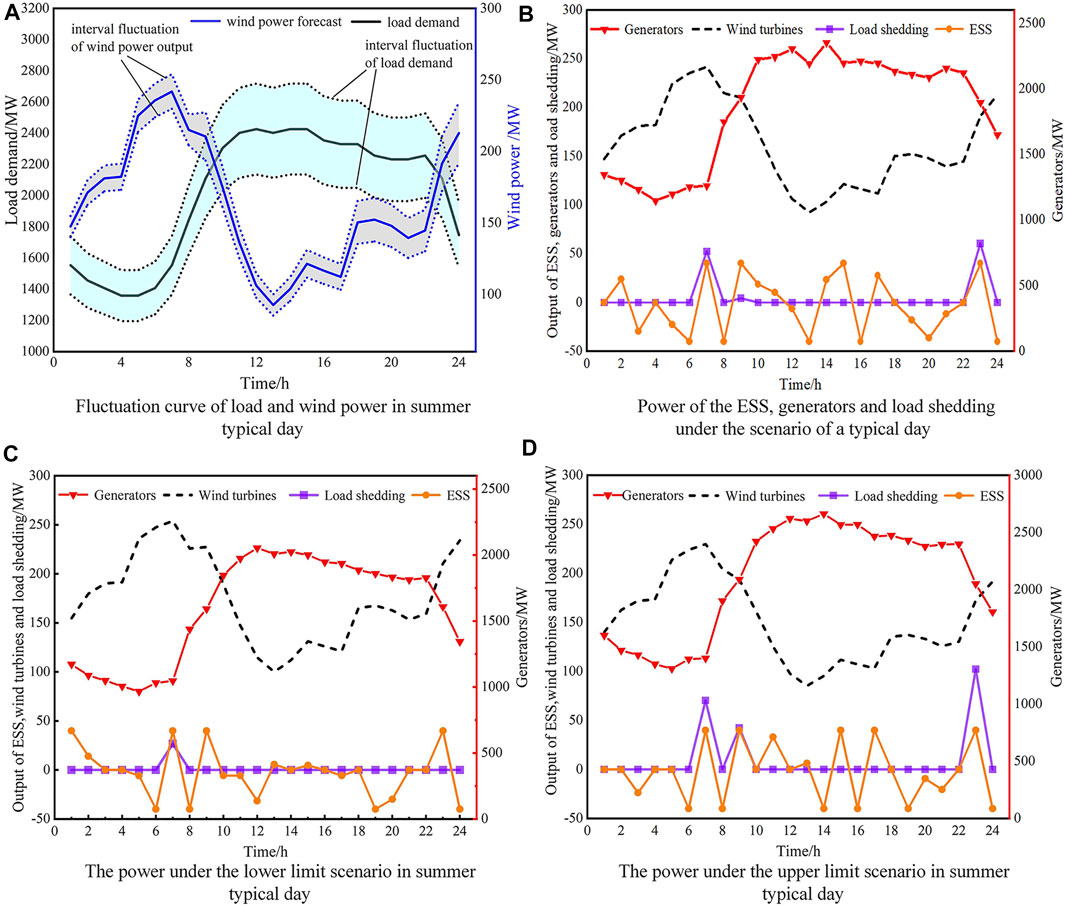
FIGURE 4. Simulation results.
The power of the ESS, generators, and load shedding under the scenario of a typical day are shown in Figure 4B. Here, a high-level fault occurred in the generators during this typical day. The output power in the prediction scenario is presented in Table 5.

TABLE 5. The output in the prediction scenario.
The power of the ESS, generators, and the load shedding in the typical day, considering the uncertainty of wind power and load, are shown in Figure 4C and Figure 4D. The results of scheduling optimization in the load demand limit scenario are listed in Table 6. It can be obtained

TABLE 6. The output in the load demand limit scenario.
Comparing Figure 4B, Figure 4C, and Figure 4D, it is observed that the output power is the least in the predicted scenario, followed by the lower and the upper limits scenario of the load demand. In the lower limit scenario, the output of the ESS is at a low operating level, and the load shedding is relatively small. However, in the upper limit scenario, in order to meet the load demand, the outputs of the ESS and the generators increase, and the generator operation level is the highest.
Conclusion
This article proposes a method for evaluating the reliability of a hybrid energy generation system considering the uncertainties of wind power and load. The states of conventional generators and wind turbines are obtained by using SMCS, and the ESS is considered to participate in the optimized operation of the system dispatching in the interval reliability evaluation. In order to find the maximum power supply probability, the possibility degree theory of interval numbers is adopted, and the IMIP model is transformed into a deterministic probability model under two extreme scenarios, then interval reliability indices are calculated. Moreover, the interval reliability contribution is utilized to express the influence degree of the access of the ESS on the interval reliability of the system. An IEEE RTS-24 test system is utilized to validate that the uncertainty of wind power effects on the power supply reliability, but the ESS improves the power supply reliability in the system. The simulation results verify the effectiveness and applicability of the proposed method.
Data Availability Statement
Publicly available data sets were analyzed in this study. These data can be found here: https://ieeexplore.ieee.org/document/4113721.
Author Contributions
SJ: project administration, supervision, and editing; YS: project administration, supervision, and editing; LG: methodology, designing computer programs, and data curation; HY: writing—original draft and visualization; WJ: writing—original draft; YL: writing—original draft; WC: writing—review and editing.
Funding
This work is supported by National Natural Science Foundation of China (Grant No. 52007056) and Natural Science Foundation of Hunan Province, China (Grant No. 2020JJ5077).
Conflict of Interest
Authors SJ and YS are employed by Huadong Engineering Corporation Limited.
The remaining authors declare that the research was conducted in the absence of any commercial or financial relationships that could be construed as a potential conflict of interest.
Publisher’s Note
All claims expressed in this article are solely those of the authors and do not necessarily represent those of their affiliated organizations, or those of the publisher, the editors, and the reviewers. Any product that may be evaluated in this article, or claim that may be made by its manufacturer, is not guaranteed or endorsed by the publisher.
References
Bhuiyan, F. A., and Yazdani, A. (2010). Reliability Assessment of a Wind-Power System with Integrated Energy Storage. IET Renew. Power Gener. 4 (3), 211–220. doi:10.1049/iet-rpg.2009.0070
Billinton, R., and Wangdee, W. (2007). Reliability-based Transmission Reinforcement Planning Associated with Large-Scale Wind Farms. IEEE Trans. Power Syst. 22 (1), 34–41. doi:10.1109/tpwrs.2006.889126
Ghofrani, M., Arabali, A., Etezadi-Amoli, M., and Fadali, M. S. (2014). Smart Scheduling and Cost-Benefit Analysis of Grid-Enabled Electric Vehicles for Wind Power Integration. IEEE Trans. Smart Grid 5 (5), 2306–2313. doi:10.1109/tsg.2014.2328976
Huang, S., Wu, Q., Liao, W., Wu, G., Li, X., and Wei, J. (2021). Adaptive Droop-Based Hierarchical Optimal Voltage Control Scheme for VSC-HVDC Connected Offshore Wind Farm. IEEE Trans. Ind. Inf. 17, 8165–8176. doi:10.1109/TII.2021.3065375
Kumar, S., Saket, R. K., Dheer, D. K., Holm‐Nielsen, J. B., and Sanjeevikumar, P. (2020). Reliability Enhancement of Electrical Power System Including Impacts of Renewable Energy Sources: a Comprehensive Review. IET Generation, Transm. Distribution 14 (10), 1799–1815. doi:10.1049/iet-gtd.2019.1402
Kundu, S. (1997). Min-transitivity of Fuzzy Leftness Relationship and its Application to Decision Making. Fuzzy Sets Syst. 86 (3), 357–367. doi:10.1016/s0165-0114(96)00122-4
Li, Y. D., Xie, K. G., and Hu, B. (2013). A Copula Function-Based Dependent Model for Multivariate Wind Speed Time Series and its Application in Reliability Assessment. Power Syst. Techn. 37 (3), 840–846. doi:10.13335/j.1000-3673.pst.2013.03.001
Parvini, Z., Abbaspour, A., Fotuhi-Firuzabad, M., and Moeini-Aghtaie, M. (2018). Operational Reliability Studies of Power Systems in the Presence of Energy Storage Systems. IEEE Trans. Power Syst. 33 (4), 3691–3700. doi:10.1109/tpwrs.2017.2771521
Salgado Duarte, Y., Szpytko, J., and del Castillo Serpa, A. M. (2020). Monte Carlo Simulation Model to Coordinate the Preventive Maintenance Scheduling of Generating Units in Isolated Distributed Power Systems. Electric Power Syst. Res. 182, 106237. doi:10.1016/j.epsr.2020.106237
Wang, C. Z., Wang, L. J., Wang, G., Zhang, Y., and Ding, M. S. (2015). Impact of Distributed Generation Output and Load Correlation on Distribution Network Reliability. Electric Power Automation Equipment 35 (6), 99–105. doi:10.16081/j.issn.1006-6047.2015.06.015
Wu, Y. C., and Ding, M. (2004). Reliability Assessment of Wind Power Generation System Based on Monte-Carlo Simulation. Electric Power Automation Equipment 24 (12), 70–73. doi:10.3969/j.issn.1006-6047.2004.12.021
Xie, K., and Billinton, R. (2011). Energy and Reliability Benefits of Wind Energy Conversion Systems. Renew. Energ. 36 (7), 1983–1988. doi:10.1016/j.renene.2010.12.011
Xu, Y., and Singh, C. (2012). Adequacy and Economy Analysis of Distribution Systems Integrated with Electric Energy Storage and Renewable Energy Resources. IEEE Trans. Power Syst. 27 (4), 2332–2341. doi:10.1109/tpwrs.2012.2186830
Ying, F. X., Jiang, Y. B., He, M., Tian, H., Jia, J., Yang, J., et al. (2019). Progress and prospect of Reliability Assessment of Power System with Wind Farm and Energy Storage System. Smart Power 47 (2), 1–8. doi:10.3969/j.issn.1673-7598.2019.02.001
Zhang, K., Zhou, B., Or, S. W., Li, C., Chung, C. Y., and Voropai, N. I. (2021). Optimal Coordinated Control of Multi-Renewable-To-Hydrogen Production System for Hydrogen Fueling Stations. IEEE Trans. Ind. Applicat. 57, 1–11. doi:10.1109/tia.2021.3093841
Keywords: hybrid energy system, interval optimization, reliability evaluation, energy storage system, sequential Monte Carlo simulation
Citation: Ji S, Sun Y, Gao L, Yang H, Jia W, Luo Y and Chen W (2021) Interval Reliability Evaluation of a Hybrid Energy Generation System With Energy Storage. Front. Energy Res. 9:792525. doi: 10.3389/fenrg.2021.792525
Received: 10 October 2021; Accepted: 02 November 2021;
Published: 25 November 2021.
Edited by:
Jian Zhao, Shanghai University of Electric Power, ChinaReviewed by:
Bo Yang, Kunming University of Science and Technology, ChinaGuibin Wang, Shenzhen University, China
Weike Mo, Jinan University, China
Copyright © 2021 Ji, Sun, Gao, Yang, Jia, Luo and Chen. This is an open-access article distributed under the terms of the Creative Commons Attribution License (CC BY). The use, distribution or reproduction in other forums is permitted, provided the original author(s) and the copyright owner(s) are credited and that the original publication in this journal is cited, in accordance with accepted academic practice. No use, distribution or reproduction is permitted which does not comply with these terms.
*Correspondence: Huaizhi Yang, eWFuZ2h6QGhudS5lZHUuY24=