 Rui Wang
 Xiaoyi Xia1
- 1School of Communication and Information Engineering, Shanghai University, Shanghai, China
- 2College of Electronics and Information Engineering, Shenzhen University, Shenzhen, China
Electric load forecasting is a prominent topic in energy research. Support vector regression (SVR) has extensively and successfully achieved good performance in electric load forecasting. Clifford support vector regression (CSVR) realizes multiple outputs by the Clifford geometric algebra which can be used in multistep forecasting of electric load. However, the effect of input is different from the forecasting value. Since the load forecasting value affects the energy reserve and distribution in the energy system, the accuracy is important in electric load forecasting. In this study, a fuzzy support vector machine is proposed based on geometric algebra named Clifford fuzzy support vector machine for regression (CFSVR). Through fuzzy membership, different input points have different contributions to deciding the optimal regression hyperplane. We evaluate the performance of the proposed CFSVR in fitting tasks on numerical simulation, UCI data set and signal data set, and forecasting tasks on electric load data set and NN3 data set. The result of the experiment indicates that Clifford fuzzy support vector machine for regression has better performance than CSVR and SVR of other algorithms which can improve the accuracy of electric load forecasting and achieve multistep forecasting.
1 Introduction
Electric load forecasting is used to forecast the value of electric load in the future, which plays an important role in electric system operation. Support vector machines (SVMs) (Hong et al., 2013), auto-regressive moving average, neural networks (Kelo and Dudul, 2012; Gao et al., 2021), etc. are the common methods of electric load forecasting. Compared with other methods, the support vector machine (SVM) is a powerful tool that is widely used in function approximation and prediction. The SVM is first proposed by Vapnik in 1990 (Vapnik, 2013), which is widely used for classification and regression. The theory of the SVM is based on the idea of structural risk minimization (SRM), that is, for classification problems, the SVM finds the optimal hyperplane which can separate different classes of training points. Similar to classification, the support vector machine for regression (SVR) is also based on the idea of SRM which represents that the SVR fits a regression function over a set of training points at the most ϵ-deviation from the actually obtained targets. The regression can be regarded as a convex programming task which aims at solving a quadratic minimization problem (Cortes, 1995).
In the past research, the SVR has a good performance in electric load forecasting based on both large and small samples (Hong, 2009). A multi-output SVR can improve operating efficiency in the case of multistep sequence forecasting (Fan et al., 2016), as well as data analysis (Shi et al., 2006) and anomaly detection (Zhang et al., 2019). The SVR cannot take straightforward to multi-output, although it has been widely used in data analysis and forecasting. A naive way is to use SVR for several times, but it needs expensive cost. Fortunately, the Clifford support vector machine (CSVM) (Bayro-Corrochano and Arana-Daniel, 2005; Bayro-Corrochano and Arana-Daniel, 2010), developed by E. Bayro-Corrochano, is a generalization of real- and complex-valued support vector machines. It realizes multi-output by using Clifford geometric algebra which enhances the capability of the SVR.
Although previous research has clarified the ability of CSVR in the application of multi-case interpolation (Bayro-Corrochano and Arana-Daniel, 2010), the accuracy of CSVR can be improved in fitting and forecasting. Accuracy is an important issue of the electric load forecasting because the forecasting value affects the energy reserve and distribution (Bunn, 2000). The input points may be affected by noise and outliers which make the points abnormal. In this case, the result of the regression will deviate from the optimal hyperplane by CSVR and SVR of the classical algorithm. In addition, multistep forecasting is a prominent research in many fields including electric load forecasting (Huang et al., 2021; Ma et al., 2021). For CSVR, the weights of all points are the same. Actually, the value of different points has different effects on the predicted value. The value of the points which are closer to the predicted point has more relation to the predicted value.
To solve this problem, fuzzy membership can be set to give different weights to each training point which means different training points have different contributions to the regression function. The bigger the membership is, the greater the weight makes decision on the regression surface. Through setting appropriate fuzzy membership, the effect of noise and outliers can be reduced. In addition, for forecasting, the points closer to the predicted point have more contribution to the predicted value.
The contribution of this study is to apply fuzzy membership to CSVR and reformulate it into the Clifford fuzzy support vector machine for regression (CFSVR). Then the proposed CFSVR is applied in solving the fitting and sequence forecasting. In a fitting situation, the fuzzy membership reduces the effect of outliers and noise, while in a forecasting situation, the fuzzy membership enables different points in sequence to have different contributions to the predicted value. Finally, the experiments on simulation, UCI data set, and antenna signal data set show that the proposed CFSVR has better performance than CSVR. In addition, the experiments on electric load data set and NN3 data set for forecasting demonstrate that the proposed CFSVR effectively improves the accuracy of CSVR and SVR of other algorithms.
The rest of this article is organized as follows. Related work is reviewed in Section 2. Geometric algebra and CSVR are introduced in Section 3. The proposed CFSVR is described in Section 4. The experiment is presented in Section 5. The conclusion is given in Section 6.
2 Related Work
In the past, the multi-output support vector machine was mainly realized by using single-output SVR several times. A multi-output support vector machine was proposed in 2002 by Fernando and Gustavo which uses a hypersphere to represent the insensitive loss area and replace the original loss function with a quadratic insensitive loss function (Pérez-Cruz et al., 2002). Matilde and Mario proposed a multi-output support vector regression machine whose original loss function is also replaced with a quadratic insensitive function for non-linear channel estimation of multiple-input multiple-output systems in 2004 (Sánchez-Fernández et al., 2004). The Taylor expansion is applied to the iterative algorithm, which speeds up the calculation when solving the Lagrange multiplier. Zhang Wei proposed a multi-output support vector machine based on the least squares support vector machine in 2012 which realizes multi-output by extending multidimensional spatial features (Wei et al., 2012).
The multi-output support vector regression machine based on real numbers solves the high computational complexity of multiple single-output support vector regression machines mainly by expanding the real number kernel on the basis of the original support vector machine regression. But complex number regression is also needed in some applications. The support vector regression machine based on real number splits the complex numbers into different real numbers which ignore the connection between algebras.
A support vector regression machine based on complex numbers proposed by Pantelis Bouboulis mapped the complex number to a complex feature space to divide the complex number into real part and imaginary part, and then it used real number kernel and imaginary number kernel, respectively. Shilton proposed a support vector regression machine based on divisional algebraic space (Bouboulis et al., 2017). This method used an insensitive loss function, instead of the loss function depending on the coordinate system. The proposed quaternion and complex-valued support vector regression for equalization and function approximation is called αX-SVR (Shilton and Lai, 2007; Shilton et al., 2009) (Shilton, 2012). However, division algebra has only four forms: real numbers, complex numbers (R2), quaternions (R4), and octonions (R8), which are limited to process higher dimensional signals.
In order to expand the dimension of the output, Bayro-Corrochano proposed a Clifford geometric algebraic support vector machine that expresses variables in the form of multivectors by a Clifford product (Bayro-Corrochano et al., 2005). Therefore, the CSVR takes advantage of geometric characteristics to realize multi-output and reduce the cost of computation.
3 Clifford Support Vector Regression
In this section, we introduce the basis of geometric algebra and the CSVR.
3.1 Geometric Algebra
The inner product of the two vectors is a scalar or dot product. The wedge product is a known quantity in geometric algebra called a bivector, which is a plane constructed by sweeping a along b. The outer product can be generalized to higher dimensions. Thus, the outer product of k-vectors is a k-vector or k-blade (Corrochano and Sobczyk, 2001). A multivector
Then we devote a geometric algebra
In an n-dimension space, an orthonormal basis of vectors leads to a basis
that spans the entire geometric algebra
where1 ⇒ scalar, e1, e2, e3 ⇒ vectors, e1∧e2,e2∧e3,e3∧e1 ⇒ bivectors, e1∧e2∧e3 ≡ I ⇒ trivector. Here, I is the hypervolume called pseudoscalar, which commutes with all the multivectors.
3.2 Clifford Support Vector Regression
In this part, we will introduce the CSVR proposed by Bayro-Corrochano and Arana-Daniel (2010).
In order to realize multiple outputs, the data set is represented in a Clifford algebra
subject to
where
This constrained optimization problem can be solved by the following Lagrangian form:
It follows from the saddle point condition that the partial derivatives of L with respect to the primal variables
According to the previous three formulas, the dual optimization problem can be written as follows:
subject to
For non-linear regression problems, SVR uses kernel to map the original space to a high-dimensional space. Similar to SVR, CSVR resorts a Clifford kernel ϕ(x), which realizes Clifford algebra-valued mapping as Eq. 11:
The non-linear regression function is given as follows:
where
4 Clifford Fuzzy Support Vector Regression
CFSVR and fuzzy membership are introduced in this section.
4.1 Clifford Fuzzy Support Vector Regression
In many practical applications, the effect of training points is different. In order to improve the performance of CSVR, fuzzy membership is set in this study. Fuzzy regression analysis is an important tool for processing fuzzy data and has been successfully applied to different applications. In this section, we provide a detailed description about the idea and formulations of Clifford fuzzy SVR (CFSVR).
Suppose a set S of labeled training input points with fuzzy membership.
The data set is presented in a certain Clifford algebra
For the case of linear regression, CFSVR fits the regression function by giving a given set of training points. The optimal regression function is given as follows:
where
Then
Combining the structural risk minimization and fuzzy membership with regression in the feature space, the regression problem can be written as follows:
subject to
Since the fuzzy membership si is the attitude of the corresponding point xi toward the regression function, the term siξi is then a measure of error with different weighting.
To solve this optimization problem, we construct the Lagrangian as follows:
For non-linear regression problems, a Clifford kernel ϕ(x) written as Eq. 19 is used to map the original space to the high-dimensional space:
The corresponding dual is found by differentiating with respect to
Based on these conditions, the problem can be transformed as follows:
subject to
Then we know
And the regression function is as follows:
where
4.2 Fuzzy Membership of Multiple Input
For SVR and CSVR, the training points have the same weight to decide the regression hyperplane. However, in practical applications, the importance of different training points is different. For fitting, the training points may be disturbed by noise, which will cause deviation. For the sequence, the contribution of different points to the predicted value is also different, and the point closer to the predicted point has a greater effect on the predicted point.
Therefore, fuzzy membership is introduced into CSVR. For fuzzy membership, it is necessary to determine the minimum membership value σ, where σ > 0. The bigger the membership is, the greater the weight makes decision on the regression surface. Then the relationship between the fuzzy membership and the training data needs to be established. As currently there is not a unified standard for fuzzy membership, it is necessary to select the appropriate fuzzy membership degree according to the actual situation.
For fitting, the distance from the training point to the center of the training point in the feature space is defined as di. The fuzzy membership is obtained as follows:
where si represents the degree of fuzzy membership, and di represents the distance. s1 is set to the point where distance d1 is the smallest as 1, while sl is set to the point with the farthest distance dl as σ, and the fuzzy membership can be defined as follows:
For forecasting of sequence, the number of the point to the predicted point is an important factor. The fuzzy membership is obtained as follows:
where si represents the fuzzy membership, and ni represents the number of the point to the predicted point. The point s1 with the smallest number n1 is defined to the predicted point to be 1, and the point sl with the largest number nl to the predicted point to be σ, and the fuzzy membership degree can be defined as follows:
Therefore for fitting, we choose the distance between the training points and the center in the feature space as the basis for the value of fuzzy membership. For the forecasting of sequence, the points closer to the predicted point have a larger value of fuzzy membership, and the points farther from the predicted point have a smaller value of fuzzy membership. By different fuzzy membership, different training points have different contributions to regression. Thus, the accuracy can be improved.
5 Experiment
The method proposed in this study can be mainly used for multi-output data analysis and multi-output forecasting of sequences. In this section, regression of numerical simulation, UCI data set, and antenna signal data are used, while sequence forecasting of electric load data set and NN3 data set is used to compare the performance of proposed CFSVR and other methods of support vector regression.
The result is described by mean absolute error (MAE) and root mean square error (RMSE) (Gao et al., 2020). MAE refers to the average value of the absolute value of the error between the regression value and the actual value, which is shown in Eq. 31:
where y(i) is the actual value, and
The smaller the MAE and RMSE are, the better the regression performance is.
5.1 Numerical Simulation
5.1.1 Linear Regression
For the linear numerical simulation experiment, 100 training points and 50 test points are generated and Gaussian white noise is added. Figure 1 shows the training result of linear binary number support vector regression, and Figure 2 shows the result of the test. The abscissa is the output of the real part, and the ordinate is the output of the imaginary part. The blue dots represent the original data. The red dots are the CSVR regression results. The green points are the result of CFSVR, the training points are represented by dots, and the test points are represented by the cross. The result is displayed in Table 1 which shows that the CFSVR has a better performance than CSVR.
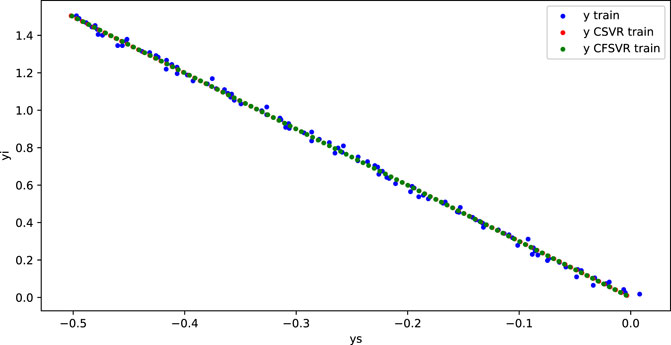
FIGURE 1. Training result of linear regression.
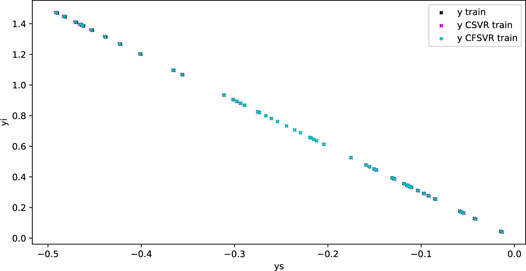
FIGURE 2. Test result of linear regression.
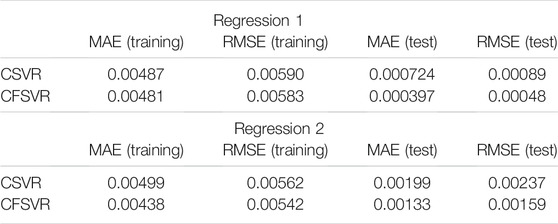
TABLE 1. Performance of CFSVR and CSVR on linear regression.
5.1.2 Non-Linear Regression
For the non-linear numerical simulation experiment, 100 training points and 50 test points are also used, and Gaussian white noise is added to the training points. Figure 3 is the result of training, and Figure 4 is the result of the test, where the red points represent the original data, the blue points represent the results of the CSVR, and the green points represent the results of the CFSVR. The result of MAE and RMSE is shown in Table 2 which demonstrates that the CFSVR has a better performance than CSVR.
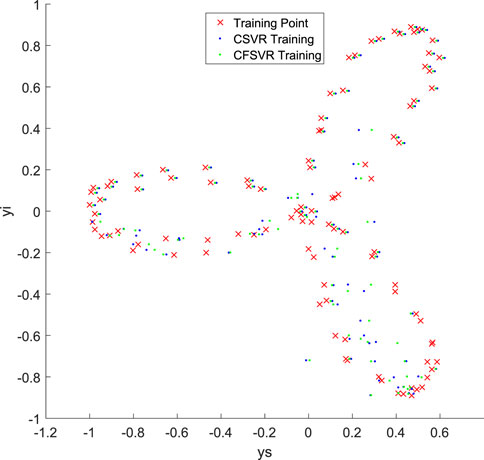
FIGURE 3. Training result of non-linear regression.
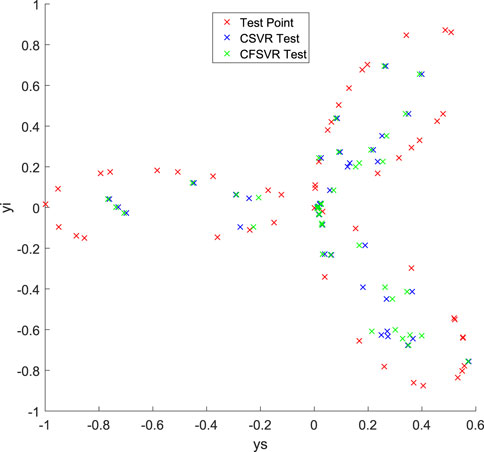
FIGURE 4. Test result of non-linear regression.
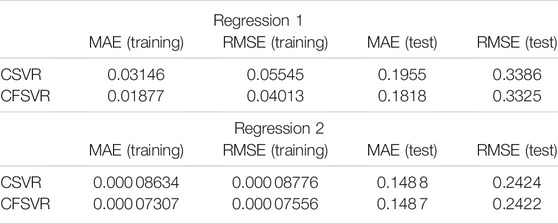
TABLE 2. Performance of CFSVR and CSVR on non-linear regression.
5.2 Regression of UCI Data Set
The UCI data set is widely used as machine learning standard data set, which is a database for machine learning proposed by the University of California Irvine. The data sets used for regression include the iris data set, the abalone age data set, and the Boston housing price data set.
Iris data set is used in this experiment. There are three classes of iris in this data set. CFSVR can realize the regression of the three classes of iris at one time. There is a linear relationship between petal length and petal width. Each class of iris has fifty points. For each class, 40 points are used as the training set, and the rest points are used as the test set, and the petal length is used as input, while the petal width is used as output for regression.
The regression result of CFSVR is shown in Figure 5. The result is shown in Table 3 of each class by CFSVR and CSVR.
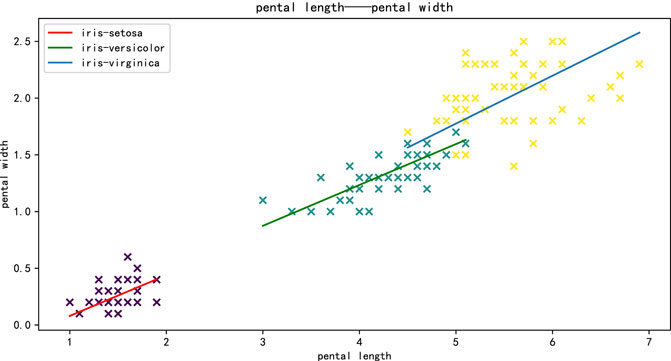
FIGURE 5. Result of the iris by CFSVR.
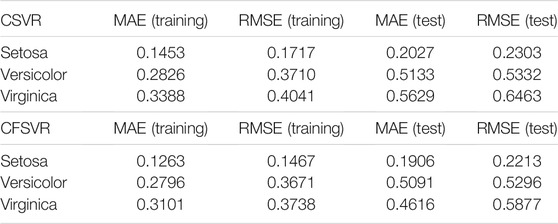
TABLE 3. Result of iris by CFSVR and CSVR.
5.3 Regression of Antenna Signal Data
This regression data set is obtained from the subway scene communication platform. The purpose of the research is to fit on the loss of the train and the experimental trolley at different positions from the station in the same frequency band to obtain the relationship of the path loss between the simulation and the actual train at the same frequency. The data of this experiment are collected in the track and platform of Line 7 in Shanghai. CFSVR is used to regress the path fading and distance. The distance is taken as the logarithm. The result is shown in Figure 6 and Table 4 compared with CSVR.
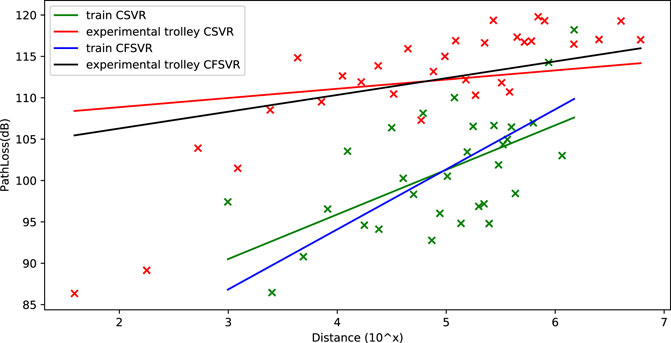
FIGURE 6. Result of antenna signal data by CFSVR and SVR.
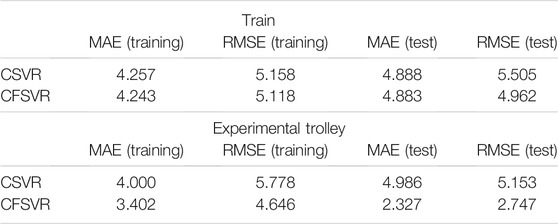
TABLE 4. Performance of CFSVR and CSVR on antenna signal data.
5.4 Forecasting of Electric Load Data Set
In addition to data analysis, SVR can also be used for sequence forecasting. The traditional SVR method can only predict a single step for sequence, while CFSVR can achieve multistep forecasting due to its multi-output. This section compares CFSVR with different dimensions of output to SVR, FSVR, and CSVR.
The data of this experiment are from the 2016 Electrical Engineering Mathematical Modeling Competition. The electric load data were recorded every 15 min. This experiment randomly selects 8 sets of 24 h with 96 points: the first 80 data are used as training points, and the rest 16 points are used as test points for forecasting. SVR, FSVR, and CSVR (n = 2) were used to compare with CFSVR, and n represents the dimension of its output, that is, the predicted step. CFSVR (n = 2) and CFSVR (n = 4) are used for 2-step and 4-step forecasting, respectively. The result is shown in Table 5. Figures 7–10 depict two examples that show the result of forecasting and error of Day 2 and Day 4.
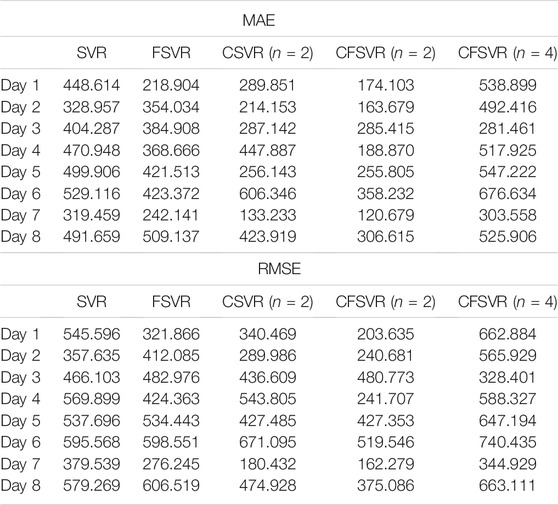
TABLE 5. Performance of CFSVR, CSVR, FSVR, SVR of electric load forecasting.
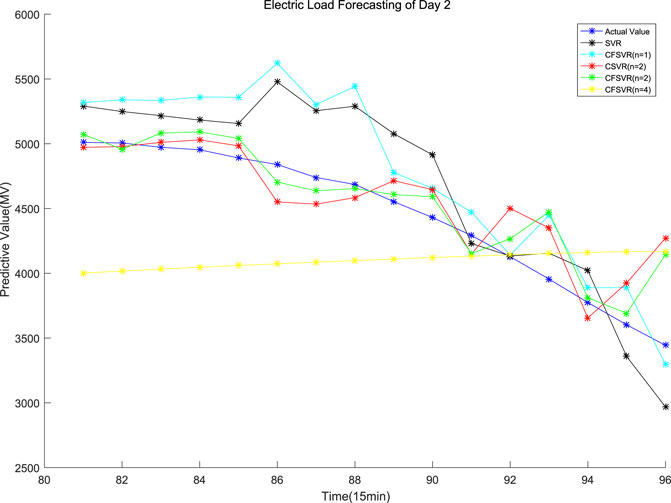
FIGURE 7. Forecasting of the electric load of Day 2.
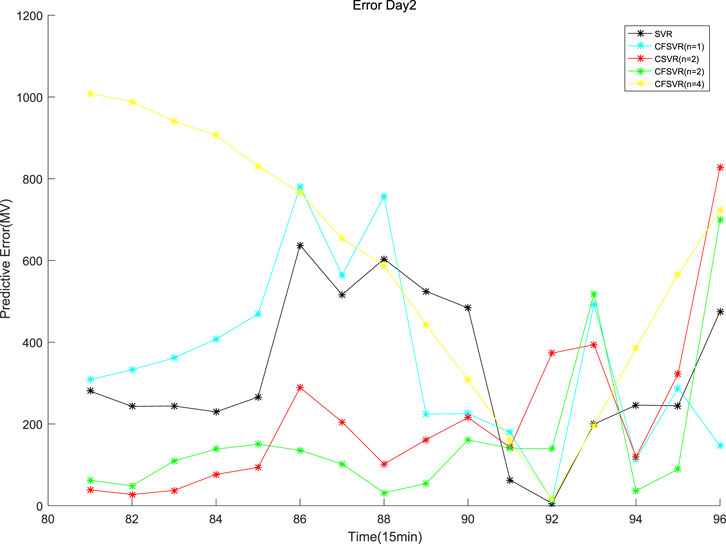
FIGURE 8. Error of electric load forecasting of Day 2.
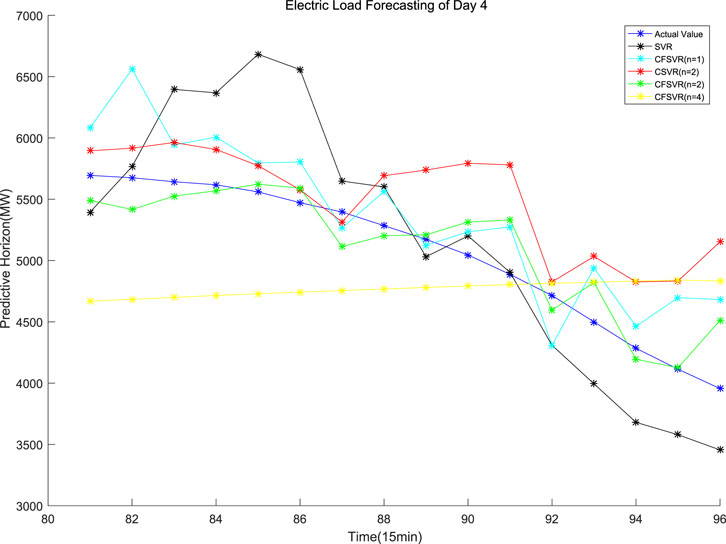
FIGURE 9. Forecasting of the electric load of Day 4.
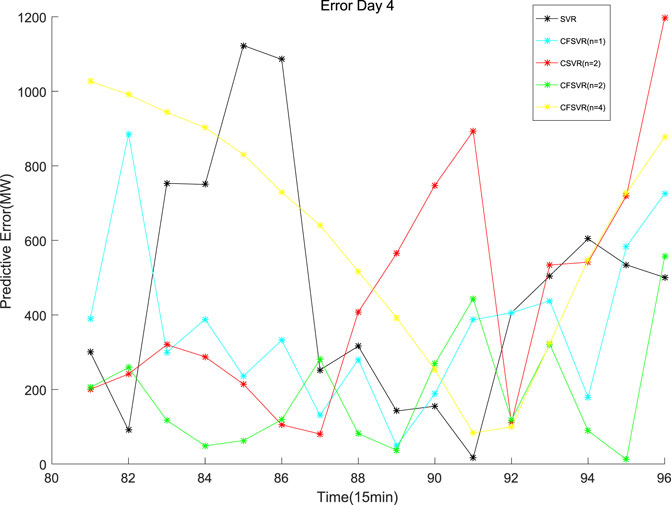
FIGURE 10. Error of electric load forecasting of Day 4.
For the electrical data set, CFSVR (n = 2) has the best predictive effect overall. This is because geometric algebra retains the correlation between different input and output channels. Compared with FSVR, the correlation between the previous and the subsequent sequences will make the forecasting more accurate. But the 4-step forecasting has a larger span than the 2-step forecasting. In the case of a small number of training points, it may not be able to capture the characteristics of the latest changes in the sequence better, so the effect may not be as good as the 2-step forecasting. Compared with CSVR, CFSVR’s fuzzy membership makes the training points have different weights for the forecasting points, which enables CFSVR to have better accuracy.
5.5 Forecasting of NN3 Data Set
In order to show more application of CFSVR in more sequences, NN3 data set is used in this part. NN3 is an academic competition funded by SAS and the International Institute of Forecasters (IIF) (SAS and The International Institute of Forecasters (IIF), 2006). The NN3 data set is actual series, with 111 sequences in total. The data are monthly data, which exhibit both trending and seasonal behavior. Compared with short-term forecasting, it is more complicated. For each sequence, there are tens or hundreds of training data and 18 test data.
In order to compare the proposed CFSVR, CSVR, SVR, FSVR, and LSSVR, the first 8 sequences are used in the experiment, and the results are shown in Table 6. Figures 11, 12 depict the example of the result of forecasting and error of Series No. 3.
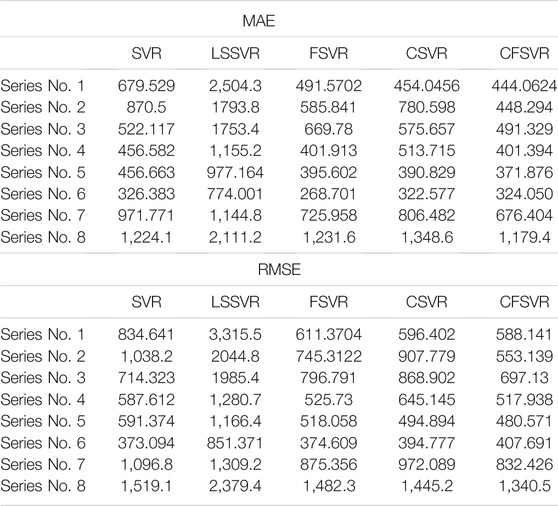
TABLE 6. Result of NN3 time series by CFSVR, CSVR, SVR, LSSVR, FSVR.
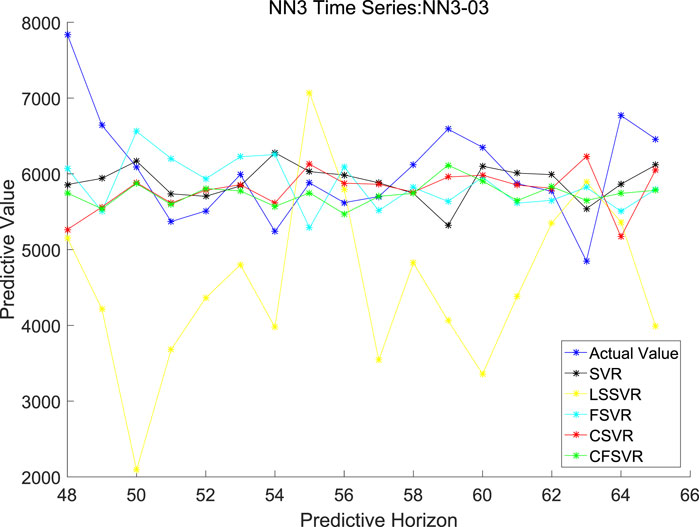
FIGURE 11. Forecasting of NN3 No. 3.
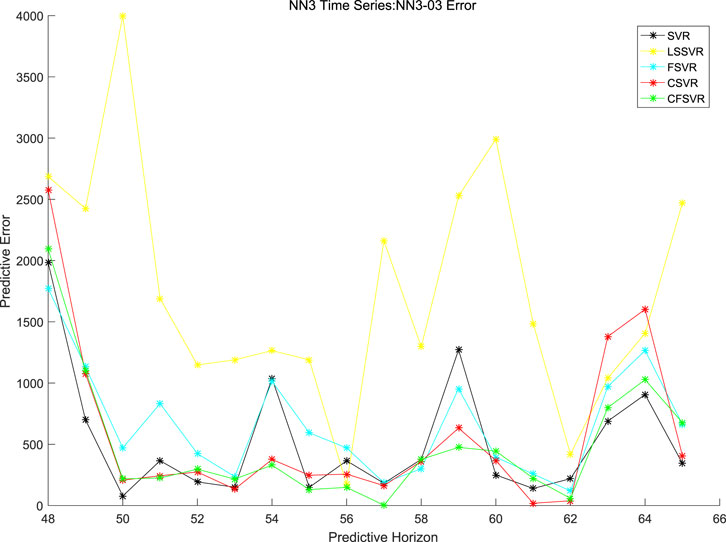
FIGURE 12. Error of forecasting of NN3 No. 3.
6 Conclusion
In this study, we propose CFSVR, which can be used for electric load forecasting. It applies fuzzy membership to the input points so that different points have different weights for the optimal regression hyperplane. Compared with other methods of SVR, it improves the accuracy of electric load forecasting and realizes multistep forecasting. In the following research, we will focus on how to set a more suitable fuzzy membership to improve the CFSVR.
Data Availability Statement
Publicly available datasets were analyzed in this study. These data can be found here: http://www.neural-forecasting-competition.com/NN3/index.htm http://archive.ics.uci.edu/ml/index.php.
Author Contributions
RW and XX contributed to the conception and design of the study. XX performed the statistical analysis and wrote the first draft of the manuscript. RW, XX, YL, and WC wrote sections of the manuscript. All authors contributed to manuscript revision, and read and approved the submitted version.
Funding
The authors declare that they received funding from the National Natural Science Foundation of China, 61771299 and 61771322, to the authors RW, XX, YL and WC.
Conflict of Interest
The authors declare that the research was conducted in the absence of any commercial or financial relationships that could be construed as a potential conflict of interest.
Publisher’s Note
All claims expressed in this article are solely those of the authors and do not necessarily represent those of their affiliated organizations, or those of the publisher, the editors, and the reviewers. Any product that may be evaluated in this article, or claim that may be made by its manufacturer, is not guaranteed or endorsed by the publisher.
References
Bayro-Corrochano, E., and Arana-Daniel, N. (2005). “Mimo Svms for Classification and Regression Using the Geometric Algebra Framework,” in IEEE International Joint Conference on Neural Networks (IEEE), Montreal, QC, July 31–August 4, 2005, 895–900. doi:10.1109/IJCNN.2005.1555971
Bayro-Corrochano, E. J., and Arana-Daniel, N. (2010). Clifford Support Vector Machines for Classification, Regression, and Recurrence. IEEE Trans. Neural Netw. 21, 1731–1746. doi:10.1109/tnn.2010.2060352
Bayro-Corrochano, E., Vallejo, R., and Arana-Daniel, N. (2005). Geometric Preprocessing, Geometric Feedforward Neural Networks and clifford Support Vector Machines for Visual Learning. Neurocomputing 67, 54–105. doi:10.1016/j.neucom.2004.11.041
Bouboulis, P., Theodoridis, S., Mavroforakis, C., and Evaggelatou-Dalla, L. (2015). Complex Support Vector Machines for Regression and Quaternary Classification. IEEE Trans. Neural Netw. Learn. Syst. 26, 1260–1274. doi:10.1109/TNNLS.2014.2336679
Bunn, D. W. (2000). Forecasting Loads and Prices in Competitive Power Markets. Proc. IEEE 88, 163–169. doi:10.1109/5.823996
Corrochano, E. B., and Sobczyk, G. (2001). Geometric Algebra with Applications in Science and Engineering. Hamburg, Germany: Forecasting Competition for Neural Networks and Computational Intelligence.
Cortes, C., and Vapnik, V. (1995). Support-vector Networks. Mach Learn. 20, 273–297. doi:10.1007/BF00994018
Fan, G.-F., Peng, L.-L., Hong, W.-C., and Sun, F. (2016). Electric Load Forecasting by the Svr Model with Differential Empirical Mode Decomposition and Auto Regression. Neurocomputing 173, 958–970. doi:10.1016/j.neucom.2015.08.051
Gao, H., Qin, X., Barroso, R. J. D., Hussain, W., Xu, Y., and Yin, Y. (2020). Collaborative Learning-Based Industrial Iot Api Recommendation for Software-Defined Devices: The Implicit Knowledge Discovery Perspective. IEEE Trans. Emerg. Top. Comput. Intell., 1–11. doi:10.1109/TETCI.2020.3023155
Gao, H., Xu, K., Cao, M., Xiao, J., Xu, Q., and Yin, Y. (2021). The Deep Features and Attention Mechanism-Based Method to Dish Healthcare under Social Iot Systems: an Empirical Study with a Hand-Deep Local-Global Net. IEEE Trans. Comput. Soc. Syst., 1–12. doi:10.1109/TCSS.2021.3102591
Hong, W.-C. (2009). Hybrid Evolutionary Algorithms in a Svr-Based Electric Load Forecasting Model. Int. J. Electr. Power Energ. Syst. 31, 409–417. doi:10.1016/j.ijepes.2009.03.020
Hong, W. C., Dong, Y., Zhang, W. Y., Chen, L. Y., and Panigrahi, B. K. (2013). Cyclic Electric Load Forecasting by Seasonal Svr with Chaotic Genetic Algorithm. Int. J. Electr. Power Energ. Syst. 44, 604–614. doi:10.1016/j.ijepes.2012.08.010
Huang, Y., Xu, H., Gao, H., Ma, X., and Hussain, W. (2021). Ssur: An Approach to Optimizing Virtual Machine Allocation Strategy Based on User Requirements for Cloud Data center. IEEE Trans. Green. Commun. Netw. 5, 670–681. doi:10.1109/TGCN.2021.3067374
Kelo, S., and Dudul, S. (2012). A Wavelet Elman Neural Network for Short-Term Electrical Load Prediction under the Influence of Temperature. Int. J. Electr. Power Energ. Syst. 43, 1063–1071. doi:10.1016/j.ijepes.2012.06.009
Ma, X., Xu, H., Gao, H., and Bian, M. (2021). Real-time Multiple Work-Flow Scheduling in Cloud Environments. IEEE Trans. Netw. Serv. Manage., 1. doi:10.1109/TNSM.2021.3125395
Pérez-Cruz, F., Camps-Valls, G., Soria-Olivas, E., Pérez-Ruixo, J. J., Figueiras-Vidal, A. R., and Artés-Rodríguez, A. (2002). “Multi-dimensional Function Approximation and Regression Estimation,” in International Conference on Artificial Neural Networks, Tianjin, China, July 2–4, 2002 (Springer), 757–762. doi:10.1007/3-540-46084-5_123
Sanchez-Fernandez, M., de-Prado-Cumplido, M., Arenas-Garcia, J., and Perez-Cruz, F. (2004). Svm Multiregression for Nonlinear Channel Estimation in Multiple-Input Multiple-Output Systems. IEEE Trans. Signal. Process. 52, 2298–2307. doi:10.1109/TSP.2004.831028
SAS and The International Institute of Forecasters (IIF) (2006). Forecasting Competition for Neural Networks & Computational Intelligence. [Dataset].
Shi, C., Chen, Y. F., and Zhi-Xiong, Y. U. (2006). Application of Phase Space Reconstruction and V-Svr Algorithm in Predicting Displacement of Underground Engineering Surrounding Rock. J. Coal Sci. Eng. (China) 12, 21–26.
Shilton, A., Lai, D. T. H., and Palaniswami, M. (2010). A Division Algebraic Framework for Multidimensional Support Vector Regression. IEEE Trans. Syst. Man. Cybern. B 40, 517–528. doi:10.1109/tsmcb.2009.2028314
Shilton, A., and Lai, D. T. H. (2007). “Quaternionic and Complex-Valued Support Vector Regression for Equalization and Function Approximation,” in International Joint Conference on Neural Networks, Orlando, FL, August 12–17, 2007 (IEEE), 920–925. doi:10.1109/IJCNN.2007.4371081
Shilton, A., Lai, D. T. H., Santhiranayagam, B. K., and Palaniswami, M. (2012). A Note on Octonionic Support Vector Regression. IEEE Trans. Syst. Man. Cybern. B 42, 950–955. doi:10.1109/TSMCB.2011.2170564
Vapnik, V. (2013). The Nature of Statistical Learning Theory. New York, NY: Springer Science & Business Media.
Wei, Z., Liu, X., Yi, D., and Shi, D. (2012). “Multi-output Ls-Svr Machine in Extended Feature Space,” in IEEE International Conference on Computational Intelligence for Measurement Systems & Applications, Madrid, Spain, August 28–30, 2012 (IEEE), 130–134. doi:10.1109/CIMSA.2012.6269600
Keywords: Clifford geometric algebra, support vector regression, fuzzy membership, multi-output, electric load forecasting
Citation: Wang R, Xia X, Li Y and Cao W (2021) Clifford Fuzzy Support Vector Machine for Regression and Its Application in Electric Load Forecasting of Energy System. Front. Energy Res. 9:793078. doi: 10.3389/fenrg.2021.793078
Received: 11 October 2021; Accepted: 02 December 2021;
Published: 24 December 2021.
Edited by:
Xiaoxian Yang, Shanghai Second Polytechnic University, ChinaReviewed by:
Stelios Fuentes, University of Leicester, United KingdomYancheng Ji, Nantong University, China
Ru Huang, East China University of Science and Technology, China
Copyright © 2021 Wang, Xia, Li and Cao. This is an open-access article distributed under the terms of the Creative Commons Attribution License (CC BY). The use, distribution or reproduction in other forums is permitted, provided the original author(s) and the copyright owner(s) are credited and that the original publication in this journal is cited, in accordance with accepted academic practice. No use, distribution or reproduction is permitted which does not comply with these terms.
*Correspondence: Yanping Li, eWFucGluZ2xpQHNodS5lZHUuY24=; Wenming Cao, d21jYW9Ac3p1LmVkdS5jbg==