 Yiming He1*
 Shaoui Gao2*
- 1School of National Agricultural Institution and Development, South China Agricultural University, Guangzhou, China
- 2College of Economics and Management, South China Agricultural University, Guangzhou, China
This paper develops a dual sectors dynamic equilibrium model and introduces electricity consumption and water consumption in a growth model that tested by using a time series data set from 1950 to 2014 in Guangzhou, China. It presents a theoretical prediction on the interactions between electricity consumption, water consumption, and the metropolitan economic growth. Consistent with this prediction, electricity consumption and water consumption by themselves appear to have significant effects on metropolitan economic performance. The cointegration techniques show that electricity consumption, water consumption, and the metropolitan economic performance have long-run equilibrium relationship. The results of kernel-based regularized least squares reveal that metropolitan economic growth is positively correlated with electricity consumption. Also consistent with the theory, water consumption is positively associated with metropolitan economic performance. These results are generally stable and hold with alternative measures of unit roots, with alternative estimation strategies, and with or without controlling for trends, intercepts, and break points.
1 Introduction
Casual empiricism suggests the presence of significant differences in metropolitan economic growth in China. For example, China’s electricity consumption, heavy reliance on fossil fuel, and watering down environmental regulations have significantly affected the economic development of the country. Nevertheless, there has not been a systematic analysis of long-run differences in metropolitan economic growth with both electricity consumption and water consumption. Our primary motivation in this paper is to make a first attempt at such a systematic analysis and to investigate the relationship between electricity consumption, water consumption, and metropolitan economic growth in Guangzhou, China.
Electricity is one of the most studied energy classes—and for good reason. Growing demands for electricity and water resources and increasingly serious environmental challenges, particularly in metropolitan areas of developing countries like China, have elevated the urgency of studying the water-energy-growth nexus (Lai et al., 2011). China is the largest emitter of greenhouse gases (GHGs) in the world. In 2012, China was the largest contributor to carbon emissions, and with 8.50 Gt in CO2 emissions from fossil burning and cement production in 2012, China was responsible for 25% of global carbon emissions, which was equivalent to the emissions of the U.S. and the E.U. combined (Liu, 2015). Between 2000 and 2010, the electricity production in China had increased threefold and accounted for 50% of domestic and 12% of global CO2 emissions in 2010. For these reasons alone, researchers, policy-makers, consumers, and power plants all have a significant interest in accurately valuing the nexus between electricity consumption and economic development.
In addition to emitting large amounts of GHGs, electricity production also requires significant amounts of water, so water use is an important factor for electricity sector and for sustainable development in China. Continuous economic growth in China can have significant implications for water resources and environmental quality. Therefore, it is important to understand the interdependencies between electricity consumption, water use, and economic growth particularly when it comes to formulating policies targeted at environmental quality protection and sustainability.
Since the founding of China in 1949, electricity and water consumption has become an important issue for the economic development during the process of industrialization and urbanization (He et al., 2017). After 1978 China enforced the openness and reform policy, electricity consumption, water consumption, and economic performance increase dramatically (Kahrl and Roland-Holst, 2008; Jiang et al., 2014). Continuous economic growth of China will have significant implications for electricity and water. Therefore, understanding of the implications of the electricity and water use policies is an important factor for policy formulation targeted at driving economic growth. Moreover, the electricity production is related with the water use. Hence, water withdrawal is also an important factor for economy sustainable growth in China (Feng et al., 2014).
Electric grid and water infrastructure have been critical factors for the economic growth, industrialization, and urbanization of China since founding in 1949. In particular, energy consumption and water use increased dramatically after 1978 when China enacted the openness and reform policies that stimulated economic growth (Kahrl and Roland-Holst, 2008; Jiang et al., 2014). Over time, maintaining balance between electricity supply and demand in China required increase in power generation, which has been primarily based on thermal power generation from coal until recent years (Ohdoko et al., 2013). In 2001, thermal power generation accounted for 81.2% of total power generation, and 95% of thermal power was produced in coal power plants (Zhu et al., 2005). However, concerns have been mounting pertaining to emissions from coal power plant operations including carbon dioxide, nitrogen oxides, sulfur oxides, and particulate matter, including PM2.5 and PM10.
Water use in China rose by 12.47% from 2000 to 2013. On average, 64.06% of water use is attributed to agricultural industry, 22.66% to industry, 11.91% to household use, and 1.36% to biology use from 2000 to 2013 (Zhang et al., 2016). In Guangzhou, 18.43% of water use came from industry, 24.25% of water use came from public services, 55.19% of water use came from household, and others are occupied at 2.13% in 2014.
Guangzhou is the third largest metropolitan area in China, after Beijing and Shanghai, and the largest city in south central China. Moreover, the Guangzhou Statistical Division provides the most complete and longest duration time series dataset (from 1950 to 2014) among the metropolitans in China. It helps us to observe and estimate the electricity consumption function with institutional reform. Throughout its 2100-year history, Guangzhou, the capital of Guangdong province, has been a major commercial center in south China. From 1949 to 1977, collectivist policies abolished much of the trade and commercial activities long associated with Guangzhou. The major breakthrough for repositioning of Guangzhou as a regional commercial hub came with implementation of the open-door policy in 1978, which allowed for international trade and investment introduced. In 1950, the GDP of Guangzhou reached $43 million and per capita GDP was $16. However, in 1978, the GDP reached $0.72 billion and per capita was $149. After economic reform, in 2014, the GDP reached $278,448 million and per capita GDP was $21419 (GSD, 2015). The 1950 census found the population of Guangzhou to be 2.5 million. As of 2014, it was estimated at 13 million. The industry sector accounted for 33.46% of its GDP in 2014, agriculture accounted for 1.32%, and the service sector represented 65.22%. Major industries in Guangzhou include automobiles, electronics, and petrochemicals.
Electricity in Guangzhou comes from the power stations in Guangdong province. There are 33 coal-, gas-, and fuel oil–based power stations, five nuclear power stations, three hydro power stations, three wind power stations, and four pumped-storage power stations in Guangdong province. Except for Zhujiang, Huangpu, Guangzhou (coal-, gas-, and fuel oil–based), and Guangzhou Pumped Storage Power Station, all other power stations are outside Guangzhou. The grid that supplies electricity to the city is Guangzhou Power Supply Co., Ltd. (GZPS). GZPS is one of the enterprises owned by China Southern Power Grid Co., Ltd. (CSG), which is state owned. In 1996, the first “People’s Republic of China Electricity Law” was enforced and followed by a series of supporting laws, marking the electricity industry of Guangzhou into legal constraint. This “Electricity Law” makes it clear on electricity infrastructure construction, electricity production and management, electricity supply and use, supervision, and legal responsibility. On the other hand, in 2005, the Chinese Council promulgated the “Electricity Control System”, which marked the electricity industry of Guangzhou has established a clear monitoring framework. Meanwhile, the “Electricity Business License”, “Electricity Markets Operation Basic Management”, and “Electricity Markets Supervision Measures” are the three regulations that came into effect. As a result, the electricity consumption in Guangzhou grows following the economic growth.
The water in Guangzhou comes from Nanzhou Water Supply Plant (NWSP) in Guangzhou that puts into production at full-scale with the capacity of one million cubic meters per day and from Guangzhou Water Supply Co. (GWSC) that is a large state-owned water supply enterprise and provides all water supply services, including water treatment and and diversified business development. The electricity of Guangzhou comes from the power stations in Guangdong province. There are 33 coal-, gas, and fuel oil–based power stations, five nuclear power stations, three hydro power stations, three wind power stations, and four pumped-storage power stations in Guangdong province. Except for Zhujiang Power Station, Guangzhou Huarun Thermal Power Station, and Guangzhou Pumped Storage Power Station, other power stations are outside Guangzhou that is the capital of Guangdong province. The water in Guangzhou comes from Nanzhou Water Supply Plant (NWSP) in Guangzhou that puts into production at full-scale with the capacity of one million cubic meters per day and from Guangzhou Water Supply Co. (GWSC) that is a large state-owned water supply enterprise and provides all water supply services, including water treatment and diversified business development. Figure 1 shows the increase in water consumption for Guangzhou, China, from 1950 to 2014. Before 2004, the water in Guangzhou just came from state-owned NWSP and GWSC. NWSP was built in 2004 and put into production at full-scale with the capacity of one million cubic meters per day. It is the largest advanced water treatment plant in the nation. GWSC is a large state-owned water supply enterprise and provides all water supply services, including water treatment.
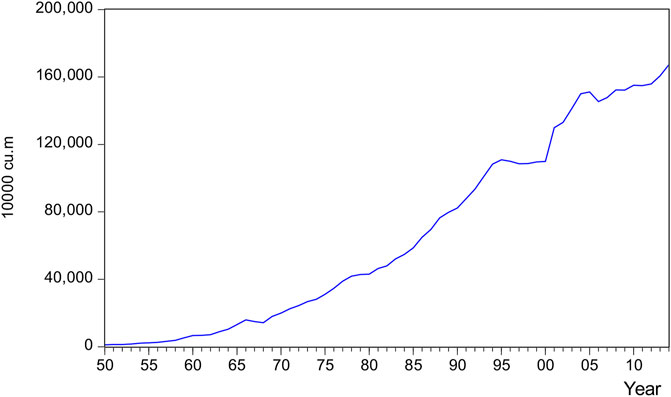
FIGURE 1. Water consumption in Guangzhou, 1950–2014.
From Figure 2, it is found that the metropolitan economy grow after 1980s. Actually, China is a marketization transition country, and the Chinese government enforced the Open and Reform Policy at 1978. Since then, the economic institution in China gradually has been transferred from planning system into market system (Xu, 2011). In particular, being the capital of Guangdong province and the third largest Chinese city, Guangzhou was the earliest metropolitan in China to enforce that marketization policy. Furthermore, 1994 was the other important year for Chinese metropolitan economic development. Because the Chinese tax institution was transferred from the tax contracting system into the tax sharing system at 1994 (Li and Kung, 2015), the metropolitan economy grows dramatically after 1994.
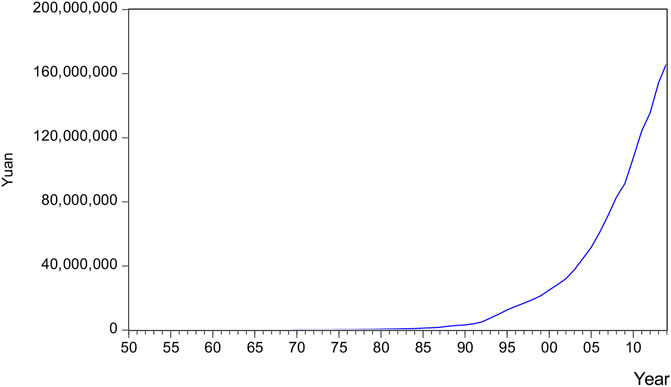
FIGURE 2. GDP in Guangzhou, 1950–2014.
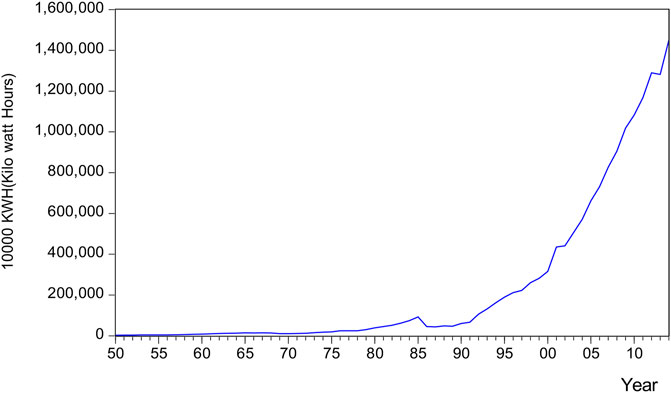
FIGURE 3. Electricity consumption in Guangzhou, 1950–2014.
GDP in Guangzhou is divided into three industrial sectors product values: primary industry (agriculture), secondary industry (mainly manufacture and construction), and tertiary industry (service, business, tourism, etc.). In 2014, the ratios of agriculture, manufacture, and service respect to GDP are 1.31%, 33.47%, and 65.22%, respectively. The total electricity consumption of agriculture, manufacture, and service are 575,520,000 (kWh), 39,527,160,000 (kWh), and 20,421,400,000 (kWh) for Guangzhou in 2014, respectively. The water for production use, public services, household use, and others are 296,263,400 (cu.m), 389,842,300 (cu.m), 8,87,217,300 (cu.m), and 34,117,600 (cu.m) for Guangzhou in 2014, respectively. The electricity of Guangzhou comes from the power stations in Guangdong province. There are 33 coal-, gas, and fuel oil–based power stations, five nuclear power stations, three hydro power stations, three wind power stations, and four pumped-storage power stations in Guangdong province. Except for Zhujiang Power Station, Guangzhou Huarun Thermal Power Station, and Guangzhou Pumped Storage Power Station, other power stations are outside Guangzhou that is the capital of Guangdong province.
Therefore, the time series data with 65 observations from Guangzhou to investigate the interactions between electricity consumption, water consumption, and metropolitan economic growth were carried out. This dataset from Guangzhou can provide us a long-run data sample, and the data are all historic and realistic, which is the only metropolitan level statistical dataset including the data from 1950 to 2014 in China.
The rest of the paper is organized as follows. Section 2 reviews related literature. Section 3 introduces the theoretical framework, characterizes the equilibrium, and derives the major hypotheses and results. Section 4 provides the data description and econometric strategy. Section 5 shows empirical results. Section 6 concludes.
2 Literature Review
Actually, limited attention has been devoted in academic literature to the nexus between water consumption and economic growth, and studies have provided evidence that national per capita water consumptive use seem to follow an inverted U-shaped path, with respect to per capita income, consistent with Kuznets type of relation. The research finds some support for the existence of an Environmental Kuznets Curve, but results are highly dependent on choice of datasets and statistical technique. For example, Katz (2015) presented the results of the analysis of the relationship between national per capita water use and per capita income using international cross-sectional data and panel data for OECD nations and U.S. states. He found that the water consumption initially rise and then decline with respect to income.
Barbier (2004) provided strong support for the inverted U relationship between economic growth and the rate of water use across countries. Barbier and Chaudhry (2014) showed that, in urban counties in the U.S., higher water use and population growth are associated with increase in income per capita. Cazcarro et al. (2013) found that a significant growth of per capita income has been the main factor driving the increase in water consumption growth. Ngoran et al. (2016) suggested that economic growth in 38 Sub-Saharan African countries for the period 1980–2011 is driven mainly by water and labor. Hence, their study supports the growth hypothesis for water consumption.
However, Gleick (2003) even found no relationship between per capita national water consumption and income, which is consistent with neutrality hypothesis. Obviously, previous empirical studies above have come under scrutiny in distinct literatures, and the literatures remain disjointed. Although some empirical researches have calculated empirically the links between water consumption GDP, they do not examine the causality among GDP and water consumption, comparing empirical results among different metropolitans. According the literature above, the nexus between electricity consumption and economic output has been extensively studied, but the evidence so far is contradictory and inconclusive (Stern et al., 2018).
On the other hand, Magazzino (2014) applied time series methodologies to examine the causal relationship among electricity demand, real per capita GDP, and total labor force for Italy from 1970 to 2009. The results of estimation indicate that one cointegrating relationship exists among these variables. This equilibrium relation implies that, in the long-run, GDP and labor force are correlated negatively, as well as GDP and electricity. Moreover, there is a bidirectional Granger causality flow between real per capita GDP and electricity demand; whereas labor force does not Granger cause neither real per capita GDP nor electricity demand. This implies that electricity demand and economic growth are jointly determined at the same time for the Italian case. The forecast error variance decomposition shows that forecast errors in real per capita GDP are mainly caused by the uncertainty in GDP itself, whereas forecast errors in labor force are mainly resulted from the labor force itself, although aggregate income and electricity are important, too.
Magazzino (2017) investigated the stationary properties of electric power consumption in 18 countries in the Middle East and North Africa by using yearly data over the period 1971–2013. After having controlled for the presence of cross-sectional dependence, the “second-generation” panel unit root tests reveal mixed results.
However, concerning the academic literature, there are limited studies about the nexus among economic growth, water consumption, and electricity consumption. For example, Wang et al. (2016) only discussed the electricity consumption in Beijing. Because it is the third largest urban economy in China, that is a surprising omission from the resource economics and China metropolitan economy issue literature (Mele and Magazzino, 2020). Udemba et al. (2020) conducted an empirical research to analyze the relationship between pollutant emission, energy consumption, foreign direct investment, and economic growth.
Indeed, there is a large literature on related problems, including Rehman and Deyuan, (2018), Rehman, (2020), Rehman et al. (2020), Rehman et al. (2021a), Rehman et al. (2021b), Rehman et al. (2021c), Rehman et al. (2021d), Muhammad Awais Baloch et al. (2021), Andrew Adewale Alola et al. (2021), Bright Akwasi Gyamfi et al., 2021, Festus Victor Bekun et al. (2021a), Festus Victor Bekun et al. (2021b), and Festus Victor Bekun et al. (2021a). For example, He (2020) identified the causal effects of urbanization and metropolitan economic performance on electricity consumption by a dynamic general equilibrium theoretical framework and time series econometric models using data from 1949 to 2016 in Guangzhou, China. Both autoregressive distributed lag (ARDL) and Johansen cointegration techniques show that electricity consumption, urbanization, and metropolitan economic performance are cointegrated. The results of two-stage least squires demonstrate that the marginal propensity to electricity consumption in Guangzhou is about 1.28.
Meanwhile, He and Fullerton (2020) examined the nexus between water consumption and economic growth. Water consumption function is derived using an optimal dynamic equilibrium model. Two instrument variable models are proposed with real per capita economic output specified as a function of institutional reform and urbanization, which are used to examine the nexus among water consumption, reform, urbanization, and economic growth in Guangzhou, China.
On the basis of the literature above, this study builds a dual sectors dynamic equilibrium model where the economic performance is expressed as a linear combination of electricity consumption and water consumption. The objectives and contributions of this paper are both theoretical and empirical. The theory described in this paper 1) applied dynamic general equilibrium models to metropolitan economic growth using a social optimal method and 2) describes an estimation procedure that connects electricity consumption and water consumption and also yields interpretable implications. Empirically, this study finds the following: 1) electricity consumption, water consumption, and the metropolitan economic performance have long-run equilibrium relationship; 2) the kernel-based regularized least squares (KRLS) approach reveals that metropolitan economic growth is positively correlated with electricity consumption and water consumption is positively associated with metropolitan economic performance; and 3) results of unit roots are generally robust with alternative estimation strategies and with or without controlling for trends, intercepts, and break points.
3 Theoretic Model
3.1 Electricity Sector
In the model of this study, metropolitan economy is composed of only electricity and water sectors. There are many companies (utilities) in both sectors. Consider that the problem of a representative company i in electricity sector cares about the net benefit and production function per capita is supposed as the Cobb-Douglas form:
where
Combining Equations 2 and 3, the following was obtained:
Suppose there are n homogeneous companies in electricity sector, so the electricity consumption per capita in the whole sector
3.2 Water Sector
Furthermore, the economy activities in water sector are considered. Suppose the production function per capita in the jth water company also takes C-D form with the price of water (r):
The maximization problem can be written as follows:
The first-order conditions of Equation 7 are as follows:
Combining Equations 8 and 9, the following was obtained:
Suppose there are m homogeneous water companies in this sector, water consumption per capita in the whole sector
Given technology level in water sector is identical
3.3 Dynamic General Equilibrium
Now, the optimal electricity and water consumption function to find the dynamic paths for electricity sector and water sector over time are derived. Hence, the problem that this study aims to solve can be expressed as follows:
where
Hence, the social welfare maximization problem with utility discount rate
There are two constraints that must be satisfied by optimal solution.
First, the average stock of electricity s is to be used. Electricity consumption per capita and water consumption per capita are
A second constraint on the change of capital stock per capita derives from the accounting identity relating private numeraire consumption per capita, output per capita in electricity sector and water sector:
According to Equations 5, 12, and 17, the following was obtained:
Then, the optimal social welfare problem is as follows:
Set up the current Hamiltonian function:
The maximum principle conditions are as follows:
The solution of the optimal control model above is as follows:
Actually, let
Similarly, the water consumption function is as follows:
Finally, presume that
4 Data and Econometric Methodology
4.1 Data and Statistical Description
Annual data from 1950 to 2014 was obtained from the “Guangzhou Statistical Yearbook”, within the Guangzhou Municipal Statistics Bureau. The empirical research by Stata 15 was conducted.
Table 1 lists all variables and their definitions used in the empirical analysis. Table 2 lists the summary statistics for the sample. The sample data exhibit good variability.
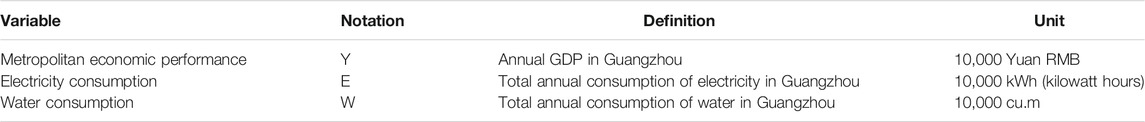
TABLE 1. Variable definitions.
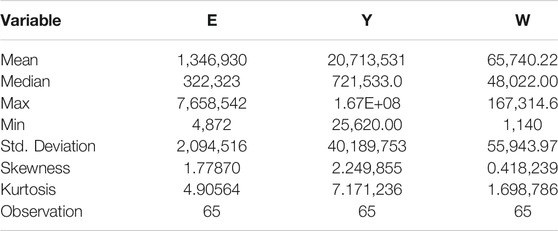
TABLE 2. Descriptive statistics.
4.2 Econometric Methodologies
4.2.1 Stationarity Tests
Standard Granger causality tests have to be conducted on stationary time series. Following this line, the unit roots of Xt to confirm the stationary properties of each variable were first tested. This is achieved by using the augmented Dickey–Fuller test. The augmented Dickey–Fuller test (Granger, 1969) can be revised and derived from the Perron (1989) test:
where Zt = (Yt, Et, Wt)T.
Thus, the choice of the break point is correlated with the data in hand and the choice of break point cannot be considered as independent of the data. Zivot and Andrews (1992) addressed this issue by estimating the structural break data endogenously instead of considering an exogenous break date. The following equations for the Zivot and Andrews (ZA) test are estimated, when Zt = (Yt, Et, Wt)T:
4.2.2 Cointegration Analyses
Following the application of cointegration approach in electricity consumption and GDP by Shiu and Lam (2004), and Lai et al. (2011), the Johansen cointegration test (Johansen, 1991) was used:
In addition, Tang et al. (2013) also used the ARDL model to test the cointegration relationship. Hence, the ARDL model in this study can be expressed as follows:
where D () represents the change of Zt, Zt = (Yt, Et, Wt, Kt, Lt)T.
4.2.3 Kernel-Based Regularized Least Squares
After cointegration, the KRLS method to estimate the cointegration relationship among metropolitan economic growth, electricity consumption, and water consumption was used:
where
where
5 Empirical Results
The data of electricity consumption, water consumption, and GDP may have structural change during 1950–2014. Thus, the stability with break point to complement to the ADF approach that does not consider the data structural change has to be examined. Table 3 shows the unit root test results from the ADF test. Table 4 shows the unit root test results from the Perron test, and Table 5 shows the unit root test results from the Zivot–Andrews test. All of them confirm that Y, E, and W are integrated at I (1).
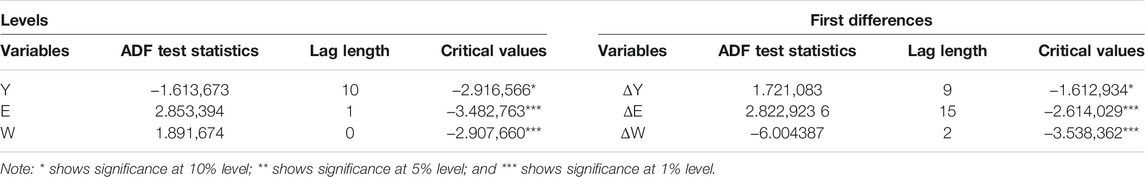
TABLE 3. ADF unit root test results.
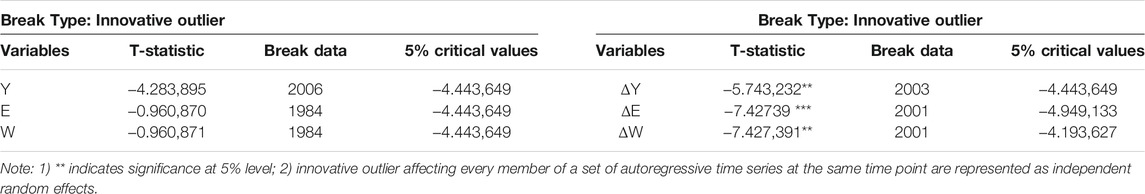
TABLE 4. Perron’s modified ADF unit root test results.
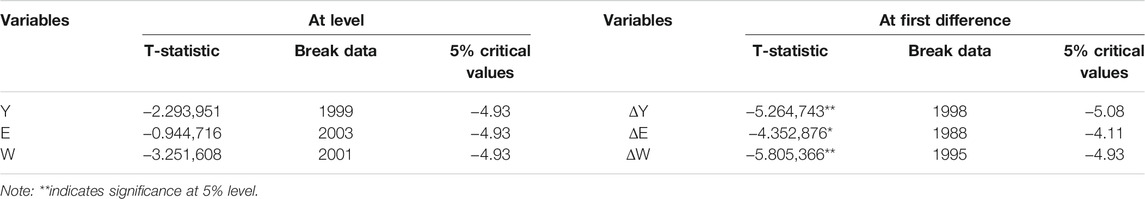
TABLE 5. Zivot–Andrews structural break trended unit root test results.
In terms of cointegration tests, the Jonansen test results in Table 6 and the ARDL bounds test results in Table 7 both show that the economic performance, water, and electricity consumption have long-run equilibrium relationship.

TABLE 6. Johansen cointegration test results.
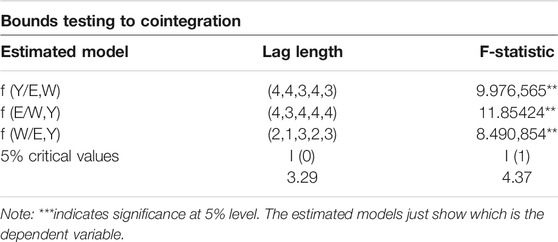
TABLE 7. Bounds test results.
5.1 Unit Root Tests
5.1.1 ADF Test and PP Test
The ADF test is applied to detect the possible presence of unit roots in Yt, Wt, and Et. The null hypothesis of unit root can be rejected in favor of the alternative hypothesis of no unit root when the p-value large. Table 4 represents that no variable is stationary in their levels. On the other hand, Yt, Wt, and Et are the stationary process in their first.
5.1.2 Perron Modified ADF Test With Exogenous Break Point
The framework that follows the work of Perron (1989), Perron and Vogelsang (1992), Vogelsang and Perron (1998), and Banerjee et al. (1992) supports the computation of the modified Dickey–Fuller tests that allow for levels and trends that differ across a single break date. The results of the Perron’s modified ADF test in Table 5 and the Zivot–Andrews test are detailed in Table 6, which show that non-stationary process is found in all series at level with intercept and trend, but variables are found to be stationary at first difference. This confirms that Yt, Wt, and Et are integrated at I (1).
5.2 Cointegration Tests
According to the unit root test results, the integration of the variables is of the same order, and testing whether these variables are cointegrated over the sample period was continued.
5.2.1 Johansen Cointergration Test
Table 7 shows the results of the Johansen test. Because the trace statistic of non-cointegrating equation and at most one cointegrating equation are greater than the 5% critical values, respectively, the test rejects the hypothesis of no cointegration and indicates that there is one cointegrating equation at the 5% significance level, so there is a long-run relationship between Yt, Wt, and Et for Guangzhou.
5.2.2 ARDL Bounds Test Approach to Cointegration
Pesaran et al. (2001) critical values are based on the assumption that the variables are integrated of order I (0) or I (1). Unit root tests insure that none of the series is integrated of I (2) or higher. Armed with information about stationarity, the ARDL bounds testing approach to cointegration was applied. The results of the bound test are given in Table 8. From these results, it is clear that there is a long-run relationship between Yt, Wt, and Et, because their F-statistic are higher than the upper-bound critical value at the 1% level. This implies that the null hypothesis of no cointegration between Yt, Wt, and Et is rejected.
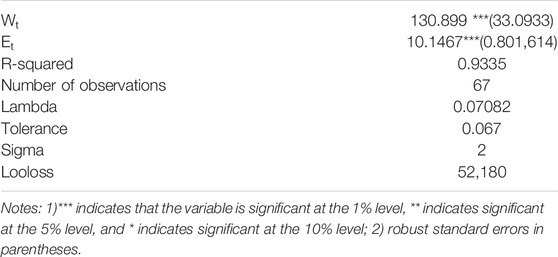
TABLE 8. Results of KRLS (dependent variable = Yt).
5.3 Further Discussion: Results From Kernel-Based Regularized Least Squares
At the end, to estimate the relation in (2.31) above, KRLS to tackle regression problem without a specification search was utilized. The results from Table 8 suggest a statistically significant relationship between Y, E, and W. The KRLS results also suggest that the R2 from KRLS is high enough, which reveals that this regression model fit results. The empirical results indicate that the metropolitan economic growth is positively correlated with the electricity consumption and the water consumption is positively associated with the metropolitan economic performance.
The empirical results are consistent with other studies in developing countries (Ghosh, 2002; Jumbe, 2004; Mehrara, 2007; Narayan and Prasad, 2008; Jamil and Ahmad, 2010; Shahbaz et al., 2011). However, the empirical results in this study contradict with the empirical results of He and Huang (2020). This result is also helpful for metropolitan policy-making in balancing the relationship between electricity use, water consumption, and economic growth. In particular, the experience of economic growth in Guangzhou provides evidence that the resources consumption generates more GDP.
Indeed, both ARDL and Johansen cointegration techniques show that electricity consumption, urbanization, and metropolitan economic performance are cointegrated (He, 2020). Hence, the empirical results regarding to the relationship between electricity consumption and metropolitan economic growth are consistent with his findings, but our work considers the interaction effect of water consumption. Actually, the water consumption is determined by the intersection of endogenous growth function and water consumption function, neither function can be consistently identified by comparing average quantities of water consumed at different values of observed real per capita output (He and Fullerton, 2020). Obviously, our results confirm their arguments and provide new evidence for the long-run relationship between water consumption, electricity consumption, and endogenous economic growth.
6 Conclusion and Policy Recommendation
The electricity consumption and water consumption are vitally important for an economic developing region. This study builds a dynamic general equilibrium model that connects electricity consumption and water consumption with metropolitan economic performance. It also conducts econometric research on the interconnection among them for the third largest metropolitan in China (Guangzhou) from 1950 to 2014. The cointegration techniques show that electricity consumption, water consumption, and the metropolitan economic performance have long-run equilibrium relationship. The results of KRLS reveal that the metropolitan economic growth is positively correlated with electricity consumption. Also consistent with the theory, the water consumption is positively associated with the metropolitan economic performance. These results are generally stable and hold with alternative measures of unit roots, with alternative estimation strategies, and with or without controlling for trends, intercepts, and break points.
Thus, the policy implication of that is, if to improve the electricity and water consumption efficiency, then the resources consumption pattern should be changed into a pattern of low resource intensity. The policy decision-makers should 1) set up R&D funds to drive up distributed energy resources technology, 2) implement subsidy policies to develop resource-saving business models, 3) design an efficient system of prices and regulate charges for electricity services, and 4) enlarge the scale of investment on water utilities and development of water plants. Furthermore, on the basis of the analytical findings of this study, it is proposed that policy-makers and officials continue to enhance their interventions aimed at promoting successful economic development, water use, and increasing electricity consumption. In China, energy, water, and economic developments have had a severe effect. China has faced both the beneficial and detrimental impacts of economic development, as have many other developed countries.
However, this study has limitations that include the following: 1) the theoretical model assumes utility optimization and dynamic general equilibrium; 2) the specification of econometric model does not consider macroeconomic factors such as interest rates; and 3) important uncertainties referring to the export and import between districts, electricity market structures, and decarbonizing technology are not included in the empirical models. It is supported that a more systematic investigation and measurement of joint policy of energy and environment and how they interact with economic growth factors are promising areas for future research (Henryk and Łukasz, 2012; Han and Kung, 2015; Alola et al., 2021; Gyamfi et al., 2021; Dagar, 2021; Gyamfi et al., 2021).
Data Availability Statement
The original contributions presented in the study are included in the article/Supplementary Material; further inquiries can be directed to the corresponding authors.
Author Contributions
YH collected and analyzed data, and built theoretical models. SG wrote and revised the manuscript.
Funding
This work is financially supported by the National Ten Thousand Outstanding Young Scholar Program (W02070352) and the National Social Science Foundation in China (19FJYB050).
Conflict of Interest
The authors declare that the research was conducted in the absence of any commercial or financial relationships that could be construed as a potential conflict of interest.
Publisher’s Note
All claims expressed in this article are solely those of the authors and do not necessarily represent those of their affiliated organizations or those of the publisher, the editors, and the reviewers. Any product that may be evaluated in this article, or claim that may be made by its manufacturer, is not guaranteed or endorsed by the publisher.
References
Alola, A. A., Ozturk, I., and Bekun, F. V., (2021). Is Clean Energy prosperity and Technological Innovation Rapidly Mitigating Sustainable Energy-Development Deficit in Selected Sub-saharan Africa A Myth or Reality. Energy Policy 158, 112520. doi:10.1016/j.enpol.2021.112520
Baloch, M. A., Ozturk, I., Bekun, F. V., and Khan, F. V. (2021). Modeling the Dynamic Linkage between Financial Development, Energy Innovation, and Environmental Quality: Does Globalization Matter. Bus Strat Env. 30 (1), 176–184. doi:10.1002/bse.2615
Banerjee, A., Lumsdaine, R. L., and Stock, J. H. (1992). Recursive and Sequential Tests of the Unit-Root and Trend-Break Hypotheses: Theory and International Evidence. J. Business Econ. Stat. 10 (3), 271–287. doi:10.2307/1391542
Barbier, E. B., and Chaudhry., A. M. (2014). Urban Growth and Water. Water Resour. Econ. 6, 1–17. doi:10.1016/j.wre.2014.05.005
Barbier, E. B. (2004). Water and Economic Growth. Econ. Rec. 80 (248), 1–16. doi:10.1111/j.1475-4932.2004.00121.x
Bekun, F. V., Alola, A., Gyamfi, B. A., and Ampomah, A. B. (2021a). The Environmental Aspects of Conventional and Clean Energy Policy in Sub-saharan Africa: Is N-Shaped Hypothesis Valid. Environ. Sci. Pollut. Res. Int., 1, 1–14. doi:10.1007/s11356-021-14758-w
Bekun, F. V., Gyamfi, B. A., Onifade, S. T., and Agboola, M. O. (2021b). Beyond the Environmental Kuznets Curve in E7 Economies: Accounting for the Combined Impacts of Institutional Quality and Renewables. J. Clean. Prod., 314. 127924. doi:10.1016/j.jclepro.2021.127924
Cazcarro, I., Duarte, R., and Sánchez-Chóliz, J. (2013). Economic Growth and the Evolution of Water Consumption in Spain: A Structural Decomposition Analysis. Ecol. Econ. 96 (June), 51–61. doi:10.1016/j.ecolecon.2013.09.010
Dagar, V. (2021). Reinvigorating the Role of Clean Energy Transition for Achieving a Low-Carbon Economy: Evidence From Bangladesh. Environ. Sci. Pollut. Res..
Feng, K., Hubacek, K., Siu, Y. L., and Li, X. (2014). The Energy and Water Nexus in Chinese Electricity Production: A Hybrid Life Cycle Analysis. Renew. Sustainable Energ. Rev. 39, 342–355. doi:10.1016/j.rser.2014.07.080
Ghosh, S. (2002). Electricity Consumption and Economic Growth in India. Energy Policy 30, 125–129. doi:10.1016/s0301-4215(01)00078-7
Granger, C. W. J. (1969). Investigating Causal Relations by Econometric Models and Cross-Spectral Methods. Econometrica 37 (3), 424–438. doi:10.2307/1912791
Gleick, P. H. (2003). Water Use. Annu. Rev. Environ. Resour. 28 (1), 275–314. doi:10.1146/annurev.energy.28.040202.122849
GSD (2015). Guangzhou, CN: Guangzhou Municipal Bureau. Guangzhou Statistical Yearbook. Available at: http://Data.Gzstats.Gov.Cn/GzStat1/Chaxun/Njsj.Jsp.
Gyamfi, B. A., Bein, M. A., Ozturk, I., and Bekun, F. V. (2021). The Moderating Role of Employment in an Environmental Kuznets Curve Framework Revisited in G7 Countries. Indonesian J. Sustainability Account. Management 4 (2), 241–248.
Han, L., and Kung, J. K.-S., (2015). Fiscal Incentives and Policy Choices of Local Governments: Evidence from China. J. Development Econ. 116, 89–104. doi:10.1016/j.jdeveco.2015.04.003
He, Y., and Huang, H. (2020). Energy Intensity in Guangdong of China (2006–2015): A Spatial Dynamic General Equilibrium Econometric Model. Nat. Resource Model. 33, e12247. doi:10.1111/nrm.12247
He, Y. (2020). Agricultural Population Urbanization, Long-Run Economic Growth, and Metropolitan Electricity Consumption: An Empirical Dynamic General Equilibrium Model. Energ. Strategy Rev. 30, 100498. doi:10.1016/j.esr.2020.100498
He, Y., Fullerton, T. M., and Walke, A. G. (2017). Electricity Consumption and Metropolitan Economic Performance in Guangzhou: 1950-2013. Energ. Econ. 63, 154–160. doi:10.1016/j.eneco.2017.02.002
He, Y., and Fullerton, T. (2020). The Economic Analysis of Instrument Variables Estimation in Dynamic Optimal Models with an Application to the Water Consumption. Agric. Econ. - Czech 66, 413–423. doi:10.17221/270/2020-agricecon
Henryk, G., and Łukasz, L. (2012). The Electricity Consumption versus Economic Growth of the Polish Economy. Energ. Econ. 34, 500–510.
Jamil, F., and Ahmad, E. (2010). The Relationship between Electricity Consumption, Electricity Prices and GDP in Pakistan. Energy Policy 38 (10), 6016–6025. doi:10.1016/j.enpol.2010.05.057
Jiang, L., Folmer, H., and Ji, M. (2014). The Drivers of Energy Intensity in China: A Spatial Panel Data Approach. China Econ. Rev. 31, 351–360. doi:10.1016/j.chieco.2014.10.003
Johansen, S. (1991). Estimation and Hypothesis Testing of Cointegration Vectors in Gaussian Vector Autoregressive Models. Econometrica 59 (6), 1551–1580. doi:10.2307/2938278
Jumbe, C. B. L. (2004). Cointegration and Causality between Electricity Consumption and GDP: Empirical Evidence from Malawi. Energ. Econ. 26 (1), 61–68. doi:10.1016/s0140-9883(03)00058-6
Kahrl, F., and Roland-Holst, D. (2008). China’s Water-Energy Nexus. Water Policy 10 (1), 51–65. doi:10.2166/wp.2008.052
Katz, D. (2015). Water Use and Economic Growth: Reconsidering the Environmental Kuznets Curve Relationship. J. Clean. Prod. 88, 205–213. doi:10.1016/j.jclepro.2014.08.017
Lai, T. M., To, W. M., Lo, W. C., Choy, Y. S., and Lam, K. H. (2011). The Causal Relationship between Electricity Consumption and Economic Growth in a Gaming and Tourism Center: The Case of Macao SAR, the People's Republic of China. Energy 36, 1134–1142. doi:10.1016/j.energy.2010.11.036
Liu, Z., Guan, D., Wei, W., Davis, S. J., Ciais, P., Bai, J., et al. (2015). Reduced Carbon Emission Estimates From Fossil Fuel Combustion and Cement Production in China. Nature. 524, 335–338. doi:10.1038/nature14677
Magazzino, C. (2014). Electricity Demand, GDP and Employment: Evidence from Italy. Front. Energ. 8 (1), 31–40. doi:10.1007/s11708-014-0296-8
Magazzino, C. (2017). Stationarity of Electricity Series in MENA Countries. Electricity J. 30 (10), 16–22. doi:10.1016/j.tej.2017.11.014
Mehrara, M. (2007). Energy Consumption and Economic Growth: The Case of Oil Exporting Countries. Energy Policy 35 (5), 2939–2945. doi:10.1016/j.enpol.2006.10.018
Mele, M., and Magazzino, C. (2020). Machine Learning Analysis of the Relationship Among Iron and Steel Industries, Air Pollution, and Economic Growth in China. J. Clean. Prod. 277. 123293. doi:10.1016/j.jclepro.2020.123293
Narayan, P. K., and Prasad, A. (2008). Electricity Consumption-Real GDP Causality Nexus: Evidence from a Bootstrapped Causality Test for 30 OECD Countries. Energy Policy 36 (2), 910–918. doi:10.1016/j.enpol.2007.10.017
Ngoran, S. D., Xue, X. Z., and Wesseh, P. K. (2016). Signatures of Water Resources Consumption on Sustainable Economic Growth in Sub-saharan African Countries. Int. J. Sustainable Built Environ. 5 (1), 114–122. doi:10.1016/j.ijsbe.2016.04.002
Ohdoko, T., Komatsu, S., and Kaneko, S. (2013). Residential Preferences for Stable Electricity Supply and a Reduction in Air Pollution Risk: a Benefit Transfer Study Using Choice Modeling in China. Environ. Econ. Pol. Stud. 15, 309–328. doi:10.1007/s10018-013-0061-y
Perron, P. (1989). The Great Crash, the Oil Price Shock, and the Unit Root Hypothesis. Econometrica 57 (6), 1361–1401. doi:10.2307/1913712
Perron, P., and Vogelsang, T. J. (1992). Testing for a Unit Root in a Time Series With a Changing Mean: Corrections and Extensions. J. Business Econ. Stat. 10 (4), 467–470. doi:10.2307/1391823
Pesaran, M. H., Shin, Y., and Smith, R. J. (2001). Bounds Testing Approaches to the Analysis of Level Relationships. J. Appl. Econ. 16, 289–3326. doi:10.1002/jae.616
Rehman, A., and Deyuan, Z. (2018). Pakistan's Energy Scenario: a Forecast of Commercial Energy Consumption and Supply from Different Sources through 2030. Energ Sustain. Soc. 8, 26. doi:10.1186/s13705-018-0167-y
Rehman, A., Irfan, M., Hena, S., and Chandio, A. A. (2020). By Applying an ARDL Bounds Testing Approach and Causality Test to Investigate the Electricity Consumption and Production with Economic Growth. Wjstsd 17 (2), 182–199. doi:10.1108/wjstsd-08-2019-0054
Rehman, A., Ma, H., Ozturk, I., Ahmad, M., and Irfan, M. (2021d). Another Outlook to Sector-Level Energy Consumption in Pakistan from Dominant Energy Sources and Correlation with Economic Growth. Environ. Sci. Pollut. Res. 28, 33735–33750. doi:10.1007/s11356-020-09245-7
Rehman, A., Ma, H., and Ozturk, I. (2021b). Do industrialization, Energy Importations, and Economic Progress Influence Carbon Emission in Pakistan. Environ. Sci. Pollut. Res. 28, 45840–45852. doi:10.1007/s11356-021-13916-4
Rehman, A., Ma, H., Radulescu, M., Sinisi, C. I., and Yousaf, Z. (2021a). Energy Crisis in Pakistan and Economic Progress: Decoupling the Impact of Coal Energy Consumption in Power and Brick Kilns. Mathematics 9, 2083. doi:10.3390/math9172083
Rehman, A., Radulescu, M., Ma, H., Dagar, V., Hussain, I., and Khan, M. K. (2021c). The Impact of Globalization, Energy Use, and Trade on Ecological Footprint in Pakistan: Does Environmental Sustainability Exist. Energies 14, 5234. doi:10.3390/en14175234
Rehman, A. (2020). "The Nexus of Electricity Access, Population Growth, Economic Growth in Pakistan and Projection through 2040: An ARDL to Co-integration Approach", Int. J. Energ. Sector Management, 13 (3), 747–763.
Shahbaz, M., Tang, C. F., and Shabbir, M. S. (2011). Electricity Consumption and Economic Growth Nexus in Portugal Using Cointegration and Causality Approaches. Energy Policy 39 (6), 3529–3536. doi:10.1016/j.enpol.2011.03.052
Shiu, A., and Lam, P.-L. (2004). Electricity Consumption and Economic Growth in China. Energy Policy 32 (1), 47–54. doi:10.1016/s0301-4215(02)00250-1
Stern, S., Cimarelli, C., Gaudin, D., Scheu, B., and Dingwell, D. B. (2019). Electrification of Experimental Volcanic Jets With Varying Water Content and Temperature. Geophys. Res. Lett. 46, 11136–11145. Received 24 JUL 2019 Accepted 23 SEP 2019 Accepted article online 10 OCT 2019 STERN ET AL. doi:10.1029/2019GL084678
Tang, C., Muhammad, F. S., and Mohamed, A. (2013). Re-investigating the Electricity Consumption and Economic Growth Nexus in Portugal. Energy Policy 36 (8), 3077–3085. doi:10.1016/j.enpol.2013.07.073
Udemba, E. N., Magazzino, C., and Bekun, F. V. (2020). Modeling the Nexus between Pollutant Emission, Energy Consumption, Foreign Direct Investment, and Economic Growth: New Insights from China. Environ. Sci. Pollut. Res. Int. 27, 17831–17842. doi:10.1007/s11356-020-08180-x
Vogelsang, T. J., and Perron, P. (1998). Additional Tests for a Unit Root Allowing for a Break in the Trend Function at an Unknown Time. Int. Econ. Rev. 39, 1073–1100. doi:10.2307/2527353
Wang, Z., Han, B., and Lu, M. (2016). Measurement of Energy Rebound Effect in Households: Evidence from Residential Electricity Consumption in Beijing, China. Renew. Sustainable Energ. Rev. 58, 852–861. doi:10.1016/j.rser.2015.12.179
Xu, C. (2011). The Fundamental Institutions of China's Reforms and Development. J. Econ. Lit. 49 (4), 1076–1151. doi:10.1257/jel.49.4.1076
Zhang, C., Zhong, L., Fu, X., Wang, J., and Wu, Z. (2016). Revealing Water Stress by the Thermal Power Industry in China Based on a High Spatial Resolution Water Withdrawal and Consumption Inventory. Environ. Sci. Technol. 50 (4), 1642–1652. doi:10.1021/acs.est.5b05374
Zhu, Q., Sarkis, J., and Geng, Y. (2005). Green Supply Chain Management in China: Pressures, Practices and Performance. Int. Jrnl Op Prod. Mnagemnt. 25 (5), 449–468. doi:10.1108/01443570510593148
Keywords: electricity consumption, water consumption, metropolitan development, cointegration, kernel-based regularized least squares, dynamic general equilibrium, Guangzhou
Citation: He Y and Gao S (2021) Electricity-Water Consumption and Metropolitan Economic Growth: An Empirical Dual Sectors Dynamic Equilibrium Model. Front. Energy Res. 9:795413. doi: 10.3389/fenrg.2021.795413
Received: 15 October 2021; Accepted: 08 November 2021;
Published: 24 December 2021.
Edited by:
Xunpeng (Roc) Shi, University of Technology Sydney, AustraliaReviewed by:
Festus Victor Bekun, Gelişim Üniversitesi, TurkeyAbdul Rehman, Henan Agricultural University, China
Copyright © 2021 He and Gao. This is an open-access article distributed under the terms of the Creative Commons Attribution License (CC BY). The use, distribution or reproduction in other forums is permitted, provided the original author(s) and the copyright owner(s) are credited and that the original publication in this journal is cited, in accordance with accepted academic practice. No use, distribution or reproduction is permitted which does not comply with these terms.
*Correspondence: Yiming He, aHltMDUwOUBzY2F1LmVkdS5jbg==; Shaoui Gao, Z3NoMDcyOEAxMjYuY29t