 Huajin Li
 Jiahao Deng
 Shuang Yuan2
 Dimuthu D. K. Arachchige
- 1School of Architecture and Civil Engineering, Chengdu University, Chengdu, China
- 2State Key Laboratory of Geo-hazard Prevention and Geo-environment Protection, Chengdu University of Technology, Chengdu, China
- 3College of Computing and Digital Media, DePaul University, Chicago, IL, United States
Wind turbines are widely installed as the new source of cleaner energy production. Dynamic and random stress imposed on the generator bearing of a wind turbine may lead to overheating and failure. In this paper, a data-driven approach for condition monitoring of generator bearings using temporal temperature data is presented. Four algorithms, the support vector regression machine, neural network, extreme learning machine, and the deep belief network are applied to model the bearing behavior. Comparative analysis of the models has demonstrated that the deep belief network is most accurate. It has been observed that the bearing failure is preceded by a change in the prediction error of bearing temperature. An exponentially-weighted moving average (EWMA) control chart is deployed to trend the error. Then a binary vector containing the abnormal errors and the normal residuals are generated for classifying failures. LS-SVM based classification models are developed to classify the fault bearings and the normal ones. The proposed approach has been validated with the data collected from 11 wind turbines.
1 Introduction
Wind energy is the fastest growing form of renewable energy. Continuous operations in all environmental conditions contribute to failures of wind turbine components, assemblies, and systems. The generator of a wind turbine is one of the most failure-prone assemblies due to the variable loads (Kusiak and Verma, 2012). Bearing failures account for more than 40% of the overall wind turbine generator failures leading to unexpected energy losses (Tavner et al., 2012). Hence, a solution for effective condition monitoring of generator bearings and early identification of failure symptoms is needed.
Deteriorating performance of a generator bearing manifests itself on abnormal changes of the vibration signal, torque, and bearing temperature (Yang et al., 2017; Feng et al., 2020). Vibration analysis and data-driven approaches have been applied for condition monitoring of generator bearings (Yang et al., 2018). The frequently used classical vibration analysis approaches include Fourier transformation (Klein et al., 2001), wavelet transform (Yan et al., 2014), Hilbert-Huang transform (Peng et al., 2005; Huang and Wu 2008), and empirical model decomposition (EMD) (Huang et al., 2008). Other models have been developed. Teng et al. (2016) utilized a complex Gaussian wavelet to obtain the multi-scale enveloping spectrogram for extracting weak features. Lei et al. (2013) applied an ant colony algorithm to form adaptive stochastic resonance method for failure detection. Peeters et al. (2018) integrated automated spectrum editing procedure, band-pass filtering and envelop analysis to detect bearing failures based on the vibration signal. Vibration analysis approaches are valuable in monitoring and diagnosis of generator bearing failures. However, high frequency data from multiple vibration sensors is needed to perform such analysis. However, at present high frequency data is not available from industrial turbines due to the excessive cost and data sharing practices.
Most commercial wind turbines are equipped with the supervisory control and data acquisition (SCADA) systems collecting data that can be used to model behavior of generator bearings. Kusiak and Verma. (2012) applied a neural network to model bearing temperature for failure prediction and identification. Guo. (2012) introduced nonlinear state estimate technique (NSET) for temperature-based failure detection. Yang et al. (2013) applied correlation analysis and quantitative assessment based on the SCADA data. The published literature indicates that the data-driven methods provide robust bearing monitoring solutions for wind turbines.
Deep learning is a recent addition to the modeling suite with promising applications in multiple domains (Ouyang et al., 2017; Sun et al., 2020a; Sun et al., 2020b; Shen et al., 2021a; He et al., 2018; Li et al., 2018). The deep learning algorithms are capable of extracting in-depth features and patterns within the training dataset (Gritsenko et al., 2017; Ouyang et al., 2019; Li et al., 2020; Shen et al., 2021b; Shen and Raksincharoensak 2021). Within the wind energy sector, it has been applied in the prediction tasks of wind speed (Hu et al., 2016), wind power (Wang et al., 2017), and wind direction (Wang et al., 2016a; Li et al., 2021a). Extensive research has also been published using the deep-learning approaches: Wang et al. (2016b) developed deep auto-encoders to compress the time-series SCADA dataset and the blade breakages are extracted from the deep-learned features. Yang et al. (2018) applied stacked Restricted Boltzmann Machines (RBMs) to capture the system-wide patterns and then performed condition monitoring with promising results. Bach-Andersen et al. (2018) selected 1-dimensional convolutional neural networks (CNN) to extract temporal features to classify failures of gearbox bearings. Overall, deep-learning algorithms support development of higher complexity models.
In this research, a deep-learning approach is explored to monitor generator bearings. A deep belief network (DBN) integrated with back-propagation (B-P) fine-tuning and layer-wise training is developed to model normal generator bearing temperature using SCADA data. Four data-driven models predicting normal bearing temperature are constructed. Their performance is assessed with the absolute percentage error (APE), the mean absolute percentage error (MAPE) and the root mean square error (RMSE). The analysis of industrial SCADA data indicates that that bearing failure is preceded by the error shift. The exponentially weighted moving average (EWMA) control chart is applied to monitor the error shift. A temporal binary vector is generated in real-time, and a final failure classification model is developed. The benefits of the proposed approach are demonstrated with computational experiments.
2 Research Methodology
The use of deep-learning algorithms in prediction and condition monitoring is growing (LeCun et al., 2015). Deep learning originates from the research in neural networks. Deep-learning algorithms avoid the local optima dilemma and contains superior power in extracting globally robust features from the dataset (Deng and Yu 2013; Qiu et al., 2017).
2.1 Deep Belief Network
In this research, a deep belief network (DBN) is applied to model the generator bearing temperature. Proposed by Hinton et al. (2006), the classical DBN algorithm multilayers of restricted Boltzmann machines (RBMs) and a logistic regression layer (Wang et al., 2016c).
The restricted Boltzmann machine (RBM) is a commonly used generative stochastic neural network (Hinton et al., 2006). It includes a visible layer of binary-valued neurons and a hidden layer of Boolean neurons (see Figure 1). The connection between the hidden layer and the visible layer is bidirectional and symmetrical. There are no inter-connections between neurons in the same layer.
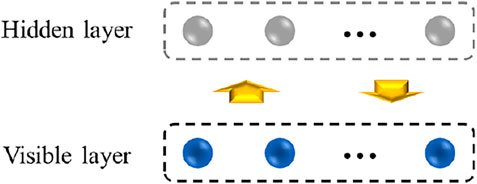
FIGURE 1. The restricted Boltzmann machine.
Training a single restricted Boltzmann machine (RBM) involves the weight matrix between the two layers. The configuration of weight matrix is based on the energy function expressed in Eq. 1 (Wang et al., 2016c). The joint distribution of a visible layer vector and the hidden layer vector is expressed in Eq. 2 (Hinton et al., 2006). The activation functions of neurons in the visible and hidden layer are presented in Eqs 3, 4 (Hinton et al., 2006
where: vi is the number of neurons in the visible layer; hi is the number of Boolean neurons within the hidden layer; wj,i is the weight matrix between the visible layer and hidden layer; ai and bi are the biases of the two layers; and sig() denotes the logistic sigmoid function. Hence, the weight matrix and the layer biases are obtained in a layer-wise unsupervised pre-training described in the Section 2.2.
2.2 Layer-wise Pre-training
A deep belief network (DBN) includes multiple layers of restricted Boltzmann machines (RBMs) (Ouyang et al., 2019). Figure 2 shows the architecture of the proposed DBN. The first RBM of the DBN model consisting of a visible and a hidden layer (hidden layer 1) is pre-trained as an independent RBM. Then, the weight matrix of the first RBM is computed. The output of the first RBM becomes the input to the second RBM that includes two layers. The first layer (hidden layer 1) is treated as a visible layer of the second RBM while the second layer (hidden layer 2) is treated as the hidden layer. The weight matrix of the second RBM is computed. Hence, the weight matrices between the remaining hidden layers are obtained iteratively.
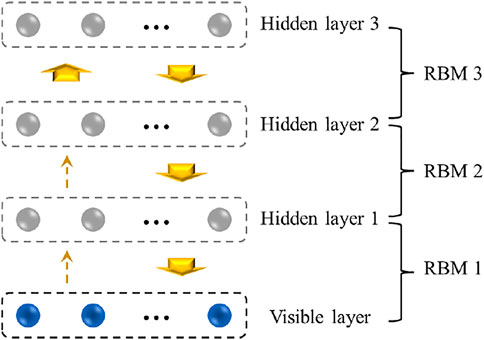
FIGURE 2. Architecture of the deep belief network.
Training each restricted Boltzmann machine (RBM) is accomplished with a stochastic gradient descent method (Hinton et al., 2006). Based on vector Eq. 2 of the joint distribution function between the visible and hidden layer, the objective function of the stochastic gradient descend method is expressed in Eq. 5 (Wang et al., 2016c).
where: a is the bias vector of the visible layer; b is the bias vector of the hidden layer; and w is the weight matrix between the two layers. The parameters of the objective function (a, b, w) are updated based on the gradients of the function expressed in Eqs 6–8. The updating rules are formulated in Eqs 9–11 (Hinton et al., 2006).
where: η is the learning rate;
2.3 Data-Driven Algorithms
Performance of the deep belief network (DBN) is compared with three algorithms, support vector regression machine (SVR), neural network (NN), and extreme learning machine (ELM).
The support vector regression machine (SVR) is considered in this study includes a Gaussian kernel function (Drucker et al., 1997). The values of the model parameters (c and γ) are selected based on the 10-fold cross-validation. The neural network (NN) contains two hidden layers. By testing on a small portion of the training data, the sigmoid activation function is selected based on the satisfactory performance. The extreme learning machine (ELM) algorithm (Liang et al., 2006) is utilized to model the normal bearing temperature. As a single-hidden layer feed-forward network, the ELM learning model is expressed in Eqs 12, 13 (Liang et al., 2006).
where: xj represents the input parameters; oj represents the predicted output values; fL() is the non-linear function representing the ELM algorithm; ai is the weight vector connecting the ith hidden node and the input nodes; bi is the threshold of the ith hidden node; βi is the weight vector connecting the ith hidden node and the output nodes; and tj is the actual output value.
2.4 Performance Evaluation Metrics
To assess prediction accuracy of the deep belief network, three performance evaluation metrics are computed: the absolute percentage error (APE) Eq. 14, the mean absolute percentage error (MAPE) Eq. 15, and the root mean square error (RMSE) Eq. 16.
where: oj is the jth predicted generator bearing temperature; tj is the jth actual generator bearing temperature; N denotes the number of data points.
2.5 Exponentially Weighted Moving Average Control Chart
The increasing value of the prediction bearing temperature error of a data-driven model reflects deterioration of the generator bearing conditions. In this research, an exponentially weighted moving average (EWMA) (Jones et al., 2001) control chart is applied to monitor the error. The weighted average of the past bearing temperatures reduces the noise and allows detecting small process shifts.
To compute the upper and lower confidence limits of the EWMA control chart, the EWMAt is obtained from Eq. 17 (Wang et al., 2016b). The upper and lower confidence limits can be computed from Eqs 18, 19 (Horng Shiau and Ya-Chen 2005).
where: µAPE is the mean of absolute percentage error (APE); σAPE is the standard deviation of APE; N denotes number of samples. According to Horng Shiau and Ya-Chen. (2005), the value of the parameter L is commonly set to 3 and λ is usually set to 0.2.
2.6 Binary Vectors Generated by Control Chart
The EWMA control charts used statistical thresholds to label the prediction error (residuals) as normal and abnormal. The normal residual usually denotes the bearing temperature is within the normal range and the wind turbine is at healthy status. On the other hand, the abnormal values often indicate abnormal bearing temperature change and it can be the warning signal for bearing failures. Hence, in this research, the normal and abnormal residuals identified by the EWMA control charts are transformed into binary vectors as described in Figure 3 as follows.
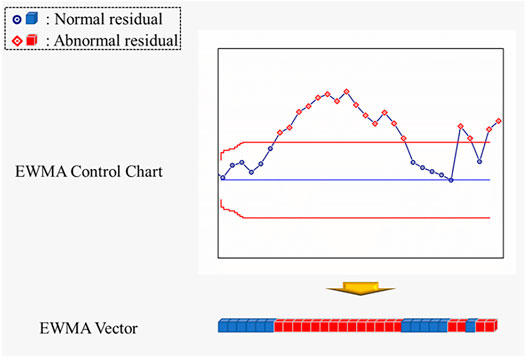
FIGURE 3. Vectorization of residuals using EWMA control charts.
According to Figure 3, the statistical thresholds classified the residuals into normal and abnormal ones. Each data point can be simply labeled as 0 (normal) and 1 (abnormal). Hence, the binary vectors can be generated in real-time and be utilized as the inputs for the final classification models introduced in the Section 2.7.
2.7 Classification Models
Using the real-time vectors generated by the EWMA control charts, the final failure classification models are constructed in this research. Here, the dimension of the input vector is determined as 20 which represents all normal/abnormal prediction residuals of bearing temperatures. In total of four state-of-art machine learning algorithms including support vector machine (SVM), least-square support vector machine (LS-SVM), extreme learning machine (ELM), and kernel-based extreme learning machine (KELM) are selected to classify the vectors representing generator bearing failures and vectors from normal bearing behaviors.
The SVM is the state-of-art supervised learning algorithm used for classification and function approximation (Cherkassky and Ma, 2004). It is based on kernel functions and it avoids the difficulty of using linear functions in the high dimensional parameter space, and the optimization problem is transformed into a dual convex quadratic programming problem.
The LS-SVM is developed based on statistical theory and considered as the improved version of SVM (Zhu et al., 2018). Compared with the vanilla SVM, the LS-SVM modifies the inequality constraint in the SVM to the equality constraint. Meanwhile, the training error square is used to replace the slack variable in order to transform quadratic programming problem into the linear equation problem for greatly improving the speed and accuracy of model parameters. The LS-SVM has the unique superiority in dealing with the small-sample learning problem.
The ELM is a feedforward neural network which contains the input layer, the output layer and one single hidden layer. Compared with other computationally expensive and time-consuming neural networks, the ELM adopts Penn Moore pseudo inverse to determine the weights and biases between the hidden layer and output layer (Li et al., 2021b). This method enables ELM to learn faster and attain higher generalization capability compared with other neural networks.
The KELM uses the kernel method over the vanilla ELM and it solves the problem of random initialization of ELM and has high classification accuracy (Pandey et al., 2018; Ouyang 2021), good generalization ability and high degree of robustness. The Gaussian kernel function is the most frequently used kernel function and thus is selected in this study.
3 Computational Analysis
The data used in this research has been collected from SCADA systems of a large wind farm. The data 10 min resolution data from 11 wind turbines is used to investigate failure of a generator bearing. Two bearing failure instances have been reported during the period covered by the dataset.
3.1 Dataset Description and Preprocessing
The ranges of the generator bearing temperature of the 11 turbines are provided in Table 1. The bearing failure incidents are also included in Table 1. Based on the maintenance records, Turbine B, H, I, and K have been affected by bearing failures and are not considered for modeling normal bearing behavior discussed in the Section 3.2. Rather they are selected to test abnormal behavior of the bearing temperature.
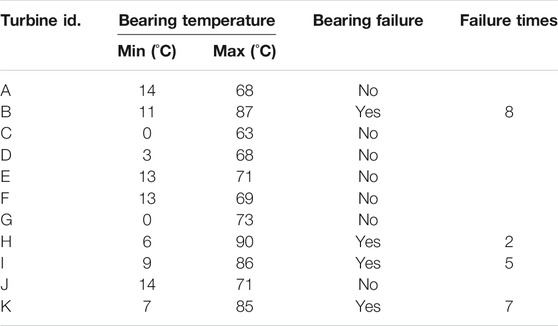
TABLE 1. Dataset description.
3.2 Parameter Selection
To capture the normal behavior of a generator bearing, 33 parameters relevant to the bearing temperature have been initially considered. Using domain expertise, the number of parameters of interest was reduced to 12. Next, three algorithms (i.e., the wrapper with genetic search (WGS) (Kohavi and John, 1997), boosting-tree algorithm (BTA) (Sbihi, 2007), and the relief algorithm (RA) (Liu et al., 2018) were applied to select the most relevant parameters for predicting the generator bearing temperature. The wrapper approach uses supervised learning to perform 10-fold cross validation in selecting relevant parameters. The boosting-tree algorithm evaluates the importance of parameters by constructing a sequence of decision trees and computing the prediction residuals. The relief algorithm selects the parameter set by detecting conditional dependence between the parameters. The eight most important parameters selected by the three data-mining algorithms are listed in Table 2.
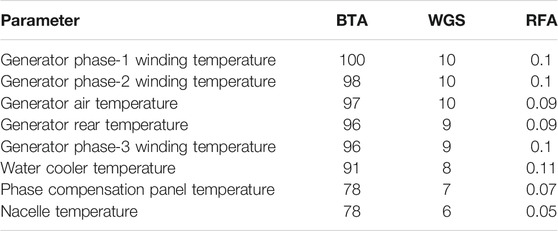
TABLE 2. Dataset description.
3.3 Modeling Bearing Behavior
Data from three wind turbines (i.e., Turbine C, Turbine D, Turbine E) have been merged to train the neural network, support vector regression machine, the extreme-learning machine presented in Section 2.2, and the proposed deep belief network (DBN). Data collected from Turbine A, B, F and G are used as validation dataset to validate prediction performance of the proposed DBN algorithm. Data from Turbine G, J, I and K are used as testing dataset respectively. To design the DBN, the number of hidden neurons in each layer is set at 10% of the training data (Mitchell, 1999). The data from the remaining 2 healthy turbines (i.e., Turbine 9 and 11) are designated as test datasets to evaluate performance of the four algorithms.
Table 3 presents prediction results produced by the four algorithms based for the test and validation datasets. The mean absolute percentage error (MAPE) and the root mean square errors (RMSE) produced by the DBN algorithm are the smallest which confirms the accuracy of the DBN model. This superior performance may be attributed to the layer-wise pre-training.
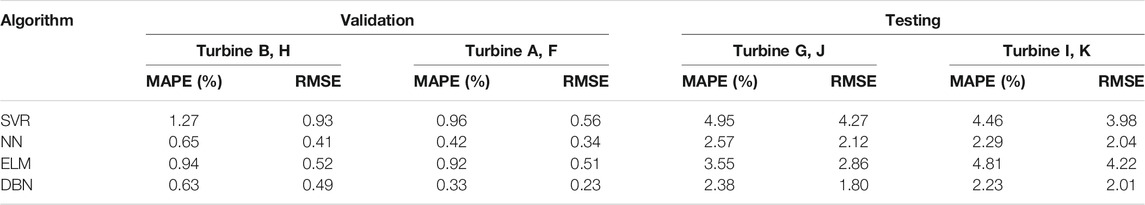
TABLE 3. Performance evaluation of four algorithms.
Figure 4 illustrates prediction error from testing and validation produced by the deep belief network (DBN). The APEs of healthy wind turbines and turbines with bearing failures demonstrate different behaviors. Hence, the emerging bearing failure is indicated by the APE of the DBN model.
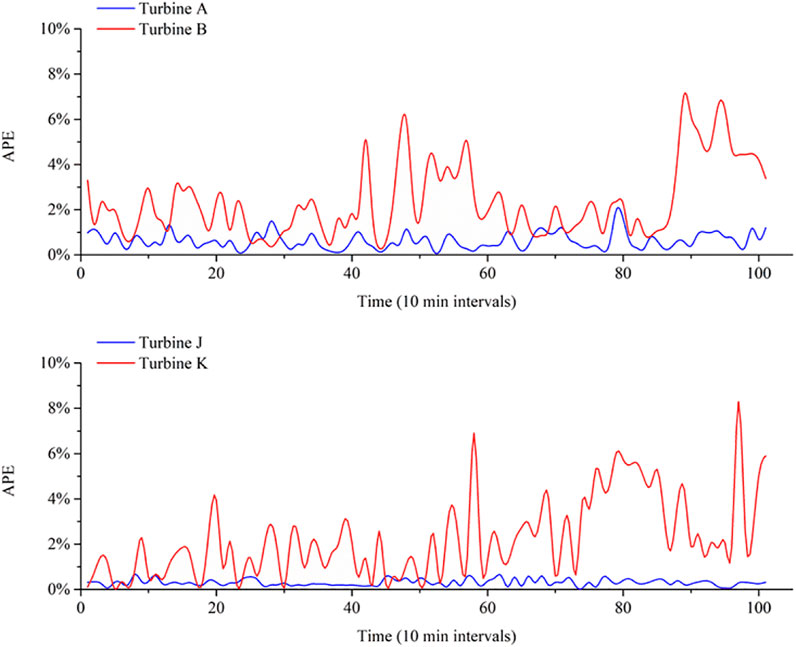
FIGURE 4. The absolute percentage error produced by the deep belief network.
3.4 Condition Monitoring
In this section, behavior of the prediction error associated with the bearing failure is discussed. The APE was monitored for 1 week prior to the bearing failure. The upper confidence limit (UCL) and the lower confidence limit (LCL) of the exponentially-weighted moving average (EWMA) control chart are computed from Eqs 18, 19 of Section 2.4. The monitored examples of healthy turbines and the turbines with emerging bearing failures are illustrated in Figures 5, 6.
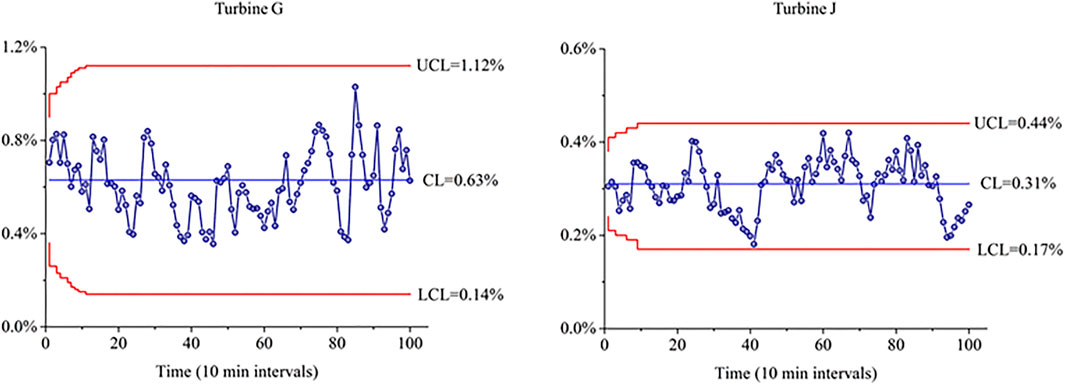
FIGURE 5. The EWMA control charts of two healthy turbines.

FIGURE 6. The EWMA control charts of two turbines with bearing failures.
Figure 5 illustrates the EWMA charts of healthy turbines (Turbine G and J) while Figure 6 shows the wind turbines (Turbine I and K) with problematic generator bearings of the same wind farm. In Figure 5, all statistics fall within the control limits which indicates normal bearing behavior. Meanwhile, outliers in Figure 6 begin to emerge 1 week prior to the bearing failure and an early alarm is issued. According to the results presented in Figure 6, bearing failures are visible several days ahead of the occurrence. The proposed approach provides sufficient time to react and thus minimize power loss and downtime.
The outcomes of the EWMAs are transformed into the real-time binary vectors and then the bearing failure classification models are developed to classify the actual failures. However, in the temporal domain, the optimal size of the EWMA vectors are uncertain. Hence, this research performed several experiments by trying difference size of the EWMA vectors (i.e., K = 10, 20, 30, 40). All algorithms introduced in the Section 2.7 are tested and the computational results are illustrated in Figure 7 below. The AUC is selected as the measurement It is obvious that all algorithms reached their peak classification performance when K = 20 and thus it is selected as the optimal setting for the dimension of the input EWMA vector in our study.
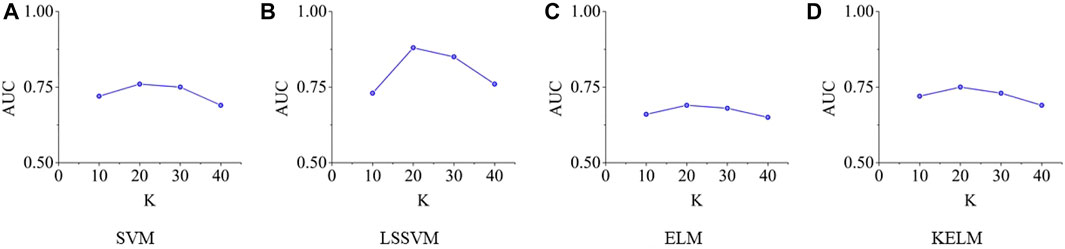
FIGURE 7. The AUCs of all classification algorithms under different dimensions of EWMA vectors.
As illustrated in Figure 8 below, the ROC curves for the four state-of-art algorithms are obtained with respect to the testing dataset. Among them, the LS-SVM achieves the highest area under the ROC curve (AUC) as 0.88 which demonstrates its superior performance in classifying bearing failures from the binary vector mixed with normal and abnormal prediction residuals. Meanwhile, the other performance metrics including accuracy, sensitivity and specificity along with the 95% confidence intervals are also provided in Table 4. The LS-SVM still performs best among all algorithms tested according to all evaluation metrics. Hence, using the vectors generated from the DBN and EWMA control charts, the LS-SVM is capable of classify the majority of the bearing failures in the temporal domain.
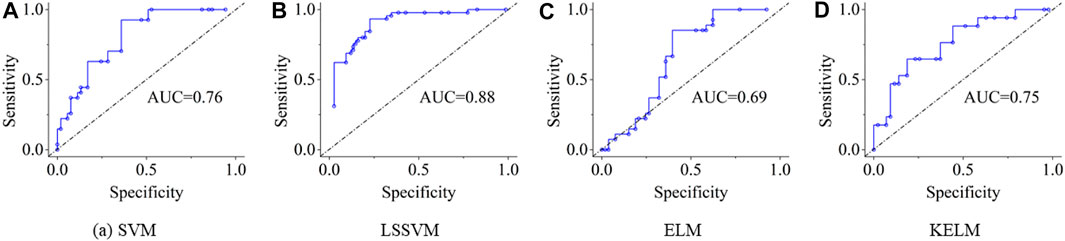
FIGURE 8. ROC curves of the bearing failure classification outcome.

TABLE 4. Summary of bearing fault classification results.
4 Discussion
The condition-monitoring framework proposed in this study has provided promising results using field SCADA data. Overall, the advantages of the proposed framework can be summarized into the following three points: First, it uses deep belief network as the backbone regressor. It has shown superior power in extracting temporal abnormal features from the dataset. Second, the framework is designed to be implemented on SCADA data which is the standard data collection system for almost all wind farms across the globe. Hence, it can be widely implemented on practice. Third, the classification part can save a lor of labor and time. Conventional control chart-based identification of mechanical failures requires humans to detect the statistical outliers. Instead, in this research, the machine-learning classifiers enables the automation of this process. In sum, it can be widely applied in wind farms for condition monitoring tasks.
On the other hand, there are also few shortcomings at current stage. For example, the sensor errors can be a misleading factor that cause false classification of mechanical failures. The reliability of the SCADA sensors is not considered in this framework. This can be a future direction of our current research.
5 Conclusion
In this research, a deep-learning based condition-monitoring framework to identify bearing failures was presented in this study. Historical data collected from healthy wind turbines was utilized to develop a model predicting bearing temperature with a deep belief network. Data from both healthy wind turbines and turbines to the bearing failures are served as the testing dataset. Comparative analysis demonstrated that the deep belief network model was more accurate in predicting generator bearing failures. An exponentially-weighted moving-average control chart was applied to capture shifts in prediction error. The control charts generated binary vectors lead to identification of the emerging bearing failure in real-time in the temporal domain.
Computational results reported in the paper validated accuracy of the deep-learning framework in condition monitoring of wind turbine generator bearings. In the future research, analysis of high frequency vibration data may be coupled with the bearing temperature data for multi-scale condition monitoring.
Data Availability Statement
The raw data supporting the conclusion of this article will be made available by the authors, without undue reservation.
Author Contributions
HL conceptualized the study, contributed to the study methodology, and wrote the original draft. JD contributed to the study methodology, data curation and investigation. SY and PF contributed to data analysis and investigation. HL contributed to software and formal analysis. DA contributed to investigation and writing-original draft. All authors have read and agreed to the published version of the manuscript.
Funding
This research is supported by National Key Research and Development Program of China (2018YFC1505105), the Opening fund of State Key Laboratory of Geohazard Prevention and Geoenvironment Protection (Chengdu University of Technology) (Grant No. SKLGP2021K014), the “Miaozi project” of scientific and technological innovation in Sichuan Province, China (Grant No. 2021090), the Project from Sichuan Mineral Resources Research Center (SCKCZY2021-YB009), and the Open Research Subject of Key Laboratory of Fluid and Power Machinery (Xihua University), Ministry of Education (Grant No. LTDL2021-011).
Conflict of Interest
The authors declare that the research was conducted in the absence of any commercial or financial relationships that could be construed as a potential conflict of interest.
Publisher’s Note
All claims expressed in this article are solely those of the authors and do not necessarily represent those of their affiliated organizations, or those of the publisher, the editors and the reviewers. Any product that may be evaluated in this article, or claim that may be made by its manufacturer, is not guaranteed or endorsed by the publisher.
References
Bach‐Andersen, M., Rømer‐Odgaard, B., and Winther, O. (2018). Deep Learning for Automated Drivetrain Fault Detection. Wind Energy 21 (1), 29–41. doi:10.1002/we.2142
Cherkassky, V., and Ma, Y. (2004). Practical Selection of SVM Parameters and Noise Estimation for SVM Regression. Neural networks 17 (1), 113–126. doi:10.1016/s0893-6080(03)00169-2
Deng, L., and Yu, D. (2013). Deep Learning for Signal and Information Processing. IEEE Signal. Process. Mag. 28 (1), 145–154. doi:10.1109/MSP.2010.939038
Drucker, H., Burges, C., Kaufman, L., Smola, A., and Vapnik, V. (1997). Support Vector Regression Machines. Adv. Neural Inf. Process. Syst. 9, 155–161.
Feng, P., Wei, M., Dai, F., Tang, R., Qiu, H., and Gong, J. (2020). DEM Investigation on the Mechanical Behaviors of Flawed Specimens Subjected to Coupled Static-Dynamic Loads. Soil Dyn. Earthquake Eng. 135, 106–220. doi:10.1016/j.soildyn.2020.106220
Gritsenko, A., Sun, Z., Baek, S., Miche, Y., Hu, R., and Lendasse, A. (2017). “Deformable Surface Registration with Extreme Learning Machines,” in International Conference on Extreme Learning Machine (Cham: Springer), 304–316. doi:10.1007/978-3-030-01520-6_28
Guo, P. (2012). Wind Turbine Generator Bearing Condition Monitoring with NEST Method,” in Proceedings of the 2012 24th Chinese Control and Decision Conference (CCDC) (IEEE), Taiyuan, China, May 2012, 235–239. 10.1109/CCDC.2012.6244033.
He, Y., Fei, F., Wang, W., Song, X., Sun, Z., and Baek, S. (2018). “Predicting Manufactured Shapes of a Projection Micro-stereolithography Process via Convolutional Encoder-Decoder Networks,” in Proceedings of the International Design Engineering Technical Conferences and Computers and Information in Engineering Conference (American Society of Mechanical Engineers (ASME)), V01BT02A033. doi:10.1115/detc2018-85458
Hinton, G. E., Osindero, S., and Teh, Y.-W. (2006). A Fast Learning Algorithm for Deep Belief Nets. Neural Comput. 18 (7), 1527–1554. doi:10.1162/neco.2006.18.7.1527
Hinton, G. E. (2002). Training Products of Experts by Minimizing Contrastive Divergence. Neural Comput. 14 (8), 1771–1800. doi:10.1162/089976602760128018
Horng Shiau, J.-J., and Ya-Chen, H. (2005). Robustness of the EWMA Control Chart to Non-normality for Autocorrelated Processes. Qual. Technology Quantitative Management 2 (2), 125–146. doi:10.1080/16843703.2005.11673089
Hu, Q., Zhang, R., and Zhou, Y. (2016). Transfer Learning for Short-Term Wind Speed Prediction with Deep Neural Networks. Renew. Energ. 85, 83–95. doi:10.1016/j.renene.2015.06.034
Huang, N. E., and Wu, Z. (2008). A Review on Hilbert‐Huang Transform: Method and its Applications to Geophysical Studies. Rev. Geophys. 46 (2). doi:10.1029/2007rg000228
Huang, T. L., Ren, W. X., and Lou, M. L. (2008). “The Orthogonal Hilbert-Huang Transform and its Application in Earthquake Motion Recordings Analysis,” in Proceedings of the 14th World Conference on Earthquake Engineering (Beijing, China, October 2008, 12–17.
Jones, L. A., Champ, C. W., and Rigdon, S. E. (2001). The Performance of Exponentially Weighted Moving Average Charts with Estimated Parameters. Technometrics 43 (2), 156–167. doi:10.1198/004017001750386279
Klein, R., Ingman, D., and Braun, S. (2001). Non-stationary Signals: Phase-Energy Approach-Theory and Simulations. Mech. Syst. Signal Process. 15 (6), 1061–1089. doi:10.1006/mssp.2001.1398
Kohavi, R., and John, G. H. (1997). Wrappers for Feature Subset Selection. Artif. intelligence 97 (1-2), 273–324. doi:10.1016/s0004-3702(97)00043-x
Kusiak, A., and Verma, A. (2012). Analyzing Bearing Faults in Wind Turbines: a Data-Mining Approach. Renew. Energ. 48, 110–116. doi:10.1016/j.renene.2012.04.020
LeCun, Y., Bengio, Y., and Hinton, G. (2015). Deep Learning. nature 521 (7553), 436–444. doi:10.1038/nature14539
Lei, Y., Li, N., Lin, J., and Wang, S. (2013). Fault Diagnosis of Rotating Machinery Based on an Adaptive Ensemble Empirical Mode Decomposition. Sensors (Basel) 13 (1-2), 16950–16964. doi:10.3390/s131216950
Li, H., Deng, J., Feng, P., Pu, C., Arachchige, D. D. K., and Cheng, Q. (2021a). Short-Term Nacelle Orientation Forecasting Using Bilinear Transformation and ICEEMDAN Framework. Front. Energ. Res. 9, 780928. doi:10.3389/fenrg.2021.780928
Li, H., He, Y., Yang, H., Wei, Y., Li, S., and Xu, J. (2021b). Rainfall Prediction Using Optimally Pruned Extreme Learning Machines. Nat. Hazards 108 (1), 799–817. doi:10.1007/s11069-021-04706-9
Li, H., Xu, Q., He, Y., and Deng, J. (2018). Prediction of Landslide Displacement with an Ensemble-Based Extreme Learning Machine and Copula Models. Landslides 15 (10), 2047–2059. doi:10.1007/s10346-018-1020-2
Li, H., Xu, Q., He, Y., Fan, X., and Li, S. (2020). Modeling and Predicting Reservoir Landslide Displacement with Deep Belief Network and EWMA Control Charts: a Case Study in Three Gorges Reservoir. Landslides 17 (3), 693–707. doi:10.1007/s10346-019-01312-6
Liang, N. Y., Saratchandran, P., Huang, G. B., and Sundararajan, N. (2006). Classification of Mental Tasks from EEG Signals Using Extreme Learning Machine. Int. J. Neural Syst. 16 (1), 29–38. doi:10.1142/S0129065706000482
Liu, W., Gao, P., Yu, W., Qu, Z., and Yang, C. (2018). Quantum Relief Algorithm. Quan. Inf. Process. 17 (10), 1–15. doi:10.1007/s11128-018-2048-x
Mitchell, T. M. (1999). Machine Learning and Data Mining. Commun. ACM 42 (11), 30–36. doi:10.1145/319382.319388
Ouyang, T. (2021). Feature Learning for Stacked ELM via Low-Rank Matrix Factorization. Neurocomputing 448, 82–93. doi:10.1016/j.neucom.2021.03.110
Ouyang, T., He, Y., Li, H., Sun, Z., and Baek, S. (2019). Modeling and Forecasting Short-Term Power Load with Copula Model and Deep Belief Network. IEEE Trans. Emerg. Top. Comput. Intell. 3 (2), 127–136. doi:10.1109/tetci.2018.2880511
Ouyang, T., Kusiak, A., and He, Y. (2017). Modeling Wind-Turbine Power Curve: A Data Partitioning and Mining Approach. Renew. Energ. 102, 1–8. doi:10.1016/j.renene.2016.10.032
Pandey, P., Patel, V., George, N. V., and Mallajosyula, S. S. (2018). KELM-CPPpred: Kernel Extreme Learning Machine Based Prediction Model for Cell-Penetrating Peptides. J. Proteome Res. 17 (9), 3214–3222. doi:10.1021/acs.jproteome.8b00322
Peeters, C., Guillaume, P., and Helsen, J. (2018). Vibration-based Bearing Fault Detection for Operations and Maintenance Cost Reduction in Wind Energy. Renew. Energ. 116, 74–87. doi:10.1016/j.renene.2017.01.056
Peng, Z., Peter, W., and Chu, F. (2005). An Improved Hilbert–Huang Transform and its Application in Vibration Signal Analysis. J. sound vibration 286 (1-2), 187–205. doi:10.1016/j.jsv.2004.10.005
Qiu, X., Ren, Y., Suganthan, P. N., and Amaratunga, G. A. J. (2017). Empirical Mode Decomposition Based Ensemble Deep Learning for Load Demand Time Series Forecasting. Appl. Soft Comput. 54, 246–255. doi:10.1016/j.asoc.2017.01.015
Sbihi, A. (2007). A Best First Search Exact Algorithm for the Multiple-Choice Multidimensional Knapsack Problem. J. Comb. Optim 13 (4), 337–351. doi:10.1007/s10878-006-9035-3
Shen, X., Ouyang, T., Khajorntraidet, C., Li, Y., Li, S., and Zhuang, J. (2021a). Mixture Density Networks-Based Knock Simulator. IEEE/ASME Trans. Mechatronics, 1. 10.1109/TMECH.2021.3059775..
Shen, X., Ouyang, T., Yang, N., and Zhuang, J. (2021b). Sample-Based Neural Approximation Approach for Probabilistic Constrained Programs. IEEE Trans. Neural Networks Learn. Syst. doi:10.1109/tnnls.2021.3102323
Shen, X., and Raksincharoensak, P. (2021). Pedestrian-Aware Statistical Risk Assessment. IEEE Trans. Intell. Transportation Syst. doi:10.1109/tits.2021.3074522
Sun, Z., He, Y., Gritsenko, A., Lendasse, A., and Baek, S. (2020a). Embedded Spectral Descriptors: Learning the point-wise Correspondence Metric via Siamese Neural Networks. J. Comput. Des. Eng. 7 (1), 18–29. doi:10.1093/jcde/qwaa003
Sun, Z., Rooke, E., Charton, J., He, Y., Lu, J., and Baek, S. (2020b). Zernet: Convolutional Neural Networks on Arbitrary Surfaces via Zernike Local tangent Space Estimation. Computer Graphics Forum 39 (6), 204–216. doi:10.1111/cgf.14012
Tavner, P. J., Greenwood, D. M., Whittle, M. W. G., Gindele, R., Faulstich, S., and Hahn, B. (2012). Study of Weather and Location Effects on Wind Turbine Failure Rates. Wind Energy 16 (2), 175–187. doi:10.1002/we.538
Teng, W., Ding, X., Zhang, X., Liu, Y., and Ma, Z. (2016). Multi-fault Detection and Failure Analysis of Wind Turbine Gearbox Using Complex Wavelet Transform. Renew. Energ. 93, 591–598. doi:10.1016/j.renene.2016.03.025
Wang, H.-z., Li, G.-q., Wang, G.-b., Peng, J.-c., Jiang, H., and Liu, Y.-t. (2017). Deep Learning Based Ensemble Approach for Probabilistic Wind Power Forecasting. Appl. Energ. 188, 56–70. doi:10.1016/j.apenergy.2016.11.111
Wang, H. Z., Wang, G. B., Li, G. Q., Peng, J. C., and Liu, Y. T. (2016c). Deep Belief Network Based Deterministic and Probabilistic Wind Speed Forecasting Approach. Appl. Energ. 182, 80–93. doi:10.1016/j.apenergy.2016.08.108
Wang, L., Zhang, Z., Long, H., Xu, J., and Liu, R. (2016a). Wind Turbine Gearbox Failure Identification with Deep Neural Networks. IEEE Trans. Ind. Inform. 13 (3), 1360–1368.
Wang, L., Zhang, Z., Xu, J., and Liu, R. (2016b). Wind Turbine Blade Breakage Monitoring with Deep Autoencoders. IEEE Trans. Smart Grid 9 (4), 2824–2833.
Yan, R., Gao, R. X., and Chen, X. (2014). Wavelets for Fault Diagnosis of Rotary Machines: a Review with Applications. Signal. Process. 96, 1–15. doi:10.1016/j.sigpro.2013.04.015
Yang, B., Liu, R., and Chen, X. (2017). Fault Diagnosis for a Wind Turbine Generator Bearing via Sparse Representation and Shift-Invariant K-Svd. IEEE Trans. Ind. Inform. 23 (5), 91–99. doi:10.1109/tii.2017.2662215
Yang, W., Court, R., and Jiang, J. (2013). Wind Turbine Condition Monitoring by the Approach of SCADA Data Analysis. Renew. Energ. 53, 365–376. doi:10.1016/j.renene.2012.11.030
Yang, W., Liu, C., and Jiang, D. (2018). An Unsupervised Spatiotemporal Graphical Modeling Approach for Wind Turbine Condition Monitoring. Renew. Energ. 127, 230–241. doi:10.1016/j.renene.2018.04.059
Keywords: bearing failure, condition monitoring, deep belief network, EWMA control chart, SCADA data analysis
Citation: Li H, Deng J, Yuan S, Feng P and Arachchige DDK (2021) Monitoring and Identifying Wind Turbine Generator Bearing Faults Using Deep Belief Network and EWMA Control Charts. Front. Energy Res. 9:799039. doi: 10.3389/fenrg.2021.799039
Received: 21 October 2021; Accepted: 01 November 2021;
Published: 19 November 2021.
Edited by:
Xun Shen, Tokyo University of Agriculture and Technology, JapanCopyright © 2021 Li, Deng, Yuan, Feng and Arachchige. This is an open-access article distributed under the terms of the Creative Commons Attribution License (CC BY). The use, distribution or reproduction in other forums is permitted, provided the original author(s) and the copyright owner(s) are credited and that the original publication in this journal is cited, in accordance with accepted academic practice. No use, distribution or reproduction is permitted which does not comply with these terms.
*Correspondence: Jiahao Deng, amRlbmc1QGRlcGF1bC5lZHU=