 Lizhong Yao
 Qian Fan
 Lei Zhao1
- 1College of Physics and Electronic Engineering, Chongqing Normal University, Chongqing, China
- 2School of Mechanical Engineering, Sichuan University, Chengdu, China
- 3School of Big Data and Information Industry, Chongqing City Management College, Chongqing, China
Nowadays, it is very popular to employ genetic algorithm (GA) and its improved strategies to optimize neural networks (i.e., WNN) to solve the modeling problems of aluminum electrolysis manufacturing system (AEMS). However, the traditional GA only focuses on restraining the infinite growth of the optimal species without reducing the similarity among the remaining excellent individuals when using the exclusion operator. Additionally, when performing arithmetic crossover or Cauchy mutation, a functional operator that conforms to the law of evolution is not constructed to generate proportional coefficients, which seriously restricted the exploitation of the hidden potential in genetic algorithms. To solve the above problems, this paper adopts three new methods to explore the performance enhancement of genetic algorithms (EGA). First, the mean Hamming distance (H-Mean) metric is designed to measure the spatial dispersion of individuals to alleviate selection pressure. Second, arithmetic crossover with transformation of the sigmoid-based function is developed to dynamically adjust the exchange proportion of offspring. Third, an adaptive scale coefficient is introduced into the Gauss-Cauchy mutation, which can regulate the mutation step size in real time and search accuracy for individuals in the population. Finally, the EGA solver is employed to deeply mine the optimal initial parameters of wavelet neural network (EGAWNN). Moreover, the paper provides the algorithm performance test, convergence analysis and significance test. The experimental results reveal that the EGAWNN model outperforms other relevant wavelet-based forecasting models, where the RMSE in test sets based on EGAWNN is 305.72 smaller than other seven algorithms.
1 Introduction
The aluminum electrolysis industry consumes enormous energy, and its energy utilization rate is less than 50% (Gui et al., 2018). An effective way to achieve efficiency enhancement and consumption reduction is to determine the optimal operating parameters for maintaining the best condition of the electrolytic cell. However, it is necessary to establish a high-precision and stable prediction model for process energy consumption (Yang et al., 2019). And so far, the methods for predicting the energy consumption of aluminum electrolysis have been roughly divided into two categories (Wu et al., 2019). The first contains physical methods, which tracks the process of aluminum electrolysis based on the exact mathematical mechanism. Because there are many complex physical and chemical reactions inside aluminum electrolysis and unpredictable external interference, it is very difficult to obtain a precise system model through the process mechanism (Slowik and Kwasnicka, 2020). The other category includes data-driven methods, which can acquire the complex corresponding relationships between decision variables and performance indicators (Li et al., 2021a; Li, 2022a). This type of method does not need to know the complex mechanism of a manufacturing system, it performs learning and training only on a series of process data samples (Yao et al., 2019; Li, 2022b). Therefore, such a method is of noticeable value with broad practical applications in modeling algorithms for process manufacturing systems (Yi et al., 2018; Li et al., 2021b).
A wavelet neural network (WNN), as a universal function approximation model that is widely accepted in data-driven methods (Pauline and Zarita, 2019; Khelil et al., 2021), learns the same task with higher accuracy, a simpler structure and faster convergence speed compared with traditional neural networks (Guan et al., 2013). Song et al. (2016) proposed a wavelet-based scheme to generate the individual forecaster. Jha and Senroy (2018) used the wavelet ridge method to analyze the dynamic characteristics of the power system. Sabouri et al. (2017) adopted the orthogonal discrete wavelet transform (ODWT) to research the plasma electrolytic oxidation (PEO) of aluminum at various periods during the electrolysis process. A WNN has the potential to handle the issue of the AEMS modeling.
Nevertheless, the stochastic generation of the initial parameters in a WNN gives rise to the nonconvergence of the whole learning process and even major prediction errors, which hardly satisfy the modeling requirements of high accuracy and stability in an AEMS. There is a consistent trend in current research regarding the integration genetic algorithms into WNNs to adjust their weights and factors (Majeed et al., 2017; Peng and Xiang, 2020; Tian et al., 2020; Khelil et al., 2021). Furthermore, the combination of a GA and a WNN has diversified applications, such as calculating the greenhouse effects of aircraft cruises (Tian et al., 2020), adjusting the parameters used in a hybrid fuzzy wavelet neural network (Huang et al., 2018), and establishing the thermal error prediction models for machine tools (Li and Zhang, 2019). Compared with the traditional WNN, the model established by a GAWNN can overcome its weakness in obtaining relatively stable initial parameters.
There are two ways to further promote the accuracy of the prediction model. One is to seek breakthroughs from the structure of the WNN, the other is to overcome the premature deficiencies of GA (Tinos et al., 2018) that our studies looked at. Plus, almost all the modified measures revolve around three genetic operators (Song et al., 2019), which are the cores of evolution and determine the performance of the algorithm. Unfortunately, there are still three areas of anxiety that are worthy of our attention and resolution. First, most of the existing studies on the use of crowding selection to eliminate similar individuals are based on the Hamming distance between each individual in the population and the optimal individual (Li and Kou, 2002; Osuna and Sudholt, 2020). Li and Kou (2002) utilized the fitness-sharing method, by which individuals are measured with the Euclidean or Hamming distance (Prugel-Bennett and Tayarani-Najaran, 2012), to maintain population diversity. Although the above methods alleviate overcrowding, they simply curb the uncontrolled growth of certain particular species, and they cannot guarantee sufficient discreteness among advanced individuals. Second, the adaptive crossover principle (Shojaedini et al., 2019; Mishra and Bajpai, 2021; Sun et al., 2021), which can adjust its crossover rate in different fields based on the population fitness of every iteration, has been extensively reported. Although adaptive crossover reduces the adverse effect caused by an improper definition of the rate, its essence is still that of stochastic crossover. Its randomness of intersection inevitably increases the possibility of damaging good genes. Third, the Gauss-Cauchy mixture mutation, a type of the real-coded mutation, has been an investigative hotspot due to its local and global search abilities (Li et al., 2017a; Li et al., 2017b; Wu and Law, 2011). There are some mutation formulas combining the Gauss-Cauchy function that have been recommended in (Li et al., 2017b; Lha et al., 2018). However, the current studies mostly adopt the standard Cauchy function for mixing throughout the mutation process. That results in a relatively single range of variation generated by the mixed formula.
Based on the issues stated in above analyses, the measures utilized by this paper and innovations contained therein are mainly summarized as follows:
(1) To increase the dispersion of subpopulations and effectively avoid precocity, the presented scheme adopts the mean Hamming distance (H-Mean), which performs secondary selection from the perspective of superior offspring populations, to design the selection operator rather than a single Hamming distance.
(2) Considering that arithmetic crossover is essentially a linear combination of alleles, the proposed scheme uses it to mitigate the above negative effect. Moreover, by rotating the sigmoid function vertically with
(3) In order to improve the accuracy of local search by making the ranges of variation change dynamically with the iteration process, this paper introduces an adaptive scale coefficient γ into the Cauchy function to randomly set the change rate of the fitness of the iterative population. Therefore, the mutation steps can be updated in a timely manner, which will improve the time-variance and convergence rate of the algorithm.
Through the deep integration of the above three strategies, this paper further explores the hidden potential of genetic algorithms. The proposed EGA solver is employed to optimize the weights and factors of a WNN, which helps to establish an energy consumption model for an AEMS. The EGAWNN model overcomes the weaknesses of early convergence and poor search speed in the middle and late stages when the GA is applied to the wavelet network. Finally, the accuracy and improvement of the prediction model are verified through industrial experiments.
The remaining content of this paper is as follows. Section 2 presents the specific implementations of three enhanced strategies. Section 3 provides some standard numerical experiments as well as their results contained tables and figures. Section 4 overviews the design flow and convergence analysis of EGAWNN. An experiment based on a real-world industrial application of aluminum electrolysis is conducted and discussed through certain performance indices in Section 5. Section 6 gives a summary of the paper.
2 Enhanced genetic algorithms
A GA is an adaptive probability optimization technology based on biological genetics and evolution mechanisms. When a GA is used to solve optimization problems, premature convergence and evolutionary obstruction inevitably occur during the solving process. This paper tries to solve the above problems from the following three aspects.
First, taking the dispersion and diversity of the initial population into account, the offspring are selected based on the H-Mean criterion so that the newly generated individuals can crowd out similar parents. Second, a dynamic nonlinear arithmetic crossover based on the α-function is designed to ensure that the population has sufficient diversity in the early stages without destroying the excellent individuals in the later stages. Finally, an adaptive proportional coefficient is introduced into the Cauchy function to adjust the variation step size, which helps individuals move quickly towards the direction of the global optimum.
2.1 Crowding strategy based on the H-Mean metric
The proportional selection method in the standard genetic algorithm (SGA) may increase the number of individuals whose fitness values are close to those of others in the later period. The above phenomenon can result in the stagnation of the evolution of the population, or individuals with higher fitness values misleading the evolution direction of the population, which will cause the population to lose diversity and result in premature convergence problems (Amini and Hu, 2021).
Although the standard crowding method can keep a population diversified and relieve the congestion between the best individual and other excellent populations to some degree, spatial dispersion within an excellent population is difficult to be guaranteed. To address the problem, this study provides a crowding strategy through the ranking of the H-Mean values, for the selection of outstanding individuals with high fitness values and large population differences. This strategy maintains the dispersion of good subpopulations and restrains the endless growth of some superior species.
Figure 1 simulates the spatial dispersion of excellent subpopulations before and after employing the proposed crowding strategy. The two coordinate axes represent the two requirements of high fitness and high H-Mean values. There are good individuals with high fitness values in the large dotted circle above the black curve; the blue star represents the best individual with the highest fitness value in the current evolution; the yellow balls are overcrowded in the small red dotted circle, as seen in Figure 1A. The green balls are made up of two parts: One part contains the individuals with good dispersion in the excellent population; the other part is derived from changes in the remaining individuals by deleting the yellow balls with low H-Mean value, which are plotted in Figure 1B. It is easy to see that a higher H-Mean criterion-based crowding strategy can alleviate the congestion among outstanding individuals and thus increase population diversity.
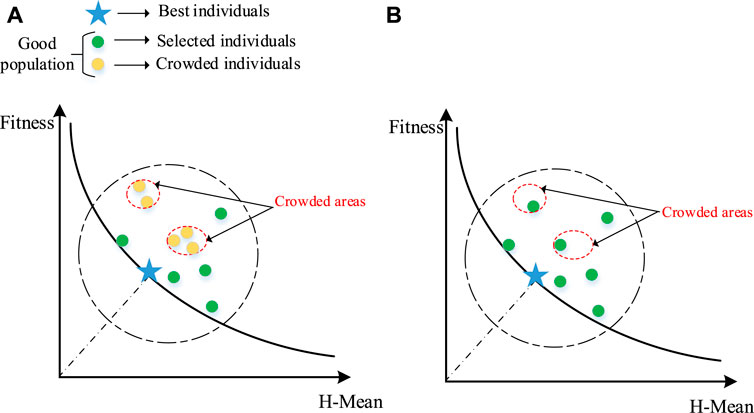
FIGURE 1. The simulative spatial dispersion of good subpopulations: (A) Before employing the crowding strategy based on H-Mean, (B) After employing the crowding strategy based on H-Mean.
Definition of the Hamming distance (denoted by
The basic calculation process is as follows: 1) The population is sorted into superior and inferior population according to the ranking of fitness; 2) In the superior population, the number on each gene site of individuals are kept four significant digits, and then their

TABLE 1. Pseudocode of utilizing the H-Mean metric for selection.
2.2 α-Function-based arithmetic crossover
A crossover operation is the main feature that distinguishes a GA from other evolutionary algorithms, and it is an important method for generating new individuals. The crossover operation of the SGA selects two individuals as objects, and then generates an intersection to exchange gene codes for producing subindividuals (Dang et al., 2016). The widely used adaptive crossover dynamically adjusts its crossing rate in accordance with the fitness values of the population involved in the evolution process. However, the position of a single-point or multipoint crossover is stochastic (Xu et al., 2018). The uncertainty of intersections raises the risk of destroying excellent genes, which may cause the algorithm to swing around the optimal solution at the end of a search, resulting in a state of convergence stagnation. In addition, it essentially serves the binary encoding genes, which causes part of the genetic information to lose when dealing with unrelated and multi-parameter real encoding. This paper adopts a nonlinear combination crossover to solve the above problem, as shown in Eq. 1.
where,
Because
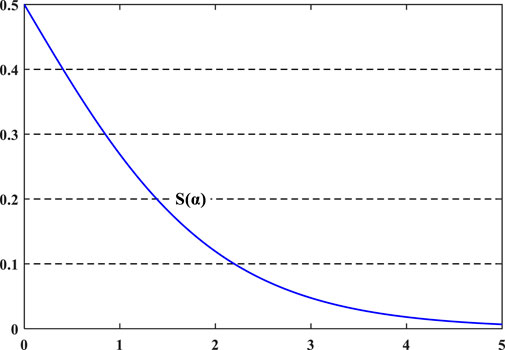
FIGURE 2.
Figure 3 indicates the differing principles of adaptive crossover and a-function arithmetic crossover, where we use different colors, i.e., orange, green, pink and blue, to distinguish the genes of different parents. We can see that Figure 3A has a different number of parents involved in each crossover from that in Figure 3B, which realizes the requirement of self-control because its crossover rate changes each iteration according to the population fitness. However, the intersection is stochastic, thus making the gens unordered. α-function arithmetic crossover is applicable to floating operations, and its working principle is shown in Figure 3B. Its essence is only a linear combination of the alleles of parental individuals, so no crossover points are required. It is worth mentioning that this paper improves the proportionality coefficient α in arithmetic crossover into a S(α) function related to t (the number of iterations). From Figure 2 and Eq. 3, at the beginning of the iterative process, t is small, resulting in S(α) converging to 0.5, and each offspring inherits half the genes from each parent, such as the orange and green genes in Figure 3B. Therefore, obtaining more diverse offspring from the above crossover increases the possibility of obtaining high-performing individuals. As the number of iterations increases, t becomes larger, which causes S(α) to be approximately 0, and the paternal genes remain largely unchanged, such as the pink and blue genes in Figure 3B. Small exchanges of parent alleles can increase the local optimization power of the algorithm. In this way, not only can the diversity of the population be maintained but the population also moves towards the direction of global convergence during later iterations without destroying the optimal individuals.
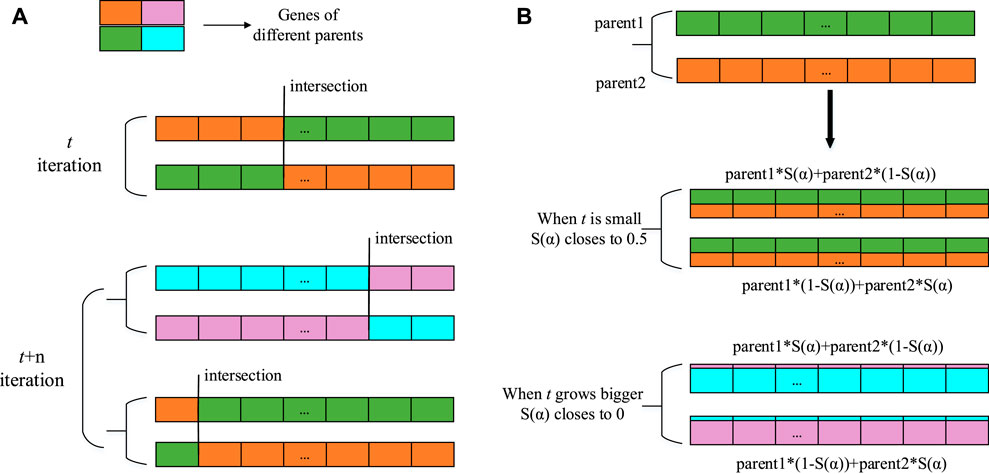
FIGURE 3. A contrast between different strategies under single-point crossover: (A) Adaptive crossover, (B) α-function arithmetic crossover.
2.3 Gaussian and adaptive Cauchy mutation (Gauss-
The mutation operator replaces the original gene with a new one to improve the local search ability of the GA (Das and Pratihar, 2021), as well as that of an auxiliary method for generating new individuals to increase population diversity. The real coding number in this paper is up to 108 bits, so it cannot achieve the expected effect if only single-point variation is used. If multipoint variation is employed, the randomness of the mutation value will produce a large uncorrelated disturbance, consequently damaging the original good genes. To solve the above problems, this paper introduces an adaptive proportional coefficient γ to design a hybrid mutation equation on the basis of the Gauss-Cauchy mutation. The designed equation produces related perturbations to change the original genes and overcome uncertainty. The range of the disturbance produced by the Cauchy function is instantly adjusted by changing the
The Gaussian distribution function is given as
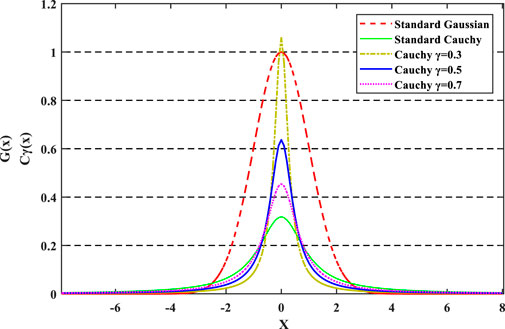
FIGURE 4. Comparison between the Gaussian and Cauchy distribution curves.
Figure 4 shows that the standard Gaussian function has a larger peak value at its origin and a shorter distribution on both sides than the other function. Gaussian mutation can produce disturbances close to the origin, and hence, it has a strong local development ability. Conversely, the Cauchy function has a smaller peak value at its origin and a longer distribution on both sides. Notably, the γ affects the features of the curvilinear distribution. Cauchy mutation can generate a disturbance with a wider range near the current mutated individual, making it easier to leap out of local optima. Combing the distribution features of the two functions, the hybrid mutation equation is introduced as follows (Wu and Law, 2011; Li et al., 2017a):
where
Since the
where t is the current iteration number and
It can be seen from Figure 4,
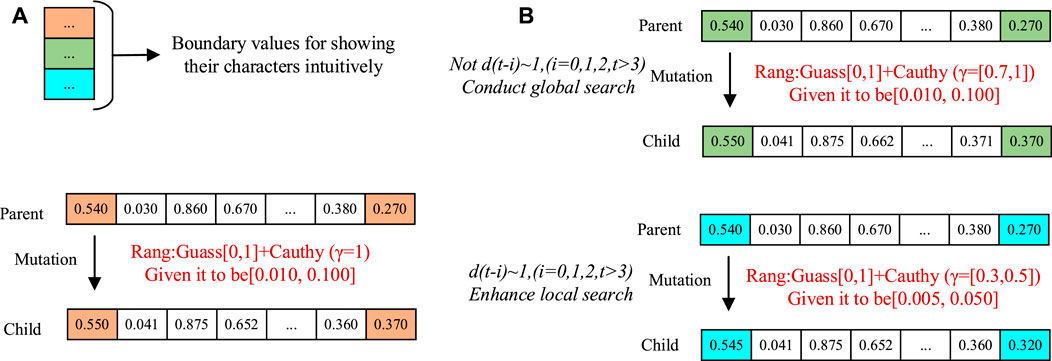
FIGURE 5. The mutation processes of different methods under real number coding: (A) Standard Guass-Cauchy mutation, (B) Gauss-γ Cauchy mutation.
The specific adjustment process is as below:
When
3 Numerical experiments and results
The above three methods in Section 2 are implemented in MATLAB R2020a with an Intel Core i5 2.00 GHz CPU. To highlight the performance differences of various methods, we adopt the Enhanced selection (ES), Enhanced crossover (EC), Enhanced mutation (EM) methods and Enhanced genetic algorithm (EGA) combining the above three strategies to compare with the Reference group (RG). Meanwhile, for evaluating the superiority and timeliness of the new algorithm, this paper also performs the following four comparison experiments, which were new strategies proposed by researchers on genetic algorithms in the past 2 years. The above four methods are as follows. 1) Priority based genetic algorithms (PGA) (Mishra and Bajpai, 2021) contained single supper parent algorithm (SSP); 2) PGA contained multi supper parents algorithm (MSP); 3) Biased random key genetic algorithm (BRK-GA) (Cicek and Ozturk, 2021): ELITE and NONELITE selection; BRK crossover; 4) Improved genetic algorithm (IGA) (Zhang et al., 2020): precedence preserving order-based crossover (POX) and adaptive neighborhood search mutation (ANS). All the genetic operators used in the above evolution processes of the functions are shown in Table 2. Bold operators in Table 2 emphasize the innovative part of the corresponding methods.
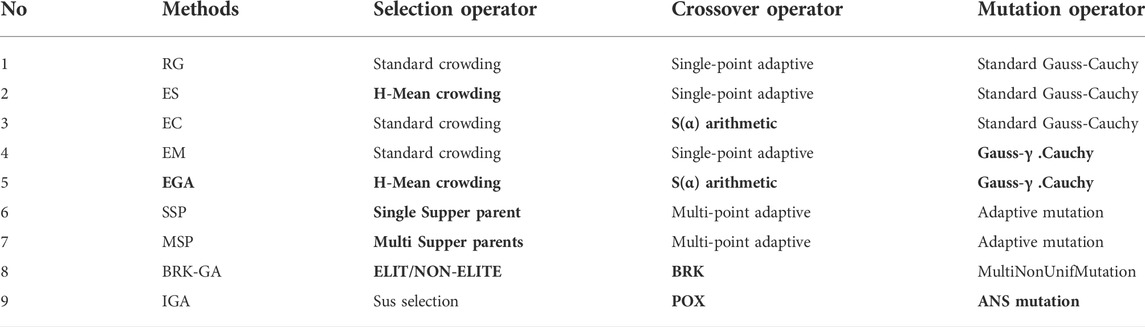
TABLE 2. The genetic operators contained in the nine designed experiments.
We used the above nine groups of comparative experiments to optimize the 6 standard single-objective test functions separately, i.e., function1, function2, function3, function4, function5, and function6, as shown in Eqs 7–12. The performance of the nine methods is measured by the objective function value (regarded as the fitness value of the optimal solution). Since the six test functions only have one actual value and one predicted value after each independent run, only the change of fitness is observed while analyzing the global indices and convergence traits. The population size is set to 200, and the maximum number of iterations is set to 500.
Function1. Global minimum
Function2. Global minimum
Function3. Global minimum
Function4. Global minimum
Function5. Global minimum
Function6. Global minimum
In Tables 3, 4, the global indices based on the best, mean, worst, standard deviation (SD), root mean square error (RMSE) and the p-value (from Wilcoxon matched-pairs rank sum test) of the fitness values for 100 runs are tabulated. The bold parts in the Tables 3, 4 indicate the performance index of the proposed method. The significance test is calculated with results of the EGA as the reference group and the single bound value a is set to 0.05. Those values approach perfect modeling results for all enhanced measures. Considering the adaptive Neighborhood Search in IGA requires variation points greater than five in hierarchical optimization, while the standard coding length of function2 is 2, so IGA is not used to solve the function2. A comparison of the results based on the performance measures in Tables 3, 4 is also plotted in Figures 6, 7. To obtain the convergence data based on the number of runs, Table 5 details the statistical results that fall into different fitness intervals during the 100 independent runs, in which EGA has been shown in bold. Though for relatively severe standards, 100 runs are not enough, the experienced number of runs is still to attain reasonable level of accuracy, which shows the optimization potential of the method proposed in this paper to improve the optimal solution of objective functions.
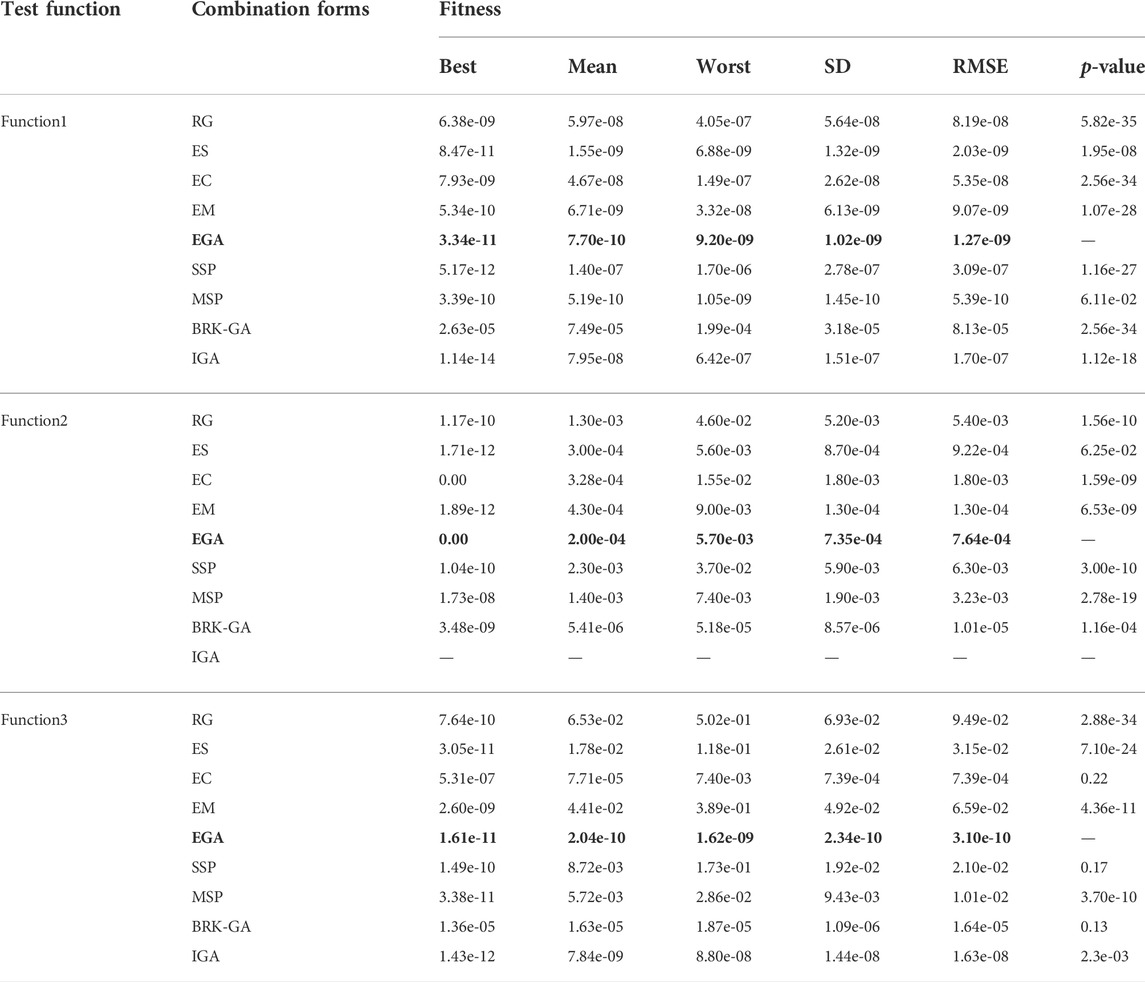
TABLE 3. Results of global indices for each evolutionary process of design experiments (1).
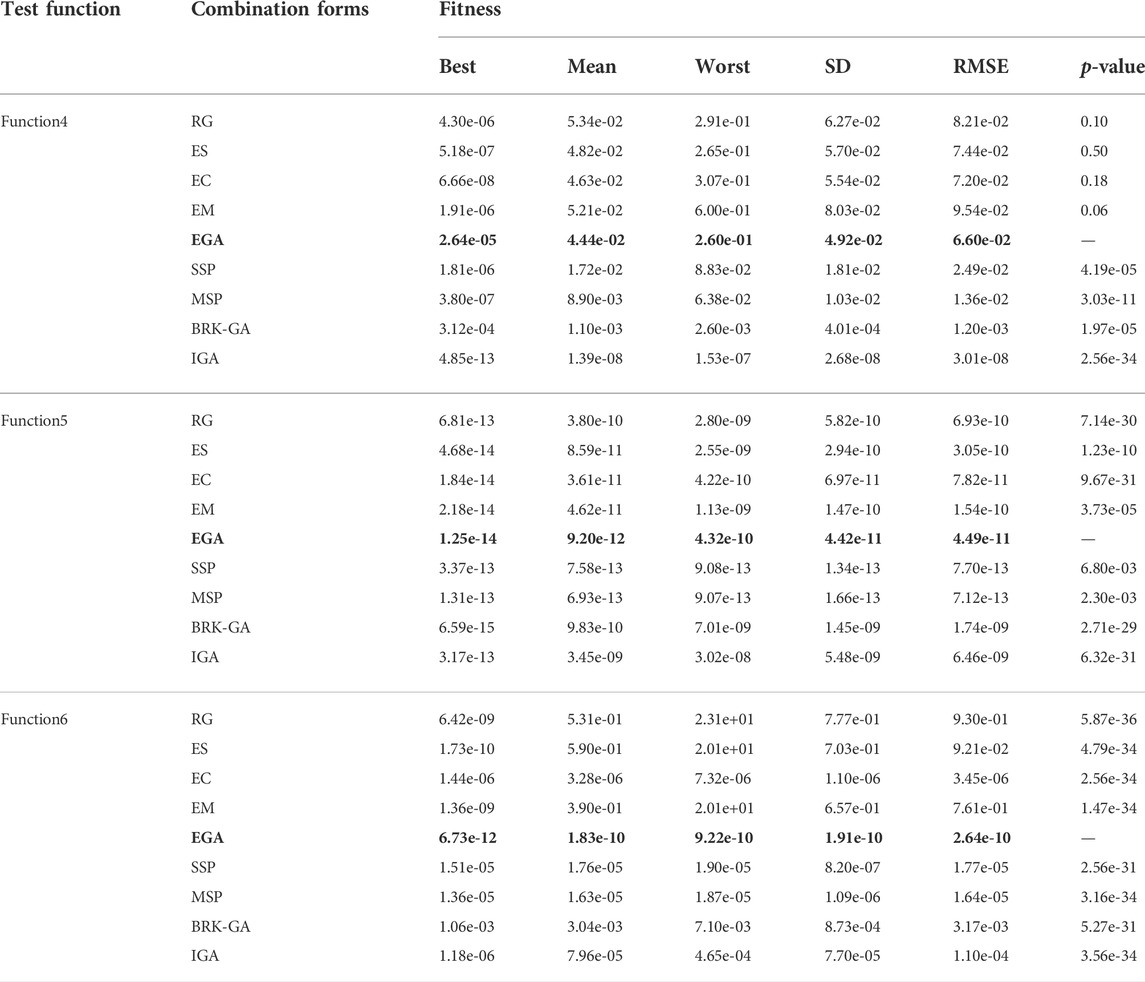
TABLE 4. Results of global indices for each evolutionary process of design experiments (2).
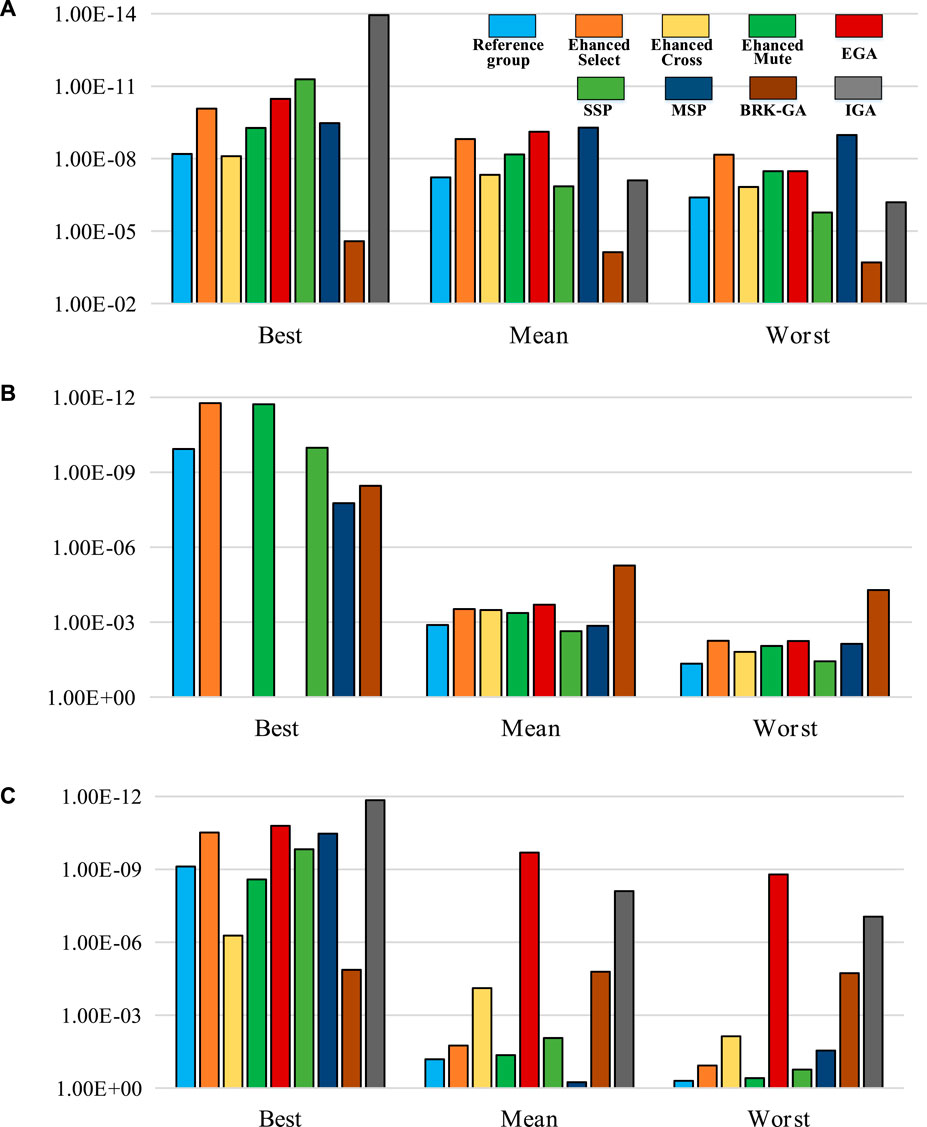
FIGURE 6. Comparison of the nine designed experiments on the basis of their best, mean, and worst fitness values for the six test functions (1): (A) funtion1, (B) funtion2 and (C) function3.
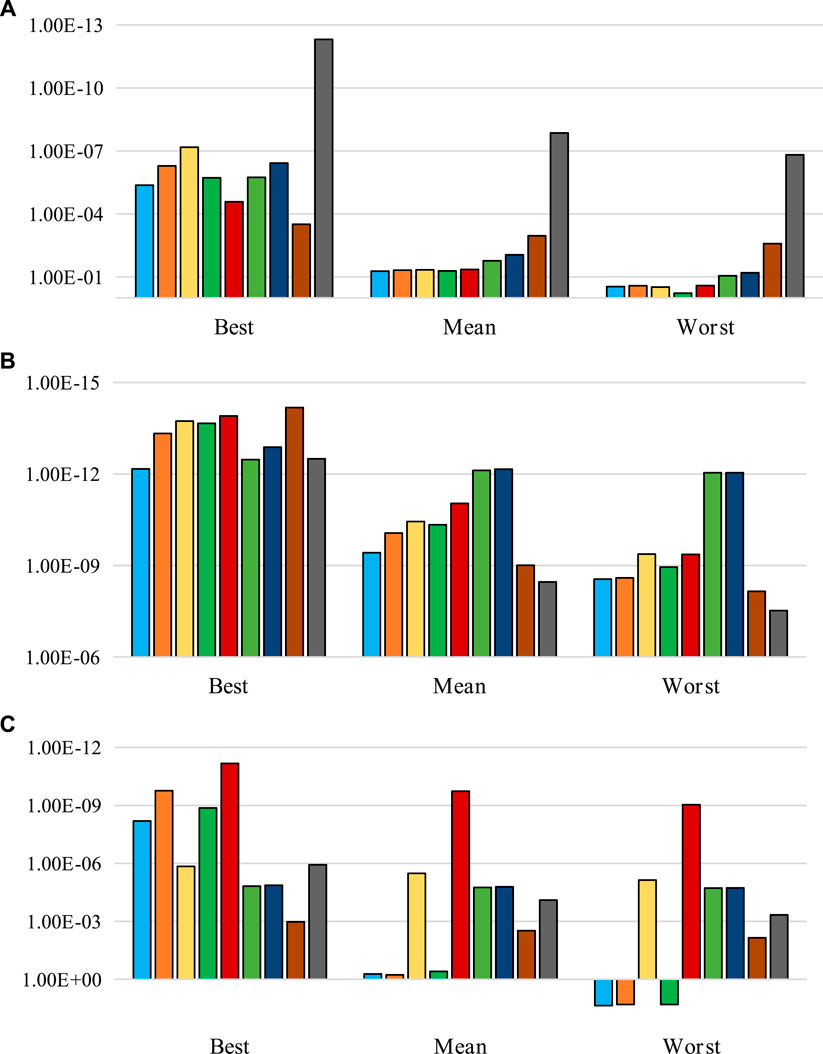
FIGURE 7. Comparison of the nine designed experiments on the basis of their best, mean, and worst fitness values for the six test functions (2): (A) funtion4, (B) funtion5 and (C) function6.
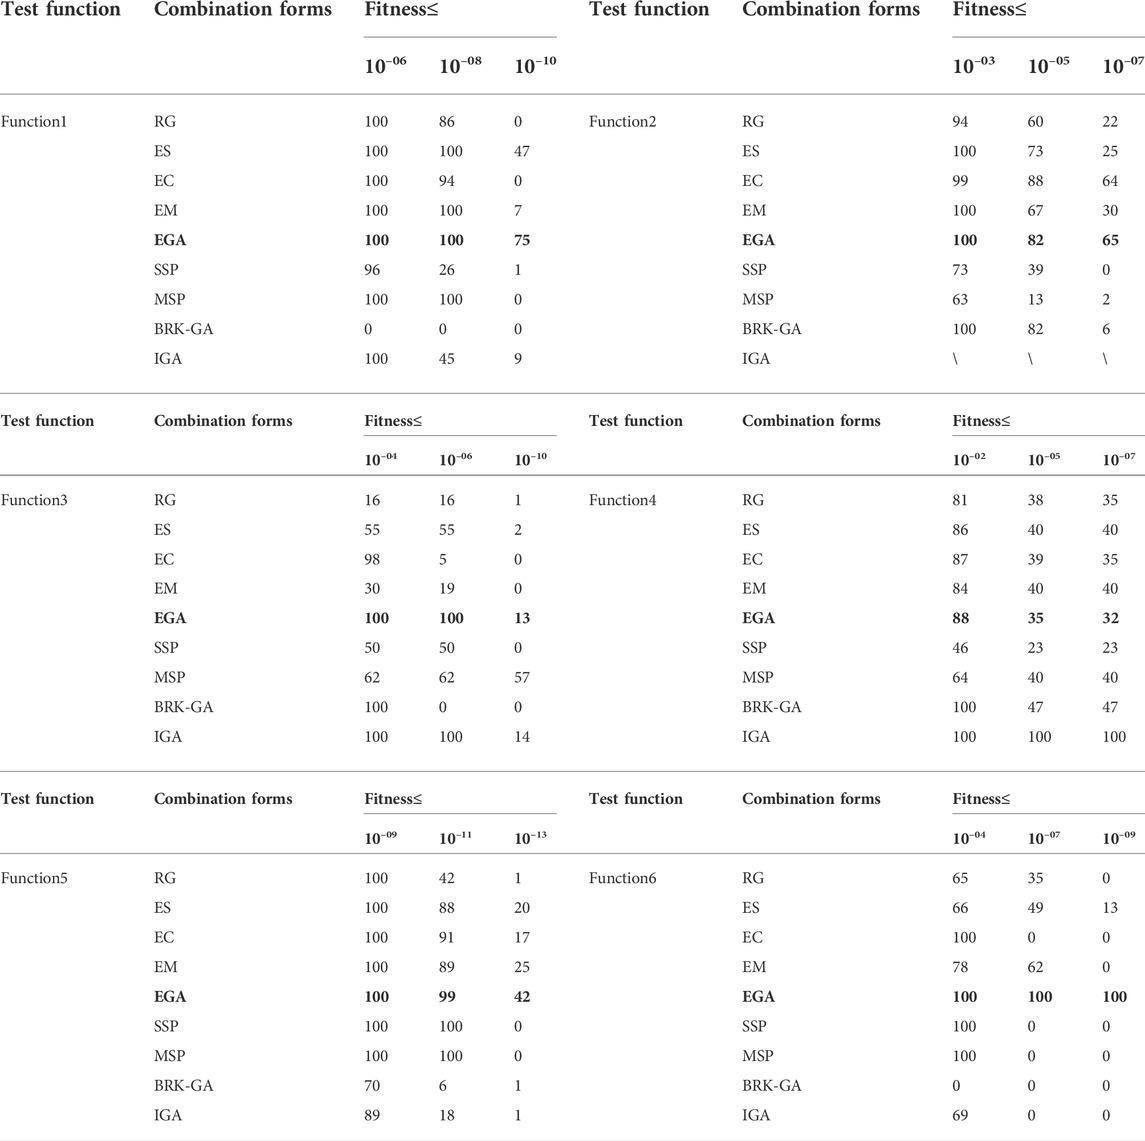
TABLE 5. Convergence analysis for each evolutionary process of design experiments.
Further analysis demonstrates that the three enhanced genetic operators and the EGA balance the distribution and convergence of the algorithm with the number of iterations. Taking function1 as an example in Table 3, the best values, mean values and worst values for designed experiments 1–5 (from EG to EGA) lie in the ranges of 10–09 to 10–11, 10–08 to 10–10, and 10–07 to 10–09, respectively. Only when using above methods to optimize function4, is the performance of EGA slightly worse than that of the Reference group.
Compared with other strategies proposed in the latest research, the EGA shows certain advantages in different aspects. Specifically, taking function1 as an example, the SD and RMSE of the EGA in Table 3 are smaller than those of SSP, which proves that EGA’s stability is higher. Taking function2 and 3 as examples, the performance of the EGA is better than the MSP algorithm in all aspects. In function4, for example, the best value in 100 runs is smaller than BRK-GA as shown in Figure 7. Compared with IGA, although the performance enhancement of EGA in function4 is average, the optimization effect of function5 and six are better as shown in Figure 7.
As long as p-value is less than α (0.05), the two results can be considered to be significantly different. According to the simulation results of rank sum test, except for the Enhanced crossover, SSP and BRK-GA in function3, which are greater than α, all the other results are far less than α. It can be said that the EGA proposed in this paper shows superiority over the latest algorithms.
These results show the effectiveness and superiority of the proposed EGA scheme in terms of accuracy and convergence.
4 Design and analysis of enhancement of genetic algorithms wavelet neural network
4.1 Wavelet neural network)
The WNN (Tinos et al., 2018) has always been deemed a wavelet-based functional linkage network or an extension of radial basis function (RBF) network containing its unique virtue, i.e., potent self-adaptability, and brief network structure. From the perspective of its structural form, the transfer neuron of a single hidden layer in the WNN is the Morlet wavelet windowing function, where the built-in function includes scaling and shifting arguments. Each neuron connects to its adjacent neuron via connection weights (Peng and Xiang, 2020). The basic topology of the WNN is shown in Figure 8.
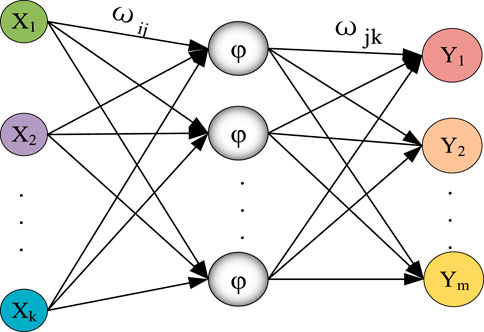
FIGURE 8. Fundamental topology of the WNN.
In Figure 8,
In this paper, the Morlet function is employed as
4.2 The design flow of enhancement of genetic algorithms wavelet neural network
Considering that the EGA has a strong global search ability and high search precision, optimizing the initial weights, as well as the scaling and shift factors of the WNN, with the EGA is expected to make improve the prediction performance of the network model. The enhanced algorithmic flow is shown in Figure 9.
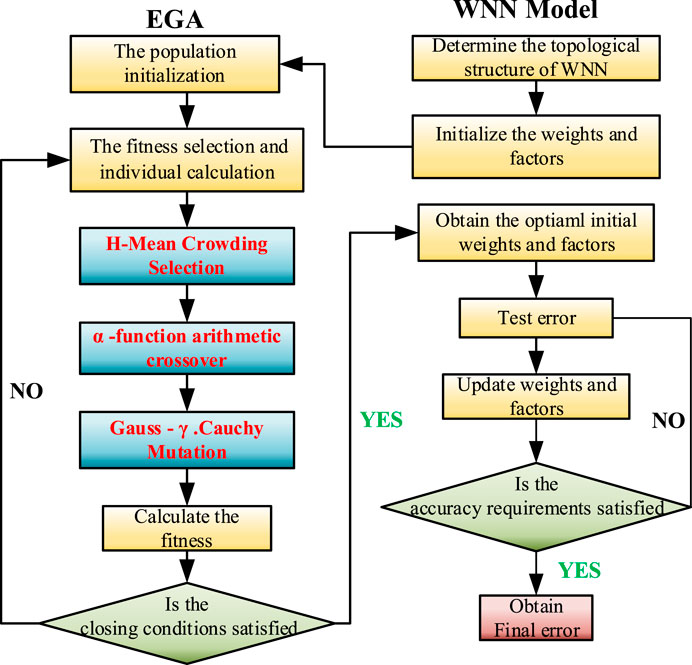
FIGURE 9. The flow chart of EGAWNN.
The specific implementation steps are as follows:
(1) The topology of the WNN (as described by Figure 8), where the wavelet basis function is the Morlet function, is used by the EGA algorithm to find
(2) Population initialization: determining the population size and the maximum number of iterations. Individuals are coded with real numbers, and each individual is composed of weights
(3) Fitness selection and individual calculation: the individual fitness value is obtained according to the training results produced by the WNN. If the fitness meets the accuracy requirements, the loop is terminated; otherwise, it proceeds to the next step. To avoid the absolute error being too small, the fitness function is given as follows:
where
(4) Genetic operations: i. Selection: The H-mean crowding strategy is carried out according to the pseudocode in Table 1 ii. Crossover: New individuals are generated by performing nonuniform arithmetical crossover on the selected parents, as shown in Eq. 3. iii. Mutation: The Gauss-r. Cauchy function is performed on the participating individuals, as shown in Eqs 4, 5.
(5) The loop is stopped, the current optimal solution is obtained, and the decoded weights
(6) The WNN is used for training; it is judged whether the network training process is finished according to the preset error and number of iterations. Finally,
(7) The trained model is used to test the samples, and the resulting performance indicators are analyzed.
4.3 The convergence analysis of enhancement of genetic algorithms wavelet neural network
The essence of EGAWNN is to optimize the initial parameters of the WNN through the EGA solver so that they are independent of the operation process. We only need to prove the convergence of the EGA and WNN. Regarding the convergence of the WNN, references (Jafarmadar, 2020), (Li et al., 1997; Liu et al., 2021) have given relevant proofs, so there is no need to repeat these steps. The convergence analysis of the EGA is given below.
Reference (Wang et al., 1996) deduced sufficient conditions for the convergence of the GA. The intensity function f of this paper is Eqs 14, 15, the problem space N is the code of the solution, and each point has a corresponding solution.
The class S existing in N satisfies the following derivation:
Because the crowding strategy in this paper divides a population into GoodChrom and BadChrom, the following derivation conforms to the above properties:
In summary, the EGA proposed by this article contains a conformance class S.
For each class
If
Because the elitist strategy is used in the selection process of this article,
The above derivation proves that regardless of the number of iterations,
If the conformance class is stable, the GA can converge to the optimal solution (Wang et al., 1996). Additionally, Pan (Pan, 1998) proved that adopting the elitist model can enhance the stability of the algorithm, and this model makes the SGA easily converge to the global optimum with a probability of one in the end. All of the above factors certify that the EGA is convergent.
5 An industrial experiment regarding aluminum electrolysis
5.1 Experimental objects and model parameters
A new-type aluminum cell, combined with a perforated anode and a heteromorphic cathode, is used to test the reliability of the EGAWNN solver, as shown in Figure 10, where W represents the DC energy consumption per ton of aluminum, the perforated anode has multiple holes built into it to allow air bubbles to escape and the heteromorphic cathode can reduce molten aluminum fluctuations by optimizing cathode structure.
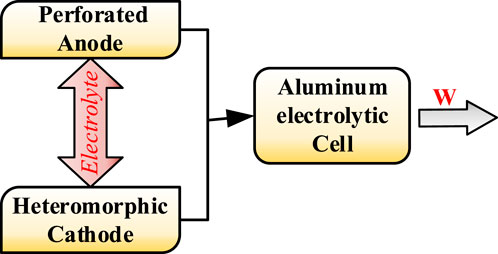
FIGURE 10. The core structure of the new aluminium electrolysis equipment.
Modern aluminum electrolysis devices are complex process equipment with multiphase and multifield interactions (Gui et al., 2018). There are diversified physical and chemical changes inside these devices, as well as frequent exchanges of raw materials, energy and labor information with the external environment. When modeling the energy consumption of aluminum electrolysis using the traditional WNN, the structure is unstable due to the stochastic determination of the initial parameters, which may lead to a large forecasting error. The proposed EGAWNN solver can mine the best initial weights and factors and thereby increase the accuracy and authenticity of the prediction results.
Considering the experiences of expert and the impact of the real process on the DC energy consumption of an aluminum electrolyzer, we select the following nine effective decision parameters: the series current (A), molecular ratio (1), aluminum level (cm), electrolyte level (cm), cell temperature (◦C), aluminum output (kg), daily consumption of fluoride salt (kg), NB times (s), and cell voltage (mV) (Tai-Fu et al., 2014). Based on the computer measurement and control system of Chongqing Tiantai Aluminum Co., Ltd. In Southwest China, the daily reported data of the electrolytic cell are collected, and 773 groups of data samples are obtained, as shown in Table 6.
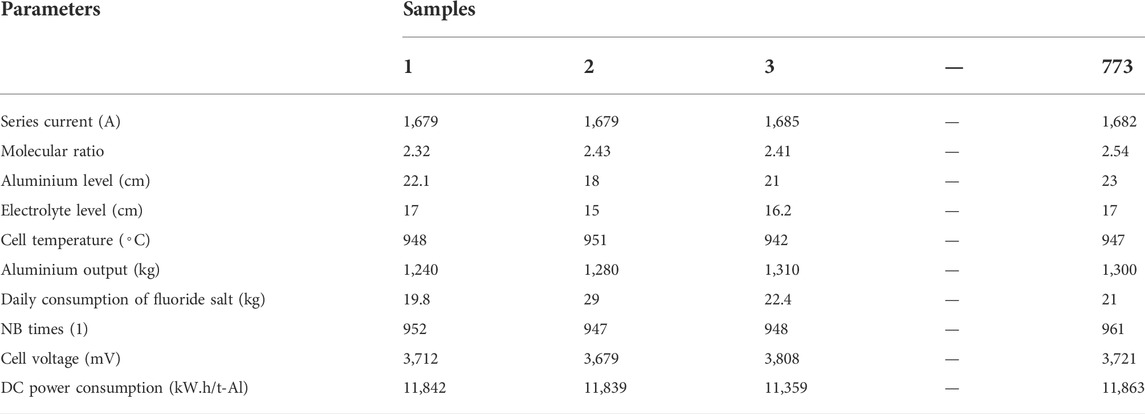
TABLE 6. Data samples of aluminium electrolytic cell.
5.2 The analysis of the experimental results based on enhancement of genetic algorithms wavelet neural network
The 773 groups of aluminum electrolysis data samples in Table 6 are assigned to the training group (n = 700) and test group (n = 73). The inputs are the nine selected decision parameters, and the output is the unit DC power consumption. When the number of hidden layers is too small, the error rate of the predicted output may be too large. When the number of hidden layers is 9, the errors are reduced to a small amount. Therefore, the wavelet network structure is 9-9-1. Thus, it can be concluded that the dimensions of the state variable in EGAWNN are 9 × 9 + 1 × 12 + 1 × 12 + 1 × 12 = 118. In this algorithm, the selection rate ηs is 0.87; the number of parents for crossover ηc is three; the number of mutation ηm individuals is two; the population size N is 40; the maximum number of iterations (MAXGEN) is 100; the learning rate of the WNN lr1 is 0.01, and lr2 is 0.001; the adjustment rate is 1.04; and the wavelet basis function is the Morlet function.
To prove the validity of the presented algorithm, under the same experimental samples and simulation platform, MATLAB R2020a (CPU: RTMi5-1038NG7; RAM: 15.8 GB; CPU: 2.00 GHz), the WNN, GAWNN, particle swarm optimized wavelet neural network (SOWNN), the four new algorithms mentioned in Section 3 optimized the WNN(SSPWNN, MSPWNN, BRK-GAWNN, and IGAWNN) and EGAWNN are separately used to model the energy consumption of the aluminum electrolytic tank, helping obtain contrastive experimental results.
Figure 11 visually shows the fitting effect of the real process energy consumption based on the above-mentioned eight modeling techniques. The performance ranking of process energy modeling effect from excellent to poor is as follows: EGAWNN, IGAWNN/BRK-GAWNN, MSPWNN, SSPWNN, GAWNN, PSOWNN, and WNN, where the fitting effect of IGAWNN and BRK-GAWNN is close. Overall, the prediction performance of EGAWNN is better than other models, which proves that this approach is feasible to further develop the modeling capabilities of the GAWNN.
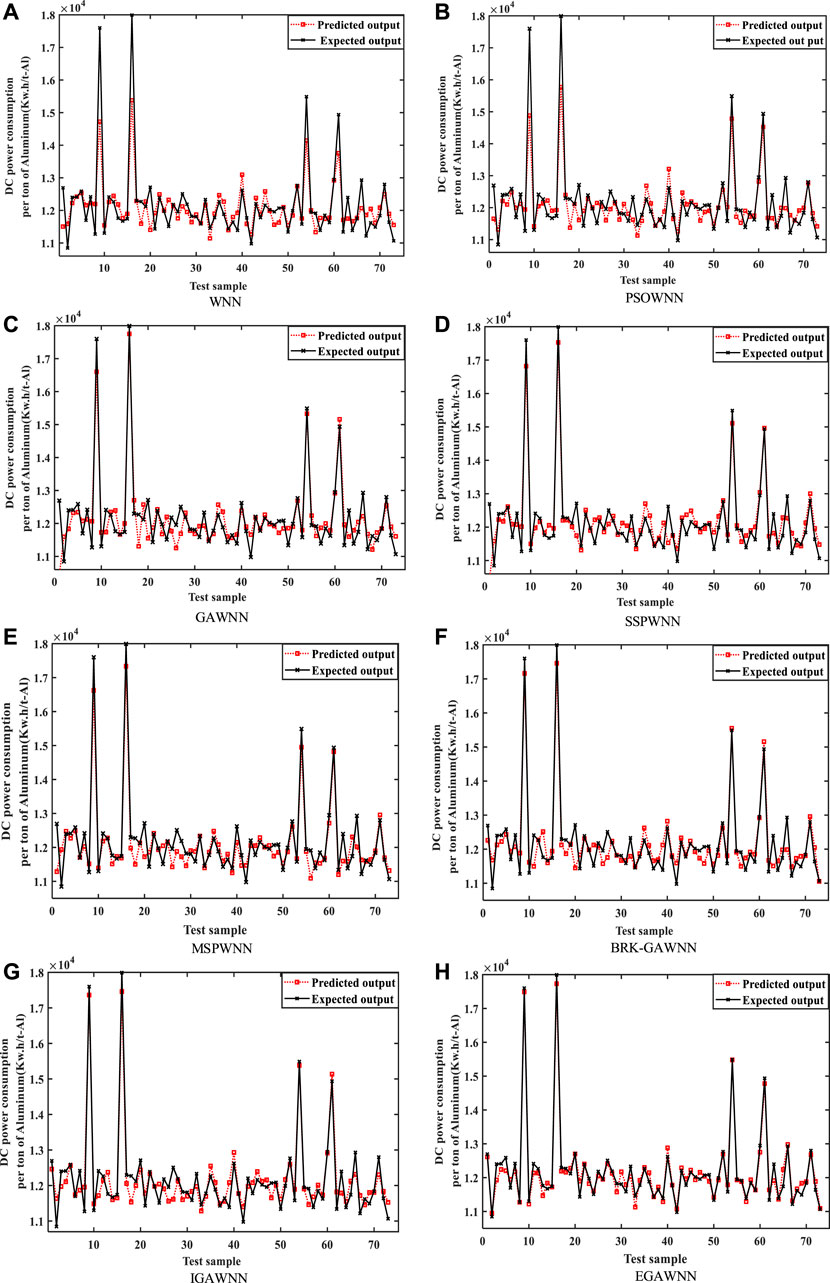
FIGURE 11. The prediction outputs in terms of DC power consumption based on: (A) WNN, (B) PSOWNN, (C) GAWNN, (D) SSPWNN, (E) MSPWNN, (F) BRK-GAWNN, (G) IGAWNN, and (H) EGAWNN.
The EGAWNN uses three enhanced operators, i.e., the H-Mean selection strategy, a new crossover function and an adaptive proportional coefficient γ into the Cauchy mutation, to mine the optimal parameter combination inside the model, which greatly enhances the convergence and the prediction accuracy of the built model. Based on the above analysis and Figure 12, EGAWNN has a lower relative error rate and better predictive performance than the other seven models, especially on some of the data with large fluctuations. The above analysis also shows that EGAWNN has good stability.
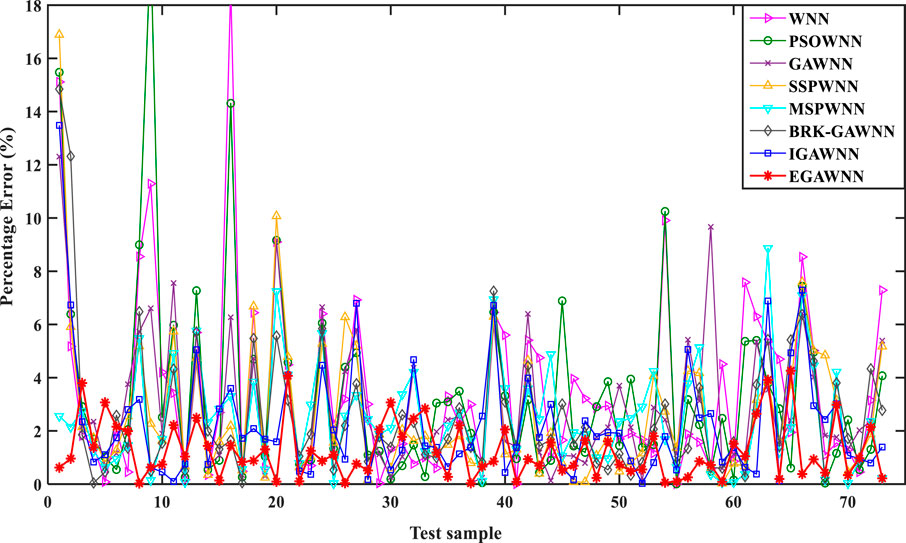
FIGURE 12. A comparison of the relative error percentages yielded by different models.
Table 7 compares the indicative data of each energy consumption model, for which 6 regression evaluation indicators, significance tests and algorithmic complexity metrics are listed, including the Maximum, Minimum, Mean, error sum of squares (SSE), mean square error (MSE), and RMSE. In addition, we carry out an analysis of algorithmic complexity and perform hypothesis testing based on the Wilcoxon matched-pairs signed-ranks test, where the significance test is calculated with the prediction results of EGAWNN as the reference group, and the single bound value α is set to 0.1, as shown in Table 7. The bold part in the table highlights the performance of the proposed method.
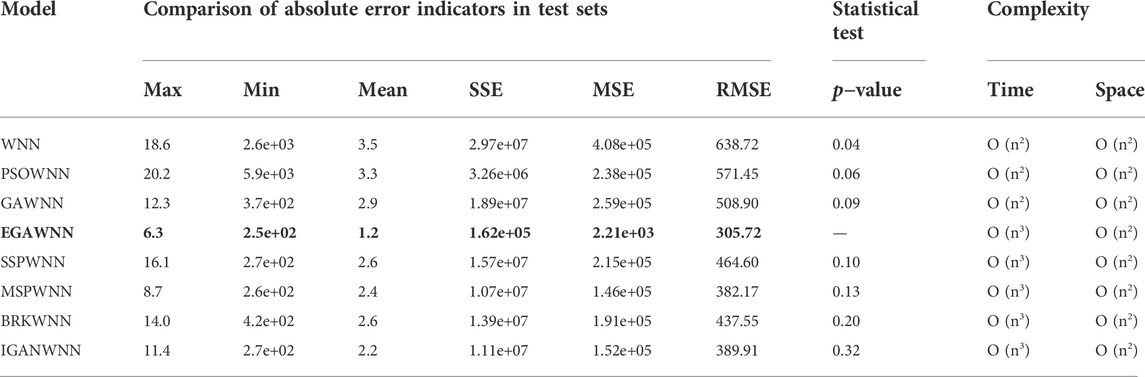
TABLE 7. Relevant performance indices yielded by different models.
According to the numerical results in Table 7, it can be seen that the absolute error indicators of EGAWNN are obviously lower than those of WNN, GAWNN and PSOWNN, and slightly better than those of SSPWNN, MSPWNN, BRK-GAWNN, and IGAWNN. From the perspective of algorithmic complexity, compared with GAWNN control groups, the time complexity of EGAWNN increases due to secondary sorting in the selection operation of the EGA. However, this small difference does not affect the feasibility of the algorithm. The above results prove that the method proposed in this paper has certain modeling advantages over other methods.
To avoid the accidental influence of the original randomized parameters on the model evaluation, this algorithm conducts 20 independent repeated experiments on each model. Then, the relevant performance indicators are calculated based on the experimental results, including the mean absolute error (MAE), the mean relative error (MRE), the correlation (R) (Li W. et al., 2017) and the best population fitness value. Figure 13 shows the favorable stability of the energy consumption model based on EGAWNN in the form of boxplots. Simultaneously, compared with the SGA, although the SSP, MSP, BRK-GA IGA, and EGA all improves the best fitness value of the population, EGA’s effect is more obvious. These results verify the advantage and validity of the EGA, which can deeply mine the predictive potential of the model by finding the optimal initial parameter combination of the energy consumption model. Meanwhile, the limitation of the proposed method in this paper for industrial production is that the input parameters of the model need to be collected continuously.
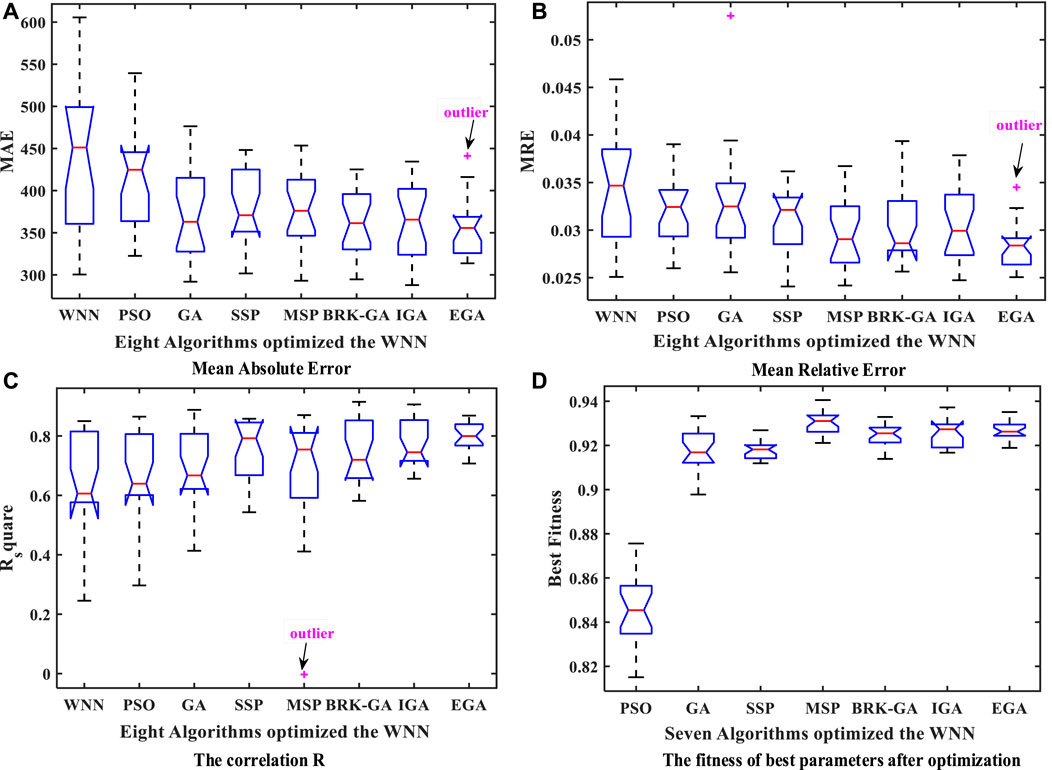
FIGURE 13. Boxplots of related performance indicators for 20 repeated tests: (A) Mean absolute error, (B) Mean relative error, (C) The correlation R and (D) The fitness of best parameters after optimization.
6 Conclusion
To obtain a high-precision energy consumption model for an AEMS, this study presents a novel framework based on a WNN and the EGA. In the EGAWNN algorithm, there are three main improvements, as follows:
(1) The H-Mean metric is developed to maintain the discreteness of the crowding strategy and is effectively applied to prevent premature convergence.
(2) A new sigmoid-based function S(α) is designed to update the nonuniform arithmetic crossover operation by setting intersections regularly.
(3) An adaptive proportional coefficient γ is introduced into the Gauss-Cauchy mutation to flexibly adjust the mutation step size.
A series of numerical experiments are performed, and these prove the efficacy of the proposed scheme. The algorithm has good potential to be exploited as an alternate, accurate and robust computing framework for building prediction models in various complex systems. However, it is worth highlighting here that the EGA is restricted to obtaining only the initial weights and factors of the WNN. In the future, we will explore the integration of the EGA into the internal topology structure of the WNN during every training process.
Data availability statement
The original contributions presented in the study are included in the article/supplementary material, further inquiries can be directed to the corresponding author.
Author contributions
Conceptualization, LY and QF; methodology, LY and QF.; software, QF and YL; validation, LY; formal analysis, LZ, LY, and QF; data curation, LZ and QM; writing—original draft preparation, LY and QF; writing—review and editing, YL and QM; visualization, LY and QF All authors have read and agreed to the published version of the manuscript.
Funding
This work is supported by the Foundation Program of Chongqing Normal University (No. 22XLB014), the Science and Technology Research Program of Chongqing Municipal Education Commission (Nos KJQN202200531 and KJQN202103306).
Conflict of interest
The authors declare that the research was conducted in the absence of any commercial or financial relationships that could be construed as a potential conflict of interest.
Publisher’s note
All claims expressed in this article are solely those of the authors and do not necessarily represent those of their affiliated organizations, or those of the publisher, the editors and the reviewers. Any product that may be evaluated in this article, or claim that may be made by its manufacturer, is not guaranteed or endorsed by the publisher.
Abbreviations
AEMS, Aluminum electrolysis manufacturing system; ANS, Adaptive neighborhood search; BRK-GA, Biased random key genetic algorithm; EC, Enhanced crossover; EGA, Enhanced genetic algorithm; EM, Enhanced mutation; ES, Enhanced selection; GA, Genetic algorithm; IGA, Improved genetic algorithm; MSP, Multi Supper parent; POX, Preserving order-based crossover; RG, Reference group; RMSE, Root mean square error; SD, Standard deviation; SGA, Standard genetic algorithm; SSP, Single supper parent; WNN, Wavelet neural network.
References
Amini, F., and Hu, G. (2021). A two-layer feature selection method using genetic algorithm and elastic net. Expert Syst. Appl. 166, 114072. doi:10.1016/j.eswa.2020.114072
Cicek, Z, and Ozturk, Z. K. (2021). Optimizing the artificial neural network parameters using a biased random key genetic algorithm for time series forecasting. Appl. Soft Comput. 102 (6), 107091. doi:10.1016/j.asoc.2021.107091
Dang, D. C., Friedrich, T., Ktzing, T, Krejca, M. S., Sutton, A. M., Oliveto, P. S., et al. (2016). Escaping local optima using crossover with emergent diversity. IEEE Trans. Evol. Comput. 22 (3), 484–497. doi:10.1109/tevc.2017.2724201
Das, A. K., and Pratihar, D. K. (2021). Solving engineering optimization problems using an improved real-coded genetic algorithm (irga) with directional mutation and crossover. Soft Comput. 25, 5455–5481. doi:10.1007/s00500-020-05545-9
Guan, C., Luh, P. B., Michel, L. D., Wang, Y., and Friedland, P. B. (2013). Very short-term load forecasting: Wavelet neural networks with data pre-filtering. IEEE Trans. Power Syst. 28 (1), 30–41. doi:10.1109/tpwrs.2012.2197639
Gui, W. H., Yue, W. C., Xie, Y. F., Zhang, H. L., and Yang, C. H. (2018). A review of intelligent optimal manufacturing for aluminum reduction production. Acta Autom. Sin. 44 (11), 1957.
Huang, W., Oh, S. K., and Pedrycz, W. (2018). Hybrid fuzzy wavelet neural networks architecture based on polynomial neural networks and fuzzy set/relation inference-based wavelet neurons. IEEE Trans. Neural Netw. Learn. Syst. 29 (8), 3452–3462. doi:10.1109/TNNLS.2017.2729589
Jafarmadar, S. (2020). Numerical investigation and prediction of effects of applying anatase tio2 nanoparticle on performance and emissions of ci engine by using wnn-ga. J. Clean. Prod. 267 (10), 122130. doi:10.1016/j.jclepro.2020.122130
Jha, R., and Senroy, N. (2018). Wavelet ridge technique based analysis of power system dynamics using measurement data. IEEE Trans. Power Syst. 33 (4), 4348–4359. doi:10.1109/tpwrs.2017.2783347
Khelil, K., Berrezzek, F., and Bouadjila, T. (2021). Ga-based design of optimal discrete wavelet filters for efficient wind speed forecasting. Neural comput. Appl. 32 (16), 4373–4386. doi:10.1007/s00521-020-05251-5
Lha, C., Jhd, B., Jrw, B., and Ez, A. (2018). A hyper-heuristic approach to automated generation of mutation operators for evolutionary programming - sciencedirect. Appl. Soft Comput. 62, 162–175.
Li, M. Q., and Kou, J. (2002). Coordinate multi-population genetic algorithms for multi-modal function optimization. Acta Autom. Sin. 28 (8), 497–504.
Li, L. W. B., and Zhang, Y. (2019). Modeling for cnc machine tool thermal error based on genetic algorithm optimization wavelet neural networks. J. Mech. Eng. 55 (21), 215–220.
Li, Y., Zhang, B., and Cao, C. (1997). Wavelet neural network and its structural design method. Pattern Recognit. Artif. Intell. 10 (3), 197–205.
Li, C., Zhang, N., Lai, X., Zhou, J., and Xu, Y. (2017). Design of a fractional-order pid controller for a pumped storage unit using a gravitational search algorithm based on the cauchy and Gaussian mutation. Inf. Sci. 396, 162–181. doi:10.1016/j.ins.2017.02.026
Li, C., Mao, Y., Zhou, J., Zhang, N., and An, X. (2017). Design of a fuzzy-pid controller for a nonlinear hydraulic turbine governing system by using a novel gravitational search algorithm based on cauchy mutation and mass weighting. Appl. Soft Comput. 52, 290–305. doi:10.1016/j.asoc.2016.10.035
Li, H., Deng, J., Yuan, S., Feng, P., and Arachchige, D. (2021). Monitoring and identifying wind turbine generator bearing faults using deep belief network and EWMA control charts. Front. Energy Res. 9, 799039. doi:10.3389/fenrg.2021.799039
Li, H., Deng, J., Feng, P., Pu, C., Arachchige, D., and Cheng, Q. (2021). Short-Term nacelle orientation forecasting using bilinear transformation and ICEEMDAN framework. Front. Energy Res. 9, 780928. doi:10.3389/fenrg.2021.780928
Li, W., Kong, D., and Wu, J. (2017). A novel hybrid model based on extreme learning machine, k-nearest neighbor regression and wavelet denoising applied to short-term electric load forecasting. Energies 10 (5), 694–710. doi:10.3390/en10050694
Li, H. (2022). Short-Term wind power prediction via spatial temporal analysis and deep residual networks. Front. Energy Res. 10, 920407. doi:10.3389/fenrg.2022.920407
Li, H. (2022). SCADA data based wind power interval prediction using LUBE-based deep residual networks. Front. Energy Res. 10, 920837. doi:10.3389/fenrg.2022.920837
Liu, J. W., Zuo, F. L., Guo, Y. X., Li, T. Y., and Chen, J. M. (2021). Research on improved wavelet convolutional wavelet neural networks. Appl. Intell. (Dordr). 51, 4106–4126. doi:10.1007/s10489-020-02015-5
Majeed, K., Masood, Z., Samar, R., and Raja., M. (2017). A genetic algorithm optimized Morlet wavelet artificial neural network to study the dynamics of nonlinear Troesch’s system. Appl. Soft Comput. 56, 420–435. doi:10.1016/j.asoc.2017.03.028
Mishra, R., and Bajpai, M. K. (2021). A priority based genetic algorithm for limited view tomography. Appl. Intell. (Dordr). 51 (2), 6968–6982. doi:10.1007/s10489-021-02192-x
Osuna, E. C., and Sudholt, D. (2020). Runtime analysis of crowding mechanisms for multimodal optimization. IEEE Trans. Evol. Comput. 24 (3), 581–592. doi:10.1109/tevc.2019.2914606
Pauline, Z., and Zarita, O. (2019). Optimizing wavelet neural networks using modified cuckoo search for multi-step ahead chaotic time series prediction. Appl. Soft Comput. 80, 374–386. doi:10.1016/j.asoc.2019.04.016
Peng, Y., and Xiang, W. (2020). Short-term traffic volume prediction using ga-bp based on wavelet denoising and phase space reconstruction. Phys. A Stat. Mech. its Appl. 549, 123913. doi:10.1016/j.physa.2019.123913
Prugel-Bennett, A., and Tayarani-Najaran, M.-H. (2012). Maximum satisfiability: Anatomy of the fitness landscape for a hard combinatorial optimization problem. IEEE Trans. Evol. Comput. 16 (3), 319–338. doi:10.1109/tevc.2011.2163638
Sabouri, M., Khoei, S., and Neshati, J. (2017). Plasma current analysis using discrete wavelet transform during plasma electrolytic oxidation on aluminum. J. Electroanal. Chem., 79–87. doi:10.1016/j.jelechem.2017.03.035
Shojaedini, R. S. E., Majd, M, and Safabakhsh, R. (2019). Novel adaptive genetic algorithm sample consensus. Appl. Soft Comput. 77, 635–642. doi:10.1016/j.asoc.2019.01.052
Slowik, A., and Kwasnicka, H. (2020). Evolutionary algorithms and their applications to engineering problems. Neural comput. Appl. 32 (16), 12363–12379. doi:10.1007/s00521-020-04832-8
Song, L., Peng, W., and Goel, L. (2016). A novel wavelet-based ensemble method for short-term load forecasting with hybrid neural networks and feature selection. IEEE Trans. Power Syst. 31 (3), 1788–1798. doi:10.1109/tpwrs.2015.2438322
Song, Y. Y., Wang, F. L., and Chen, X. X. (2019). An improved genetic algorithm for numerical function optimization. Appl. Intell. (Dordr). 49, 1880–1902. doi:10.1007/s10489-018-1370-4
Sun, J., Liu, X., Bck, T., and Xu, Z. (2021). Learning adaptive differential evolution algorithm from optimization experiences by policy gradient. IEEE Trans. Evol. Comput. 25 (4), 666–680. doi:10.1109/tevc.2021.3060811
Tai-Fu, L. I., Yao, L. Z., Jun, Y. I., Wen-Jin, H. U., Ying-Ying, S. U., and Jia, W. (2014). Improved ukfnn based on square root filter and strong tracking filter for dynamic evolutionary modeling of aluminium reduction cell. Acta Autom. Sin. 40 (3), 522–530.
Tian, Y., Ma, L., Yang, S., and Wang, Q. (2020). A methodology for calculating greenhouse effect of aircraft cruise using genetic algorithm-optimized wavelet neural network. Complexity, 7141320. doi:10.1155/2020/7141320
Tinos, R., Liang, Z., Chicano, F., and Whitley, D. (2018). Nk hybrid genetic algorithm for clustering. IEEE Trans. Evol. Comput. 22 (5), 748–761. doi:10.1109/tevc.2018.2828643
Wang, L., Yong, H., and Hong, J. (1996). Research on the convergence of the genetic algorithm. Chin. J. Comput. Chin. J. Comput. 19 (10), 794–797.
Wu, Q, and Law, R. (2011). Cauchy mutation based on objective variable of Gaussian particle swarm optimization for parameters selection of svm. Expert Syst. Appl. 38 (6), 6405–6411. doi:10.1016/j.eswa.2010.08.069
Wu, Y., Li, W., Wang, Y., and Zhang, K. (2019). Remaining useful life prediction of lithium-ion batteries using neural network and bat-based particle filter. IEEE Access 7, 54843–54854. doi:10.1109/access.2019.2913163
Xu, J., Pei, L., and Zhu, R. z. (2018). Application of a genetic algorithm with random crossover and dynamic mutation on the travelling salesman problem. Procedia Comput. Sci. 131, 937–945. doi:10.1016/j.procs.2018.04.230
Yang, C., Zhou, L., Huang, K., Ji, H., Long, C., Chen, X., et al. (2019). Multimode process monitoring based on robust dictionary learning with application to aluminium electrolysis process. Neurocomputing 332 (7), 305–319. doi:10.1016/j.neucom.2018.12.024
Yao, L., Li, T., Li, Y., Wei, L., and Yi, J. (2019). An improved feed-forward neural network based on ukf and strong tracking filtering to establish energy consumption model for aluminum electrolysis process. Neural comput. Appl. 31 (8), 4271–4285. doi:10.1007/s00521-018-3357-9
Yi, J., Bai, J., Zhou, W., He, H., and Yao, L. (2018). Operating parameters optimization for the aluminum electrolysis process using an improved quantum-behaved particle swarm algorithm. IEEE Trans. Ind. Inf. 4 (8), 3405–3415. doi:10.1109/tii.2017.2780884
Keywords: aluminium electrolysis, enhanced genetic algorithm, wavelet neural network, energy consumption prediction, intelligent modeling
Citation: Yao L, Fan Q, Zhao L, Li Y and Mei Q (2022) Establishing the energy consumption prediction model of aluminum electrolysis process by genetically optimizing wavelet neural network. Front. Energy Res. 10:1009840. doi: 10.3389/fenrg.2022.1009840
Received: 02 August 2022; Accepted: 19 August 2022;
Published: 13 September 2022.
Edited by:
Yusen He, The University of Iowa, United StatesCopyright © 2022 Yao, Fan, Zhao, Li and Mei. This is an open-access article distributed under the terms of the Creative Commons Attribution License (CC BY). The use, distribution or reproduction in other forums is permitted, provided the original author(s) and the copyright owner(s) are credited and that the original publication in this journal is cited, in accordance with accepted academic practice. No use, distribution or reproduction is permitted which does not comply with these terms.
*Correspondence: Qian Fan, cWlhbmZhbm5Ab3V0bG9vay5jb20=