 Arijit A. Ganguli
 Aniruddha B. Pandit
- 1School of Engineering and Applied Science, Ahmedabad University, Ahmedabad, India
- 2Institute of Chemical Technology, Mumbai, India
In the present work, performance/flow characteristics (namely, the effect of operating parameters like pressure on flow patterns, pressure drop, and the extent of flow uniformity) and transport phenomena of a manifold (header tube assembly) having an inlet and outlet at the center are carried out on a macroscale geometry using CFD simulations. In this study, an existing design available in the published literature (with high flow non-uniformity) was considered and an optimized design (with minimum flow non-uniformity) was developed. The optimization is performed by incorporating a perforated plate (distributor) inside the top header of the manifold. First, CFD simulations for different configurations of the existing design with the perforated plate have been performed for a pressure of 10 bar with steam as a working fluid, and an optimized configuration having a minimum flow non-uniformity of less than 3% is obtained. CFD simulations for both the existing design and optimized design are then performed for a pressure range (10 ≤ p ≤ 70 bar) and the corresponding Reynolds number (Re) range (2.82E+05 ≤ Re ≤ 2.82E+06) with steam as the working fluid. The extent of non-uniformity (ENU) and pressure drop for the existing design (without a distributor) and optimized design (with a distributor) have been analyzed and compared. The optimized design gives the near uniform flow (∼1–4%) for all pressures and Reynolds numbers considered. An empirical correlation relating the friction factor (as per the Chilton–Colburn analogy) and Re has been developed for both designs (with and without a distributor). The predicted friction factors are compared with the present CFD predictions, and experimental data of the shell and tube heat exchanger are available in the published literature. A good agreement within a 10–15% deviation has been observed. Based on the Chilton–Colburn analogy, a correlation for the Nusselt number is obtained from the friction factor correlations for both with and without distributor cases. The correlations for friction factors were found to be valid under any operating conditions for a pressure drop range within 0.05 < ∆p < 1.8 bar irrespective of the design of the distributor, assuming that the manifold is able to withstand the pressure drops in the given range.
1 Introduction
In macroscale process equipment (like heat exchangers) or microscale equipment (like external manifold solid oxide fuel cell stack, microchips for electronic applications, water-cooled impingement microchannel, and proton exchange membrane fuel cells), the single-stream flow needs to be divided into several parallel streams (i.e., the flow gets distributed also termed as flow distribution) and then recombined into a single stream. The equipment involving such flows is in general termed as manifolds. The single stream entering the manifold can be a pipe or channel (generally termed as a main channel or top header) with entry from one side (left, right, or top) or center (top or bottom). The flow then gets divided into multiple pipes or channels (the size of which is less than one-fourth of the main channel). The flow then recombines into another main channel at the bottom (also called the bottom header) after which it goes downstream to another equipment or to the atmosphere. In these types of equipment, the dimensions range from micrometers to meters, depending on the applications for which they are used. An improper flow distribution affects the overall heat transfer coefficient in a heat exchanger or conversion and yields in a multichannel catalytic converter, thus affecting the performance of the equipment. The flow may be evenly distributed (termed as uniform flow distribution) in the manifold or may be non-evenly distributed (termed as maldistribution). One of the applications where such manifolds are used but less widely studied is as a condenser for safety applications in nuclear power plants for passive decay heat removal. In such applications, the fluids undergo turbulent natural convection (Ganguli et al., 2011) and two-phase flow, especially boiling and condensation (Ganguli et al., 2010; Dahikar et al., 2013; Ganguli et al., 2013). CFD modeling of these condensers for the single-phase uniform flow distribution has been studied by Gandhi et al. (2012). Another important aspect is the effect of maldistribution on transport phenomena. The analytical or empirical modeling of this aspect has not received greater attention for non-conventional heat exchangers like plate and frame heat exchangers and manifolds (side or central entry).
Studies on flow non-uniformity and pressure drops in macroscale manifolds were first studied more than 5 decades ago by Acrivos et al. (1959). In the past few years, however, the distribution of fluids at a microscale has received considerable attention. It was thought worthwhile to briefly review the literature of optimization of geometries of microscale and have a better understanding of strategies which might help in optimization of geometries at a macroscale. First, the geometrical and operating parameters of such research works are listed in Table 1 which have been complimented with the description in Section 2.
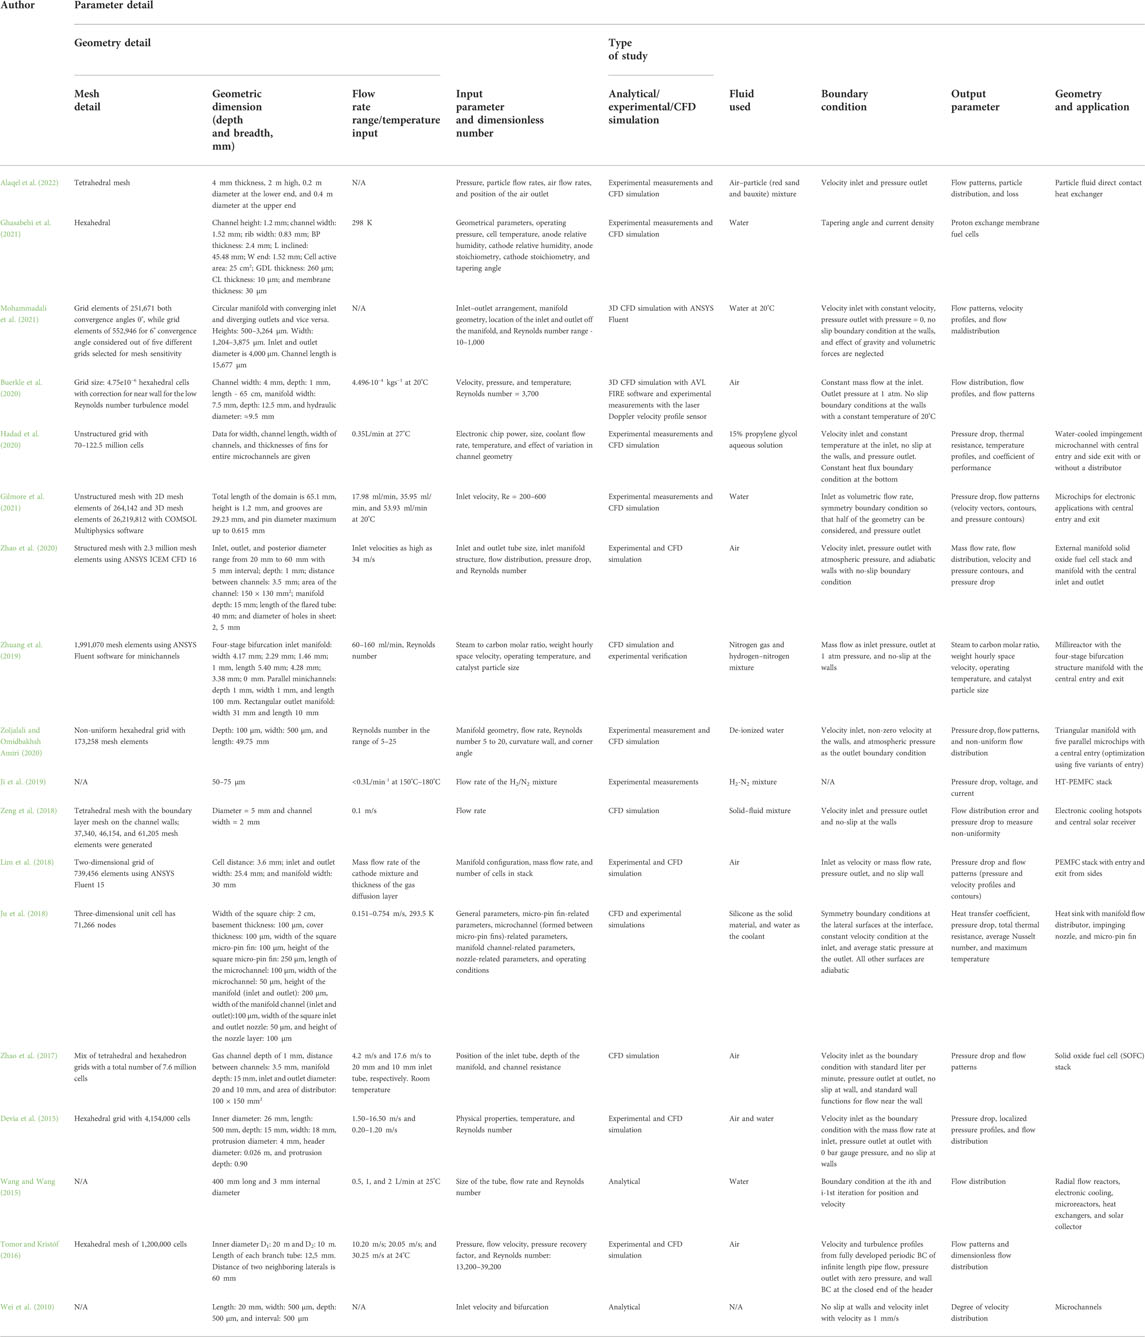
TABLE 1. Experimental and CFD details of research works available in the published literature.
The basic shapes in a microchannel are 1) conservative types having rectangular, hemi-spherical, converging–diverging shapes with entry from the extreme bottom or top and exit from the extreme top or bottom (Figure 1A); 2) bifurcation shape where there is a central inlet, and the flow is split sequentially till it goes into two channels (Figure 1B); and 3) a manifold having a central inlet and outlet and a baffle divides the flow before it moves to a series of channels and divides the flow (Figure 1C). The flow distribution is a function of the flow area within the headers and the pressure loss in the tubes between the headers.
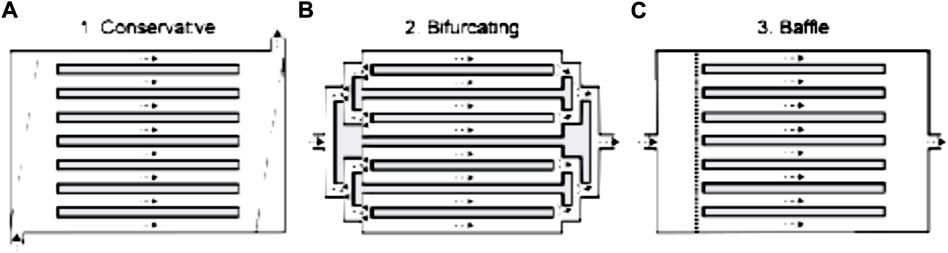
FIGURE 1. Different configurations in microchannels. (A) Conservative. (B) Bifurcating. (C) Baffle [reproduced from Gilmore et al. (2021)].
1.1 Literature review
In this section, the recent works carried out on flow distribution in microchannels with configurations are provided in Figure 1, and analytical works of flow distribution in manifolds have been discussed. Since a detailed literature study of CFD studies of flow distribution in manifolds is available in the published literature (Gandhi et al., 2012; Minocha and Joshi, 2020), a limited literature review on macroscopic manifolds is provided in Section 2.2.
1.2 Flow distribution studies on microscale manifolds with a central inlet and outlet
The distribution of fluids in microscopic manifolds has increased over the past decade. Wei et al. (2010) studied the effects of structural parameters on velocity distribution using numerical simulation of bifurcation structures as the manifolds of microchannel arrays in a plane (Figure 1B). The arrays considered by the authors were symmetric in nature. The authors highlighted that in bifurcation geometry, the complexity arose since channel parameters in each level downstream were independent and were represented as ratio parameters. The optimization of these ratios, namely, 1) the ratio of the length of the channel to the horizontal distance between two adjacent channels at a specific level and 2) the ratios of the right and left sides at a certain level in a bifurcation and channel width ratios helped achieve uniform distribution.
Devia et al. (2015) carried out a series of CFD simulations to infer the effects of a protrusion fitting (inside the header) on the single-phase distribution in parallel upward vertical channels fed by a common horizontal distributor. Numerical results were compared with both experimental single-phase and two-phase (liquid/gas) experimental data. An empirical correlation was developed between the pressure loss coefficients due to the protrusions in terms of the local Reynolds number based on the protrusion inner diameter. Both simulation and experimental results showed that the mass flow rate increased slightly in individual parallel channels while moving downstream inside the header, though the non-uniformity of flow rates was well within 5% in both numerical and experimental single-phase runs. The CFD simulations also revealed a peculiar pressure trend inside the header with a pressure recovery effect moving downstream along the header. The authors attributed this to the higher flow rates in the ending protrusion pipes. Furthermore, a two-phase flow investigation showed very different and much less uniform phase distribution profiles with respect to the corresponding single-phase ones. Single-phase standard deviations, from measured or numerical quantities, resulted well below 5%, while the two-phase counterparts can be 10 times as high as the single-phase deviations.
Tomor and Kristóf (2016) developed an analytical/discrete model with variable flow coefficients for the dividing-flow manifold design and compared their results with a 3D CFD model and experimental data. A good agreement between both experimental and CFD results was predicted.
Wang and Wang (2015) derived an analytical solution for the second-order nonlinear ordinary differential equation for flow distribution in a U-type manifold with a serpentine arrangement. The major complexity in U-type manifolds with a serpentine arrangement lied in losses from channels to headers in addition to frictional losses in channels that needed to be accounted for. The authors carried out momentum balance for different sections of a manifold and applied appropriate boundary conditions (two-point boundary conditions or initial and final boundary conditions for overall momentum balance). Appropriate corrections to the analytical solution were made using different coefficients for different sections. Furthermore, the authors performed a comparison between the results of flow distribution between U-type and Z-type manifolds to understand the performance of the developed analytical/discrete model.
Zhao et al. (2017) analyzed gas flow distribution and pressure variation in a solid oxide fuel cell (SOFC) stack using CFD simulations. The authors considered three different designs, namely, 1) a manifold with both the inlet and outlet at the top, 2) a manifold with the inlet and outlet at the top and bottom headers, respectively, at their centers, and 3) a manifold with a rectangular distributor near the top header inlet. The authors named the aforementioned designs as T-manifold, C-manifold, and D-manifold, respectively. The authors carried out sensitivity analysis of different parameters like the position of the inlet, tube depth of the manifold, and resistance posed by channels. The authors concluded that a rectangular gas distributor improved the uniformity in flow and recommended this configuration since it also avoided damage of other accessories (like sealants) in addition to uniform flow distribution. Optimization of depth of the manifold caused an improvement of distribution in the T-manifold design while making not so significant change in the C-manifold design. Furthermore, the authors claimed that for pressure drops of 100 Pa, the non-uniformity decreased to 3%, while for 400 Pa, there was practically no non-uniformity.
Ju et al. (2018) carried out numerical studies to design a novel heat sink with a flow distributor. A three-dimensional numerical simulation was performed to investigate the thermal and hydrodynamic performances. Optimization of the design by selecting several configurations and investigating performances of each to the geometrical parameters were carried out, and the best configuration for the heat sink was chosen based on the optimum performance.
Lim et al. (2018) presented a numerical analysis of the flow distribution behavior within different manifold configurations. The authors developed a 2D CFD model for this purpose. Three different flow configurations were considered with different numbers of flow inlets and outlets. The flow characteristics, such as the pressure and velocity variations in the manifold, were analyzed to determine the effects of the different flow configurations. The authors concluded that the configuration with two inlets and two outlets was the best for uniform flow distribution.
Zeng et al. (2018) developed a method for designing headers based on multi-stage topology optimization of fluid flow to minimize power dissipation. The authors also compared the method with a CFD-based evolutionary algorithm in the literature. The results proved that the proposed multi-stage topology optimization of fluid flow is an efficient method for addressing the general flow distribution device design problem.
Ji et al. (2019) developed an experimental method to measure flow distribution using the flow versus current relationship. Online measurement was carried out to optimize flow distribution, and the results for optimization of geometry on the performance of HT-PEMFC showed better flow uniformity.
Zhuang et al. (2019) used minichannel reactors with a bifurcation-structured inlet manifold and different types of outlet manifolds to study the flow distribution uniformity and pressure drop. The authors observed fully developed flow and uniform distribution when a longer channel length of bifurcation in the inlet manifold was provided. Furthermore, the authors investigated the effect of structures of bifurcation like triangle and rectangle, as well as the parallel minichannel length at the outlet of a manifold on the flow uniformity of minichannel reactors. The authors observed that the rectangular structure outlet manifold simplified the structure of minichannel reactors and reduced power losses. Furthermore, the flow uniformity of the minichannel reactor increased as the parallel minichannel length increased, and the impact was more significant at a high inlet flow rate than at a low inlet flow rate.
Gilmore et al. (2021) carried out experimental (flow visualization) and numerical studies (CFD simulations) for the design of microchannels. The authors considered three different configurations, two of which have an inlet and outlet from the middle of the manifold and one of which has an inlet from the bottom and an outlet at the top. In one of the geometries considered by the authors having a middle inlet and outlet, elliptical pins were used as baffles. The spacing between the baffles was optimized using numerical simulations to get a uniform distribution with a minor increase in pressure drop compared to a design without baffles. The introduction of elliptical pins reduced the normalized channel flow rate variation from 19% to 1% and the range from 0.59 to 0.02, while only increasing the pressure drop from 37.9 Pa to 41.3 Pa at a Reynolds number of 200. The authors suggested that future studies should seek to simplify optimization procedures, so that the performance enhancement of the solutions may be more practically implemented in real-world applications.
Hadad et al. (2020) numerically investigated the distributor and collector effects of modified impingement microchannel heat sinks having a reduced pressure drop compared to those of conventional microchannel heat sinks. Furthermore, the authors observed that the size of the inlet and outlet of the manifold has a significant effect on the thermal and hydraulic performance of the heat sink. The authors carried out a parametric study on the distributor and collector geometry effects on the hydraulic and thermal resistances and found satisfactory results for optimizing the geometry to enhance the performance.
Buerkle et al. (2020) performed CFD simulation and optical measurements to predict the flow distribution in a fuel cell stack. The authors found that by manipulating the ratio of the diameter of the inlet of the manifold to the diameter of individual fuel cells and using a non-uniform distribution of holes in the baffle-aided reduction in maldistribution, the average global deviation between the flow rates was reduced from 10.1% to 4.0%. Furthermore, the authors showed that the manufacturing tolerances have a strong influence on the flow maldistribution, and the modified design would help in rectifying the same.
Zoljalali and Omidbakhsh Amiri (2020) studied flow distribution and pressure drop in parallel microchannels, which are two effective parameters on the performance of different devices. For this work, the structure of a triangular inlet manifold with straight and curved walls was studied as the main subject. For this purpose, in a Reynolds number range of 5–25, four structures of inlet flow were investigated. Furthermore, the effect of the geometry parameters on the flow distribution was considered with a better structure of the manifold.
Zhuang et al. (2020) developed a novel multichannel micro-packed bed reactor with a bifurcation inlet manifold and a rectangular outlet manifold to improve the methanol steam-reforming performance. Catalyst particles were packed in the multichanneled reactor, and the flow distribution uniformity in the reactor was optimized numerically by carrying out sensitivity analysis of the geometrical parameters. The authors claimed that the developed optimized version multichannel micro-packed bed reactor can provide a solution to overcome the problems of the microchannel reactor coated with the catalyst. The authors have, however, not mentioned the studies on pressure drop for their optimized geometry.
Ghasabehi et al. (2021) carried out 3D CFD simulations for a manifold geometry (multichanneled reactor) for performance enhancement and lowering power losses. The authors considered the following two designs: the first of which was to taper the main channels without any baffles and the second was to manipulate the inlet and outlet diameters of the manifolds. The authors performed simulations on eight structures with different tapering angles that were compared with the simple parallel and serpentine flow fields. The authors found that the performance (in terms of yields) in the proposed tapered parallel flow geometry was much higher than that in the conventional one. The authors concluded that due to flow uniformity in the suggested modified design, there was an increase in performance and a reduction in power loss in both designs considered.
1.3 Flow distribution and transport phenomena in macroscale manifolds with a central inlet and outlet
Uniformity in flow distribution in any geometry (sparger, different manifolds: dividing, combining, parallel, and reverse) needs a proper balance between the pressure recovery and the frictional pressure drop. Based on this, analytical expressions for the extent of non-uniformity for dividing manifolds have been published in the open literature (Bassiouny and Martin, 1984; Turek et al., 2009; Wang, 2011; Midoux and Tondeur, 2015). Furthermore, experimental measurements for pressure drops have helped in developing empirical expressions for plate heat exchangers (PHEs) (Arsenyeva et al., 2012; Gusew and Stuke, 2019). Furthermore, numerical investigations in other applications causing enhancement in heat transfer characteristics include tubes with curved conical tubular inserts (Mousavi Ajarostaghi et al., 2021), rectangular channels in solar heaters with arc-shaped ribs (Kazemi Moghadam et al., 2021) or V-shaped ribs (Kadijani et al., 2022), or channels with partially inclined baffles (Salhi et al., 2022).
In the present work, the geometry considered is that of Gandhi et al. (2012) (as shown in Figure 2). The work on the present geometry was studied a decade ago by a few researchers (Gandhi et al., 2012; Minocha and Joshi, 2020). A comprehensive work has been carried out by Gandhi et al. (2012) on nine tube assemblies without the need for any distributor. Minocha and Joshi (2020) carried out investigations into a similar header tube assembly and used eight different design strategies to reduce maldistribution and pressure drop inside such header tube assemblies using a distributor. In their study, they concluded that the most effective design strategy for maximum flow uniformity and minimum energy dissipation would be the inclusion of the perforated baffle, which brings flow uniformity up to 95%.
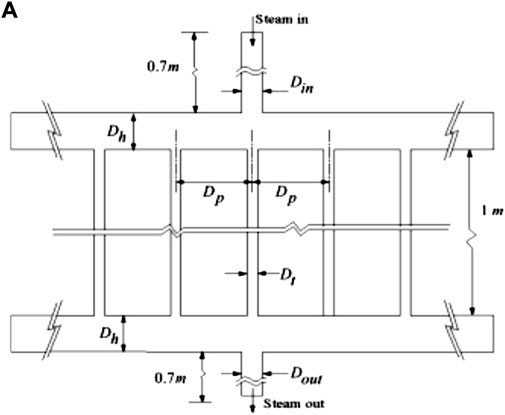
FIGURE 2. Schematic of configuration (A) as considered by Gandhi et al. (2012).
1.4 Literature review summary
The literature on microscale devices (both experimental and CFD studies) has been discussed in detail in Section 2.1. Several significant strategies to address the issue of maldistribution through numerical/analytical techniques for different geometrical configurations include 1) analytical/discrete models preferred as compared to CFD by researchers (Devia et al., 2015; Wang and Wang, 2015; Tomor and Kristóf, 2016) for U- and Z-type manifolds, 2) incorporation of internals like distributors for manifolds with central inlets and outlets (Zhao et al., 2017; Gilmore et al., 2021), 3a) optimization of geometric parameters like (b) inlet diameter to individual tube ratios (Hadad et al., 2020); shape of the inlet (like triangular inlets) (Zoljalali and Omidbakhsh Amiri, 2020); and (c) other geometrical parameters (Zhuang et al., 2020; Ghasabehi et al., 2021), 4) header designs with multistage topologies (Ju et al., 2018; Zeng et al., 2018), and 5) number of flow inlets and outlets (Lim et al., 2018). Experimental works to study maldistribution include the following: 1) optimizing outlet diameters for bifurcation manifolds (Zhuang et al., 2019); 2) geometry optimization by measuring current as a function of flow (Ji et al., 2019). Gilmore et al. (2021) showed encouraging results (on microscale geometries) of reducing maldistribution to 1% with a nominal increase in pressure drop for the Reynolds number of 200, while Buerkle et al. (2020) showed optimization with the non-uniform hole distribution on the baffle showing a non-uniformity to decrease up to 4%.
The literature review also shows that in macroscale geometries, the transport phenomena in such manifolds would depend on empirical correlations relating transport coefficients with non-dimensional groups. Manifold designs are different than the benchmark geometries (for example, conventional heat exchangers such as shell and tube heat exchangers), and development of empirical correlations for friction factors and heat transfer coefficients is necessary. A brief discussion on research works on transport phenomena in unconventional heat exchangers has been provided in Section 2.2.
1.5 Objective of the present work
For the present geometry, no empirical correlation exists for transport coefficients like friction factor and heat transfer for this manifold geometry in terms of both the existing design and an optimized design. The Re number range of the present work is two orders of magnitude higher than that of the works available on the similar optimized manifold in the published literature. The lowest values of the extent of non-uniformity (ENU) reported in previous studies for the present manifold have been around 5% for lower Re number ranges (<105). The effect of operating pressure on the ENU and pressure drop in such a manifold has not been carried out till date.
In view of the aforementioned opportunities, the objectives of the present work have been defined and are as follows: 1) to analyze different configurations with a distributor in the existing design and select the best configuration which can reduce flow non-uniformity to less than 5%; 2) to carry out simulation studies to understand the performance characteristics of such geometry (the best configuration with a distributor) for different operating pressures; 3) to develop empirical correlations for transport properties (friction factor and heat transfer coefficient) for the chosen manifold (for both existing and optimized designs), and 4) to compare predictions of friction factors of the present manifold with the corresponding friction factors for benchmark geometries like shell and tube heat exchangers due to unavailability of empirical correlations from experimental data.
2 Mathematical modeling
2.1 Geometry and grid details
In this subsection, the details of the geometry and grid are presented. The geometry chosen for this system is a header tube assembly that consists of the top and the bottom headers, which are assumed to have diameters Dh, while the tubes have diameters Dt. The ratio Dt/Dh is assumed to be 0.2. The inlet and outlet diameters are one-quarter of the header diameters.
The pitch between the tube centers is Dp. The length is L = 1.125 H, where the height of the tubes is considered H, such that Dh = 0.1875 H. The fluid enters at high pressures (10 < p < 70 atm) from the inlet and departs at the outlet. Due to a high diameter ratio between the header tube and the tubes, the position of the inlet poses a problem. The number of holes in the distributor equals (n+1), where n is the number of tubes. The diameter of each hole of the distributor is the same as Dt. Figure 3 shows the geometry and mesh of the header tube assembly with and without a distributor.
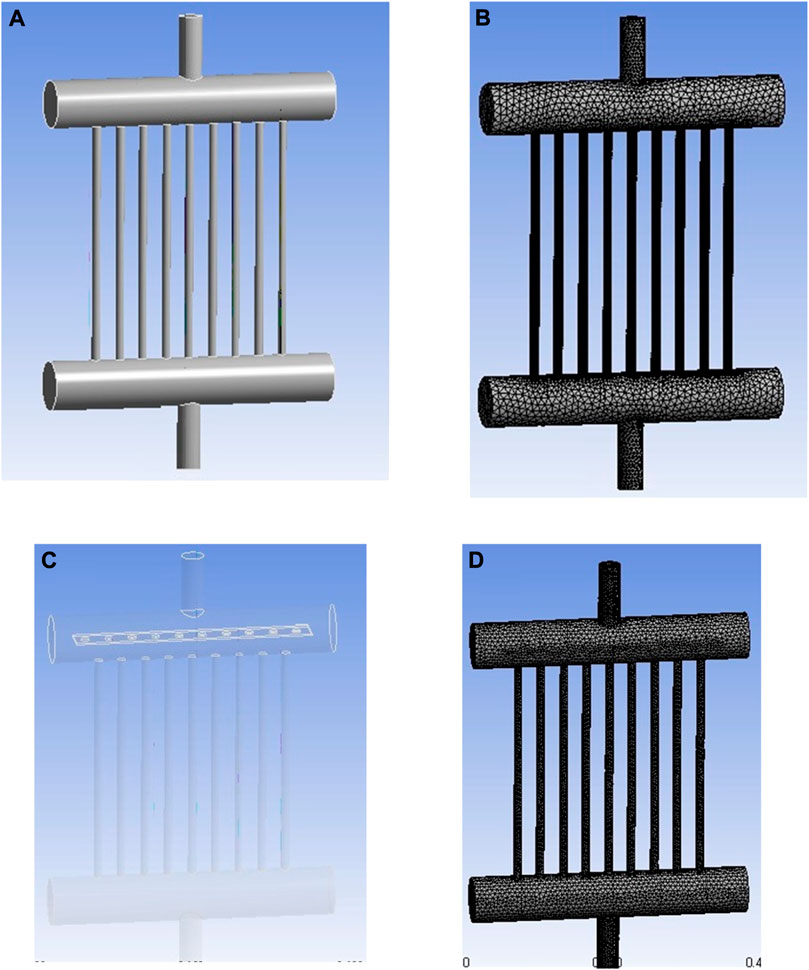
FIGURE 3. Geometry and mesh of header tube assemblies. (A) Geometry of the design without a distributor. (B) Mesh for the design without a distributor. (C) Geometry of the design with a distributor (D) Mesh for the design without a distributor.
2.2 Grid sensitivity
A three-dimensional grid has been considered in the study. A tetrahedral mesh has been created both for the header and tube assembly with and without a distributor. Grid sensitivity was performed with three grids: 1) 137,443 cells, 2) 187,731 cells, and 3) 229,154 cells. The results between 137,443 and 187,731 cells were approximately 6%, while those between 187,731 cells and 229,154 cells and 187,731 and 393,775 cells were approximately 3%. Hence, a mesh size of 183,771 cells was chosen for the study. Velocity variation with the tube number for three different grids is shown in Figure 4.
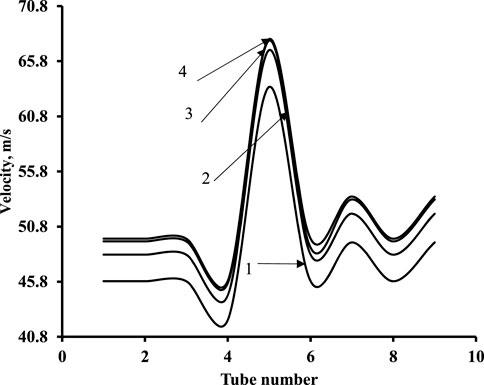
FIGURE 4. Grid independence sensitivity study. 1) 137,443 cells, 2) 187,731 cells, and 3) 229,154 cells.
The mesh consisted of non-uniform hexahedral mesh with fine mesh near the walls and coarse at the center in case of the tubes of the manifold. Both headers however had a tetrahedral uniform mesh. For the design with distributor fine mesh near the distributor walls and uniform mesh in top header was used. For geometry with a distributor, the grid cells were 249,135 tetrahedral cells. Appropriate grid independence tests were carried out for both the cases. Table 2 shows the properties of saturated steam for three different pressures, namely, 10 bar, 40 bar, and 70 bar and the header dimensions.
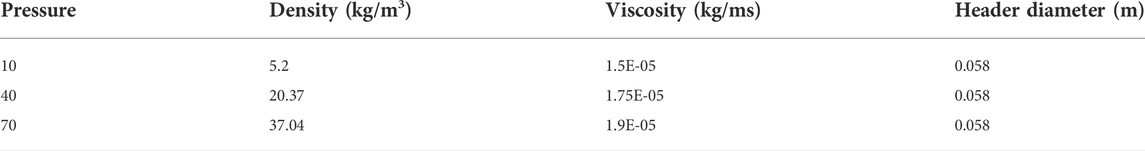
TABLE 2. Properties of steam at different pressures and header dimensions.
2.3 Governing equations
The steady-state governing equations of continuity and momentum have been used including the realizable k–ε turbulence model in cylindrical co-ordinates and have been solved using commercial software ANSYS Fluent 14. The comparison of different turbulence models (standard k–ε, realizable k–ε, and LES) on the extent of non-uniformity for a range of Re numbers has been performed by researchers (Zhang et al., 2018; Minocha and Joshi, 2020). Due to the intensive computational time and transient nature of LES simulations, it was decided to consider the best turbulence model of the standard k–ε and the realizable k–ε models. The authors have found that the realizable k–ε model is able to predict the non-uniformity well for both low and high Reynolds numbers. Hence, the realizable k–ε turbulence model has been considered for the present simulations.
2.4 Assumptions
The assumptions in modeling are 1) steady-state flow. 2) Incompressible fluid and compressible effects if any are neglected. 3) The mode of heat transfer is by sensible heat only, and no condensation occurs inside the geometry. 4) There is no spatial variation of steam properties for the pressure and Re range considered. 5) Steam properties are for saturated steam at the pressure chosen. 6) Single-phase flow throughout the geometry and no condensation occurs.
2.5 Boundary conditions
The boundary conditions are as follows: the inlet velocity boundary condition for the inlet tube connecting the top header and pressure outlet was used for the outlet tube connecting the bottom header. A wall boundary condition was used for the tube and header walls.
2.6 Method of solution
Details of the solution of discretized linear algebraic equations for different variables are as follows: a second-order upwind discretization scheme was used for the pressure, velocity, and k and ε equations, while all the discretized equations were solved in a segregated manner with the PISO (Pressure-Implicit with Splitting of Operators) algorithm. The under-relaxation was set to 0.3 for pressure, 1 for density and body forces, 0.7 for momentum, and 0.8 for turbulence parameters. The solutions of the variables were considered to be fully converged when the sum of residuals was below 10–4. All the computations were performed on an Intel machine with a quad-core processor with 4 GB RAM and 2.4 GHz processor speed.
2.7 Model validation
For model validation, the cases for Kubo and Uuda (1969) and Pigford et al. (1983) were simulated using ANSYS Fluent 14. The realizable k–ε model was able to capture the dynamics in all the three cases considered. The results of the mass flow ratio of experimental measurements from the published literature (Kubo and Ueda, 1969; Pigford et al., 1983) were compared with CFD predictions of simulations carried out on the same geometries for which experimental measurements were made. Good agreements between predicted and experimental results were obtained with a deviation in the range of 5–6% as shown in Figure 5. This is in agreement with the results of Gandhi et al. (2012) who used the same geometries to validate their model and found deviations of 8%. The higher deviations of Gandhi et al. (2012) are due to the fact that the authors used the standard k–ε model instead of the realizable k–ε model. The realizable k–ε model should be used for such simulations for high Reynolds number flows with high flow separation at the T-junctions (at the center in the present case) and stagnant zones at the end of the top and bottom headers (prominently in the present case) due to the limitations of the standard k–ε model. Furthermore, similar analysis carried out by Minocha and Joshi (2020) showed that the realizable k–ε model has been able to predict deviations within 5% for similar dividing manifolds.
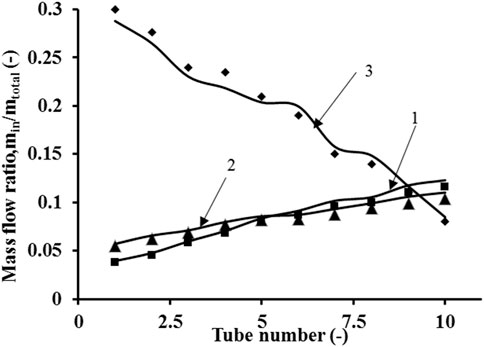
FIGURE 5. Model validation: 1) Kubo and Uuda (1969) case 1 experiment; 2) Kubo and Uuda (1969) case 2 experiment; Pigford et al. (1983).
3 Distributor configurations
In this subsection, optimization in terms of distance of the hole from the distributor to reduce flow non-uniformity has been carried out, and the best configuration has been chosen. The header and distributor plate used in the studies and the parameters associated with configurations are shown in Figure 6. Five different configurations were chosen for reducing the non-uniformity. The ratio of the distance between distributor plate perforations to the adjacent tube opening in the header (l1) and the distance between the two consecutive perforations in the distributor (l2) are vital in reducing the non-uniformity. Figure 6A shows the top view of the geometry created in ANSYS Workbench 14. The holes in the distributor represented by the yellow dotted circles are the configuration C1 for which the magnitude of l2 is very low. The dark circles represent the tube holes, while the bigger circle represents the inlet to the header. The white circles represent the configuration C5 for which the magnitude of l2 is the highest. This ratio was varied, and five configurations were defined (C1–C5). A detailed diagram of configuration 5 is provided in Figure 6B. Representative results of the reduction in %ENU with Re are shown in Table 3 for a pressure of 10 bar.
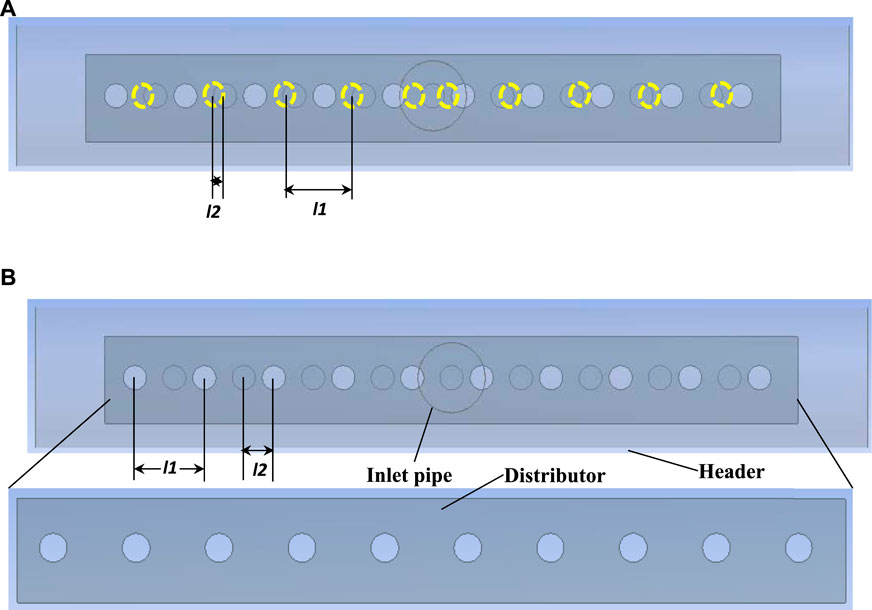
FIGURE 6. Geometrical details of the header and distributor along with parameters for configuration selection. (A) Configuration 1 and (B) configuration 5.
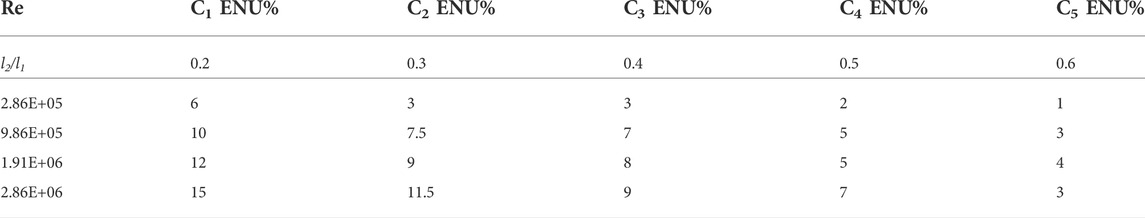
TABLE 3. %ENU variations for different configurations.
4 Results and discussion
In this section, the first flow patterns of the manifold with and without a distributor are presented to qualitatively understand the distribution in both cases for the three operating pressures considered. Furthermore, the quantitative understanding of improvement in distribution is represented in terms of velocity profiles. Quantification in terms of pressure drop variation and %ENU is also presented for both cases. All the data generated from the simulations have been used to develop an empirical correlation for the friction factor. The predictions of correlation are compared with the ones available for the conventional shell and tube heat exchangers for the same Re number range, and a correlation for heat transfer has been suggested using the Chilton–Colburn analogy.
4.1 Flow patterns
The flow distribution in manifolds depends on the type of flow being whether friction dominant, momentum dominant, or both. In the present geometry, the interplay of momentum and friction can be observed through the amount of flow passing through the central tube of the top header. The presence of a distributor brings in proper balance between the momentum and friction forces, resulting in a uniform distribution. This in turn improves the pressure recovery in the bottom header as well. In this section, we explain the velocity distribution for different Reynolds numbers for each pressure chosen. Furthermore, the pressure drop across the header tube assembly for the specified pressure range was also analyzed.
Figure 7 shows the velocity contours (2.82E+05 ≤ Re ≤ 1.91E+06) for a specified pressure of 10 bar. Figure 7 (A1) shows the velocity contour for flow distribution without a distributor for Re = 2.82E+05 and p = 10 bar, while Figure 7 (A2) shows the velocity contour for the same Re number and pressure for the geometry with a distributor. Figure 7 (A1) shows that the velocity in the central tube is 1.6 times the velocities of its neighboring tubes, while Figure 7 (A2) shows that the velocity in the central tube is nearly equal to that of its neighboring tubes. Similarly, Figure 7 (B1) shows the velocity of the central tube to be 1.69 times higher than its neighboring tubes, while Figure 7 (B2) shows an equal distribution in all tubes of the top header. For Figure 7 (C1), the central tube velocity is 1.72 times that of neighboring tubes, while near equal velocities are observed in Figure 7 (C2) with a distributor. With an increase in Re, it can be observed that the central tube velocity is 1.6–1.7 times the velocity in the adjacent tubes, while the cases with a distributor show the uniformity in distribution.
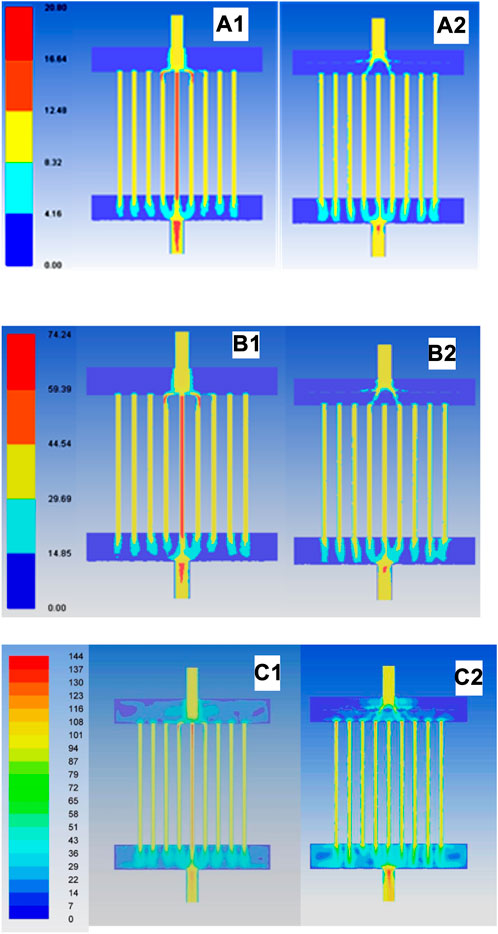
FIGURE 7. Velocity contours for p = 10 bar. Without distributor A1: Reynolds number (Re) = 2.82E+05; B1: Re = 9.86E+05; C1: Re = 1.91E+06. With distributor A2: Re = 2.82E+05; B2: Re = 9.86E+05; C2: Re = 1.91E+06 (all units of velocity are given in m/s for the color legend).
A similar observation to the ones found in Figure 7 can be observed in Figure 8. The velocities, as shown in Figures 8 (A1), (B1), and (C1), for central tubes are 1.75, 1.73, and 1.68 times the velocities of their neighboring tubes, respectively. With an increase in Re at this pressure, the velocity magnitudes of central tubes show a slight decreasing trend. Figures 8 (A2), (B2), and (C2), however, show equal velocities in all tubes.
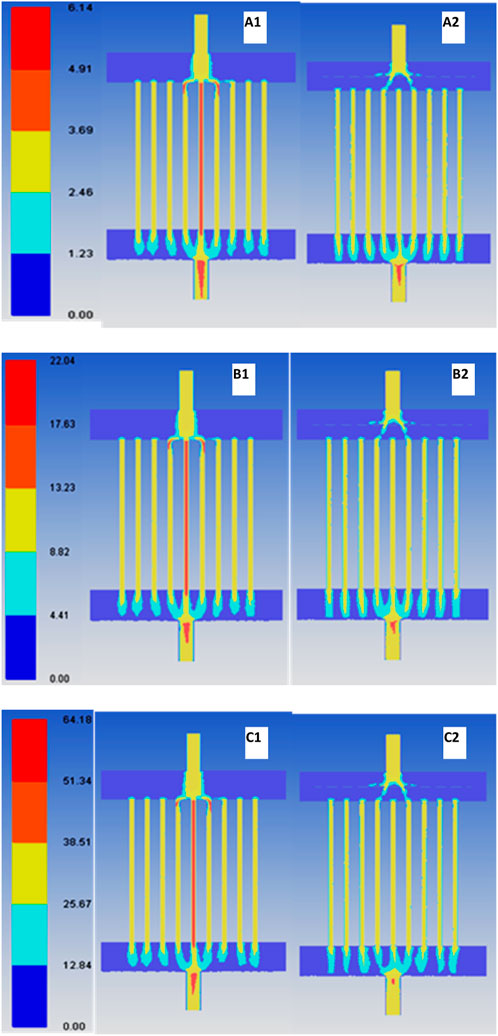
FIGURE 8. Velocity contours for p = 40 bar. Without distributor A1: Reynolds number (Re) = 2.82E+05; B1: Re = 9.86E+05; C1: Re = 2.82E+06. With distributor A2: Re = 2.82E+05; B2: Re = 9.86E+05; C2: Re = 2.82E+06 (all units of velocity are in given m/s for the color legend).
Figure 9 shows velocity contours for a high pressure of 70 bar. The velocity magnitudes are lower due to the same Re maintained at an operating pressure of 70 bar. The velocities in the central tubes are 1.76, 1.72, and 1.8 times the velocities of the neighboring tubes for the geometry without a distributor as shown in Figures 9 (A1), 7 (B1), and 7 (C1), respectively.
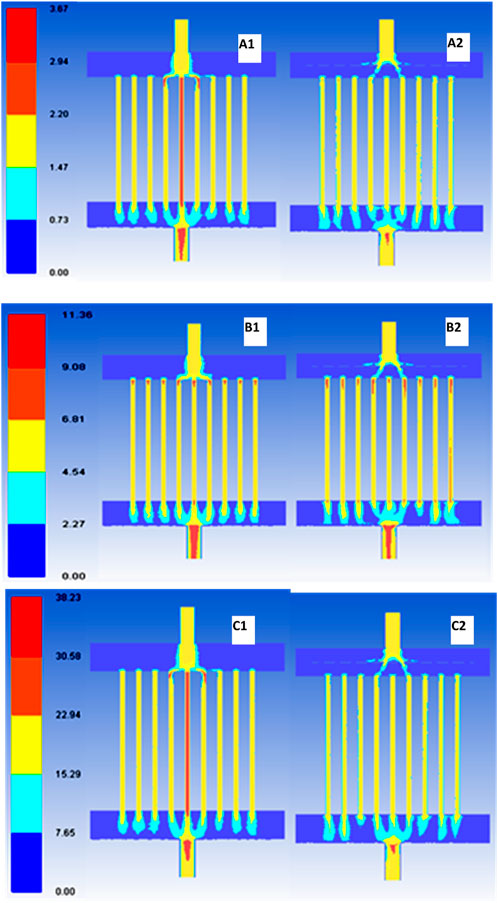
FIGURE 9. Velocity contours for p = 70 bar. Without distributor A1: Reynolds number (Re) = 2.82E+05; B1: Re = 9.86E+05; C1: Re = 2.82E+06. With distributor A2: Re = 2.82E+05; B2: Re = 9.86E+05; C2: Re = 2.82E+06 (all units of velocity are given in m/s for the color legend).
4.2 Velocity profiles for the optimized design with a distributor
The flow patterns (velocity contours) in Section 5.1 show an improvement in flow distribution with the aim of comparing the flow patterns with and without a distributor. A further quantitative comparison of the flow distribution when a distributor is installed (with distributor case) has been provided in Figure 10. The comparison helps us understand the effect on flow distribution with an increase in inlet velocity. Curves 1, 2, and 3 are for the Reynolds number, which is constant (Re = 2.82E+05), and pressures are 10 bar, 40 bar, and 70 bar, respectively. The velocity profiles show an absolutely uniform distribution (0 %ENU) for these Reynolds numbers. Similarly, curves 4, 5, and 6 are for Re = 9.86E+05, and pressures are 10 bar, 40 bar, and 70 bar, respectively. For curve 4, the non-uniformity of approximately (%ENU) 2% is observed at the central tubes, while for curves 5 and 6, uniform distribution is observed. For higher velocity, (v = 95 m/s) Curve 7 is for Re = 1.91E+06 and a pressure of 10 bar. Here, the non-uniformity is approximately 4.5% (%ENU), which indicates that with the increase in Reynolds numbers, the non-uniformity from the configuration with a distributor increases. Previous studies have not investigated the extent of non-uniformity at this Re number and pressure. It should be noted that the configuration still gives better uniformity than previous studies, considering the fact that Re is higher than in previous studies. Curves 8 and 9 on the other hand show uniform distribution. Thus, the aforementioned analysis proves that the installation of a distributor facilitates good distribution within velocities of 5 < v < 96 m/s.
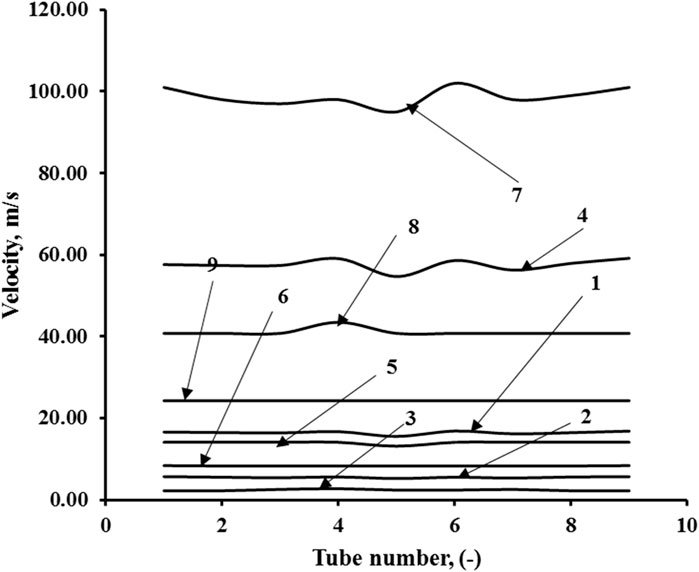
FIGURE 10. Velocity profiles after installation of distributors for different Reynolds numbers at different pressures. Re = 2.82E+05: 1) 10 bar, 2) 40 bar, and 3) 70 bar; Re = 9.86E+05: 4) 10 bar, 5) 40 bar, and 6) 70 bar; Re = 1.91E+06: 7) 10 bar; Re = 2.82E+06: 8) 40 bar and 9) 70 bar.
4.3 Development of correlations for the friction factor and Nusselt number
Pressure drop generally applied to manifolds (for example, plate heat exchangers) is given by as Eq. 1 as follows:
Pressure drop was obtained from the simulation data for different Reynolds numbers. Eq. 1 can be written for the friction factor as
The effect of the inlet pipe on the overall pressure drop has been neglected. Hence, the expression of equivalent diameter has been formulated as follows:
The following correlations have been predicted for both cases:
1. Without a distributor:
2. With a distributor:
The validation for the correlation of the friction factor has been carried out by comparing the prediction of the correlation with experimental data of Gandhi et al. (2012) and then with the CFD predictions of the present work for the Re range. Figure 11A shows the friction factor for the case without a distributor. Both the magnitude and trends shown in Figure 11A are similar to the ones for turbulent flow through tubes as in the shell and tube heat exchangers with high values of friction factors for low Reynolds numbers. The decrease in the friction factor becomes less significant with an increase in Re. These results match well with experiments and CFD simulations with deviations ∼6% with experimental data and ∼10% with CFD data.
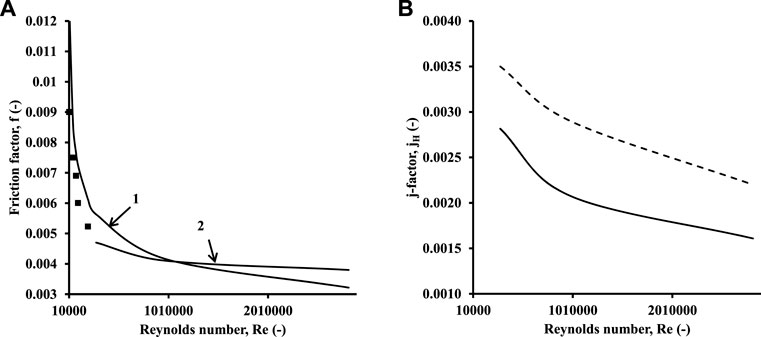
FIGURE 11. Friction factor and j-factor variation with Re for the without-distributor case. (A) Friction factor data prediction: 1) correlation and 2) CFD. Symbols denote experimental data of Gandhi et al. (2012). (B) j-factor vs. Re. Bold line: present work. Dotted line: j-factor for the tube-side of the shell and tube heat exchanger (Sinnott and Towler, 2019).
The Chilton–Colburn j-factor the relationship between momentum, heat, and mass transfer as follows:
An analysis using the Chilton–Colburn j-factor (jh) was also carried out. Figure 11B shows the comparison of j-factor variation for the present geometry without a distributor and the j-factors for the tube side in the shell and tube exchangers. The Re range (2.82 E+05 ≤ Re ≤ 2.82E+06) is used to make sure that the effect of baffles in the shell and tube heat exchangers (STHEs) is avoided. The slope of the decrease in the j-factor is nominal for the present geometry, while it is steeper for STHE. The deviations are attributed to two reasons: 1) vertical configuration in the present case and 2) large number of tubes in comparison to STHE.
Furthermore, an effort to predict an expression for heat transfer is taken though the scope is limited to friction and pressure drop. By applying the Chilton–Colburn analogy, the expression for the Nu number for both cases without a distributor and with a distributor is given as follows:
Without a distributor:
With a distributor:
The pressure drop variation for different Re and Pr ranges is performed using CFD simulations. Figures 12A–C show the pressure drop variation for all three pressures with and without a distributor. For high inlet velocities (∼90 m/s), for p = 10 bar, the pressure drops for the configuration with the distributor range approximately 1.4 bar, while they are restricted to 0.08 bar for higher pressures (40 ≤ p ≤ 70 bars).
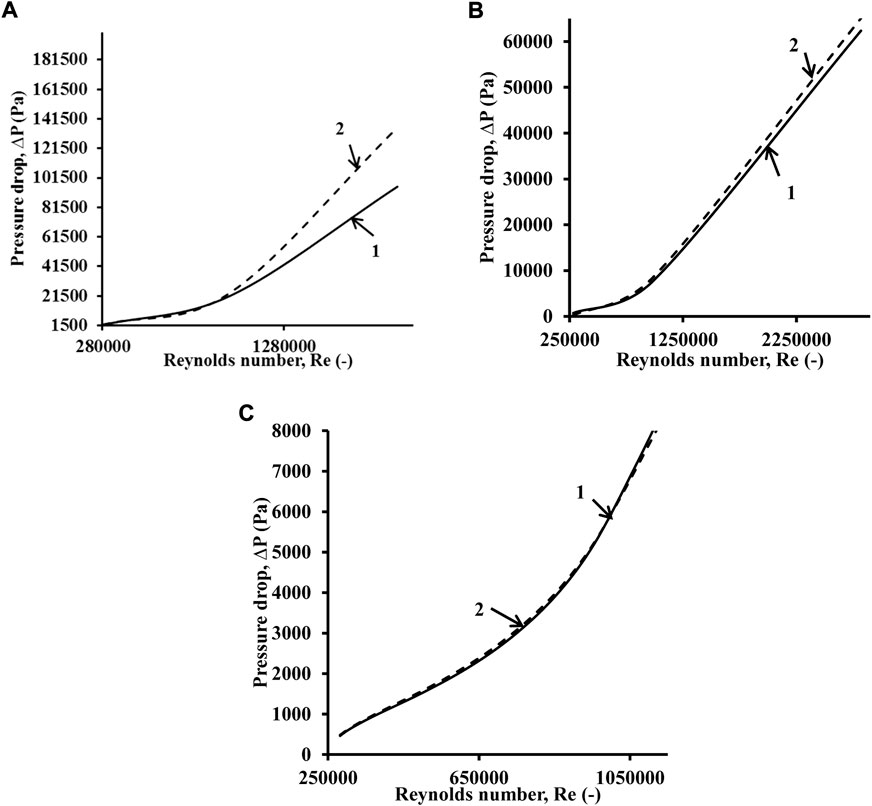
FIGURE 12. Pressure drop variation with the Reynolds number. (A) p = 10 bar, (B) p = 40 bar, and (C) p = 70 bar. 1) Bold line denotes the case without a distributor; 2) dotted line denotes the case with a distributor.
For all the pressures, 10 bar, 40 bar, and 70 bar, a seemingly linear trend is observed. Furthermore, most importantly, the geometry with a distributor is able to obtain a pressure recovery similar to the one without a distributor for the Reynolds number till 1.25E+06 and similar pressure losses. At higher Re, the increase in pressure losses is approximately 4–5%. An inference that can be drawn from this is that the fluid deceleration due to the presence of the distributor in the present design does not allow the friction forces to exorbitantly dominate over momentum forces. These results in controllable pressure increase even at high Re for the pressure range considered except in the case of 10 bar, where the pressure drops are higher and unless controlled would cause damage to upstream equipment due to back pressure. In other words, for inlet velocity magnitudes below 40 m/s, there is a reasonably good balance between the momentum and friction forces (if not equilibrium), and pressure drops are lower (<10,000 Pa) as far as pressure drop is concerned for both designs (with and without a distributor). However, as the velocities increase above 40 m/s, the friction forces overpower the momentum forces (friction dominant regime), causing a sudden increase in pressure drop.
Eqs. 4, 5, 7, 8 were found to be valid for a pressure drop range of 0.06 <∆p < 1.8 bar. Furthermore, the equations for cases with distributors would be valid for different distributor designs for the inlet velocities below 95 m/s and the Pr numbers and Re ranges mentioned. Simulations with a change in the diameter of the holes of the distributor and non-uniform pitch showed that the pressure drops might increase to a maximum by 0.05 bar for which Eqs. 5, 8 gave good predictions.
4.4 Extent of non-uniformity (ENU)
The average %ENU is defined similar to Gandhi et al. (2012) and is given by Eq. 9 as follows:
Figure 13A shows the ENU variation with Re over all the mentioned three pressures without a distributor, while Figure 13B shows the ENU variation with a distributor. It is important to note that when there is no distributor, the %ENU variation varies from 30% to 40% for a pressure of 10, 40, and 70 bar. Figure 13B clearly shows that the non-uniformity is decreased to less than 2% for 70 bar pressures, while it is approximately 4% for 40 and 10 bar pressures.
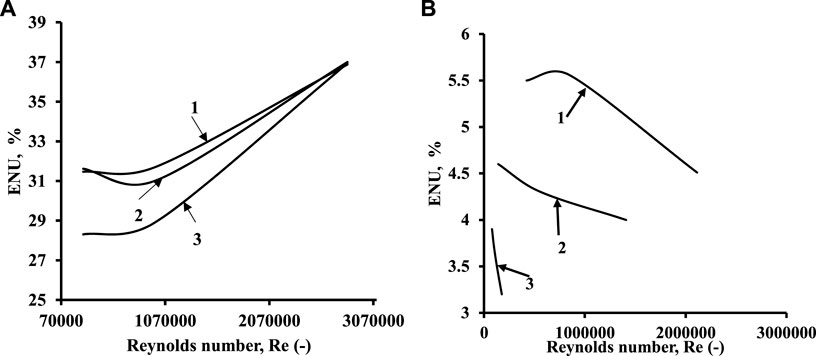
FIGURE 13. Variation of ENU with the Reynolds number for different pressures. (A) Without a distributor. (B) With distributor. Index: 1) p = 10 bar; 2) p = 40 bar; and 3) p = 70 bar.
5 Guidelines for the distributor design for the manifold
Following are the guidelines for designing a distributor for the manifold considered:
1 The perforations of the distributor should be misaligned from the tubes of the manifold.
2 The distributor can have perforations of single or multiple holes depending on the highest pressure drop for flows at high velocities.
3 The pitch between a single row of holes can be non-uniform, starting with the least pitch at the middle and increasing at a linear variation until the end of the distributor. This will again depend on the pressure drop limited to 1.8 bar.
4 The manifold tube diameter to distributor hole diameter ratio should not exceed more than 6 to avoid exceedingly high pressure drops.
5 The header to tube diameter ratios and pitch of the tubes should be as specified in the present work.
6 The distributor can have different sections of hole diameters and pitch for the central and ending sections provided the pressure drops are less than 1.8 bar.
6 Conclusion
Three-dimensional (3D) CFD simulations have been carried out for a header tube assembly for the central inlet and outlet of the top and bottom headers with and without a distributor. The following conclusions are drawn:
1 Incorporating a distributor in an existing design of a header tube assembly chosen for the present work promises good performance in terms of providing uniform flow distribution for a wide range of pressures and Reynolds numbers considered in the study. The non-uniformity is reduced to approximately 4% for the Re range (2.82E+05 ≤ Re ≤ 2.82E+06 and 10 ≤ P ≤ 70 bar). Thus, similar to microscale assemblies, the macroscale assemblies with the central inlet and outlet can also be classified into two variants, namely, (1) conservative without internals (all configurations considered by Gandhi et al. (2012)) and (2) baffle (with internals like perforated baffles as per the optimized design considered in the present work).
2 Pressure drop for such assemblies having the central inlet and outlet increases linearly for the Reynolds number range 7.5E+05 < Re < 1.91E+06 for P = 10 bar and 7.5E+05 < Re < 2.82E+06 for P = 40 bar, while for P = 70 bar and same Re range, there is a steady nonlinear increase following the power law profile.
3 The interplay of momentum and friction forces with respect to operating parameters like pressure and Re number shows different characteristics than anticipated. This is due to the interplay of the momentum and friction forces. For higher pressures (P = 40 and 70 bars) and Reynolds number range (70,000 < Re < 85,000)), there is a reasonable good force balance, while for lower pressures of 10 bar and Re number approximately 106 (velocities approximately 95 m/s, the momentum dominates over friction forces. For higher Reynolds numbers considered in the present study, momentum forces dominate friction forces, leading to flow non-uniformity. Installation of the distributor, however, ensures a reasonable balance between momentum and friction forces, causing a reduction in flow non-uniformity and a corresponding increase in pressure drop.
4 Correlations developed for the friction factor with and without distributors agree well within a 10% deviation with experimental data.
5 The j-factor becomes constant at high Re for the heat exchanger considered in the present work. The j-factor versus Re profiles for the present geometry differs from the conventional j-factors for STHE with flatter profiles after Re = 9 × 10⁴.
6 The correlation for the Nusselt number has been presented based on the Chilton–Colburn analogy. A detailed heat transfer study is beyond the scope of the present work.
7 The correlations for both the friction factor and Nusselt number would be applicable for other distributor designs with pressure drops as high as 1.85 bar in Re and Pr ranges as in the present analysis.
8 Appropriate guidelines for a distributor design for such type of manifold have been provided.
7 Future work
Two-phase simulations (pure steam condensation inside tubes) in such exchangers need to be investigated for studies on pressure drop and heat transfer, and correlations need to be developed. This can then be extended to condensation in the presence of non-condensable gases like air and helium and compared with analytical models and experimental measurements.
Data availability statement
The simulation data supporting the conclusion of this article will be made available by the authors, without undue reservation.
Author contributions
Conceptualization, AG and AP; methodology, AG; software, AG; validation, AG; formal analysis, AG; investigation, AG; resources, AG; data curation, AG; writing—original draft preparation, AG; writing—review and editing, AG; visualization, AG; supervision, AP; project administration, AG; and funding acquisition, AG. All authors have read and agreed to the published version of the manuscript.
Conflict of interest
The authors declare that the research was conducted in the absence of any commercial or financial relationships that could be construed as a potential conflict of interest.
Publisher’s note
All claims expressed in this article are solely those of the authors and do not necessarily represent those of their affiliated organizations, or those of the publisher, the editors, and the reviewers. Any product that may be evaluated in this article, or claim that may be made by its manufacturer, is not guaranteed or endorsed by the publisher.
References
Acrivos, A., Babcock, B., and Pigford, R. (1959). Flow distributions in manifolds. Chem. Eng. Sci. 10, 112–124. doi:10.1016/0009-2509(59)80030-0
Alaqel, S., Saleh, N. S., Saeed, R., Djajadiwinata, E., Sarfraz, M., Alswaiyd, A., et al. (2022). Particle-to-fluid direct-contact counter-flow heat exchanger: Simple-models validation and integration with a particle-based central tower system. Case Stud. Therm. Eng. 33, 101994. doi:10.1016/j.csite.2022.101994
Arsenyeva, O., Tovazhnyanskyy, L., Kapustenko, P., and Demirskiy, O. (2012). Heat transfer and friction factor in criss-cross flow channels of plate-and-frame heat exchangers. Theor. Found. Chem. Eng. 46, 634–641. doi:10.1134/s0040579512060024
Bassiouny, M. K., and Martin, H. (1984). Flow distribution and pressure drop in Plate heat exchangers—I U-type arrangement. Chem. Eng. Sci. 39, 693–700. doi:10.1016/0009-2509(84)80176-1
Buerkle, F., Moyon, F., Feierabend, L., Wartmann, J., Heinzel, A., Czarske, J., et al. (2020). Investigation and equalisation of the flow distribution in a fuel cell stack. J. Power Sources 448, 227546. doi:10.1016/j.jpowsour.2019.227546
Dahikar, S. K., Ganguli, A. A., Gandhi, M. S., Joshi, J. B., and Vijayan, P. K. (2013). Heat transfer and flow pattern in co‐current downward steam condensation in vertical pipes-I: CFD simulation and experimental measurements. Can. J. Chem. Eng. 91, 959–973. doi:10.1002/cjce.21722
Devia, F., Marchitto, A., Fossa, M., and Guglielmini, G. (2015). CFD simulations devoted to the study of fitting effects on the phase distribution in parallel vertical channels. Int. J. Chem. React. Eng. 13, 551–559. doi:10.1515/ijcre-2014-0156
Gandhi, M. S., Ganguli, A. A., Joshi, J. B., and Vijayan, P. K. (2012). CFD simulation for steam distribution in header and tube assemblies. Chem. Eng. Res. Des. 90, 487–506. doi:10.1016/j.cherd.2011.08.019
Ganguli, A. A., Dahikar, S. K., Gandhi, M. S., Joshi, J. B., and Vijayan, P. K. (2013). Heat transfer and flow pattern in co-current downward steam condensation in vertical pipes‐II: Comparison with published work. Can. J. Chem. Eng. 91, 974–991. doi:10.1002/cjce.21719
Ganguli, A. A., Pandit, A. B., Joshi, J. B., and Vijayan, P. K. (2011). Hydrodynamic and heat transfer characteristics of a centrally heated cylindrical enclosure: CFD simulations and experimental measurements. Chem. Eng. Res. Des. 89, 2024–2037. doi:10.1016/j.cherd.2011.02.003
Ganguli, A. A., Sathe, M. J., Pandit, A. B., Joshi, J. B., and Vijayan, P. K. (2010). Hydrodynamics and heat transfer characteristics of passive decay heat removal systems: CFD simulations and experimental measurements. Chem. Eng. Sci. 65, 3457–3473. doi:10.1016/j.ces.2010.02.031
Ghasabehi, M., Ashrafi, M., and Shams, M. (2021). Performance analysis of an innovative parallel flow field design of proton exchange membrane fuel cells using multiphysics simulation. Fuel 285, 119194. doi:10.1016/j.fuel.2020.119194
Gilmore, N., Hassanzadeh-Barforoushi, A., Timchenko, V., and Menictas, C. (2021). Manifold configurations for uniform flow via topology optimisation and flow visualisation. Appl. Therm. Eng. 183, 116227. doi:10.1016/j.applthermaleng.2020.116227
Gusew, S., and Stuke, R. (2019). Pressure drop in Plate heat exchangers for single-phase convection in turbulent flow regime: Experiment and theory. Int. J. Chem. Eng. 2019, 1–11. doi:10.1155/2019/3693657
Hadad, Y., Rangararajan, S., Nemati, K., Ramakrishnann, B., Pejman, R., Chiarot, P. R., et al. (2020). Performance analysis and shape optimization of a water-cooled impingement micro-channel heat sink including manifolds. Int. J. Therm. Sci. 148, 106145. doi:10.1016/j.ijthermalsci.2019.106145
Ji, F., Yang, L., Li, Y., Sun, H., and Sun, G. (2019). An experimental method to measure flow distribution in the cathode of high‐temperature polymer electrolyte membrane fuel cells stack. Energy Technol. 7, 1900416. doi:10.1002/ente.201900416
Ju, X., Xu, C., Zhou, Y., Liao, Z., and Yang, Y. (2018). Numerical investigation of a novel manifold micro-pin-fin heat sink combining chessboard nozzle-jet concept for ultra-high heat flux removal. Int. J. Heat Mass Transf. 126, 1206–1218. doi:10.1016/j.ijheatmasstransfer.2018.06.059
Kadijani, O. N., Moghadam, H. K., Ajarostaghi, S. S. M., Asadi, A., and Pour, M. S. (2022). Hydrothermal performance of humid air flow in a rectangular solar air heater equipped with V‐shaped ribs. ENERGY Sci. Eng. 10, 2276–2289. doi:10.1002/ese3.1136
Kazemi Moghadam, H., Mousavi Ajarostaghi, S. S., and Poncet, S. (2021). Numerical modeling of an innovative arc shape rib based solar air heater. Proc. Institution Mech. Eng. Part C J. Mech. Eng. Sci. 235, 7992–8012. doi:10.1177/09544062211039541
Kubo, T., and Ueda, T. (1969). On the characteristics of divided flow and confluent flow in headers. Bull. JSME 12, 802–809. doi:10.1299/jsme1958.12.802
Lim, B., Majlan, E., Daud, W., Rosli, M., and Husaini, T. (2018). Numerical analysis of flow distribution behavior in a proton exchange membrane fuel cell. Heliyon 4, e00845. doi:10.1016/j.heliyon.2018.e00845
Midoux, N., and Tondeur, D. (2015). The theory of parallel channels manifolds (ladder networks) revisited part 2: Design for uniform cross-flow distribution. Can. J. Chem. Eng. 93, 121–140. doi:10.1002/cjce.22099
Minocha, N., and Joshi, J. B. (2020). 3D CFD simulation of turbulent flow distribution and pressure drop in a dividing manifold system using openfoam. Int. J. Heat Mass Transf. 151, 119420. doi:10.1016/j.ijheatmasstransfer.2020.119420
Mohammadali, R., Bayareh, M., and Sheikhzadeh, G. A. (2021). Study of flow uniformity within convergent microchannels with a circular manifold. J. Braz. Soc. Mech. Sci. Eng. 43, 74–10. doi:10.1007/s40430-020-02784-7
Mousavi Ajarostaghi, S. S., Aghanezhad, M., Davudi, H., and Mohammadzadeh Amiri, M. (2021). Numerical evaluation of the heat transfer enhancement in a tube with a curved conical turbulator insert. Int. J. Ambient Energy, 1–14. doi:10.1080/01430750.2021.1945490
Pigford, R. L., Ashraf, M., and Miron, Y. D. (1983). Flow distribution in piping manifolds. Ind. Eng. Chem. Fund. 22, 463–471. doi:10.1021/i100012a019
Salhi, J. E., Mousavi Ajarostaghi, S. S., Zarrouk, T., Saffari Pour, M., Salhi, N., and Salhi, M. (2022). Turbulence and thermo-flow behavior of air in a rectangular channel with partially inclined baffles. Energy Sci. Eng. 10, 3540–3558. doi:10.1002/ese3.1239
Tomor, A., and Kristóf, G. (2016). Validation of a discrete model for flow distribution in dividing-flow manifolds: Numerical and experimental studies. Period. Polytech. Mech. Eng. 60, 41–49. doi:10.3311/ppme.8518
Turek, V., Kohoutek, J., Jegla, Z., and Stehlík, P. (2009). Contribution to analytical calculation methods for prediction of uniform fluid flow dividing in tubular distributor. Chem. Eng. Trans. 18, 809–814. doi:10.3303/CET0918132
Wang, J. (2011). Theory of flow distribution in manifolds. Chem. Eng. J. 168, 1331–1345. doi:10.1016/j.cej.2011.02.050
Wang, J., and Wang, H. (2015). Discrete method for design of flow distribution in manifolds. Appl. Therm. Eng. 89, 927–945. doi:10.1016/j.applthermaleng.2015.06.069
Wei, X. L., Wang, Q. H., and Pan, M. Q. (2010). Numerical simulation of velocity distribution among microchannels with bifurcation structures as manifolds. Adv. Mater. Res. Trans Tech Publ 108-111, 1009–1012. doi:10.4028/www.scientific.net/AMR.108-111.1009
Zeng, S., and Lee, P. S. (2018). “A header design method for target flow distribution among parallel channels based on topology optimization,” in Proceedings of the 2018 17th IEEE intersociety conference on thermal and thermomechanical phenomena in electronic systems (ITherm): IEEE, San Diego, CA, USA, 29 May 2018-01 June 2018, 156–163.
Zhang, W., Li, A., Gao, R., and Li, C. (2018). Effects of geometric structures on flow uniformity and pressure drop in dividing manifold systems with parallel pipe arrays. Int. J. Heat Mass Transf. 127, 870–881. doi:10.1016/j.ijheatmasstransfer.2018.07.111
Zhao, C., Wang, C., Zhang, T., and Pu, J. (2017). “Flow distribution analysis in the SOFC stack using CFD technique,” in Proceedings of the International Conference on Fuel Cell Science, Engineering and Technology: American Society of Mechanical Engineers). V001T002A003, Charlotte, NC, June 26–30, 2017.
Zhao, C., Yang, J., Zhang, T., Yan, D., Pu, J., Chi, B., et al. (2020). Numerical modeling of manifold design and flow uniformity analysis of an external manifold solid oxide fuel cell stack. Int. J. Hydrogen Energy 45, 14440–14451. doi:10.1016/j.ijhydene.2020.02.143
Zhuang, X., Xia, X., Xu, X., and Li, L. (2020). Experimental investigation on hydrogen production by methanol steam reforming in a novel multichannel micro packed bed reformer. Int. J. Hydrogen Energy 45, 11024–11034. doi:10.1016/j.ijhydene.2020.02.034
Zhuang, X., Xu, X., Li, L., Xin, X., and Xu, W. (2019). “CFD and experimental analyses of flow distribution uniformity in minichannel reactors with a bifurcation structure manifold,” in Proceedings of the IOP Conference Series: Earth and Environmental Science: IOP Publishing, Macao, China, 21–24 July 2019, 012045.
Zoljalali, M. A., and Omidbakhsh Amiri, E. (2020). Study of the flow distribution in parallel micro-channels with a triangular manifold. J. Braz. Soc. Mech. Sci. Eng. 42, 46–49. doi:10.1007/s40430-019-2140-x
Notations
Cn notations for different configurations (-); n varies from 1 to 5
De equivalent diameter of the channel (m)
Dh diameter of the header (m)
Dp pitch (m)
Dt tube diameter (m)
ENU extent of non-uniformity (-)
f Fanning friction factor (-)
fch Fanning friction factor in a channel (-)
fwod Fanning friction factor for the without-distributor case (-)
fwd Fanning friction factor for the with-distributor case (-)
H height of the tube connecting the headers (m)
h heat transfer coefficient (W m−2 K−1)
i iteration number
jh j-factor as in the Chilton–Colburn analogy
k thermal conductivity of the fluid (W m−2 K−1)
l1 ratio of the distance between distributor plate perforations to the adjacent tube opening in the header
l2 the distance between the two consecutive perforations in the distributor
L header length (m)
Le effective length of the manifold (m)
mi mass flow rate of individual tubes (kg/s)
mavg average mass flow rate (kg/s)
Nu (hD/k) Nusselt number (-)
N number of tubes (-)
P pressure (bar)
Pr Prandtl number,
Re Reynolds number (
u, average velocity in a channel (m/s).
Greek symbols
Keywords: optimized manifold, pressure drop, heat and mass transfer analogy, flow non-uniformity, microchannels, flow patterns
Citation: Ganguli AA and Pandit AB (2022) Computational fluid dynamics simulations to improve performance characteristics of a manifold having a central inlet and outlet. Front. Energy Res. 10:1013540. doi: 10.3389/fenrg.2022.1013540
Received: 07 August 2022; Accepted: 27 September 2022;
Published: 21 October 2022.
Edited by:
Yilin Fan, UMR6607 Laboratoire de Thermique et Énergie de Nantes (LTeN), FranceReviewed by:
Seyed Soheil Mousavi Ajarostaghi, Babol Noshirvani University of Technology, IranMin Wei, Shandong University, China
Copyright © 2022 Ganguli and Pandit. This is an open-access article distributed under the terms of the Creative Commons Attribution License (CC BY). The use, distribution or reproduction in other forums is permitted, provided the original author(s) and the copyright owner(s) are credited and that the original publication in this journal is cited, in accordance with accepted academic practice. No use, distribution or reproduction is permitted which does not comply with these terms.
*Correspondence: Arijit A. Ganguli, Z2FuZ3VsaWFyaWppdEBnbWFpbC5jb20=