 Kalim Ullah
 Jiang Quanyuan1*
 Guangchao Geng
- 1College of Electrical Engineering, Zhejiang University, Hangzhou, China
- 2Electrical Engineering Department, University of Science and Technology Bannu, Bannu, Khyber Pakhtunkhwa, Pakistan
Self-sustaining microgrids (MG) are now possible due to the integration of renewable energy and communication technology in utility. It is essential to have an effective energy management system (EMS) because of the unpredictable response of these resources, the uncertainty of the load variations, and the market pricing. Only operational expenses have been considered while discussing MG’s optimum operation so far. It is necessary to examine the potential of adding demand-side management (DSM) to the energy management system challenges and its impact on overall operational costs and peak reduction. This article investigates the influence of the load shaping approach that is imposed by the utility on non-dispatchable energy sources. A stochastic EMS framework is developed to come up with an optimum solution for day-ahead scheduling and minimize operating costs for grid-connected MG. Using real-time weather data, four different solar and wind power production profiles are developed in the first step to address the issue of unpredictability. MG system design, operational restrictions, and allocating demand side management load participation data to the goal function are all addressed in this second step of the algorithm development. Artificial Bee Colony (ABC) is designed in the third stage to find the ideal setup of DG units for maximum electricity dispatch and comparing outcomes for all scenarios with and without DSM involvement. It has been shown that with a 20% DSM load participation, a proposed stochastic framework may save costs by 62%, according to the simulation results.
1 Introduction
The structure of traditional power networks has evolved over the last several decades as a result of the advent of uncertain renewable generation (URGs) and cutting-edge communication and control technology (Arefifar et al., 2018). Increasing use of high penetration URGs and improved development of demand-side resources (DSRs) have been regarded as two significant technical advancements to support the sustainable growth of current energy infrastructure, which is made possible by the goal of reducing total cost (Yang and Xia, 2017). A microgrid (MG), which may be integrated with different URGs, energy storage systems (ESSs), and DSRs, is a viable way to offer clean and renewable electricity as a crucial part of the energy transition of the traditional power systems (Che et al., 2017).
Microgrids (MGs) are autonomous systems that support the incorporation of distributed energy resources (DERs) and renewable energy for reliability and cost-effectiveness reasons (Che et al., 2014; Che and Shahidehpour, 2014; Dang et al., 2014). Microgrids are essential elements of smart power distribution networks for regulating the resilience of the power system under adverse circumstances. They may be operated in either a grid-connected or an island mode. To improve the dependability, resilience, and economics of power networks, a community of microgrids that are physically linked to one another forms a cluster (Loh et al., 2013), (Che et al., 2015). When microgrids are interconnected the optimal power-sharing for cost optimization is studied in (Ullah et al., 2022a). In (Ullah et al., 2022b) the impact of power-sharing and demand response is calculated using the ABC algorithm.
With the help of contemporary information and communication technology, the SG can modify the production of renewable energy, develop intelligent monitoring systems, and distribute and transfer grid electricity (Zhang and Xia, 2009). The SG may also build the infrastructure, administer the decentralized energy resources, and govern and manage the power market (Kolokotsa, 2016). By assessing the current and future state of the electrical market, choosing a financially viable choice for energy supply, and modeling and describing the system load, the DSM supports the SG functions (Macedo et al., 2013). To satisfy the rising energy demand, however, SG’s capacity must be increased, which necessitates the building of infrastructure for power production and transmission (Nguyen et al., 2012). The creation of new infrastructure will raise relevant system expenses as well as the complexity of the SG networks. By lowering peak load demand, altering load profiles, and lowering total costs and carbon emissions, the DSM may also enhance grid sustainability. Previous research documented the effects of DSM on SG’s decreased carbon emissions. For instance, by introducing electric cars and a DR program, Zhang et al. decreased the amounts of carbon emissions in the SG environment (Zhang et al., 2016). A bid-scheduling DSM approach was adopted in Singapore by Ai et al. to encourage customers and lower carbon emission levels (Ai et al., 2010). On the basis of the DR program in the SG environment, they created demand-side reserve scheduling in this instance. To examine and assess carbon emission levels from various portions of an SG network, Li et al. suggested a carbon emission flow model (Li et al., 2017). Participation in the energy management program is collaborative between DSM and supply-side management.
Traditional power system optimization and control strategies are primarily centralized and model based. Traditional methods, on the other hand, are gradually becoming unable to meet the demands of power system development, such as dynamic grid operations optimization, distributed energy resources, and generation, distributed demand side management (DSM), an uncertain market environment, a lack of information about bidding rivals, and massive power data processing. If not adequately managed, a system with RE would entail dealing with extra technicalities such as power quality or reliability difficulties.
Incorporating renewable energy (RE) sources into electrical grids presents a unique issue in the form of unpredictably fluctuating power supply. The difficulty in accurately estimating generation could be due to available wind speeds that are much below or far beyond the installed wind turbine’s cut-in or cut-out speeds; or reduced solar insolation due to cloud cover. This makes managing sudden surges and dips in power supply or demand more difficult for energy planners, necessitating the development of technology that can increase system efficiency and dependability (Locatelli et al., 2015). Because most grids are still operated on fossil fuels, coal, or nuclear power, where the supply level is predictable, renewable energy sources require storage devices to control their supply and keep up with the performance of traditional systems. Energy management of power networks using storage systems attempts to reduce the microgrid’s investment, operating, and maintenance costs (Khan et al., 2016), while keeping the system’s reliability at a reasonable level, as shown in Figure 1.
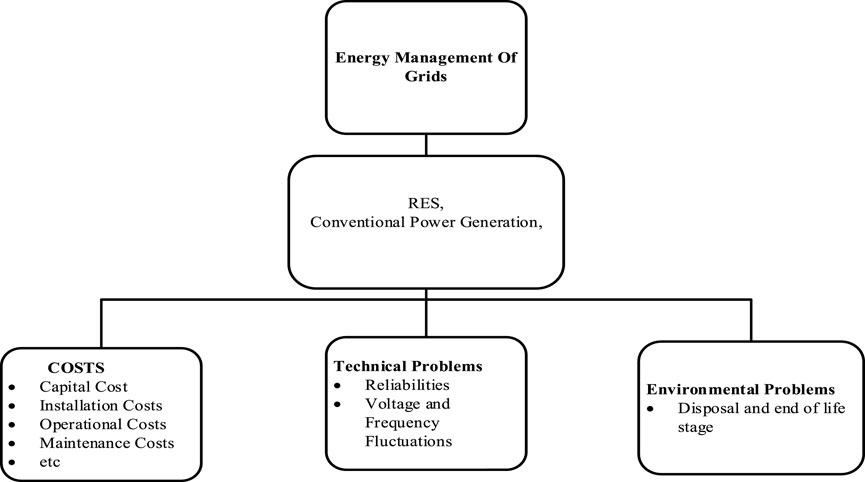
FIGURE 1. Energy management system in MG.
Renewable energy sources are becoming the adopted sources of energy supply for new energy networks as more electrical networks migrate to greener, lower-carbon technologies and decommission coal and nuclear power facilities. The adoption of energy storage devices can help solve the problem of their intermittent supply. According to one forecast, storage capacity will exceed 1000 GW by 2030, when solar and wind capacities have surpassed 5000GW, owing to their application in electric vehicles, pumped hydro, and batteries (Ralon et al., 2017).
Energy storage systems come in a number of technologies, on small and big scales, with their own set of characteristics and limits that limit where they can be used, and are available at a variety of prices. Storage systems are also becoming more important as the global demand for power for transportation and heating rises (Brandon et al., 2017). Energy storage systems have a number of technical advantages, including increased system stability and reliability, lower voltage and frequency variations, and fewer outages (Table of Contents, 2018). When they’re used in a system, they can also create revenue.
This work discusses the energy management of networks that include energy storage technologies. Energy management is critical for efficiently utilizing the energy storage system while also protecting it from excessive charging and draining (Manandhar et al., 2019) and minimizing all associated network operating costs. As a result, minimizing ESS investment costs requires optimizing the planning and operation of energy storage systems (ESS) for viability and maximum advantages.
To achieve the above requirements, power systems must include advanced optimization and management techniques that can tackle the problem on a local level. Simultaneously, information from power unit neighbours should be used to optimize and integrate the entire power system. In addition, a vast amount of historical power data, as well as neighborhood data, should be collected in order to achieve precise power system control and management.
1.1 Microgrid new technologies
There are many different kinds of generating technology available for microgrids. Just a few of these include internal combustion engines, GT, MT, PV, FC, and WT technologies. Aside from that, a slew of new technologies has arisen in recent years. This chapter collects the most common new generation technology.
Wind energy is converted to electricity by a wind-electric turbine generator. A blade, often known as a rotor, is the most important component in wind-electric systems. The blades of the wind turbine generator are moved by air. Because the air pressure is low, the blades should have a large diameter. The diameter of a 1 kW WT blade in normal conditions is roughly 2.6 m. A gearbox, generator, control electronic equipment, grounding, and connectivity devices are all included in the wind-electric turbine generator. The rotor is suspended from a tall tower. Wind-electric systems are now widely used all over the world. To generate power at a reasonable cost, all that is required is the discovery of a windy location. (American Clean Power Association, 2020).
Solar energy is converted into electricity using photovoltaic systems. A photovoltaic module, sometimes known as a PV panel, is a collection of solar cells. The solar cell is an apparatus that converts Sun photons into the electric charges that make up an electric current. There are numerous advantages to employing photovoltaic systems. The photovoltaic systems’ modular design enables their quick installation in any location. Cooling systems are not necessary for PV cells, and their environmental effect is minimal (Hosseini Imani et al., 2018).
Micro-hydro power plants are also often employed in micro-generating, there are two different kinds of turbines used in micro-generations. The most popular turbine type in high-head power plants is the so-called Pelton wheel, which has a large number of cups connected to it, as the water presses down on the cups, the turbine rotates on its axis as a result. The Asymmetrical flow Kaplan turbine, which has the hub in the same direction as the water flow, is another form of micro-hydro turbine that is appropriate for low-head plants. The fundamental advantage of hydropower turbines is that they create power on a continuous basis, despite the fact that the water flow varies slightly during the year. The challenge with micro-hydro plants is that they are still in the design phase: how to build a turbine for the least amount of money and with the least amount of environmental impact. (Hosseini Imani et al., 2018).
Natural-gas generating stations are the most ideal in microgrid systems due to their low air emissions, lower price, and availability. However, diesel-fuelled generators continue to dominate in short-term applications or as backup energy sources. By improving the design and management of the combustion process, the emissions from natural gas systems have been permanently reduced. Advanced natural-gas applications have reached nitrogen oxide production levels of less than 50 ppmv, which is a big step forward in environmental protection, the majority of these systems still need to utilize exhaust catalysts, which significantly lowers system efficiency. Dramatically. Consequently, it is still difficult to have both high efficiency and low emissions at the same time (Engler, 2000).
Microturbines are power plants that use a field rotating machine, typically a permanent magnet machine, to generate electricity at a high uniform speed. It is a crucial advanced technology for the next-generation. Microturbines run on a variety of fuels, such as natural gas, gasoline, and other liquid or gaseous fuels. This type of plant emits less than 10 parts per million of NOx. However, because the microturbines’ speeds are so unpredictable, complex power electronic technologies are needed to connect them to the grid. Micro-turbines, on the other hand, have low electricity-generating efficiency, often around 20% of the fuel efficiency. The efficiency of the system could be greatly improved if expensive and sophisticated recuperator technology is applied. In any case, 70 to 80 percent of the heat is produced through the process of thermal conversion of fuel energy, and this heat must be required to make micro-turbines profitable (Engler, 2000).
The main fuel for fuel cells, which generate energy, is hydrogen. The use of molten carbonate, solid oxide, and phosphoric acid cells is currently widespread and becoming commercially affordable. These systems emit extremely few pollutants and have a high efficiency when compared to other power plants, but their production technique is much more expensive (Engler, 2000).
A piston heat engine is the Stirling engine. It falls under the category of an external combustion engine. These engines operate on the principle of hot air pressure. It is a very cost-effective engine that also has a low environmental impact (Hosseini Imani et al., 2018). The tensions in the heat exchanger materials cause complications in the Stirling engine. Due to manufacturing issues, this machine type is not as common as it once was.
A diesel internal combustion engine powers diesel generator sets. The diesel generator’s operational concept is the process of converting the mechanical energy of a diesel engine to electrical energy through the use of an electrical generator. Diesel generator sets are currently commonly employed. These generators do not require any particular installation requirements or locations. However, because diesel engines have such a big environmental impact, their use is decreasing (Hosseini Imani et al., 2018).
1.2 Demand side management program
The electricity grid’s stability is important (Momoh, 2012). As a result, as shown in Figure 2, power suppliers work hard to maintain a constant supply and demand balance. Demand response (DR) and demand-side management (DSM) are created and applied to maintain grid balance and make smooth Peaks and valleys in the demand for electricity (Strbac, 2008; Gelazanskas and Gamage, 2014). DSM and DR, on the other hand, have numerous problems.
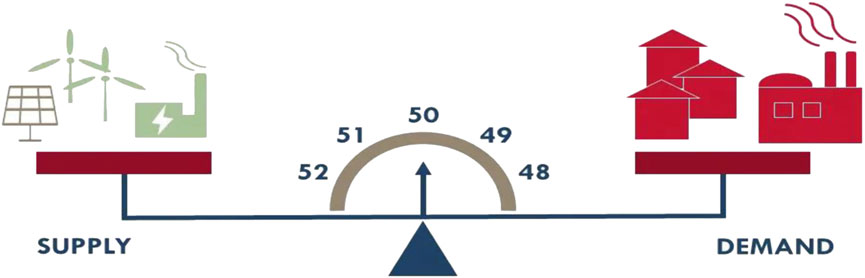
FIGURE 2. Demand and supply.
Historically, load management has been referred to as DSM and DR. The electricity demand fluctuates a lot throughout the course of a day. As a result, grid stability may be compromised. As a result, one of the key causes of concern for generation businesses is variations in power consumption. Clark Gellings (Electric Power Research Institute, United States) originated the term DSM in the early 1980s (Arteconi et al., 2012). DSM (Gelazanskas and Gamage, 2014) also refers to the monitoring, implementation, and planning of utility actions aimed at changing the end user’s power profile. DSM programs are designed to encourage customers to be more energy efficient. To put it another way, DR is the activity taken by customers to reduce their energy consumption for a certain time period, while DSM is meant to induce end-users to modify their power profiles and often seeks for long-term reduction (Logenthiran et al., 2012). Customers might, for instance, increase their off-peak power use while decreasing it during peak hours (usually at night). For three reasons, end users adjust to the DSM or change their power profile to reflect the DSM:
• Electricity energy suppliers must establish an adequate flexible pricing strategy to entice customers to regulate their energy consumption and vary the form of their electricity demand based on their lifestyle (By arranging their dynamic activities for off-peak hours, they may lower demand during on-peak hours).
• End users’ capacity to modify their power profiles: It's essential that end users have access to a control system that enables them to regulate and keep track of their energy use (change their living style). On the other hand, certain loads, such as television, computer, beard trimmer, or lights, cannot be postponed or moved to a different time.
• The capacity to calculate the earnings generated by DSM adoption: It is important for customers to be able to identify how much money they saved by utilizing DSM since this will motivate them to continue participating in DSM. As a result, a suitable interface is required. Also, providing a comprehensible overview of the activities might be quite beneficial, especially for those who are unfamiliar with how to compute electricity bills (Braithwait et al., 2007).
1.3 Different types of DSM
The utility’s total load and the period of load consumption are influenced by the successful implementation of DSM, which lowers predicted peak loads (De Vizia et al., 2022). The DSM affects the load shape of the power distribution network and manipulates client energy use patterns to create the desired changes in load profiles and lower electricity bills (Hongming et al., 2006; Logenthiran et al., 2012). Basically, the DSM lowers peak loads, which lowers operational expenses and capital expenditures and helps to prevent the creation of surplus electricity (Kinhekar et al., 2014). The DSM may be divided into six broad categories based on the daily and seasonal power use as shown in Figure 3. These techniques consist of load shifting, peak clipping, valley filling, strategic load increase, strategic load conservation, and variable load shape (Gellings, 1985; Sinha and De, 2016; Kalair et al., 2020).
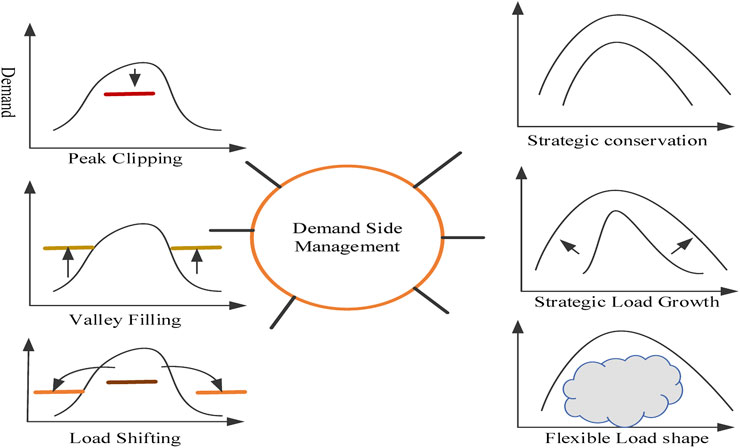
FIGURE 3. DSM techniques.
The demand curve is shaped using a variety of DSM techniques (Logenthiran et al., 2012; Zhu et al., 2012; Gelazanskas and Gamage, 2014), as shown in Figure 3, in addition, but not restricted to:
• Load shifting: the main purpose of load shifting is the transfer of load from peak to off-peak hours, like heating of water for use in off-peak hours (night time) and to utilize it in the peak hours.
• Conservation: Conservation is the best-known method of reducing overall electricity usage, not just during peak hours. For instance, power may always be saved by using energy-efficient equipment.
• Peak clipping: The strategy’s main objective is to lessen demand during peak hours (e.g., at 07:00 PM). Controlling interruptible equipment, such as an air conditioner or heater, by customers or electrical suppliers helps reduce energy use.
• Valley filling: in valley filling the load demand is increased in off-peak hours and decreases in the peak hours. The best example of valley filling is charging the PHEV in the night time which is off-peak time.
• Load Growth: In contrast to conservation policy, load growth involves increasing the total amount of sales (off-peak and peak hours).
• Flexible load shape: Under this technique, the utility company has the authority to interrupt loads as needed without informing customers. Variations in service quality or quantity are typically referred to as flexible load shapes.
Almost all DSM plans are created and carried out to make the best use of the present power plants. A further crucial goal is to prevent, postpone, or delay new power plants that are required (conventional or renewable plants).
In this paper impact of DSM on operational cost is measured. To further minimize operational expenses, a DSM program imposed by the utility is added to the issue.
A stochastic EMS framework is created to execute and evaluate the flexible load-shaping DSM method, price-based demand response programs (DRPs), and incentive-based DRPs (Kumar et al., 2021). In (Philipo et al., 2022) suggests a demand-side management approach based on peak clipping and load shifting. An ANN approach is used for optimization in (Philipo et al., 2022).
An artificial bee colony (ABC) has never been used previously to solve optimal energy management in MG. Photovoltaic (PV), wind turbine (WT), Fuel cell (FC), Microturbine (MT), and Battery energy storage system (BESS) are all incorporated into the microgrid.
Four distinct RES scenarios are developed using real-world data. By using the ABC algorithm to resolve the EMS problem, a comprehensive comparison of optimal solutions for scenarios with and without DSM involvement is given. The paper consists of five different cases and in each case, the impact on operational cost is separately calculated. In the first case which is considered a base case or case 1, the operational cost is calculated without using DSM. In the second case, the 5% DSM strategy is used to find the operational cost in cases 3,4, and 5, 10%,15%, and 20% DSM is considered the more the percentage the DSM is used the less will be the operational cost. This work shows that case 5 which consists of the highest percentage of DSM will be the best case. The process is divided into four different weather scenarios and for different scenarios different solar and wind profiles are considered. From these four scenarios, it is derived that the high the incorporation of renewable energy sources in microgrid DSM the high will be the cost. The different scenarios with operational costs are represented in the results and which show the increasing cost due to the increase in penetration of renewable sources.
2 Microgrid clustering
There are several reasons why microgrids should be integrated. The first and most important advantage of microgrid interconnection is the capacity to share reserves under critical situations (e.g., the loss of a major generator) to reduce the likelihood of system collapse, minimize emergency load shedding needs, and improve overall system dependability.
The economic dispatch in multi-microgrids systems, which may occur in either grid-connected or island mode, is the second advantage of interconnectivity. A microgrid with surplus solar power output, for example, might support an adjacent weak microgrid, benefiting both microgrids economically.
The third advantage is that storage and auxiliary tasks may be shared.
Large energy storage systems in a microgrid, for example, might supply important loads in several linked microgrids before thermal generating units in individual microgrids can take up the appropriate loads.
The fourth advantage is related to microgrid resilience. In an emergency, microgrids may face extraordinary problems, such as inadvertent islanding caused by a large disruption on the utility side. The effect of such situations may be mitigated by adequate and strategic connectivity of microgrids. A big microgrid may also be divided into linked Nano grids (loops) for control reasons. A distributed generating system in a microgrid, for example, may be partitioned into many Nano grids to improve local dependability (Arefifar et al., 2013).
The microgrid energy management system input information flow and functionality are represented in Figure 4.
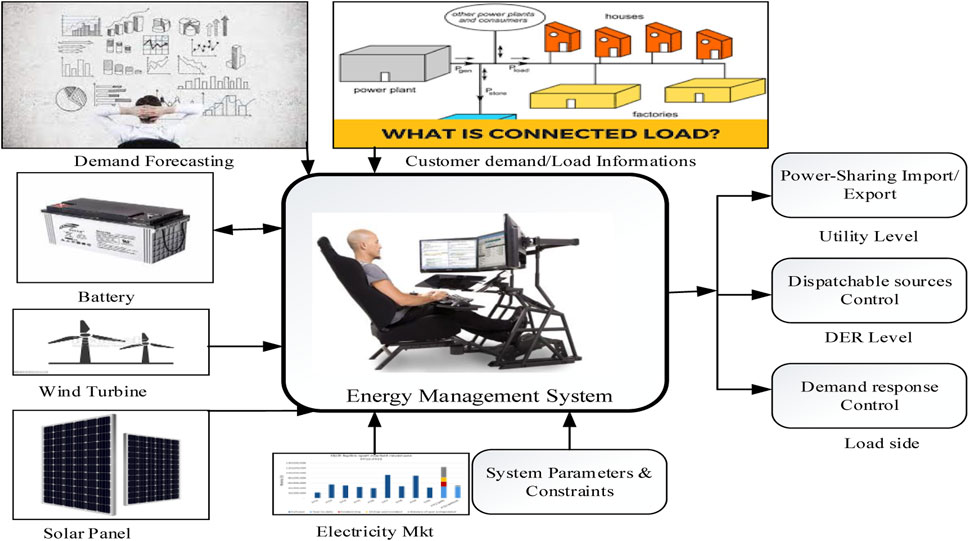
FIGURE 4. Microgrid EMS.
3 Problem formulation
3.1 ABC algorithm in MG-EMS
The artificial bee colony algorithm (ABC) is an optimization tool based on honey bee swarm foraging behaviour (Yi and He, 2014). It replicates bee colony swarm intelligence integration in foraging operations.
The colonies of real bees are divided into three categories: 1) Bee workers (called also Employee bees). 2) Onlooker bees 3) Bee scouts.
The employed bees discover the food source’s neighbourhood; onlooker bees get knowledge about food sources from the dancing of employed bees inside the hives and choose a good food source. The scout bees investigate new food sources at random. Because each employed bee is linked with just one food source, the number of employed bees or onlooker bees in the ABC algorithm is equal to the number of food sources. Each food source represents a potential solution to an optimization issue, and the quantity of nectar correlates to the fitness value.
In each cycle of the ABC algorithm, a random solution is generated, i.e., the bees randomly choose a selection of food sources and exchange nectar quantity information with onlooker bees. Second, they contrast a new food supply in the area with an existing food source. The likelihood of selecting a food source rises as the quantity of nectar from that food source increases. Following that, some employed bees abandoned their food source in search of a new food source. This cycle is repeated until a termination requirement is met. Onlooker bees and employed bees are chosen at random.
Onlooker bee selects a food source based on roulette wheel selection. The probability value
Where, PN is population size equal in number to employee bee
Where, rand is a random value between -1 and 1.
4 Mathematical modeling and operational constraints of MG components
In order to evaluate the suggested design as shown in Figure 5, a sample low voltage grid-connected microgrid was taken into consideration. A microgrid central controller will monitor and regulate the exchange of energy between MG and utilities using microgrid central controller (MGCC). The main responsibility of microgrid central controller is to allocate power references to (LCs) local controllers in order to meet the power balance limitations for the given time T. In order to meet the power need, the surplus (shortfall) energy provided by storage devices must be absorbed (supplied) by the micro-source controller (MC) and load controller (LC). While accounting for predicting errors. The system contains Photovoltaic (PV), wind turbine (WT), fuel cell (FC), microturbine (MT), and energy storage technologies, among other DG elements.
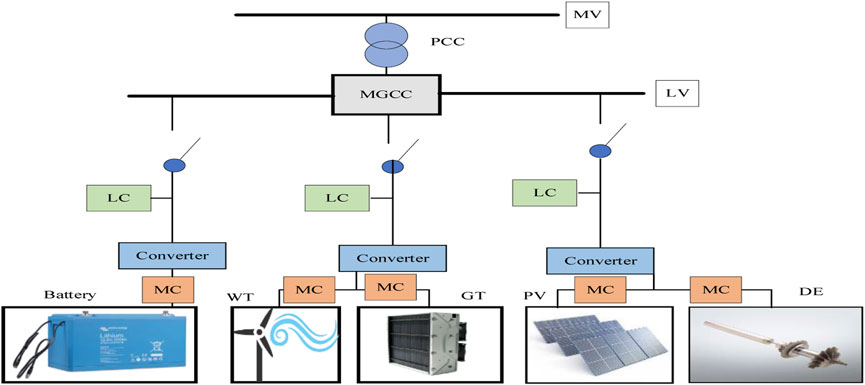
FIGURE 5. Typical microgrid.
4.1 Solar photo voltaic model
The power output of a PV system might change depending on location, module features, and metrological factors like Sun irradiation
Where,
Typically, A Beta Probability Density Function describes the hourly solar irradiation
For solar uncertainty modelling, the probability of a discrete state with irradiance limitations of
4.2 Wind generation uncertainty model
The intermittent nature of the wind is the main factor affecting the power produced by the WT. Many researchers use the Weibull distribution to represent the timely fluctuations in wind speed (Radosavljević et al., 2016). The following is the Weibull probability distribution function:
Following is a representation of the actual power produced by WT using the simulated wind velocity.
Where, v is the wind velocity,
4.3 Microturbine and fuel cell model
The cost values are derived from (Yi and He, 2014) and the cost function estimate of DG units is obtained as shown in (Radosavljević et al., 2016). The DG bids are provided as follows after taking into account the depreciation cost (
Where interest rate is represented by
Where,
4.4 Battery energy storage system
Battery energy storage play an important role in energy management system of microgrids. When the power generated by microgrids exceeds the required demand, then extra power generated will be stored in battery until it is fully charged up to
In Equation 17 as the battery is full the extra power generated will either be shared with other microgrids or with the main grid.
Eq. 18 shows the discharging process of battery, where
Eq. 19 represents that if the generated power of microgrid is less than the load of microgrid, and SOC of battery is minimum
4.5 Scenario creations
To deal with the uncertainty issue of MG elements, such as solar power and wind power generation, stochastic programming is often used. In this study, the scenario-based approach is used to simulate the stochastic behaviour of variables related to wind speed and solar PV irradiance. Modeled as (Wu et al., 2007), the uncertainty in solar and wind power production are listed below:
where
5 Problem statement
The operational limitations of the DG units linked to the grid would be the first step in the day-ahead microgrid optimum scheduling issue, which would then follow the cost objective function in detail. The main objective of this article is to identify the ideal DG unit generation set points for reducing the overall cost incurred by demand response. Included in the overall costs are the fuel used by DG sources, unit starting expenses, and the market price for exchange of power between microgrid and main grid. The following is a representation of the mathematical model for this problem (Moghaddam et al., 2011).
5.1 Objective function
Objective function of this research is to reduce operational cost of microgrid.
Where,
5.2 Demand side management
By changing the load profile of customers, DSM techniques significantly contribute to enhancing the economics of distribution network operators. DSM projects are divided into utility-induced and customer-induced schemes. The most effective DSM technique implemented by utility to take maximum advantage of the timing flexibility of controlled loads is flexible load shaping (Logenthiran et al., 2012), (Rangu et al., 2020). The central DSM controller considers the required steps to achieve the target load profile after receiving the load prediction data. The customer interacts with the DSM program during hourly dispatch and communicates back and forth to get scheduling signals (Lokeshgupta and Sivasubramani, 2018). To decrease system peak and total operational costs, the flexible load shaping deman side management technique is therefore included as a key aim of the day-ahead EMs challenge. The DSM approach is used to adjust the intended load consumption profile such that it closely resembles the ideal load profile as stated below [50].
Where,
The two components of
where
Where
Number of devices shifted will always be positive.
6 Results and discussions
As already discussed above that in this article four different scenarios are generated for photovoltaic (PV) and wind turbine (WT). To check the impact of DSM on operational cost of microgrids five different cases are considered. The first case is a base case which is case 1, in base case the operational cost is calculated without using DSM. In second, third, fourth, and fifth cases 5%, 10%, 15% and 20% DSM is considered respectively and the impact on operational cost is calculated. The more involvement of DSM the less will be the operational cost as the load and generation will properly be managed to reduce the operational cost. The best case which is our desired result is case5 with 20% DSM. All the operations and comparisons of different cases are shown in the figures of all the cases.
6.1 Case 1 (base case)
In case1 the optimized operational cost is calculated without DSM for different scenarios as shown in Figure 6.
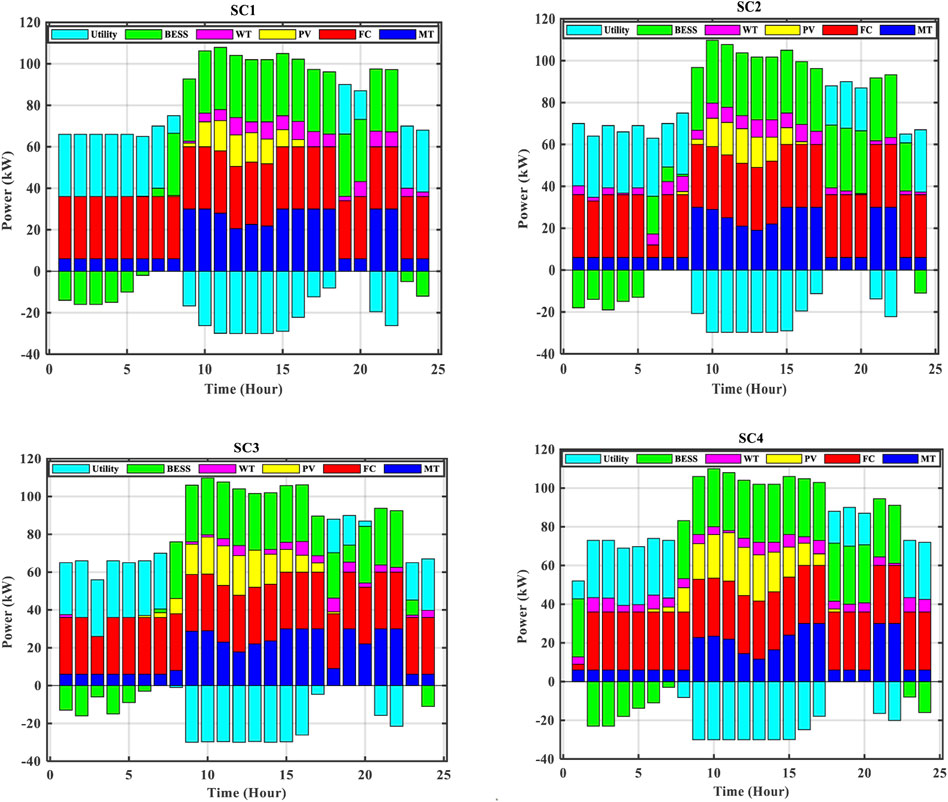
FIGURE 6. Case1 with scenarios 1,2,3,4.
In Figure 6 from 1 to 6 h utility, fuel cell and microturbine is providing electricity as shown in SC1, also during this period the electricity is cheap and is used to store in BESS. From 7 to 8 h utility MT, FC and BESS is used to meet load demand. From SC1 it is clear that from 9 to 18 h which are peak hours, MT, FC, BESS, PV and WT are used to meet load demand as well as the extra amount of energy is sold to utility on higher price. From Figure 6 it is clear that in any hours if the internal sources are able to meet the load demand, then no need to import/export energy from/to utility. The operating cost gradually increases from scenario 1 to scenario 4 is 252.61, 257.43, 322.32, 444.74 €/kWh. Because of the elevated bid prices for PV and WT among other DG components, it is obvious that the share of renewable power generation steadily grows in each scenario, increasing overall operating costs.
6.2 Case 2 with 5% DSM
In Case 2, the impact of DSM implementation on microgrid energy management system with a participation rate of 5% is investigated. The optimal power dispatch method employing the ABC algorithm is shown in Figure 7, and it is clear that the total operational cost was decreased compare to Case 1 in all circumstances. The BESS is set for charging between 1–5 and 23–24 h, respectively, when the market price of utility services is low. During peak hours, the battery’s stored energy is used to power the load, with the remaining energy being exported to the utility. Furthermore, it is noted that scenario 4’s higher renewable penetration (as indicated in Figure 7(SC4) in comparison to Figure 7) results in the utility receiving the most energy exports (SC4). For each of the four scenarios, the operational expenses assessed in this example are 179, 202, 315, and 419 €/kWh. Cost reduction percentages for Cases 1 and 2 are 29%, 21.5%, 3.02%, and 6.07%, respectively.
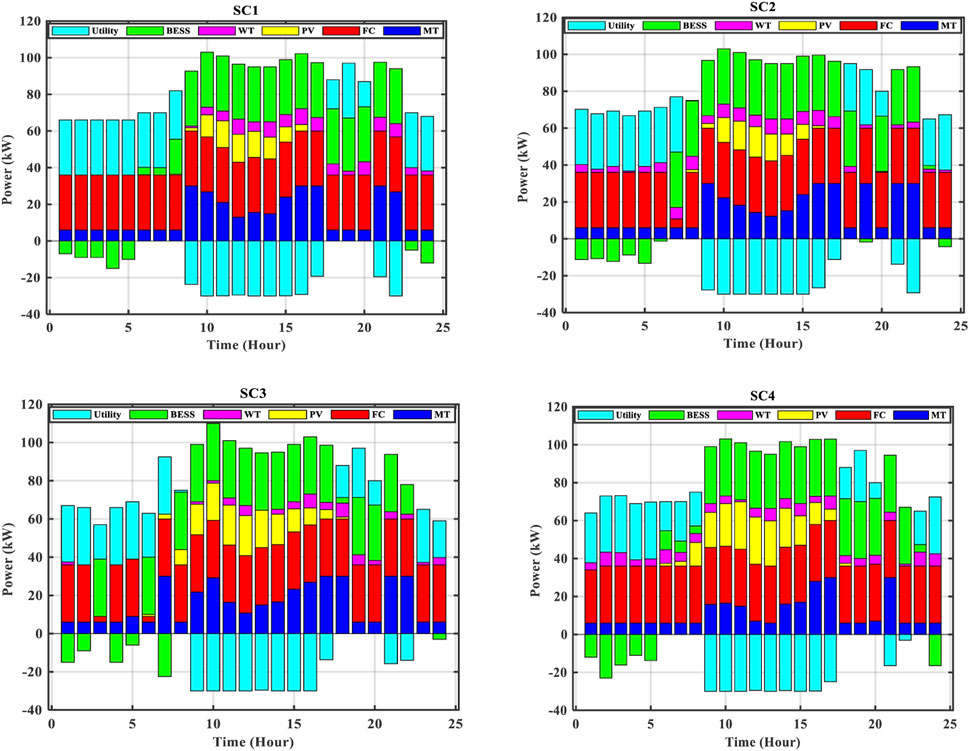
FIGURE 7. Case1 with 5% DSM, SC1, SC2, SC3, SC4.
6.3 Case 3 with 10% DSM
Figure 8 shows the stochastic energy management system integrated with a demand side management with a 10% residential load participation. Due to its the most affordable offer among other DG units, the FC is used to its full 30 kW capacity, as can be seen from the results. On the other hand, since the MT has an expansive bid than the utility market price, the use of electricity is limited to its minimal limit of 3 kW during the first 7 h, 19 h–20 h, and 23 h–24 h, respectively. Comparing Case 3 to Case 1 in hours 11 to 13, when the generation from renewable sources is greater, notably in case 4, the total use of MT is further optimised. For each scenario, the operational costs assessed in Case 3 are 163, 192, 272, and 393€/kWh, respectively. When compared to Case 1, the percentage cost reduction with the adoption of 10% DSM is 35.32%, 25.30%, 15.53%, and 11.49%.
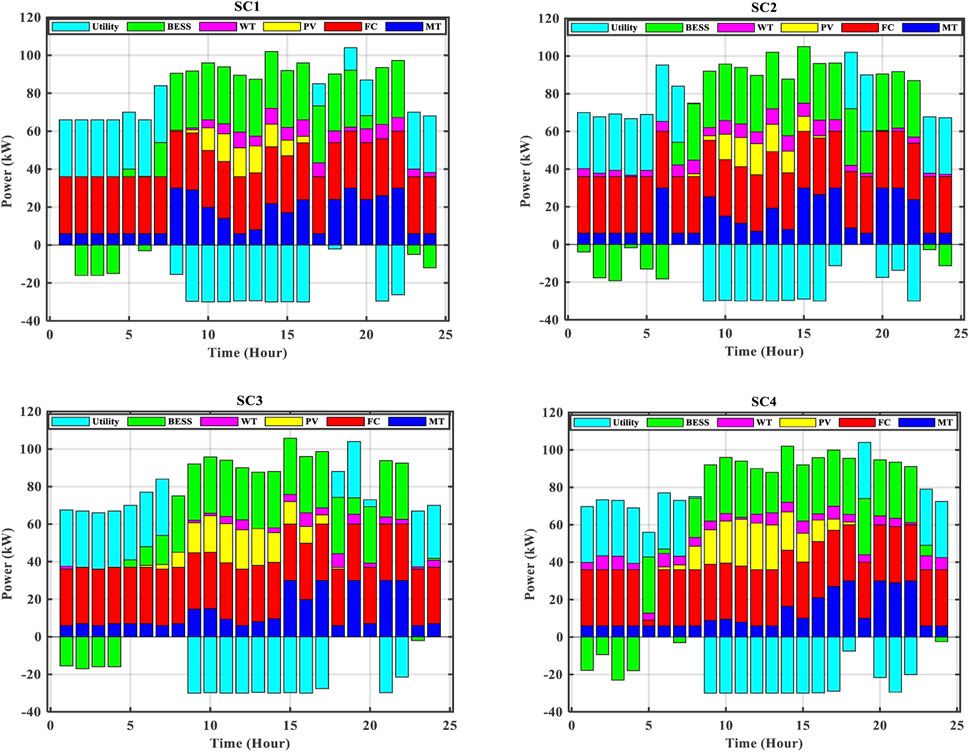
FIGURE 8. Case 3 with 10% DSM.
6.4 Case 4 with 15% DSM
Figure 9 shows the best power distribution strategy taking the 15% DSM participation level into account. The Case 4 data demonstrate that all DG units’ planned power is optimized to the point that the microgrid will import less power from the utility during times of peak demand and will boost total export energy relative to Cases 1 through 3. For each scenario, the objective function evaluation values in Case 4 are 130, 186, 257.31, and 377.14 €/kWh, respectively. In comparison to the case where DSM participation is not taken into account, the operating costs are further decreased to 49.42%, 27.76%, 20.17%, and 15.24%.
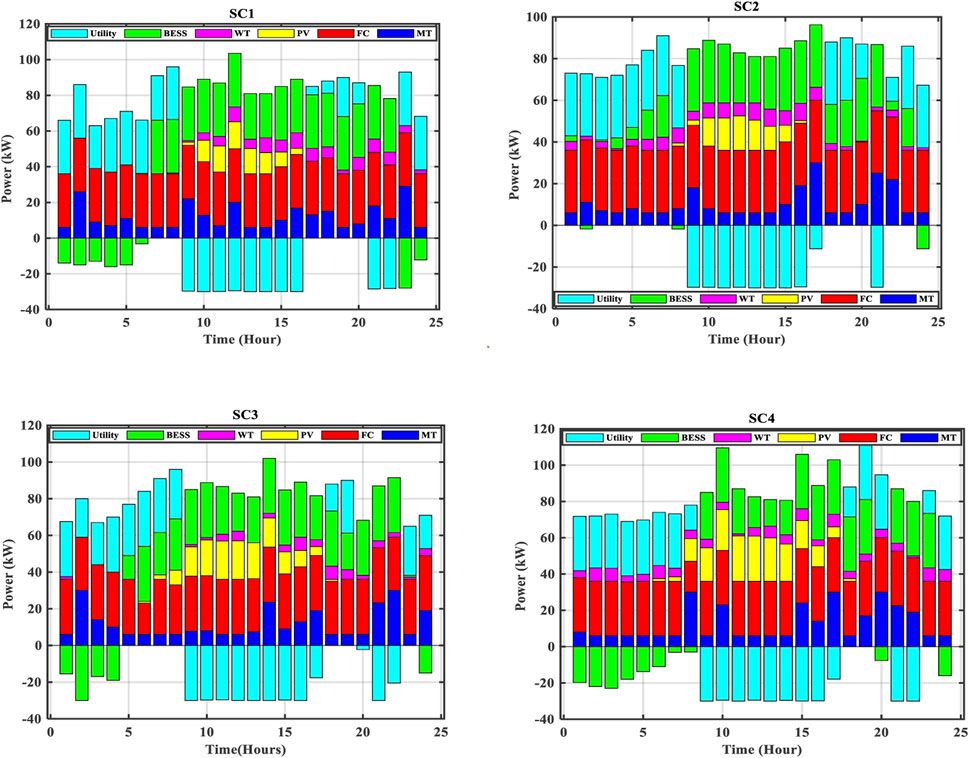
FIGURE 9. Case 4 with 15% DSM, SC1, SC2, SC3, SC4.
6.5 Case 5 with 20% DSM (best case)
When compared to all preceding examples, Case 5’s DSM involvement level of 20% results in the lowest total MG operating cost. The operational cost is yet more optimised compared to without use of DSM at greater residential load participation levels of DSM. From Figure 10, it can be shown that in Case 5 compared to all other situations, when demand is high, the microgrid operator may export more power to the grid by capturing the greatest amount of energy from renewable sources. The best outcomes in Case 5 were 96, 138, 242.31, and 345.12 €ct for each scenario, respectively. With a 20% DSM involvement, operational expenses are reduced by 62%, 46.4%, 24.83%, and 22.4%. The optimum result for scenario 1 of Case 5 is reached with minimum operational cost of 96 €ct when compared to all simulation outcomes that are analysed in this study.
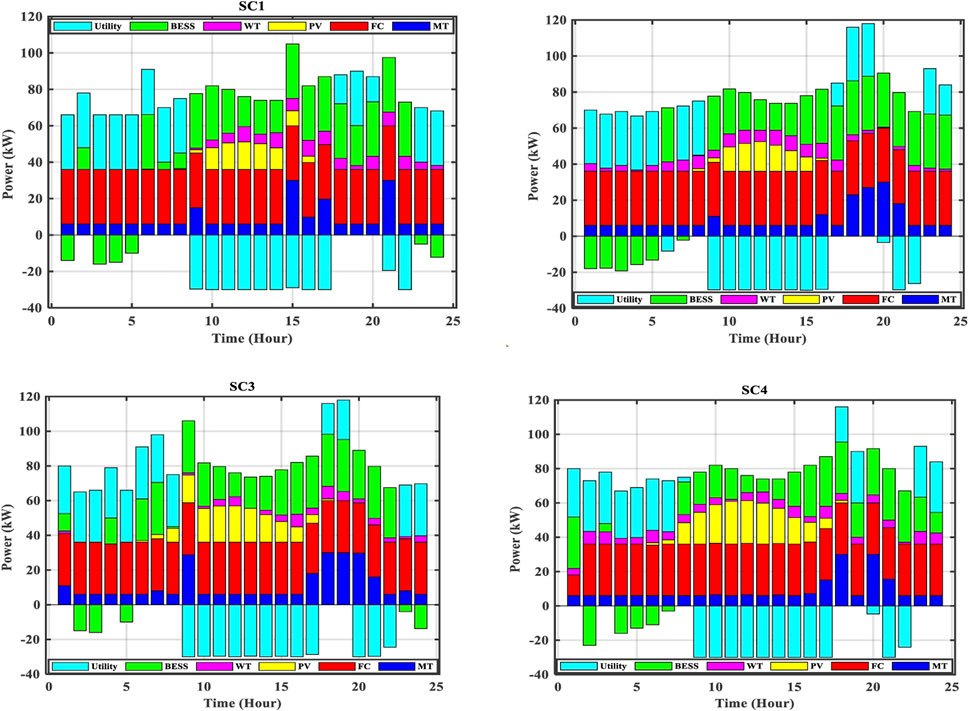
FIGURE 10. Case 20% DSM, SC1, SC2, SC3, SC4.
As the DSM involvement level rises, the performance of the ABC optimization in terms of convergence properties, results in a significant decrease in the MG operational cost. In every case, the objective function reaches the ideal value after a relatively small number of iterations. Table 1 compares the simulation outcomes with and without DSM involvement levels.
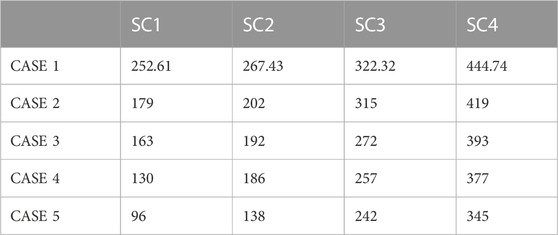
TABLE 1. Comparison of different cases in term of operating costs.
By transferring controlled loads to intervals during off-peak hours, the DSM program implementation offers a fluctuating load pattern to suit the generation profile. According to the findings, the daily cost reductions for the MG operator in the first scenario for various DSM involvement levels are 41.74, 66.61, 85.58, and 100.69 €ct, respectively. Figure 11 shows the daily cost reductions expressed as a percentage for all scenarios. In Table 2, there is a quick comparison of the hourly optimum arrangement of the MG system using and without using the DSM. We may infer from this study that the microgrid operator can lower daily operational costs and perhaps increase annual financial savings.

FIGURE11. Cost saving for different cases with different scenarios.
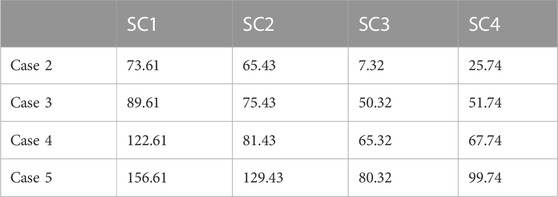
TABLE 2. Daily cost reduction for different cases from base case.
Cost comparison and daily saving is shown in Figure 11.
Figure 12 shows that in case1 the cost increases from scenario 1 to scenario 4 due to increasing penetration of PV and WT. Microgrid uses PV and WT up to maximum level. From the curves shown in Figure 12, it is clear that operational cost of microgrid reduces from case 1 to 5 due to increasing percentage of DSM. The ABC algorithm, which has been used to determine the impact of DSM on operating costs with various PV and WT scenarios, is shown in all of the aforementioned figure graphs and tables as being the most effective algorithm.
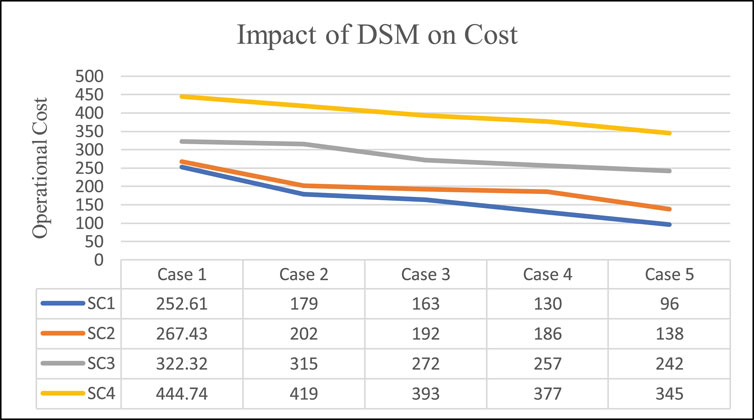
FIGURE 12. Impact of DSM and Scenarios on cost.
7 Conclusion
In this article, the operation and energy management of a new microgrid is addressed using DSM implemented by utility. The new scenario-based approach is suggested to handle the unpredictable nature associated with RES while resolving the best scheduling issue with DSM across a time duration of 24 h. We develop a four-scenario stochastic model for a microgrid linked to the grid that operates on a PV and WT power system. To evaluate the influence of DSM on the microgrid, four home load participation levels of 5%, 10%, 15%, and 20% are studied. The outcomes of the simulations performed demonstrate the effectiveness of the Artificial Bee Colony optimization strategy in producing technical and economic gains for both the utility and MG operators. The best optimization outcome among all the case studies taken into consideration in this study is attained with a greater DSM engagement level of 20%. When compared to the situation without DSM engagement, the total cost reduction is 62%, 46.4%, 24.83%, and 22.4% for each of the four scenarios, respectively. The suggested framework has three applications: Dynamic load shaping of the system’s auxiliary loads raises the load factor and makes it easier for the microgrid operator to successfully handle peak loads. As energy management involves ongoing monitoring, a significant decrease in peak demand decreases the cost of transmission and distribution networks. The effective use of such a method strengthens publicly owned utilities in emerging nations, which generates chances for real-time energy trading. Demand-side management is being used to help utility companies’ energy managers acquire and analyse load participation profiles to create new energy policies and provide the grid operational flexibility.
Data availability statement
Publicly available datasets were analyzed in this study. This data can be found here: https://www.sciencedirect.com/science/article/pii/S0306261921000040.
Author contributions
Conceptualization, KU and JQ; methodology, software and validation, KU formal analysis, investigation and resources, RK; writing—original draft preparation, KU; writing—review and editing, GG; visualization, WK; supervision, JQ. All authors have read and agreed to the published version of the manuscript.
Funding
This work was supported by the Fundamental Research Funds for the Central Universities with grand number 226-2022-00164.
Conflict of interest
The authors declare that the research was conducted in the absence of any commercial or financial relationships that could be construed as a potential conflict of interest.
Publisher’s note
All claims expressed in this article are solely those of the authors and do not necessarily represent those of their affiliated organizations, or those of the publisher, the editors and the reviewers. Any product that may be evaluated in this article, or claim that may be made by its manufacturer, is not guaranteed or endorsed by the publisher.
Abbreviations
ABC, artificial bee colony; BESS, battery energy storage system; DERs, distributed energy resources; DG, distributed generation; DR, demand response; DSM, demand side management; EMS, energy management system; ESS, energy storage system; FC, fuel cell; GT, gas turbine; LC’s, local controllers; MG, microgrid; MGCC, microgrid central controller; MT, microturbine; PV, photovoltaic; RE, renewable energy; SC, scenario; SG, smart grid; SOC, state of charge; URG’s, uncertain renewable generation; WT, wind turbine.
References
Ai, X., Liu, X., Qiu, W. J., and Wang, Y. (2010). Bid-scheduling of demand side reserve based on demand response considering carbon emission trading in smart grid. 2010 5th Int. Conf. Crit. Infrastruct. Cris 2010-Proc. 2010, 4–9. doi:10.1109/CRIS.2010.5617534
American Clean Power Association (2020). American Clean Power Association (ACP) Renewable energy and infrastructure policy scenario analysis.
Arefifar, S. A., Mohamed, Y. A. R. I., and El-Fouly, T. H. M. (2013). Optimum microgrid design for enhancing reliability and supply-security. IEEE Trans. Smart Grid 4, 1567–1575. doi:10.1109/TSG.2013.2259854
Arefifar, S. A., Ordonez, M., and Mohamed, Y. (2018). “Energy management in multi-microgrid systems — Development and assessment,” in 2017 IEEE Power & Energy Society General Meeting, Chicago, IL, USA, 16-20 July 2017 (IEEE), 910–922. doi:10.1109/pesgm.2017.8274325
Arteconi, A., Hewitt, N. J., and Polonara, F. (2012). State of the art of thermal storage for demand-side management. Appl. Energy 93, 371–389. doi:10.1016/j.apenergy.2011.12.045
Braithwait, S., Hansen, D., and O’Sheasy, M. (2007). Retail electricity pricing and rate design in evolving markets. Edison Electr. Inst., 1–57.
Brandon, N. P., Edge, J. S., Aunedi, M., Bruce, P. G., Chakrabarti, B. K., Esterle, T., et al. (2016). UK research needs in grid scale energy storage technologies.
Che, L., Khodayar, M., and Shahidehpour, M. (2014). Only connect: Microgrids for distribution system restoration. IEEE Power Energy Mag. 12, 70–81. doi:10.1109/MPE.2013.2286317
Che, L., and Shahidehpour, M. (2014). DC microgrids: Economic operation and enhancement of resilience by hierarchical control. IEEE Trans. Smart Grid 5, 2517–2526. doi:10.1109/TSG.2014.2344024
Che, L., Shahidehpour, M., Alabdulwahab, A., and Al-Turki, Y. (2015). Hierarchical coordination of a community microgrid with AC and DC microgrids. IEEE Trans. Smart Grid 6, 3042–3051. doi:10.1109/TSG.2015.2398853
Che, L., Zhang, X., Shahidehpour, M., Alabdulwahab, A., and Abusorrah, A. (2017). Optimal interconnection planning of community microgrids with renewable energy sources. IEEE Trans. Smart Grid 8, 1054–1063. doi:10.1109/TSG.2015.2456834
Dang, S., Odonde, A., Mirza, T., Dissanayake, C., and Burns, R. (2014). “Sustainable energy management: An analysis report of the impacts of Electric Vehicles,” in 2014 14th International Conference on Environment and Electrical Engineering, Krakow, Poland, 10-12 May 2014 (IEEE), 318–322. doi:10.1109/EEEIC.2014.6835886
De Vizia, C., Patti, E., Macii, E., and Bottaccioli, L. (2022). A user-centric view of a demand side management program: From surveys to simulation and analysis. IEEE Syst. J. 16, 1885–1896. doi:10.1109/JSYST.2021.3135236
Engler, A. (2000). Control of parallel operating battery inverters In Photovoltaic Hybrid Power Systems Conference, 1–4.
Gelazanskas, L., and Gamage, K. A. A. (2014). Demand side management in smart grid: A review and proposals for future direction. Sustain. Cities Soc. 11, 22–30. doi:10.1016/j.scs.2013.11.001
Gellings, C. W. (1985). The concept of demand-side management for electric utilities. Proc. IEEE 1985 73, 1468–1470. doi:10.1109/PROC.1985.13318
Hongming, Y., Yeping, Z., and Xiaojiao, L. (2006). “System dynamics model for demand side management,” in 2006 3rd Int. Conf. Electr. Electron. Eng., Veracruz, Mexico, 06-08 September 2006, 6–9. doi:10.1109/ICEEE.2006.251854
Hosseini Imani, M., Niknejad, P., and Barzegaran, M. R. (2018). The impact of customers’ participation level and various incentive values on implementing emergency demand response program in microgrid operation. Int. J. Electr. Power Energy Syst. 96, 114–125. doi:10.1016/j.ijepes.2017.09.038
Kalair, A. R., Abas, N., Hasan, Q. U., Seyedmahmoudian, M., and Khan, N. (2020). Demand side management in hybrid rooftop photovoltaic integrated smart nano grid. J. Clean. Prod. 258, 120747. doi:10.1016/j.jclepro.2020.120747
Khan, A. A., Naeem, M., Iqbal, M., Qaisar, S., and Anpalagan, A. (2016). A compendium of optimization objectives, constraints, tools and algorithms for energy management in microgrids. Renew. Sustain. Energy Rev. 58, 1664–1683. doi:10.1016/j.rser.2015.12.259
Kinhekar, N., Padhy, N. P., and Gupta, H. O. (2014). Multiobjective demand side management solutions for utilities with peak demand deficit. Int. J. Electr. Power Energy Syst. 55, 612–619. doi:10.1016/j.ijepes.2013.10.011
Kolokotsa, D. (2016). The role of smart grids in the building sector. Energy Build. 116, 703–708. doi:10.1016/j.enbuild.2015.12.033
Kumar, S. R., Phani Raghav, L., Koteswara Raju, D., and Singh, A. R. (2021). Impact of multiple demand side management programs on the optimal operation of grid-connected microgrids. Appl. Energy 301, 117466. doi:10.1016/j.apenergy.2021.117466
Li, D., Sun, H., and Chiu, W. Y. (2017). “Achieving low carbon emission using smart grid technologies,” in 2017 IEEE 85th Vehicular Technology Conference (VTC Spring), 4–8. doi:10.1109/VTCSpring.2017.8108624
Locatelli, G., Palerma, E., and Mancini, M. (2015). Assessing the economics of large Energy Storage Plants with an optimisation methodology. Energy 83, 15–28. doi:10.1016/j.energy.2015.01.050
Logenthiran, T., Srinivasan, D., and Shun, T. Z. (2012). Demand side management in smart grid using heuristic optimization. IEEE Trans. Smart Grid 3, 1244–1252. doi:10.1109/TSG.2012.2195686
Loh, P. C., Li, D., Chai, Y. K., and Blaabjerg, F. (2013). Autonomous operation of hybrid microgrid with ac and dc subgrids. IEEE Trans. Power Electron. 28, 2214–2223. doi:10.1109/TPEL.2012.2214792
Lokeshgupta, B., and Sivasubramani, S. (2018). Multi-objective dynamic economic and emission dispatch with demand side management. Int. J. Electr. Power Energy Syst. 97, 334–343. doi:10.1016/j.ijepes.2017.11.020
Macedo, M., Galo, J., Almeida, L., and Lima, A. (2013). “Opportunities and challenges of DSM in smart grid environment,” in ENERGY 2013 : The Third International Conference on Smart Grids, Green Communications and IT Energy-aware Technologies, 156–160.
Manandhar, U., Ukil, A., Gooi, H. B., Tummuru, N. R., Kollimalla, S. K., Wang, B., et al. (2019). Energy management and control for grid connected hybrid energy storage system under different operating modes. IEEE Trans. Smart Grid 10, 1626–1636. doi:10.1109/TSG.2017.2773643
Moghaddam, A. A., Seifi, A., Niknam, T., and Alizadeh Pahlavani, M. R. (2011). Multi-objective operation management of a renewable MG (micro-grid) with back-up micro-turbine/fuel cell/battery hybrid power source. Energy 36, 6490–6507. doi:10.1016/j.energy.2011.09.017
Nguyen, H. K., Song, J., and Bin; Han, Z. (2012). “Demand side management to reduce Peak-to-Average Ratio using game theory in smart grid,” in 2012 Proceedings IEEE INFOCOM Workshops, Orlando, FL, USA, 25-30 March 2012 (IEEE), 91–96. doi:10.1109/INFCOMW.2012.6193526
Philipo, G. H., Kakande, J. N., and Krauter, S. (2022). Neural Network-Based Demand-Side Management in a Stand-Alone Solar PV-Battery Microgrid Using Load-Shifting and Peak-Clipping. Energies, 15 (14), 5215.
Radosavljević, J., Jevtić, M., and Klimenta, D. (2016). Energy and operation management of a microgrid using particle swarm optimization. Eng. Optim. 48, 811–830. doi:10.1080/0305215X.2015.1057135
Ralon, P., Taylor, M., Ilas, A., Diaz-Bone, H., and Kairies, K. (2017). Electricity storage and renewables: Costs and markets to 2030. Abu Dhabi, United Arab Emirates: International Renewable Energy Agency 164.
Rangu, S. K., Lolla, P. R., Dhenuvakonda, K. R., and Singh, A. R. (2020). Recent trends in power management strategies for optimal operation of distributed energy resources in microgrids: A comprehensive review. Int. J. Energy Res. 44, 9889–9911. doi:10.1002/er.5649
Sinha, A., and De, M. (2016). “Load shifting technique for reduction of peak generation capacity requirement in smart grid,” in In Proceedings of the 1st IEEE International Conference on Power Electronics, Intelligent Control and Energy Systems, ICPEICES, Delhi, India, 04-06 July 2016. doi:10.1109/ICPEICES.2016.7853528
Strbac, G. (2008). Demand side management: Benefits and challenges. Energy Policy 36, 4419–4426. doi:10.1016/j.enpol.2008.09.030
Table of Contents (2018). Nippon ronen igakkai zasshi. Japanese J. Geriatr.55, Contents1–Contents1, doi:10.3143/geriatrics.55.contents1
Ullah, K., Jiang, Q., Geng, G., Rahim, S., and Khan, R. A. (2022). Optimal power sharing in microgrids using the artificial bee colony algorithm. Energies 15 (3), 1067. doi:10.3390/en15031067
Ullah, K., Quanyuan, J., Geng, G., Khan, R. A., Aslam, S., and Khan, W. (2022). Optimization of demand response and power-sharing in microgrids for cost and power losses. Energies 15, 3274. doi:10.3390/en15093274
Wu, L., Shahidehpour, M., and Li, T. (2007). Stochastic security-constrained unit commitment. IEEE Trans. Power Syst. 22, 800–811. doi:10.1109/TPWRS.2007.894843
Yang, F., and Xia, X. (2017). Techno-economic and environmental optimization of a household photovoltaic-battery hybrid power system within demand side management. Renew. Energy 108, 132–143. doi:10.1016/j.renene.2017.02.054
Yi, Y., and He, R. (2014). “A novel artificial bee colony algorithm,” in Proc. - 2014 6th Int. Conf. Intell. Human-Machine Syst. Cybern. IHMSC 2014, Hangzhou, 26-27 August 2014 (IEEE), 271–274. doi:10.1109/IHMSC.1.73
Zhang, N., Hu, Z., Dai, D., Dang, S., Yao, M., and Zhou, Y. (2016). Unit commitment model in smart grid environment considering carbon emissions trading. IEEE Trans. Smart Grid 7, 420–427. doi:10.1109/TSG.2015.2401337
Zhang, Z., and Xia, Q. (2009). Architecture and key technologies for generation scheduling of smart grid. Power Syst. Technol. 33, 1–8.
Keywords: demand side management, microgrids, smart grids, optimization, abc
Citation: Ullah K, Quanyuan J, Geng G, Khan RA and Khan W (2023) Impact of demand side management on the operational cost of microgrids using ABC algorithm. Front. Energy Res. 10:1016109. doi: 10.3389/fenrg.2022.1016109
Received: 10 August 2022; Accepted: 21 December 2022;
Published: 09 January 2023.
Edited by:
Amin Mohammadpour Shotorbani, University of British Columbia, CanadaReviewed by:
Fazal Muhammad, University of Engineering and Technology, Mardan, PakistanMuhammad Irfan, Najran University, Saudi Arabia
Copyright © 2023 Ullah, Quanyuan, Geng, Khan and Khan. This is an open-access article distributed under the terms of the Creative Commons Attribution License (CC BY). The use, distribution or reproduction in other forums is permitted, provided the original author(s) and the copyright owner(s) are credited and that the original publication in this journal is cited, in accordance with accepted academic practice. No use, distribution or reproduction is permitted which does not comply with these terms.
*Correspondence: Jiang Quanyuan, anF5QHpqdS5lZHUuY24=