 Yuantian Xue1
 Fan Jiang
- 1State Grid Gansu Electric Power Company, Wuwei Power Supply Company, Wuwei, China
- 2College of Information Engineering, Zhejiang University of Technology, Hangzhou, China
With the reduction of fossil energy and the increase of energy consumption, the development and utilization of new energy is an inevitable trend. Renewable energy has attracted attention because of its cleanness and abundance. However, affected by the randomness and intermittence of renewable energy, it is difficult for the traditional power system to meet the needs of users after renewable energy is connected, and it is difficult to solve the consumption problem of renewable energy by relying on the traditional power system alone. To address this problem, an integrated energy system (IES) is constructed using a two-layer optimization method for the operation strategy and capacity allocation of the integrated energy system, and a particle swarm optimization algorithm is used to solve the multi-objective problem, taking renewable energy consumption, operation cost, and investment cost as the optimization indexes, and considering the equipment operation characteristics, uncertainty of renewable energy and the model constraints. The optimization results obtained from the solution are compared with the traditional energy supply system, and it is verified that the proposed method can achieve the lowest cost investment in the system while satisfying the reliability and safety constraints.
1 Introduction
Renewable energy with low carbon and environmental friendly properties has received attention due to the increasing tension in the supply of traditional primary energy and its environmental pollution (Xiao et al., 2021). Due to the interdependence of energy systems, energy sources are inflexible and inefficiently utilized. In addition, the uncertainty, fluctuation and intermittency of renewable energy output make the stable operation of the power system challenging after grid connection (Wang et al., 2021a; Wei et al., 2022a). In response to the above problems, integrated energy system (IES) is proposed as a new type of energy network (Huang et al., 2018), and its unified dispatch and planning of electricity, heat and gas realize the integrated utilization of energy. A reasonable capacity allocation can minimize the cost input while satisfying the reliability of the IES. Therefore, it is important to make reasonable planning for the capacity of each device in the IES considering the uncertainty of wind power and PV.
In current research process, the planning of IES is often reflected in two aspects: 1) the selection of system facility types and the configuration of the system capacity size; 2) the data optimization on typical daily or annual load-side demand. A reasonable allocation of generation and storage capacity can be economically efficient (Kalkhambkar et al., 2016). In (Wang et al., 2015)- (Carpaneto et al., 2015), new optimization methods were developed for planning and scheduling CHP systems to minimize costs. A cooperative operating model of an IES with transmission losses can also minimize the operating costs (Liu et al., 2020). Reference (Kefayat et al., 2015; Wang et al., 2021b; Zou et al., 2021) all proposed an improved algorithm for the optimal localization and quantification of device capacity to solve the planning problem of the system. Reference (Guo et al., 2013; Zhang et al., 2019; Xu et al., 2020) applied a multi-objective genetic algorithm based on the non-dominated ranking genetic algorithm-II (NSGA-II) to solve the problem of optimal design of device type and capacity optimization. In (Phillip and Matteo, 2012), for residential microgrids, a generalized mixed integer linear programming model was proposed to minimize the operating cost.
The uncertainty of wind and PV is an urgent problem in IESs. Three main approaches exist in the optimal scheduling process: fuzzy optimization, scenario optimization, and robust optimization. In (Cobos et al., 2018; van Ackooij et al., 2018; Wei et al., 2022b), the uncertainty of wind output is taken as the study object and different research methods were proposed to deal with this uncertainty for better scheduling of the system. The aggregator-mediated demand response can deal with the uncertainty of PV to some extent (Okur et al., 2019) and it can also be handled by generating acceptable scenarios through Latin hypercube sampling and K-means algorithms (Valencia et al., 2016; Zhai et al., 2020; Guo et al., 2021). Reference (Li et al., 2016) used the temperature dynamics of a district heating network (DHN) with energy storage to manage the change in wind energy and proposed a method to coordinate the operation of the power system and the DHN with cogeneration scheduling. Considering that the impact of renewable energy uncertainty on the power system is unknown, reference (Fan et al., 2021) proposed a new uncertainty assessment algorithm to evaluate the impact of renewable energy uncertainty on the dynamic performance of the power system. A new optimization framework based on Stackelberg’s game was proposed for the problem of optimal scheduling of IESs with uncertain renewable energy generation in (Li et al., 2021).
The research on the IES mainly focuses on uncertainty analysis and demand side response, and lacks the research on the operation characteristics of specific equipment. In the analysis of various types of energy flows, the traditional economic analysis method is not fully applicable to the IES.
This paper focuses on the optimal configuration of the capacity specifications and operation strategies of different devices in the IES considering the uncertainty of renewable energy. The mathematical model and constraints of the energy equipment in the IES are firstly constructed; then the optimization method of the IES is highlighted and the algorithm for solving the objective is introduced; finally the two-layer model is solved to obtain the optimized design scheme and operation results. At the same time, the traditional energy system is compared with the IES to verify that the proposed method can achieve the lowest cost investment while meeting the reliability and safety constraints, thus illustrating the feasibility and superiority of the IES in the future energy development process. The contribution of this paper includes:
1) A specific model for the equipment in the IES is established and its characteristics are studied.
2) When analyzing the economy of the IES, the double-layer optimization method is used, and the equipment operation characteristics, renewable energy uncertainty and model constraints are considered.
2 Architecture design of the integrated energy system
Through the energy Internet, the IES can achieve low-carbon, clean, environmental protection and high efficiency in aspects of energy production, transmission, utilization and storage as much as possible on the premise of meeting the system’s internal demand for various energy types. Unlike traditional combined cooling, heating and power systems, IESs have greater advantages in dealing with energy volatility and operational control, which provides greater possibilities for adding new energy equipment, energy recovery and energy storage equipment to the system. At the same time, with the support of advanced forecasting, communication and control technologies, the IES can regulate various types of energy demand more accurately and smoothly, improve the utilization rate of traditional fossil energy, increase the proportion of renewable energy consumption, and help achieve the goal of “dual carbon” policy.
This section will introduce the modeling of energy hubs, the configuration of IESs, and the operating characteristics of the devices involved, on the basis of which the model of IESs considering new energy consumption and its uncertainty will be constructed.
2.1 Mathematical model of energy hubs
Figure 1 shows the basic architecture of an energy hub, which consists of input and output ports composed of multiple forms of energy, as well as complex energy coupling units connecting these ports. The input ports are typically connected directly to the energy distribution network for renewable energy, electrical energy, natural gas, etc. The output ports are connected to the customer’s cooling, heating and electrical load side to meet real-time load demand at the customer’s end. Inside the energy hub, multiple energy flows can be coupled, converted, and stored in a variety of ways depending on the user’s needs.
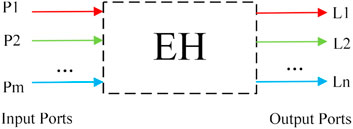
FIGURE 1. Basic structure of energy hubs.
In summary, it is possible to relate the transfer of multiple energy flows between the input and output ports of the energy hub using the energy conversion relationship matrix:
where L and P denote the m-dimensional output vector and n-dimensional input vector of the corresponding energy hub, respectively; C (m × n) denotes the coupling matrix used to describe the coupling and conversion relationship of multiple energy flows within the energy hub. Usually P is the primary energy access such as electric power resources, fossil resources, and renewable resources; L is the secondary energy output such as electric energy, cold/heat energy, and chemical energy; C is set according to different equipment types, different capacities, and different efficiencies.
Most of the equipment inside the traditional IES can be divided into energy conversion equipment, energy transmission equipment and energy storage equipment, and the energy flow between them has a complex and diverse coupling relationship, so Eq. 1 can be expressed in a clearer matrix form when considering the energy conversion efficiency and transmission efficiency of each equipment.
where
2.2 Energy supply framework
2.2.1 Traditional energy supply framework
In the northern region of China, for example, the electricity required for industry and living is uniformly transmitted and distributed through the power grid, while indoor heat demand is met through central heating or small gas furnaces for households, and cooling demand is met through small electric compressor chillers and air-cooled chillers. Thus, it can be seen that the coupling relationship between the devices in the traditional energy supply structure is simple, the energy utilization efficiency is low, and there is a single means to regulate different energy demands. Therefore, this paper compares the traditional energy system with the IES to verify the feasibility and superiority of the IES in the future energy development process.
2.2.2 Integrated energy system based on combined cooling, heating and power supply
The equipment of the IES mainly includes gas turbines, gas boilers, electric heat boilers, electric compression refrigeration units, energy storage (electric/heat/cooling) devices, wind power generation systems, PV power generation systems, and various types of energy flow transmission systems. The structure of the IES is shown in Figure 2.

FIGURE 2. Structure of the integrated energy system.
The principle of the IES is described below from the perspective of different energy supply types.
2.2.3 Electric energy system
The system is composed of gas turbine, PV power generation system, wind power generation system and electric energy transmission line. Different from the traditional energy system, the system fully considers the access of renewable energy in the modeling process to achieve the purpose of reducing carbon emissions. While meeting the demand for electric energy on the demand side, the electric energy system can also transmit the electric energy to the electric boiler for auxiliary heating or to the electric compressor refrigeration unit for auxiliary cooling according to the operation strategy, and store the excess electric energy to the energy storage device to buffer the possible fluctuations of the system. Because the system model built in this paper is connected with the large power grid, it is set that when the power generated is not enough to meet the demand on the demand side, power can be purchased from the power grid according to the time of use price.
2.2.4 Thermal system
The system is composed of gas boiler, electric boiler and thermal energy storage device. The electric boiler can be used for auxiliary heating according to the system operation strategy to achieve more efficient energy conversion. At the same time, the excess heat energy can be introduced into the heat energy storage device to relieve the heating pressure of the system during the peak period of heat load.
2.2.5 Refrigeration system
The system is composed of absorption refrigeration unit, electric compressor refrigeration unit and cold storage device. The absorption refrigeration unit drives the device for refrigeration cycle through the waste heat steam generated by the gas boiler. In addition, the electric compressor refrigeration unit can be used for auxiliary refrigeration according to the system operation strategy. At the same time, the excess heat energy or electric energy can also be converted into refrigeration resources and introduced into the cold storage device for secondary utilization.
2.3 Operational characteristics of integrated energy systems
2.3.1 PV power generation systems
Usually PV power generation units are deployed in areas with sufficient light resources, and their energy output is characterized by uncertainty and volatility due to the influence of natural factors such as weather.
In the actual calculation process, the main considerations are direct radiation, scattered radiation and reflected radiation.
where
where
The output power of PV power generation can be derived using Eq. 7.
where
2.3.2 Wind power systems
Wind power generation converts the kinetic energy of wind into electrical energy. The output power of a wind turbine is expressed by the following equation.
where
For the problem of uncertainty in PV and wind power output, this paper uses box robust optimization to solve it. The advantage of robust optimization is that it is not necessary to give the random distribution function of uncertain variables, but only the set of uncertain values and the specific form of the model is constructed under the set constraint for solving.
General robust optimization model is:
2.4 Define the linear programming as
Let
For the robust optimization problem, the selection of a suitable uncertainty set U and the simplification of the model are the key. Considering the practical workability in the calculation, a box uncertainty set is used, which can be expressed as
where
It can be seen that there are various energy devices and complex energy types in the IES, and the energy systems are highly coupled with each other, which makes the capacity combination and allocation scheme at the early stage of design complicated and cannot be simply estimated. If the core equipment is simply estimated based on the maximum annual daily load, it will not only cause energy wastage but also depreciate the life of the unit. Therefore, in order to ensure the reliability, economy and scalability of the energy system, it is necessary to use the multi-energy synergy optimization to determine the capacity according to demand.
3 Capacity optimization allocation model of the integrated energy system
3.1 Objective function of capacity allocation optimization
In this paper, we set the objective function for the system under the idea of two-layer optimization, whose ultimate goal is to improve the consumption of renewable energy and reduce the total system cost and energy purchase cost. Therefore, the capacity allocation scheme should focus on the cost per unit capacity of equipment, operating characteristics, and the consumption of renewable energy.
The objective function of capacity allocation optimization is mainly represented by the total cost value of the IES during the rated year. It mainly includes the acquisition cost of different equipment, the cost of various types of energy consumption in that time period, and the cost of penalties made for renewable energy consumption. As shown in the following formula:
where
Since the purchase cost per unit capacity and the service life of various devices are different, it needs to be converted to an annual net present value.
where
where
where
3.2 Optimization objective function of operation strategy
Load demand, electricity/gas purchase price, and renewable energy output should be considered in the operation strategy scheme. Its optimization objective function is mainly reflected by the single-day operation cost, including the single-day electricity, gas purchase cost and the penalty cost of wind and PV abandonment.
where
3.3 System constraints
In the process of IES modelling, there are three main types of constraints: equipment capacity constraints, equipment operating characteristics constraints and energy flow balance constraints.
Equipment capacity constraint: since the particle swarm optimization algorithm will be used to optimize the model in this paper, choosing a suitable capacity configuration range can reduce the iteration time of the algorithm to a certain extent.
Equipment operating characteristics constraints: During the operation of various types of equipment, the upper and lower limits of its active power output and the speed of climbing rate need to fluctuate within the allowed safety range.
The active power output of a gas turbine is expressed in the following form.
However, for gas boilers, absorption refrigeration units, electric boilers and electric compression refrigeration units, the operating characteristics are relatively smooth and the output range is more generous, and their active power output can be expressed in the following forms.
Considering that the energy storage device can both output and input power, its operating characteristics are different from other equipment. The operating characteristics of the energy storage device can be expressed as
For its delayed nature, constraints on continuous variables need to be considered.
where
Due to the uncertainty of renewable energy, there are also constraints for the consumption of PV and wind power output, which can be expressed as follows.
Energy flow balance constraint: according to the law of energy conservation, each energy flow should meet the balance of input and output without considering the loss in the process of system energy transmission. Therefore, for the transmission and conversion of electric/heat/cold energy in the system, it is necessary to construct corresponding constraints.
Thermal balance:
where
Cold balance:
where
Electrical balance:
where
4 Optimization methods
4.1 Two-layer optimization model design
The idea of two-layer optimization fits well with the capacity allocation problem of the IES analyzed in this paper. The block diagram of the two-layer optimization structure designed is shown in Figure 3.
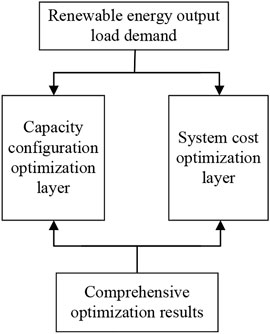
FIGURE 3. Block diagram of double-layer optimized structure.
The upper model is the system capacity configuration layer with the initial parameters of acquisition cost per unit capacity, service life, environmental impact factor and investment factor for each type of equipment, and the unit capacity of each type of equipment is passed from the starting point of iteration to the optimization model of the lower-layer operation strategy. The lower layer calculates the daily operating cost, resource consumption cost and wind and PV abandonment cost by using the preset parameters such as typical daily load, gas/power purchase and sale price, gas heating value and variable operating characteristics of each equipment, and feeds them back to the upper layer model to filter and obtain the optimal solution of capacity allocation after several iterations.
Most of the traditional algorithms have disadvantages such as poor convergence and slow computation speed. Therefore, this paper uses the particle swarm optimization algorithm to solve the designed upper-level optimization objective function. The particle swarm optimization algorithm has efficient search capability, which is beneficial to obtain the optimal solution of the multi-objective function.
where
where
where
where
where
The particle swarm optimization algorithm first assigns an initial random position and an initial random velocity to all particles in the space. Each particle is then advanced in turn based on its velocity, the known optimal global position in the problem space, and the known optimal position of the particle, as shown in Figure 4. As the computation progresses, the particles eventually cluster around one or more optimal points by exploring and exploiting the known favourable positions in the search space.
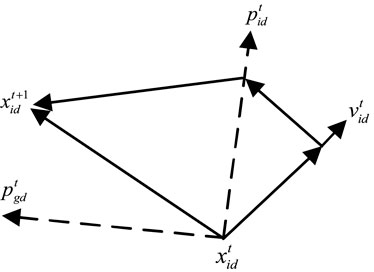
FIGURE 4. The way the particle positions are updated for each generation.
The constraints described above and the real-time unit price of resources need to be considered when selecting the lower layer optimization objective function. However, since the particle swarm optimization algorithm has been chosen for the upper model, if a similar algorithm is still chosen for the lower layer, it will lead to long solving time for the whole model or local optimal solutions. Therefore, a combination of CPLEX solver and YALMIP toolbox is used to solve the lower layer model. Figure 5 illustrates the workflow of the two-layer optimization algorithm.
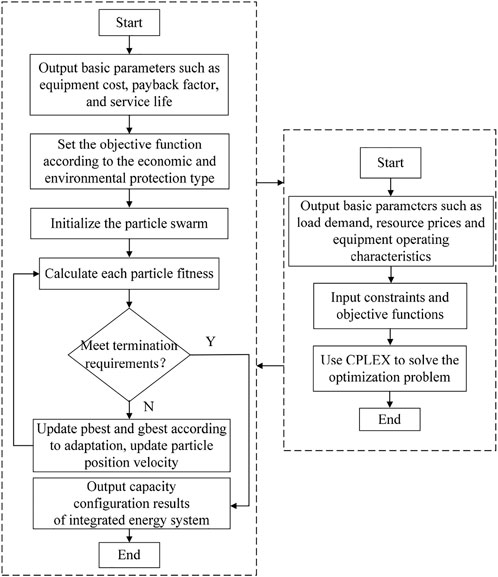
FIGURE 5. Workflow of the two-layer optimization algorithm.B Algorithm parameter setting.
Table 1 shows the performance of the devices and Table 2 shows the initial conditions of the particle swarm optimization algorithm.
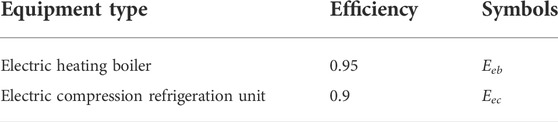
TABLE 1. Equipment performance.
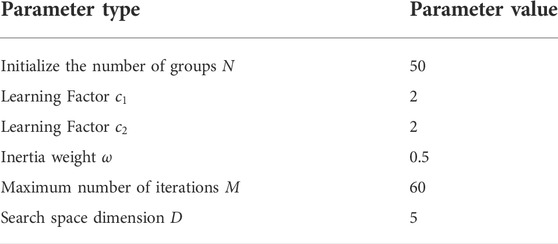
TABLE 2. Initial conditions of particle swarm optimization algorithm.
5 Simulation results
A simple IES shown in Figure 2 is used for the simulation study. In order to verify the correctness and effectiveness of the model and algorithm proposed in this paper, the double-layer optimization is implemented by MATLAB to solve the model. The upper layer uses particle swarm optimization algorithm, and the lower layer calls CPLEX for solution. The computing environment is Win10 PC with a 1.0 GHz CPU and 8.0 GB memory.
5.1 Renewable energy output and load demand
Figure 6 shows the output of wind power and PV in the IES. It can be seen that it has obvious fluctuation and seasonality, which will make the scheduling of other equipment more difficult.
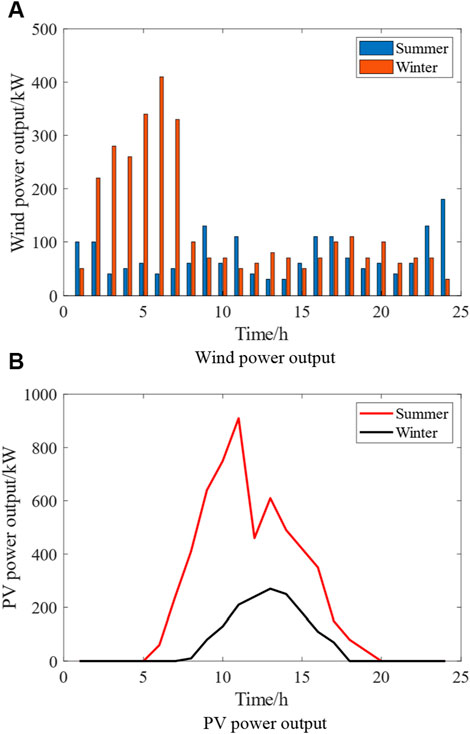
FIGURE 6. Wind power and PV output: (A) wind power output; (B) PV power output.
The output side of the energy hub has multiple types of load requirements. The system constructed in this paper is a combined cooling, heating and power system, and Figure 7 shows the cooling/heating/power load.
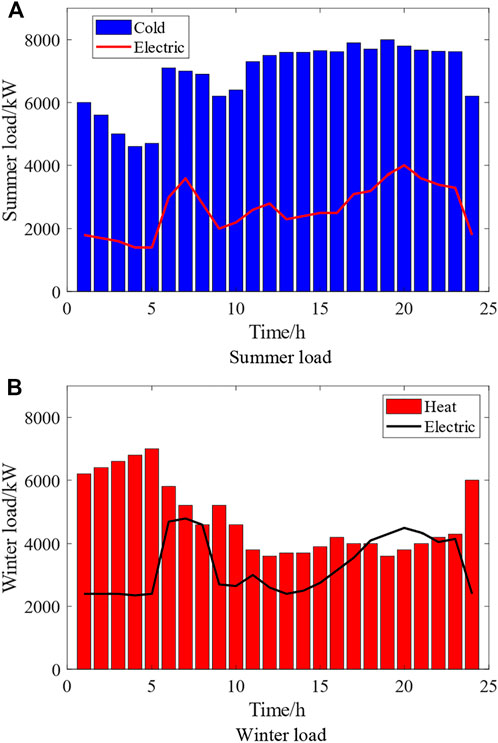
FIGURE 7. Typical daily load demand: (A) summer load; (B) winter load.
The IES constructed in this paper can supply electricity through renewable energy sources, but also purchase electricity from the external grid according to the load demand and operation strategy. The purchase price of electricity is the same as the time-sharing tariff, which helps the grid to regulate peaks through the form of peak and valley tariffs, and the real-time electricity price is shown in Figure 8. At the same time, gas turbines, gas boilers and other natural gas-fueled equipment also need to purchase gas from outside to ensure the operation of the equipment, but the price of natural gas generally does not fluctuate significantly, and its purchase price is kept at 2.63 ¥
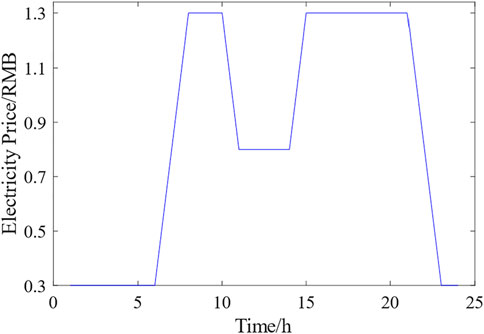
FIGURE 8. Power purchase price by hour.
5.2 Analysis of the results of optimal capacity allocation
In order to reflect the feasibility and superiority of the IES in the process of future energy development, the traditional energy system and IES are compared and analyzed in terms of total annual cost, cost of purchased electricity, cost of purchased gas and renewable energy consumption.
As seen in Table 3 and Table 4, the IES is significantly lower in cost compared to the traditional energy system. The total annual cost decreases by 17.96%. On the one hand, the access to renewable energy sources such as PV and wind power directly meets part of the electrical load, greatly reducing the total amount of purchased electricity, therefore, the cost of electricity purchase decreases by 39.17%; on the other hand, the capacity optimization of the core equipment of the system results in a significant reduction in the overall investment cost. In addition, compared to the traditional energy system, the IES incorporates supplementary combustion and cooling equipment such as electric heating boilers and electric compressor refrigeration units in its structural composition, which makes its purchase demand for natural gas also decrease, so the cost of gas is also reduced by 27.68%.
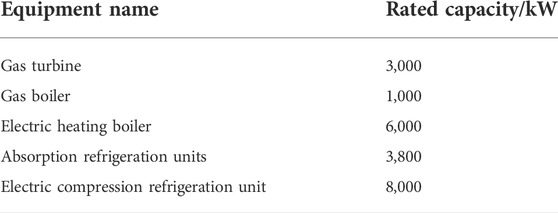
TABLE 3. Capacity configuration of the IES.
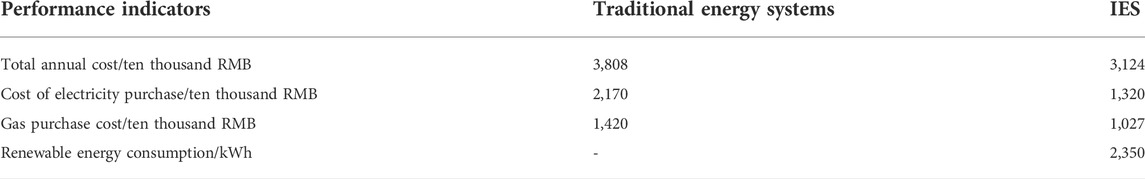
TABLE 4. Comparison of the system performance.
Moreover, the IES has better renewable energy consumption capacity, it brought about an annual consumption of 2350 MWh, which not only reduces the pollution emissions generated by fossil energy generation, but also helps to promote the stable operation of the power system.
5.3 Analysis of operation strategy optimization
The operation strategy optimization mainly analyzes the operation of the IES in detail, and calculates the daily operation cost in terms of equipment output, real-time electricity price, and renewable energy consumption, in order to consider the economy and reasonableness of the operation strategy. Figure 9 to Figure 11 show the operation of each equipment during the cooling/heating/electricity load supply.
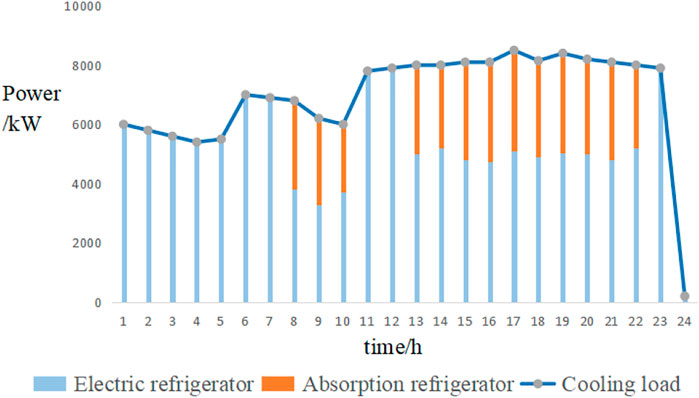
FIGURE 9. Cold load energy supply.
As can be seen from Figure 9 and Figure 10, during this time period, the waste heat generated from the operation of the gas turbine is used to drive the waste heat boiler and absorption refrigeration unit for auxiliary heating and cooling, which greatly reduces the cost of using supplementary combustion and cooling equipment through comprehensive energy utilization. At other times, the system tends to purchase electricity from the grid to drive the electric heat boiler and electric compressor chiller for heating and cooling as the electricity price shifts to low valley price.
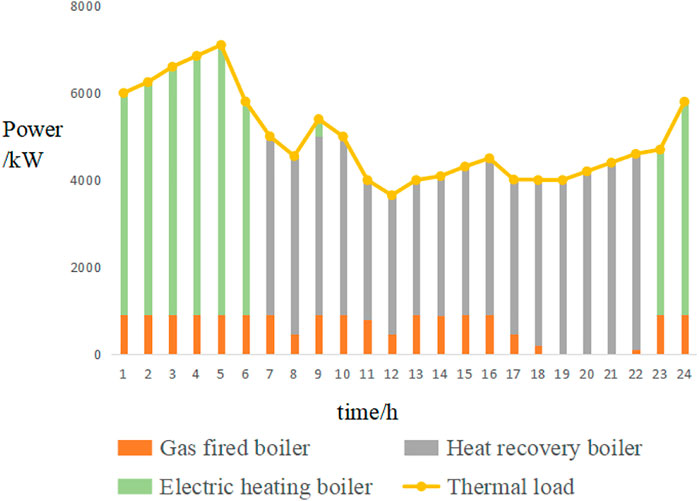
FIGURE 10. Heat load energy supply.
At the same time, the higher output of PV system during the daytime and the uncertainty of wind power generation make the IES operation strategy time-sensitive and lead to the lower output of other power supply equipment during the daytime.
As can be seen from Figure 11, under the dual effect of renewable energy output and real-time tariff, it can be noted that the gas turbine is used as the main power supply measure during the hours of 8:00–10:00 and 15:00–20:00, which makes the gas turbine always keep working for more than 10 h, fully utilizes the capacity of the gas turbine, improves the operating economy of the system. Its continuous operation also reduces the number of starts and stops of the unit, which reduces the probability of failure and improves the operational stability of the system.
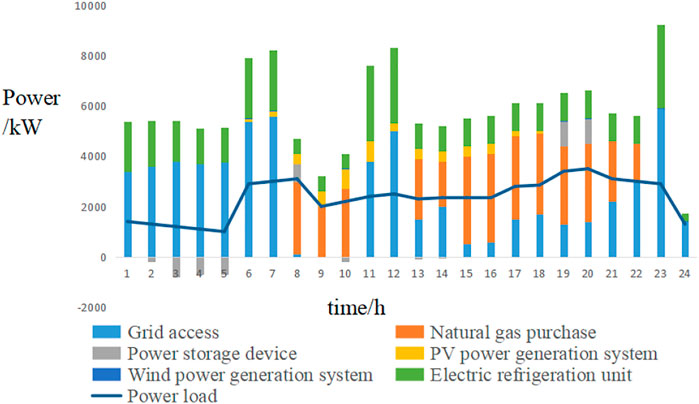
FIGURE 11. Electric load supply.
6 Conclusion
This paper constructs an IES with combined cooling, heating and power supply, taking into full consideration the consumption of renewable energy. A two-layer optimization model of capacity allocation optimization-operation strategy optimization is designed. Through the comparison in Section 5, we can find that compared with the traditional system, the total annual cost has decreased by 17.96%, the power purchase cost of IES has decreased by 39.17%, the gas purchase cost has decreased by 27.68%, and the new energy consumption has increased by 2350 MWh. This shows IES can reduce the impact of the volatility and randomness of renewable energy output on the power system, improve the peak regulation capacity of the system, reduce the reliance on fossil energy and promote the reduction of carbon emissions. At the same time, through the optimal configuration of core equipment capacity, it can reduce system construction and maintenance costs and optimize the working characteristics of various types of equipment. The IES can meet the scenario that multiple load demands such as power supply, heating and cooling are integrated with each other, which is of great significance to the energy reform and the achievement of the dual carbon policy.
Data availability statement
The original contributions presented in the study are included in the article/supplementary material, further inquiries can be directed to the corresponding author.
Author contributions
YX: conceptualization and methodology. CZ: writing-original draft. FJ: supervision and writing-review and editing. WD: resources. HZ: validation. CY: data curation.
Conflict of interest
Authors YX, WD, HZ and CY were employed by Wuwei Power Supply Company.
The remaining authors declare that the research was conducted in the absence of any commercial or financial relationships that could be construed as a potential conflict of interest.
Publisher’s note
All claims expressed in this article are solely those of the authors and do not necessarily represent those of their affiliated organizations, or those of the publisher, the editors and the reviewers. Any product that may be evaluated in this article, or claim that may be made by its manufacturer, is not guaranteed or endorsed by the publisher.
References
Carpaneto, E., Lazzeroni, P., and Repetto, M. (2015). Optimal integration of solar energy in a district heating network. Renew. energy 75, 714–721. doi:10.1016/j.renene.2014.10.055
Cobos, N. G., Arroyo, J. M., Alguacil, N., and Wang, J. (2018). Robust energy and reserve scheduling considering bulk energy storage units and wind uncertainty. IEEE Trans. Power Syst. 33 (5), 5206–5216. doi:10.1109/tpwrs.2018.2792140
Fan, M., Li, Z., Ding, T., Huang, L., Dong, F., Ren, Z., et al. (2021). Uncertainty evaluation algorithm in power system dynamic analysis with correlated renewable energy sources. IEEE Trans. Power Syst. 36 (6), 5602–5611. doi:10.1109/tpwrs.2021.3075181
Guo, L., Liu, W., Cai, J., Hong, B., and Wang, C. (2013). A two-stage optimal planning and design method for combined cooling, heat and power microgrid system. Energy Convers. Manag. 74, 433–445. doi:10.1016/j.enconman.2013.06.051
Guo, Z., Pinson, P., Chen, S., Yang, Q., and Yang, Z. (2021). Chance-constrained peer-to-peer joint energy and reserve market considering renewable generation uncertainty. IEEE Trans. Smart Grid 12 (1), 798–809. doi:10.1109/tsg.2020.3019603
Huang, H., Liang, D., and Tong, Z. (2018). Integrated energy micro-grid planning using electricity, heating and cooling Demands. Energies 11, 2810. doi:10.3390/en11102810
Kalkhambkar, V., Kumar, R., and Bhakar, R. (2016). Joint optimal allocation methodology for renewable distributed generation and energy storage for economic benefits. IET Renew. Power Gener. 10, 1422–1429. doi:10.1049/iet-rpg.2016.0014
Kefayat, M., Ara, A. L., and Niaki, S. A. N. (2015). A hybrid of ant colony optimization and artificial bee colony algorithm for probabilistic optimal placement and sizing of distributed energy resources. Energy Convers. Manag. 92, 149–161. doi:10.1016/j.enconman.2014.12.037
Li, Y., Wang, C., Li, G., and Chen, C. (2021). Optimal scheduling of integrated demand response-enabled integrated energy systems with uncertain renewable generations: A Stackelberg game approach. Energy Convers. Manag. 235, 113996. doi:10.1016/j.enconman.2021.113996
Li, Z., Wu, W., Shahidehpour, M., Wang, J., and Zhang, B. (2016). Combined heat and power dispatch considering pipeline energy storage of district heating network. IEEE Trans. Sustain. Energy 7 (1), 12–22. doi:10.1109/tste.2015.2467383
Liu, J., Wang, A., Song, C., Tao, R., and Wang, X. (2020). Cooperative operation for integrated multi-energy system considering transmission losses. IEEE Access 8, 96934–96945. doi:10.1109/access.2020.2996913
Okur, Ö., Voulis, N., Heijnen, P., and Lukszo, Z. (2019). Aggregator-mediated demand response: Minimizing imbalances caused by uncertainty of solar generation. Appl. Energy 247, 426–437. doi:10.1016/j.apenergy.2019.04.035
Phillip, O. K., and Matteo, S. (2012). Optimal control of a residential microgrid. Energy 42 (1), 321–330. doi:10.1016/j.energy.2012.03.049
Valencia, F., Collado, J., Saez, D., and Marin, L. G. (2016). Robust energy management system for a microgrid based on a fuzzy prediction interval model. IEEE Trans. Smart Grid 7 (3), 1486–1494. doi:10.1109/tsg.2015.2463079
van Ackooij, W., Finardi, E. C., and Ramalho, G. M. (2018). An exact solution method for the hydrothermal unit commitment under wind power uncertainty with joint probability constraints. IEEE Trans. Power Syst. 33 (6), 6487–6500, Nov. doi:10.1109/tpwrs.2018.2848594
Wang, H., Yin, W., Abdollahi, E., Lahdelma, R., and Jiao, W. (2015). Modelling and optimization of CHP based district heating system with renewable energy production and energy storage. Appl. Energy 159, 401–421. doi:10.1016/j.apenergy.2015.09.020
Wang, W., Huang, S., Zhang, G., Liu, J., and Chen, Z. (2021). Optimal operation of an integrated electricity-heat energy system considering flexible resources dispatch for renewable integration. J. Mod. Power Syst. Clean Energy 9 (4), 699–710. doi:10.35833/mpce.2020.000917
Wang, Z., Jia, Y., Cai, C., Chen, Y., Li, N., Yang, M., et al. (2021). Study on the optimal configuration of a wind-solar-battery-fuel cell system based on a regional power supply. IEEE Access 9, 47056–47068. doi:10.1109/access.2021.3064888
Wei, C., Xu, J., Chen, Q., Song, C., and Qiao, W. (2022). Full-order sliding-mode current control of permanent magnet synchronous generator with disturbance rejection. IEEE J. Emerg. Sel. Top. Ind. Electron., 1–8. doi:10.1109/jestie.2022.3192735
Wei, C., Zhao, Y., Zheng, Y., Xie, L., and Smedley, K. (2022). Analysis and design of a non-isolated high step-down converter with coupled inductor and ZVS operation. IEEE Trans. Ind. Electron. 69, 9007–9018. doi:10.1109/TIE.2021.3114721
Xiao, D., Chen, H., Wei, C., and Bai, X. (2021). Statistical measure for risk-seeking stochastic wind power offering strategies in electricity markets. J. Mod. Power Syst. Clean Energy, 1–6. doi:10.35833/MPCE.2021.000218
Xu, C. B., Ke, Y. M., Li, Y. B., Chu, H., and Wu, Y. N. (2020). Data-driven configuration optimization of an off-grid wind/PV/hydrogen system based on modified NSGA-II and CRITIC-TOPSIS. Energy Convers. Manag. 215, 112892. doi:10.1016/j.enconman.2020.112892
Zhai, J., Wu, X., Zhu, S., Yang, B., and Liu, H. (2020). Optimization of integrated energy system considering photovoltaic uncertainty and multi-energy network. IEEE Access 8, 141558–141568. doi:10.1109/access.2020.3013396
Zhang, D. B., Liu, J. W., Jiao, S. F., Tian, H., Lou, C. Z., Zhou, Z. H., et al. (2019). Research on the configuration and operation effect of the hybrid solar-wind-battery power generation system based on NSGA-II. Energy 189, 116121. doi:10.1016/j.energy.2019.116121
Keywords: capacity allocation, double-layer optimization, integrated energy system, renewable energy consumption, uncertainty
Citation: Xue Y, Zhang C, Jiang F, Dou W, Zhang H and Yang C (2022) Optimal capacity allocation method of integrated energy system considering renewable energy uncertainty. Front. Energy Res. 10:1016756. doi: 10.3389/fenrg.2022.1016756
Received: 11 August 2022; Accepted: 07 September 2022;
Published: 28 September 2022.
Edited by:
Dongliang Xiao, South China University of Technology, ChinaReviewed by:
Bo Liu, Kansas State University, United StatesQi Wang, Harbin Institute of Technology, China
Copyright © 2022 Xue, Zhang, Jiang, Dou, Zhang and Yang. This is an open-access article distributed under the terms of the Creative Commons Attribution License (CC BY). The use, distribution or reproduction in other forums is permitted, provided the original author(s) and the copyright owner(s) are credited and that the original publication in this journal is cited, in accordance with accepted academic practice. No use, distribution or reproduction is permitted which does not comply with these terms.
*Correspondence: Fan Jiang, MjExMjAwMzA5OUB6anV0LmVkdS5jbg==